pedestrian level of service and trip generation · 2018-06-12 · pedestrian level of service and...
TRANSCRIPT
PEDESTRIAN LEVEL OF SERVICE AND TRIP GENERATION
International Best Practice and Its Applicability to Melbourne
City of Melbourne, Australia
Strategic Planning, Transport
Author: Mia Pantzar, University of Melbourne
Intern, spring 2012

Mia Pantzar |Page 1
ABSTRACT
In the light of urban growth, Melbourne needs to address the rising numbers of pedestrians in the central city. Walking is the main mode of transport (86%, figure 12, p. 10) and tram stops, pedestrian crossings and sidewalks get increasingly crowded at peak hours. The principal aim of the new pedestrian strategy, conducted by City of Melbourne’s strategic transport planners, is to get people to walk more by providing a suitable urban environment to walk in – a street network capable of facilitating current as well as future levels of pedestrians.
This research looks at pedestrian crowding, and how it is measured and analysed in cities around the world. It reviews two specific tools, pedestrian level of service (LOS) and pedestrian trip generation. It studies London, New York and Copenhagen in more detail, and the work and experience of Gehl Architects in Copenhagen. It commences a discussion of how these methodologies are relevant to Melbourne and whether they are applicable and/or can form inspiration in the development of Melbourne’s pedestrian analysis.
The study has found that although many cities work to improve pedestrian conditions, there is no generally adopted methodology or standard for pedestrian LOS or trip generation. Pedestrian trip generation calculations are novel and relatively unexplored. The most elaborate methodology found is City of London’s use of the TRAVL software and First Principles’ assumptions of different land uses, see section 4.1. Setting up a similar system in Melbourne would require definitions of land uses, empirical assessment from sites in each land use, and calculation software.
A majority of cities analysing pedestrian LOS use the Fruin scale from the 1970s (section 5). This method analyses quantitatively the number of people walking in a street, but ignores several important factors relating to walkability. Gehl Architects has led the way in elaborating a different and more comprehensive methodology, based on over 30 years experience. They have identified a general street crowding capacity of 13 people per meter per minute, a figure applied by London in their Pedestrian Comfort Level (PCL) assessments. The London framework combines Fruin’s crowding scale with Gehl’s experiences and sets up a comprehensive implementation guide based on area types, street features and pedestrian counts. PCL is calculated for both sidewalks and pedestrian crossings. Melbourne could implement this framework directly, if more and better counting sensors are installed, data collected from the relevant sites and area types analysed in terms of crowding acceptance. Once a Melbourne methodology is implemented, Fort Collins in Colorado, US offer interesting ways for further elaboration and level of detail.
Mia Pantzar |Page 2
TABLE OF CONTENTS
1 INTRODUCTION 3 1.1 Aims and Objectives 5
1.2 Research Issues 5
1.3 Theory and Methods of Data Collection and Analysis 5
2 MELBOURNE CONDITIONS 6
2.1 Predicted Population Growth 6 2.2 Existing Data of Pedestrians 8
2.3 What are the Pedestrian Issues in Melbourne? 11
3 COMPARISONS 13 3.1 New York City, US 15 3.2 London, UK 16
3.3 Copenhagen, DK 17
4 PEDESTRIAN TRIP GENERATION 18 4.1 City of London Methodology 18 4.2 Centre for Advanced Spatial Analysis (CASA), University College London 19
5 PEDESTRIAN LEVEL OF SERVICE 22 5.1 Gehl Architects’ Methodology 23 5.2 Pedestrian Comfort Guidance for London 25
5.3 Pedestrian Environment Review System (PERS), London 30
5.4 New York City and the US 30
5.4.1 The National Cooperative Highway Research Project (NCHRP) 31 5.4.2 Fort Collins, Colorado, US 32 5.5 Other Concepts Including Other Australian Capital Cities 34 5.6 A Sample of Academic Studies on Pedestrian LOS 35
6 HIGHLIGHTS AND RECOMMENDATIONS 36
7 BIBLIOGRAPHY 38

Mia Pantzar |Page 3
1 INTRODUCTION
‘No one goes there anymore – it’s too crowded’
Yogi Berra
86% of trips within the central city of Melbourne were made on foot in 2009 (Laing A., 2012). The pedestrian pressure on the central city is increasing as the number of people visiting the central city for work, recreation, education or other purposes grows. A 64% increase in walking trips is predicted by 2030. Maintaining an enjoyable yet vibrant city has become a planning issue. The City of Melbourne is trying to tackle these challenges by introducing a pedestrian strategy in the 2012 transport strategy. The principal aim of the pedestrian strategy is to get people to walk more rather than using other modes of transport, and provide a suitable urban environment for walking. Walking is the transport mode that is:
the healthiest
uses least energy
most space efficient
inflicts minimum negative externalities on others
Large cities around the world anticipate similar patterns of increased urbanisation and pedestrian density as Melbourne. Some are planning for it; others have done so for decades, but many are still too deeply directed by car traffic to focus on pedestrians (figure one). This research looks at some of these cities’ efforts to accommodate rising numbers of pedestrians. It analyses best practices for policies and implementation, and explores what might be applicable in Melbourne. The focus of study is on pedestrian trip generation and pedestrian level of service (LOS) analysis (figure two). Table one maps different aspects of urban walkability key unit partnerships in formulating the Melbourne pedestrian strategy.
Figure 1 From traffic inferno to pedestrian utopia - where is Melbourne?
Copenhagen Car-free streets Gehl Architects’ methodology Public mindset in place
London Trip Generation CASA model Comfort Guidance PERS - High crowding levels
Melbourne?
New York City NCHRP CEQR - Car focus - Locked-in infrastructure - High crowding levels
Hong Kong Car-free streets Elevated walkways - Contradictory policies - Pedestrians marginalised

Mia Pantzar |Page 4
Table 1 Walkability, ways to manage it, and who to collaborate with
Factors affecting walkability
Key unit partnerships
Shade Urban design / Urban Landscapes
Interesting shops Urban Design (?)
Quality of surface Engineering Services
Crossing distance VicRoads / Engineering Services / Urban Design / Capital Works
Delay VicRoads / Engineering Services
Crowding ?
Lights Engineering Services
Seats Engineering Services / Urban Design / Capital Works
Figure 2 Pedestrian Strategy Project Plan - consultant research
The Walking Economy
Overall pedestrian
model for the City of Melbourne
Pedestrian Generation Rates • Development of a method
• Generators: Building, attractions, stations, stops
• Data from CLUE, CUBE
Network Accessibility Modelling • Visibility, street connectedness
Level of Service (Crowding) Analysis
• Development of a method
• Development of standards/guidelines for CoM
• The Economic case for walking
• EJD/SNAMUTS map for walking

Mia Pantzar |Page 5
1.1 Aims and Objectives
City of Melbourne aims to avoid a loss of quality of the pedestrian environment in the central city as more and more people walk in the city. City of Melbourne wants to keep the streets pleasant and functional places for everyone. This study reviews best practices of pedestrian trip generation and level of service analysis from cities around the world. The scope also includes ideas and innovations not yet implemented but of potential interest for City of Melbourne. The results will help formulate the 2012 Melbourne pedestrian strategy.
1.2 Research Issues
What tools are used elsewhere to measure and analyse the pedestrian environment, particularly regarding LOS analysis and pedestrian trip generation assessments?
What ideas can City of Melbourne embrace from other cities?
1.3 Theory and Methods of Data Collection and Analysis
This study is based on data and documents from City of Melbourne strategic planning unit and other relevant departments within the City of Melbourne, especially for comparisons and analyses of opportunities for Melbourne. Its main body is a literature review from web-based sources, but also exchanges with professionals in Melbourne, London and Copenhagen. Other documents reviewed are national and regional transport-, and pedestrian plans from around the world and academic research published on the subject.

Mia Pantzar |Page 6
2 MELBOURNE CONDITIONS
2.1 Predicted Population Growth
The City of Melbourne has an area of 37.7 km2 and a residential population of 96,000. It is the economic and cultural heart of metropolitan Melbourne. Each workday about 787,000 people travel into the municipality to work, study and visit. Most come into the central city, an intensive activity area of 15 km2. Melbourne is experiencing a growth surge that is predicted to see an 25% increase of jobs by 2030. The number of people coming into the city each weekday is expected to grow from 787,000 in 2011 to over 1.2 million by 2030 (figure three). This means an increase of 64% of the absolute number of walking trips. An increase in public transport patronage is also contributing to the rising numbers of pedestrians (figure four).
Figure 4 Department of Transport total metropolitan public transport patronage (Transport Strategy, 2012)
Figure 3 Predicted change in mode share to Melbourne Municipality (Transport Strategy, 2012) (Weekday 2010 population & 2030 forecast, Central City User Survey, daily population estimates and forecasts model, 2011, City of Melbourne City research branch. 2030 amount of trips is based on current level of trips per person per day)
Mia Pantzar |Page 7
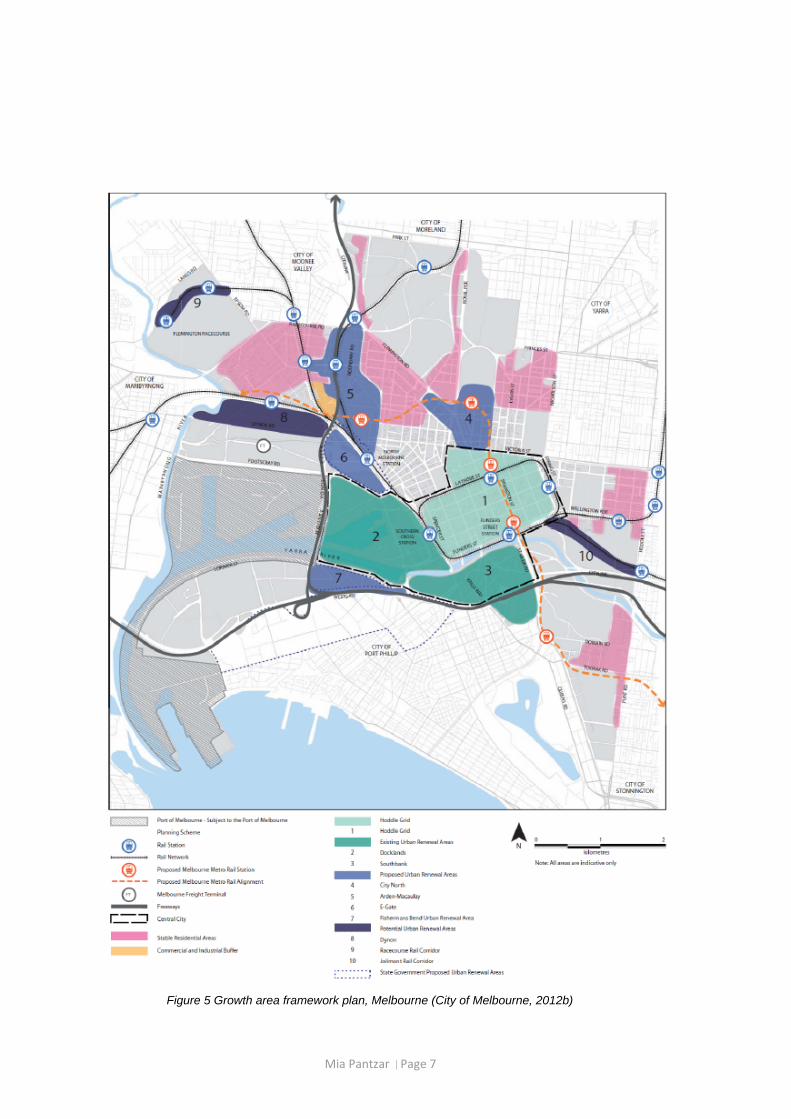
Figure 5 Growth area framework plan, Melbourne (City of Melbourne, 2012b)
Mia Pantzar |Page 8
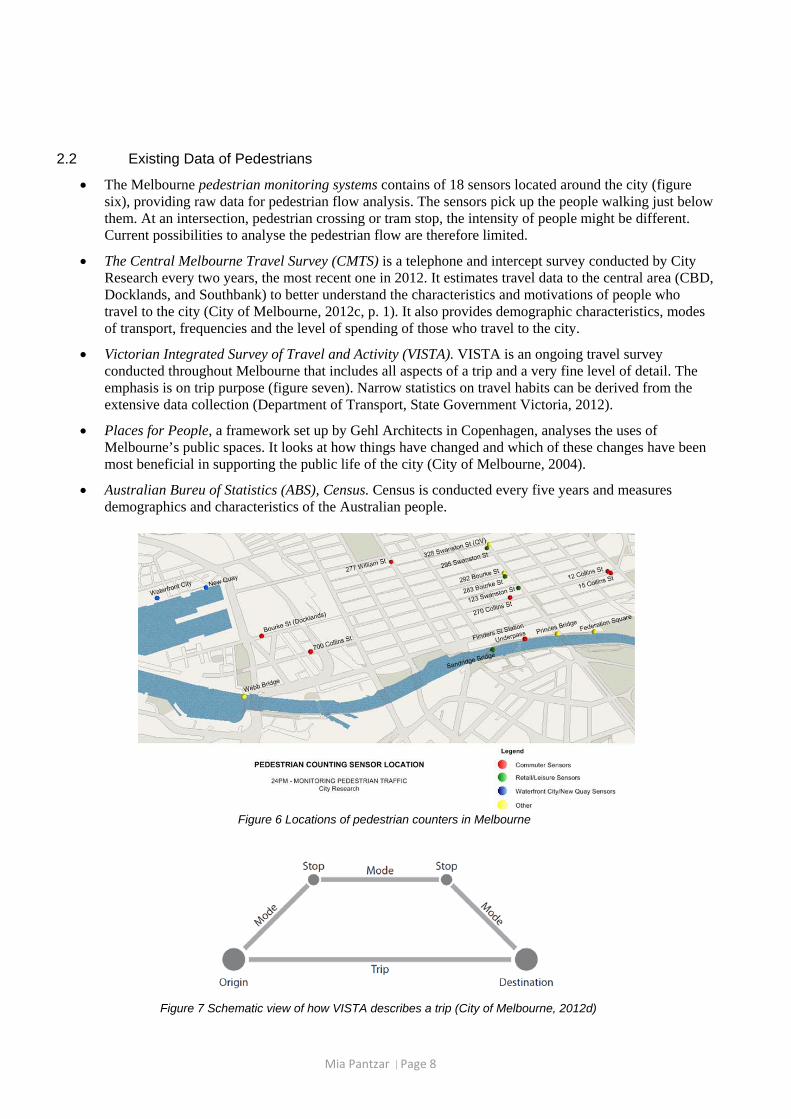
2.2 Existing Data of Pedestrians
The Melbourne pedestrian monitoring systems contains of 18 sensors located around the city (figure six), providing raw data for pedestrian flow analysis. The sensors pick up the people walking just below them. At an intersection, pedestrian crossing or tram stop, the intensity of people might be different. Current possibilities to analyse the pedestrian flow are therefore limited.
The Central Melbourne Travel Survey (CMTS) is a telephone and intercept survey conducted by City Research every two years, the most recent one in 2012. It estimates travel data to the central area (CBD, Docklands, and Southbank) to better understand the characteristics and motivations of people who travel to the city (City of Melbourne, 2012c, p. 1). It also provides demographic characteristics, modes of transport, frequencies and the level of spending of those who travel to the city.
Victorian Integrated Survey of Travel and Activity (VISTA). VISTA is an ongoing travel survey conducted throughout Melbourne that includes all aspects of a trip and a very fine level of detail. The emphasis is on trip purpose (figure seven). Narrow statistics on travel habits can be derived from the extensive data collection (Department of Transport, State Government Victoria, 2012).
Places for People, a framework set up by Gehl Architects in Copenhagen, analyses the uses of Melbourne’s public spaces. It looks at how things have changed and which of these changes have been most beneficial in supporting the public life of the city (City of Melbourne, 2004).
Australian Bureu of Statistics (ABS), Census. Census is conducted every five years and measures demographics and characteristics of the Australian people.
Figure 6 Locations of pedestrian counters in Melbourne
Figure 7 Schematic view of how VISTA describes a trip (City of Melbourne, 2012d)
Mia Pantzar |Page 9
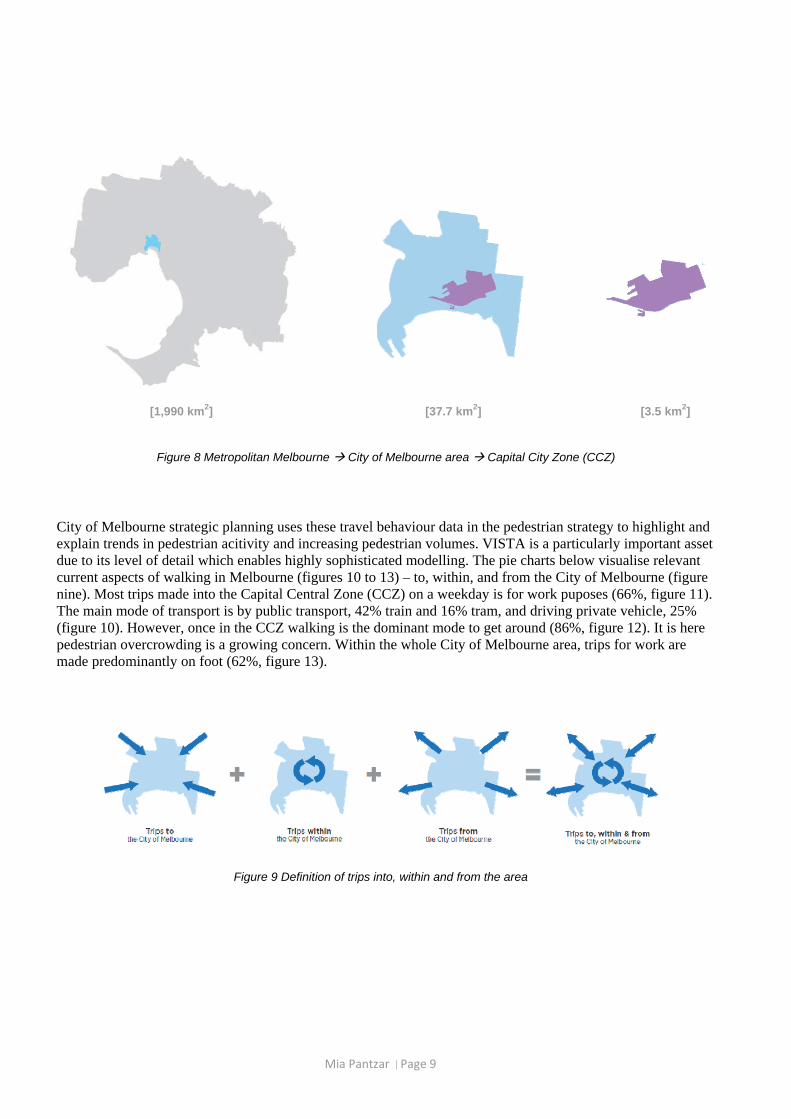
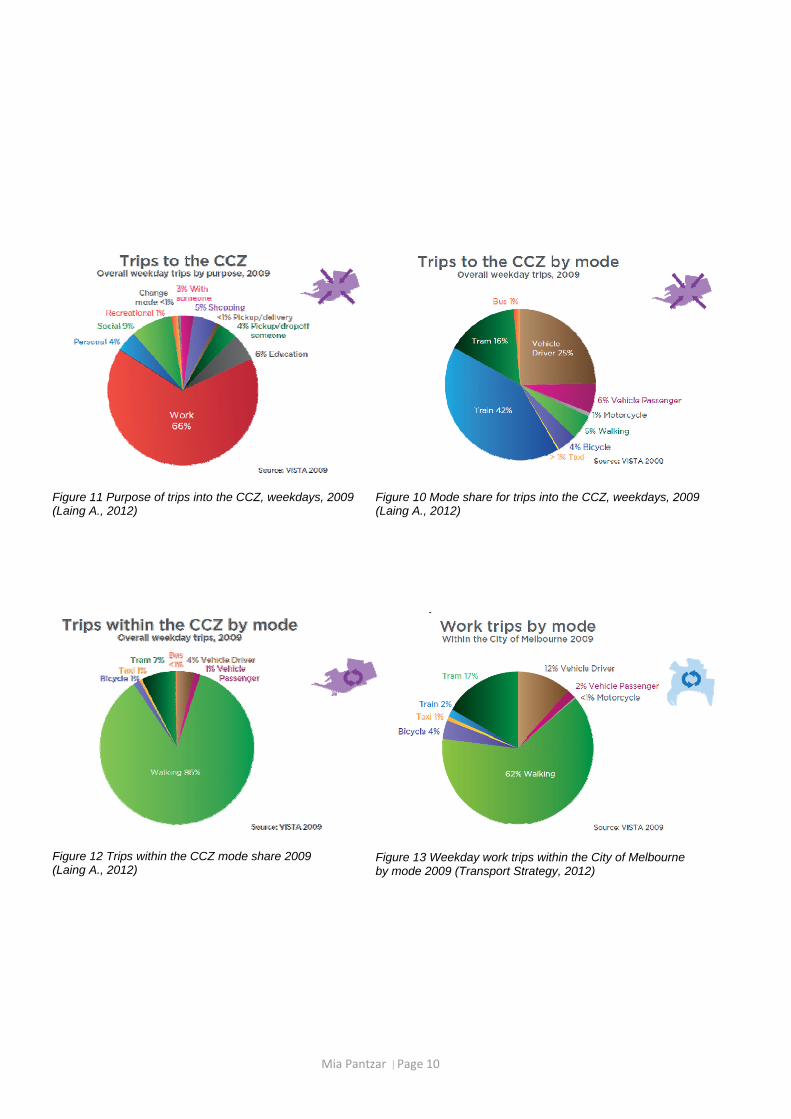
City of Melbourne strategic planning uses these travel behaviour data in the pedestrian strategy to highlight and explain trends in pedestrian acitivity and increasing pedestrian volumes. VISTA is a particularly important asset due to its level of detail which enables highly sophisticated modelling. The pie charts below visualise relevant current aspects of walking in Melbourne (figures 10 to 13) – to, within, and from the City of Melbourne (figure nine). Most trips made into the Capital Central Zone (CCZ) on a weekday is for work puposes (66%, figure 11). The main mode of transport is by public transport, 42% train and 16% tram, and driving private vehicle, 25% (figure 10). However, once in the CCZ walking is the dominant mode to get around (86%, figure 12). It is here pedestrian overcrowding is a growing concern. Within the whole City of Melbourne area, trips for work are made predominantly on foot (62%, figure 13).
Figure 8 Metropolitan Melbourne City of Melbourne area Capital City Zone (CCZ)
Figure 9 Definition of trips into, within and from the area
[37.7 km2] [3.5 km2] [1,990 km2]
Mia Pantzar |Page 10
Figure 13 Weekday work trips within the City of Melbourne by mode 2009 (Transport Strategy, 2012)
Figure 12 Trips within the CCZ mode share 2009 (Laing A., 2012)
Figure 11 Purpose of trips into the CCZ, weekdays, 2009 (Laing A., 2012)
Figure 10 Mode share for trips into the CCZ, weekdays, 2009 (Laing A., 2012)

Mia Pantzar |Page 11
‘The problem is defining “too crowded”’
You Like Walking in the City? So Do Plenty of Others,
Sam Roberts (2011)
2.3 What are the Pedestrian Issues in Melbourne?
Increased pedestrian activity in the central city puts pressure on the street network. This generates crowding, especially at stations and tram stops and in peak hours. The next page lists a number of issues with overcrowded sidewalks, partly cited from Gehl Architechts’ assessments. Many perceive crowding as uncomfortable and stressful. It slows down movement and causes:
delays
increased stress
annoyance
Lively streets benefit the attractiveness of a city and is a policy goal in itself, to a certain point. Overcrowded main streets and public transport nodes is negative for tourism and general wellbeing of the city centre and its people. Meanwhile, in some Melbourne areas, such as the Docklands, streets are not used at their full potential and walking needs to be encouraged. In September, City Design published the Docklands Public Realm Plan (2012). This is a major strategy featuring guidelines relating to improving streets in order to encourage more pedestrians (figure 14, City of Melbourne, 2012e).
Figure 14 Design checklist of documents relating to how to improve the Docklands (City of Melbourne, 2012e)

Mia Pantzar |Page 12
COMMERCE people are discouraged to walk in the streets
creates difficulty stopping/looking at window displays
SAFETY fast walking pedestrians move out onto the road and tram tracks
people will accidentally be pushed into the road from tram stops or sidewalks
THOSE WITH SPECIAL NEEDS those in wheelchairs, parents with strollers, people with disabilities, children and the elderly
generally need more space for walking than that available on a crowded footpath. These groups can be deterred from walking under such conditions
these individuals might also require longer time to get around which makes them exposed in a crowded situation
SUSTAINABILITY
people are discourage to walk and use public transport because it is unpleasant to do so
Problems with Overcrowded Sidewalks (Partly from NYCDOT, 2008, p. 21)
Figure 18 Pedestrians, Swanston Street, Melbourne Figure 17 Tram stop, Spencer Street, Melbourne
Figure 15 Pedestrian crossing at Southern Cross Station, Melbourne
Figure 16 Pedestrian crossing, Spencer Street by Southern Cross Station, Melbourne

Mia Pantzar |Page 13
3 COMPARISONS
‘The Municipality of Melbourne will be one of the world's great walking cities where residents, workers and tourists have easy access to the many activities available within the municipality.’
Walking City, Future Melbourne (2009)
‘London is committed to becoming one of the most walkable cities in the world by 2015.’
Measuring Pedestrian Activity, Transport for London (2007)
’This plan lays out a vision for New York City of improved mobility, safer streets and reduced impact on global climate, all resulting in a world class quality of life.’
Sustainable Streets, New York City Department of Transport (2008)
‘Copenhagen has a vision. We want to become the world’s most liveable city: a sustainable city with urban space which invites people to a unique and varied urban life. We want to become a metropolis for people. We want to plan the city so that people choose to walk and so contribute to a living city with a good urban environment. At the same time, people’s health will improve if more people move around actively in their daily life.’
More People to Walk More, the Pedestrian Strategy of Copenhagen, City of Copenhagen (2010)
‘Pedestrians are the City's top priority. Making all streets more accessible, safe and enjoyable for walking is an important part of our effort to become the Greenest City in the world by 2020.’
How We Walk the Talk to Support Pedestrians, City of Vancouver (2012)
Some of the cities above resemble Melbourne in terms of growth patterns and aspiration goals, and their current management of pedestrian levels might be interesting for Melbourne. Many cities known as good walking cities does not have explicit pedestrian strategies. Amsterdam, Holland, for example is mentioned in many reports and assessments from other cities, although they do not have a specific pedestrian plan (iamsterdam, 2012). In Stockholm, Sweden, a pedestrian plan is set up, although they do not describe pedestrian flows or crowding situations, neither does any other city in Sweden (Kajmats, 2012).
Mia Pantzar |Page 14
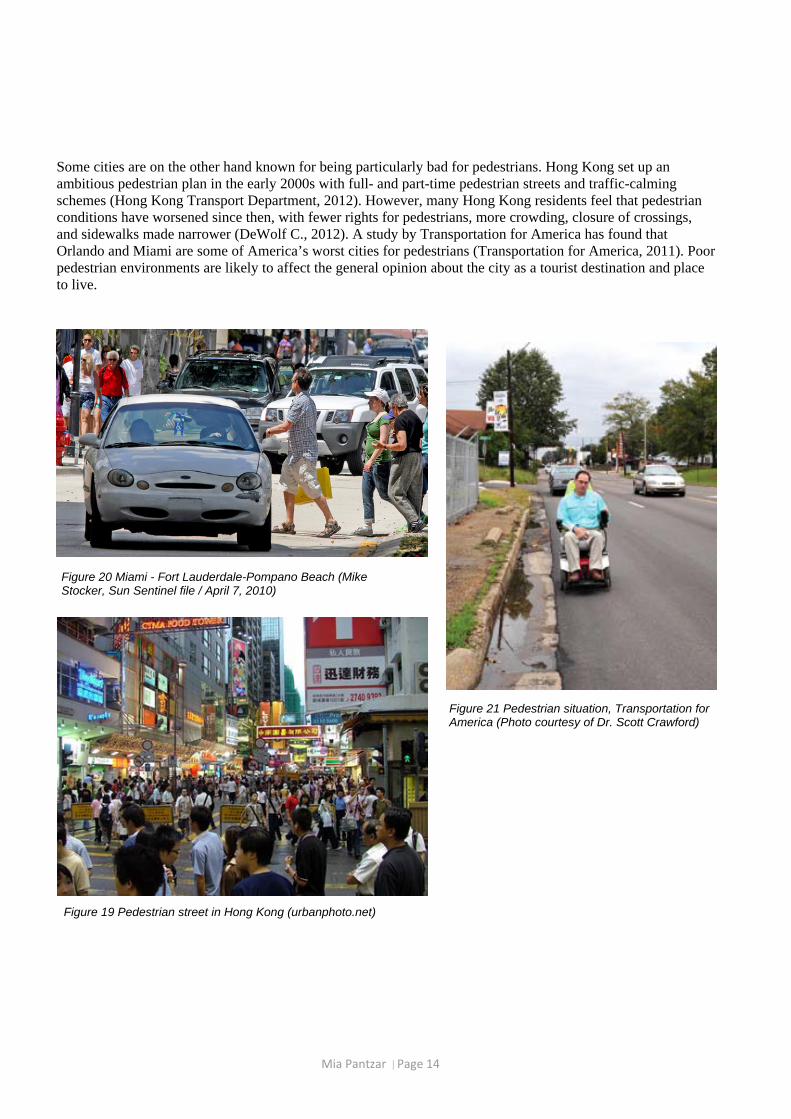
Some cities are on the other hand known for being particularly bad for pedestrians. Hong Kong set up an ambitious pedestrian plan in the early 2000s with full- and part-time pedestrian streets and traffic-calming schemes (Hong Kong Transport Department, 2012). However, many Hong Kong residents feel that pedestrian conditions have worsened since then, with fewer rights for pedestrians, more crowding, closure of crossings, and sidewalks made narrower (DeWolf C., 2012). A study by Transportation for America has found that Orlando and Miami are some of America’s worst cities for pedestrians (Transportation for America, 2011). Poor pedestrian environments are likely to affect the general opinion about the city as a tourist destination and place to live.
Figure 20 Miami - Fort Lauderdale-Pompano Beach (Mike Stocker, Sun Sentinel file / April 7, 2010)
Figure 21 Pedestrian situation, Transportation for America (Photo courtesy of Dr. Scott Crawford)
Figure 19 Pedestrian street in Hong Kong (urbanphoto.net)
Mia Pantzar |Page 15
3.1 New York, US
In 2008, the New York City Department of Transport (NYCDOT) released New York City’s first-ever strategic transportation plan – Sustainable Streets. The same year, NYCDOT and Gehl Architects produced an analysis of New York City and its potential for pedestrians and bikes – World Class Streets (NYCDOT, 2008). The ambition from the City of New York was clear:
‘New York has the most famous streets in the world. Now, we’re working to make them the most attractive streets in the world for walking and cycling — and that other great New York sport, people-watching.’
Michael R. Bloomberg, Mayor NYCDOT (2008)
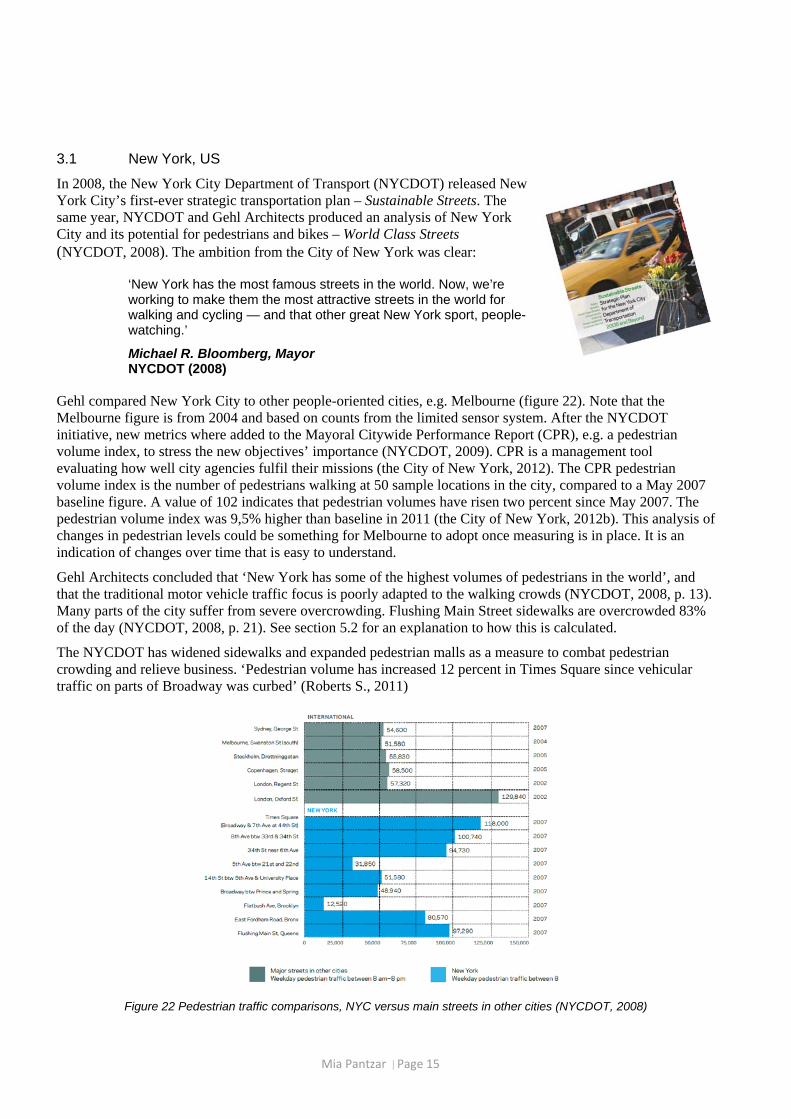
Gehl compared New York City to other people-oriented cities, e.g. Melbourne (figure 22). Note that the Melbourne figure is from 2004 and based on counts from the limited sensor system. After the NYCDOT initiative, new metrics where added to the Mayoral Citywide Performance Report (CPR), e.g. a pedestrian volume index, to stress the new objectives’ importance (NYCDOT, 2009). CPR is a management tool evaluating how well city agencies fulfil their missions (the City of New York, 2012). The CPR pedestrian volume index is the number of pedestrians walking at 50 sample locations in the city, compared to a May 2007 baseline figure. A value of 102 indicates that pedestrian volumes have risen two percent since May 2007. The pedestrian volume index was 9,5% higher than baseline in 2011 (the City of New York, 2012b). This analysis of changes in pedestrian levels could be something for Melbourne to adopt once measuring is in place. It is an indication of changes over time that is easy to understand.
Gehl Architects concluded that ‘New York has some of the highest volumes of pedestrians in the world’, and that the traditional motor vehicle traffic focus is poorly adapted to the walking crowds (NYCDOT, 2008, p. 13). Many parts of the city suffer from severe overcrowding. Flushing Main Street sidewalks are overcrowded 83% of the day (NYCDOT, 2008, p. 21). See section 5.2 for an explanation to how this is calculated.
The NYCDOT has widened sidewalks and expanded pedestrian malls as a measure to combat pedestrian crowding and relieve business. ‘Pedestrian volume has increased 12 percent in Times Square since vehicular traffic on parts of Broadway was curbed’ (Roberts S., 2011)
Figure 22 Pedestrian traffic comparisons, NYC versus main streets in other cities (NYCDOT, 2008)
Mia Pantzar |Page 16
3.2 London, UK
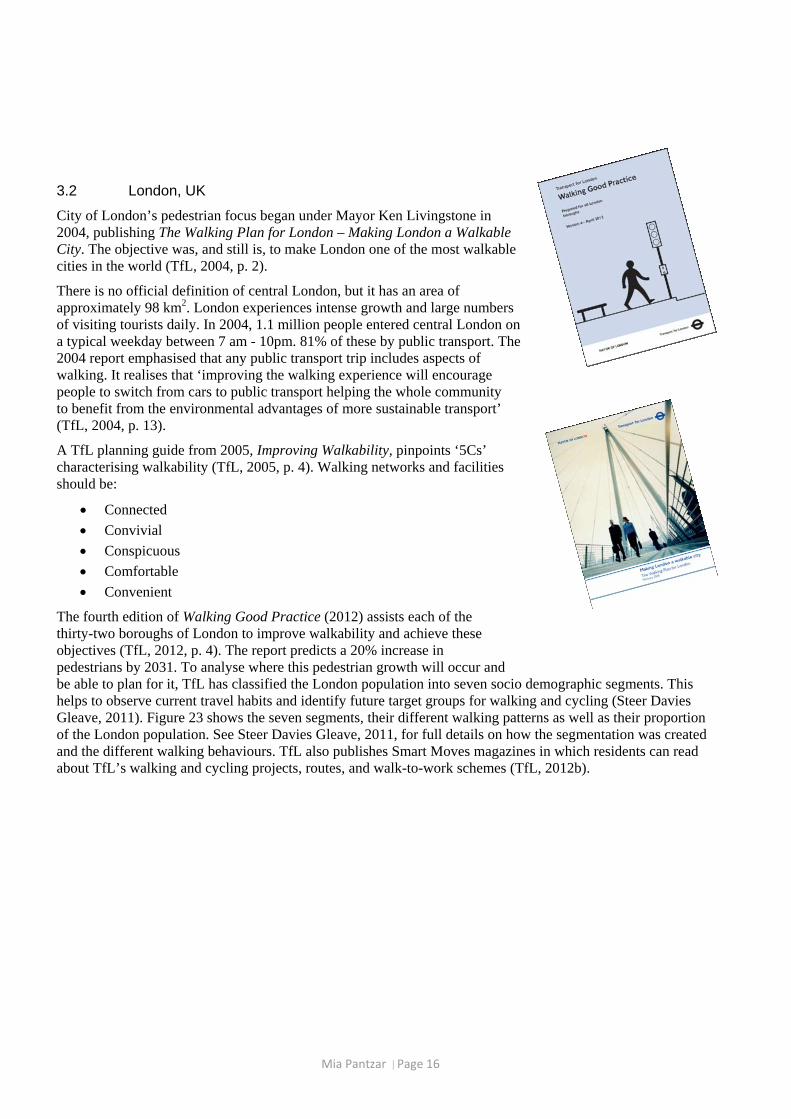
City of London’s pedestrian focus began under Mayor Ken Livingstone in 2004, publishing The Walking Plan for London – Making London a Walkable City. The objective was, and still is, to make London one of the most walkable cities in the world (TfL, 2004, p. 2).
There is no official definition of central London, but it has an area of approximately 98 km2. London experiences intense growth and large numbers of visiting tourists daily. In 2004, 1.1 million people entered central London on a typical weekday between 7 am - 10pm. 81% of these by public transport. The 2004 report emphasised that any public transport trip includes aspects of walking. It realises that ‘improving the walking experience will encourage people to switch from cars to public transport helping the whole community to benefit from the environmental advantages of more sustainable transport’ (TfL, 2004, p. 13).
A TfL planning guide from 2005, Improving Walkability, pinpoints ‘5Cs’ characterising walkability (TfL, 2005, p. 4). Walking networks and facilities should be:
Connected
Convivial
Conspicuous
Comfortable
Convenient
The fourth edition of Walking Good Practice (2012) assists each of the thirty-two boroughs of London to improve walkability and achieve these objectives (TfL, 2012, p. 4). The report predicts a 20% increase in pedestrians by 2031. To analyse where this pedestrian growth will occur and be able to plan for it, TfL has classified the London population into seven socio demographic segments. This helps to observe current travel habits and identify future target groups for walking and cycling (Steer Davies Gleave, 2011). Figure 23 shows the seven segments, their different walking patterns as well as their proportion of the London population. See Steer Davies Gleave, 2011, for full details on how the segmentation was created and the different walking behaviours. TfL also publishes Smart Moves magazines in which residents can read about TfL’s walking and cycling projects, routes, and walk-to-work schemes (TfL, 2012b).

Mia Pantzar |Page 17
3.3 Copenhagen, DK
The Danish capital is internationally known for its walking-friendly environment. The pedestrianisation began in 1962, when the planning focus changed towards making more and more central city streets car-free. By 1995, 80% of the traffic in the central city was pedestrian (Engineering Timelines, 2012). The level of car traffic into and out of the city has remained constant since 1970, despite urban growth. Since 2010 City of
Figure 23 Perceptual map of socio demographic segments in London (Steer Davies Gleave, 2011, p. 9)

Mia Pantzar |Page 18
Copenhagen wants to make Copenhagen an even better city for pedestrians and the goal is to increase with 20% more pedestrians by 2015 (Municipality of Copenhagen, 2011, p. 3). Copenhagen uses Gehl Architects’ methodology for assessing pedestrians (see section 5.2).

Mia Pantzar |Page 19
4 PEDESTRIAN TRIP GENERATION Pedestrian trip generation rates help analyse and predict the number of pedestrians generated from different land uses. The rates make it possible to forecast changes to the pedestrian flow and the crowding scenario for different changes to the urban network. Transportation planners have used vehicular trip generation since the 1950s, but this study has found that non-motorised trip generation is still uncommon and few models have been designed. Several professionals consulted for this research were unaware of pedestrian trip generation. Others indicated a lack of generally adopted methods.
4.1 City of London Methodology
Richard Lumley, principal transport engineer with the City of London (2012a), describes their work on trip generation (below). The framework is based on an approach known as First Principles, which involves making certain initial assumptions about the land use (Lumley R., 2012a). The majority of developments within London are office, where the following assumptions are used.
Assumptions made for employee trips: 1. Staff density of 16sqm per employee (gross area) 2. Daily occupancy of 85% (takes into account employees who may be away from
the workplace on business, annual leave or sickness) 3. 43% of employees arrive at the office during the AM peak 4. 33% of employees depart from the office during the PM peak
Assumptions made for visitors to the office: 1. A daily visitor trip rate of 2.74 per 100sqm gross external area (equivalent to 1
visitor per 36.50sqm) 2. 2% of visitors arrive at the office during the AM peak period 3. 5% of visitors arrive at the office during the PM peak period with 8% departing
A tool called Trip Rate Assessment Valid for London (TRAVL) calculates the trip generation rates. Each calculation is different depending on the nature of the development (Lumley R., 2012b). TRAVL predicts trip rates and modal split of new developments based on survey information of comparable sites throughout London. It gives an indication as to whether predicted trip rates are realistic, but since TRAVL is based on averages, estimates are only as good as the data put into the software (Lumley R., 2012a). Table three shows the average person trips generated for office development in London, and table two applies these rates to a proposed development (WRBC Services, Limited, 2012, p. 13). This example would generate 1,231 (two-way) person trips during AM peak hour and 1,010 during PM peak hour. See the full reference for further details on this example.
Table 3 Person trip rates / 100m2 GFA (Gross Floor Area) Table 2 Person trips generated in peak hour

Mia Pantzar |Page 20
4.2 Centre for Advanced Spatial Analysis (CASA), University College London
The Centre for Advanced Spatial Analysis at University College London set up a pedestrian demand methodology in 2003. It describes a pedestrian demand model that provides predicted flow values for different city streets. The model has been ‘independently validated by Transport for London and is being tested against further observation data’ (Desyllas J. et al., 2003, p. 1). The authors’ approach was to ‘focus on the development of a flexible and testable pedestrian modelling framework using Multiple Regression Analysis (MRA)’ (Desyllas J. et al., 2003, p. 3). The model tests the following components:
capacity (pavement width etc.)
land use (office, retail etc.)
street grid configuration (visibility, accessibility etc.)
transport accessibility (tube station entry etc.)
Figure 24 shows some of these components. Pavement width analysis is made from average effective footway width in meters per street segment. (“This was sampled from high resolution Ordnance Survey mapping data using an automated GIS algorithm”) (Desyllas J. et al., 2003, p. 7). Red is highest average pavement width and blue is the lowest. The visibility analysis highlights the ‘difference between 'desire lines' or important visual links through the street grid and the more secluded back streets’, and the accessibility by neighbourhoods accessible within ‘two steps away’. (“If a pedestrian walks off from a given point in any direction and allows themselves only one further change of direction, the area reached can be defined in graph terms as the 'neighbourhood' accessible within two 'steps' of the graph”) (Desyllas J. et al., 2003, p. 9).

Mia Pantzar |Page 21
Figure 24 Pavement width analysis, visibility analysis and accessibility analysis, central London (Desyllas J. et al., 2003)

Mia Pantzar |Page 22
Table 4 Pedestrian trip generation systems and research
Name City/ country
System References
Institute of Transportation Engineers (ITE) Trip Generation Informational Report
New York City (USA)
The US national system of trip generation analysis includes multimodal transportation such as pedestrian trips. The system conducts trip generation rates for different transport modes in different settings, and cities can use the data as templates when they lack access or ability to get empirical figures. ‘Care must be exercised’ however to what conditions the rates are based on (Rizavi A., and Yeung A., 2010).
‘One of the greatest challenges facing the bicycle and pedestrian field is the lack of documentation on usage and demand.’ ITE Pedestrian and Bicycle Council sponsors together with Alta Planning and Design the National Bicycle & Pedestrian Documentation Program. This is ‘an effort to provide a consistent model of data collection and ongoing data for use by planners, governments, and bicycle and pedestrian professionals.’
www.ite.org www.altaplanning.com
City Environmental Quality Review (CEQR) – Technical Manual
New York City (USA)
A framework to help planners and agencies to conduct environmental reviews, including options for pedestrian trip generation. The manual gives advice on how to conduct pedestrian trip generation surveys and clarifies that pedestrian trips include both walking trips from A to B and the component of walking between the specific site and other modes of transport (CEQR, 2012, p. 12 and 44). The rates are to be obtained preferably through existing rates, a new empirical survey or, least preferably, from the ITE template rates. If a proposed project results in more than 200 pedestrian trips during peak hours, a further detailed analysis is necessary (CEQR, 2012, p. 17).
The City of New York, 2012c

Mia Pantzar |Page 23
Figure 26 The often used illustration of Fruin's pedestrian LOS scale. One foot = 0.3048 metres (Still Prof. Dr. G. K., 2012)
Figure 25 The Fruin LOS scale from A to F (NYC DCP, 2006)
5 PEDESTRIAN LEVEL OF SERVICE (LOS) Level of Service (LOS) is used to analyse effectiveness in transportation infra-structure. In the 1970s, John J. Fruin applied the vehicular LOS measurement to pedestrian flows and levels of crowding, measured from A (top) to F (bottom) (figure 25 and 26). This research has found that the Fruin scale is by far the most adopted method to assess pedestrian environments globally. However, no international standard has been developed. Some cities have set up their own LOS model adjusted to suit their specific local conditions and planning objectives. This would probably be the best strategy for Melbourne.
It is frequently expressed in the literature that Fruin’s model is too simplified and needs to be better adapted to real pedestrian realms. E.g. Fruin rates an empty street as LOS A, even though pedestrians might not desire a completely empty street. Neither does it account for any barriers such as street furniture, other pedestrians, pedestrians’ age and physical condition etc. The most elaborate alternative methodologies reviewed here are Gehl Architects based in Copenhagen, Transport for London’s Pedestrian Comfort Guidance, and Fort Collins, Colorado, US.

Mia Pantzar |Page 24
5.1 Gehl Architects’ Methodology
‘Gehl Architects/Urban Quality Consultants is an internationally renowned urban planning and design firm, and is credited with helping to turn Copenhagen into one of the most walkable and bikeable cities in the world.’
Sustainable Streets, NYCDOT (2008)
Gehl Architects have assessed walkability in cities all around the world, including Melbourne. Gehl defines crowding as more than 13 people per minute per meter footway width. This is based on long experience. The Architecture School in Copenhagen collected data in public spaces in Copenhagen between 1968 and 1996. They found through this research that the main pedestrian street, Stroget, in Copenhagen reached its capacity at 13 people per meter per minute. Once this level of activity was reached, pedestrians started to move along parallel streets to avoid congestion. From research elsewhere in the world, Gehl has experienced the same threshold for pedestrian comfort (Vamberg H., 2012b).
Recommended pedestrian capacity: 13 person/minute/meter footway width x available footway width = no. of pedestrians/minute
Henritte Vamberg at Gehl Architects: ‘The comfort level drops the more pedestrians you have. The above parameter is looking at when pedestrians start walking in “lines”, when you get crushed, when you can’t maneuver a wheelchair through etc.’ (Vamberg H., 2012a). What is different with this methodology is that it is based on levels of quality and comfort rather than quantity – conventional LOS mentioned above deals only with how many people a street can carry (Gehl Architects, 2004, p. 34).
Another aspect of the Gehl methodology is to locate footpath interruptions in the street network, such as delivery lanes where pedestrians have to stop and give way (figure 27). ‘All these interruptions for the walking rhythm constitute an irritation and an overall feeling that pedestrians are not really welcome and cared for” (Gehl Architects, 2004, p. 36). Gehl suggests that many of these side streets for traffic needs to be closed step by step, to give pedestrians higher priority.

Mia Pantzar |Page 25

Mia Pantzar |Page 26
‘All in all, a situation is created where pedestrians trust their instincts more than traffic signals and choose to walk whenever they find it safe. This is a widespread culture in London [and Melbourne?], where people move across streets whenever they see a pause in the traffic flow.
This well-known phenomena is not a sign of well-behaved pedestrians versus less well-behaved pedestrians, but merely a sign of a traffic system not laid out to meet pedestrian requirements for short waiting periods at lights and direct crossings at level.’
Towards a fine City for People, Public Spaces and Public Life – London 2004, (Gehl Architects, 2004, p. 38)
Figure 27 Footway interruption analysis (Gehl Architects, 2004, p. 37)
Mia Pantzar |Page 27
5.2 Pedestrian Comfort Guidance for London
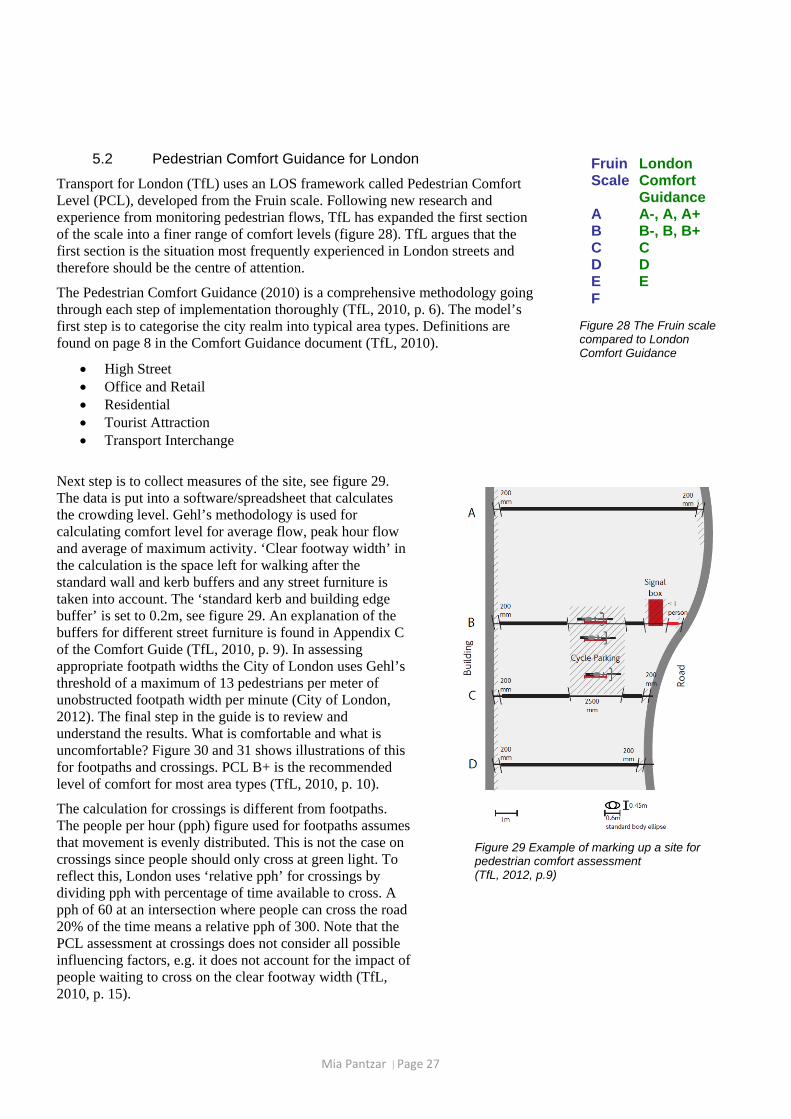
Transport for London (TfL) uses an LOS framework called Pedestrian Comfort Level (PCL), developed from the Fruin scale. Following new research and experience from monitoring pedestrian flows, TfL has expanded the first section of the scale into a finer range of comfort levels (figure 28). TfL argues that the first section is the situation most frequently experienced in London streets and therefore should be the centre of attention.
The Pedestrian Comfort Guidance (2010) is a comprehensive methodology going through each step of implementation thoroughly (TfL, 2010, p. 6). The model’s first step is to categorise the city realm into typical area types. Definitions are found on page 8 in the Comfort Guidance document (TfL, 2010).
High Street Office and Retail Residential Tourist Attraction Transport Interchange
Next step is to collect measures of the site, see figure 29. The data is put into a software/spreadsheet that calculates the crowding level. Gehl’s methodology is used for calculating comfort level for average flow, peak hour flow and average of maximum activity. ‘Clear footway width’ in the calculation is the space left for walking after the standard wall and kerb buffers and any street furniture is taken into account. The ‘standard kerb and building edge buffer’ is set to 0.2m, see figure 29. An explanation of the buffers for different street furniture is found in Appendix C of the Comfort Guide (TfL, 2010, p. 9). In assessing appropriate footpath widths the City of London uses Gehl’s threshold of a maximum of 13 pedestrians per meter of unobstructed footpath width per minute (City of London, 2012). The final step in the guide is to review and understand the results. What is comfortable and what is uncomfortable? Figure 30 and 31 shows illustrations of this for footpaths and crossings. PCL B+ is the recommended level of comfort for most area types (TfL, 2010, p. 10).
The calculation for crossings is different from footpaths. The people per hour (pph) figure used for footpaths assumes that movement is evenly distributed. This is not the case on crossings since people should only cross at green light. To reflect this, London uses ‘relative pph’ for crossings by dividing pph with percentage of time available to cross. A pph of 60 at an intersection where people can cross the road 20% of the time means a relative pph of 300. Note that the PCL assessment at crossings does not consider all possible influencing factors, e.g. it does not account for the impact of people waiting to cross on the clear footway width (TfL, 2010, p. 15).
Fruin London Scale Comfort
Guidance A A-, A, A+ B B-, B, B+ C C D D E E F
Figure 28 The Fruin scale compared to London Comfort Guidance
Figure 29 Example of marking up a site for pedestrian comfort assessment (TfL, 2012, p.9)

Mia Pantzar |Page 28
Figure 30 Pedestrian Comfort Levels (PCL) on Footpaths (TfL, 2010, p. 13)

Mia Pantzar |Page 29
Figure 31 Pedestrian Comfort Levels for Crossing Arm & Space to Pass on Island and for Queues on Crossing Islands (TfL, 2010, p. 20-21)

Mia Pantzar |Page 30

Mia Pantzar |Page 31
Figure 32 illustrates a guideline for how to decide which comfort level is suitable for different area types in
Figure 32 Guidance for how to decide which PCL is suitable for different area types in peak hour and average maximum activity level (TfL, 2010, p.14)

Mia Pantzar |Page 32
London. For example, a higher level of crowding is acceptable in an office area than at a tourist attraction. This reasoning seems logic as pedestrians in an office street typically are on their way to a location, whereas people enjoying a tourist attraction probably are simply strolling. Following this example, Melbourne could set up its own assessment guidance based on Melbourne area types and the specific issues faced here.

Mia Pantzar |Page 33
Figure 34 illustrates street capacity on Oxford Street, London, based on the methodology described above (Vamberg, 2012a). A similar analysis has been sketched for Melbourne for this report, figure 35, with an estimated unobstructed footway width of 5m for Town Hall, Bourke Street Mall North and the Princes Bridge. The pedestrian counts are from the pedestrian monitoring system (section 2.2). A standard kerb and building buffer of 0.2m has been deducted (the standard that London uses). Note that the measurements for the Melbourne streets are theoretical estimates. Empirical data of the footpaths, street furniture and buffers needs to be collected.
Figure 34 Street capacity at Oxford Circus, London (Vamberg, 2012)
Figure 33 Street capacity at Melbourne Streets, estimated clear footway of 4.6m (5m minus buffer of 0.2m on each side)
Town Hall, Swanston StreetMonday 13 August, 2012
0
10
20
30
40
50
60
70
0 1 2 3 4 5 6 7 8 9 10 11 12 13 14 15 16 17 18 19 20 21 22 23
Hour of the day
Ped
estria
ns
per
min
ute
Bourke Street Mall, NorthMonday 13 August, 2012
0
10
20
30
40
50
60
70
0 1 2 3 4 5 6 7 8 9 10 1112 13 1415 16 17 1819 20 2122 23
Hour of the day
Ped
estr
ians
per
min
ute
Princes BridgeMonday 13 August, 2012
0
10
20
30
40
50
60
70
0 1 2 3 4 5 6 7 8 9 10 11 12 13 14 15 16 17 18 19 20 21 22 23
Hour of the day
Ped
estr
ian
s p
er m
inu
te

Mia Pantzar |Page 34
5.3 Pedestrian Environment Review System (PERS), London
Transport Research Laboratory (TRL), London, has developed a walking audit tool with inputs from the TfL – the Pedestrian Environment Review System (PERS). PERS is used to ‘assess the level of service and quality provided for pedestrians across a range of pedestrian environments (links, crossings, routes, public transport waiting areas, interchange spaces, and public spaces)’. It is mainly a qualitative review of places where people walk. The places are scored according to e.g. width of pavement, steepness of dropped kerb and their general look and feel. The lower the score, the worse for pedestrians (TfL, 2012c). The UK organisation ‘Living Streets’ offers further information on walking audits like these (Living Streets, 2012). A system like this could be applicable to Melbourne, adding layers of detail to the ppmm data (see above). It could also be used as a more broad indication of when and where a full crowding study needs to be done.
5.4 New York City and the US
The traditional US focus on vehicular traffic is slowly transforming. In the last decade, the National Cooperative Highway Research Project has funded transport engineers and planners to develop a multi-modal LOS rating system, including a pedestrian mode. The project looks at how different system changes will affect the LOS. Progressive planning departments around the country have implemented the project’s results.
NYCDOT has released a Pedestrian Level of Service Study (2006) to encourage a new and ‘fresh’ look at the pedestrian LOS calculation. The standard used at the time was the Highway Capacity Manual (HCM) created by the Transportation Research Board, based on the Fruin scale. NYCDOT criticised the use of the Fruin scale and said it might not be optimal for pedestrian analysis since it was too insensitive to changes in pedestrian volume, individual pedestrian characteristics and sidewalk width (NYCDOT, 2006, p. 15-16). The NYCDOT study concludes that the main advantage with the HCM method of assessing pedestrians is its simplicity and comparability between locations (NYCDOT, 2006, p. 15). The shortcomings were:
It does not account for opposing pedestrians and the friction and delay caused by them Broad generalisation. Pedestrian and site characteristics that probably affect the LOS are not taken into
account, such as age, gender, trip purpose, surrounding land uses, time of day, weather etc. Inadequate calculation for sidewalk width considering street furniture, other pedestrians etc. Tests that NYCDOT conducted showed that it was more or less impossible for a sidewalk to experience
LOS level D, since ‘the number of pedestrians that would need to be added to a sidewalk to degrade the sidewalk’s LOS was insensitive’. E.g. on a twelve-foot sidewalk (= 3.66 meters) with 1,300 passing pedestrians per 15 minutes and LOS C, it would take an additional 600 pedestrians to reach LOS D. This would translate into an hourly volume of 7,600 pedestrians. The highest peak-hour pedestrian flow monitored on Broadway was 4,200 pedestrians hourly (NYCDOT, 2006, p. 16).
In the same document, NYCDOT conducted a literature review of prevailing research on how to better measure pedestrian LOS. They found that the focus areas were the sidewalk environment, pedestrian characteristics and flow characteristics (figure 35). The study finally outlines a recommendation on how to make LOS calculations that are more suitable for pedestrians (figure 36).

Mia Pantzar |Page 35
5.4.1 The National Cooperative Highway Research Project (NCHRP)
In accordance with the NYCDOT findings and requests for new tools, the National Cooperative Highway Research Project (NCHRP) implemented a new methodology for multimodal LOS analysis in 2008 (updated, NCHRP, 2009). It assesses four primary transport modes, including pedestrian, based on ‘user perceptions of the transportation environment’. Florida based Sprinkle Consulting guided the pedestrian research, which ‘led to new LOS analysis techniques that quantify the conditions for people walking /…/ along (and across) urban arterials’ (Sprinkle Consulting, 2012b). Sprinkle Consulting is the dominating US actor of measuring and analysing pedestrian LOS. According to their website, their cutting-edge Pedestrian LOS Model is the most used in the US (Sprinkle Consulting, 2012).
Figure 35 Relationship between the Sidewalk, Pedestrians, and Flow (NYC DOT, 2006, p. 24)
Figure 36 Data collection methodology (NYC DOT, 2006, p. 32)

Mia Pantzar |Page 36
5.4.2 Fort Collins, Colorado, US
The Colorado city of Fort Collins has adopted an extensive pedestrian plan. The plan outlines an interesting LOS methodology divided into five areas of evaluation – directness LOS, continuity LOS, signalised street crossing LOS, visual interest and amenity LOS, and security LOS (Fort Collins Pedestrian Plan, 2011, p. 33). At this stage this methodology might not be relevant for Melbourne, but it suggests an idea of how to elaborate an existing LOS analysis procedure.
1. Directness LOS
‘…how well the environment provides direct pedestrian connection to destinations such as transit stops, schools, parks, commercial areas, or activity areas’. The street grid and the service of the network determine directness LOS: actual distance from A to B divided by minimum distance A to B (as the crow flies). An actual/minimum (A/M) ratio of <1.2 is considered an A. A/M ratios >2.0 is considered an F (table five, figure 37, Fort Collins Pedestrian Plan, 2011, p. 34).
2. Continuity LOS
‘…the completeness of the sidewalk system. Continuity is a measure of both the physical consistency and type of pedestrian sidewalk and the visual connection from one block to the next’ (figure 38, Fort Collins Pedestrian Plan, 2011, p. 35)
LOS A: the pedestrian sidewalk appears as a single entity within a majority of activity area or public open space
LOS B: quality continuous stretch of pedestrian networks. Physically separated with landscaped parkways
LOS C: continuous pedestrian network on both sides of the street; however, these sidewalks may not be built to current standards
LOS D: may not be sidewalks on both sides of the street or there are breaches in the system
LOS E: significant breaks in the system
LOS F: breakdown in the pedestrian flow where each pedestrian selects a different route because no pedestrian network exists
Table 5 Directness Level of Service (Fort Collins Pedestrian Plan, 2011, p. 34)
Figure 38 Level of Service - Continuity (Fort Collins Pedestrian Plan, 2011, p. 35)
Figure 37 Level of Service - Directness (Fort Collins Pedestrian Plan, 2011, p. 34)

Mia Pantzar |Page 37
3. Signalised Street Crossings LOS
This is a more complex and difficult measurement examining number of lanes, crosswalks, signal indication, lighting levels, pedestrian signal indication, pedestrian character, sight distance and corner ramps (figure 39, Fort Collins Pedestrian Plan, 2011, p. 36).
4. Visual Interest and Amenity LOS
‘Visual interest and amenity considers the pedestrian system’s attractiveness and features. The attractiveness of the pedestrian network can range from visually appealing to appalling.’ (Fort Collins Pedestrian Plan, 2011, p. 37)
5. Security LOS
‘…measure of a pedestrian’s sense of security. Pedestrians require a sense of security, both through visual line of sight with vehicles drivers and separation from vehicles.’ (Fort Collins Pedestrian Plan, 2011, p. 37)
Figure 39 Pedestrian design elements at street crossings (Fort Collins Pedestrian Plan, 2011, p. 36)

Mia Pantzar |Page 38
5.5 Other Concepts Including Other Australian Capital Cities
City/organisation State Comment DM
The Victorian transport authority, VicRoads
(VicRoads, 2012)
VIC VicRoads provides a guideline for pedestrian level of service assessment at crossings. The guideline uses Fruin’s A to F scale and relates waiting time at crossing with the closest walking distance for pedestrians to safely cross the road.
7412473
Perth
(Main Roads Western Australia, 2006)
WA Perth has the most elaborate pedestrian focus found among Australian capital cities. Main Roads Western Australia has set up guidelines for measuring level of service on pedestrian and shared paths, including road crossings, in the state. Pedestrian LOS is used as a reflection of the average pedestrians’ perception of ‘the degree to which the facility is ‘pedestrian friendly’ (Main Roads Western Australia, 2006, p. 2). The Fruin LOS scale is used to describe walking conditions: LOS A – Ideal pedestrian conditions LOS B – Reasonable pedestrian conditions LOS C – Basic pedestrian conditions LOS D – Poor pedestrian conditions LOS E – Unsuitable pedestrian conditions LOS F – Fails disability access test.
7424859
Brisbane
Brisbane City Council
Qld The vision for 2026 is for 1 in 5 transport trips to be by walking or cycling. In the key strategies of the Walking and Cycling plan, maintaining an “acceptable level of service” for pedestrians is mentioned.
7425064
New Zealand Transport Authority (NZTA)
NZ The New Zealand Transport Authority (NZTA) defines walkability as the extent to which the built environment is walking‐friendly (NZTA, 2007, p. 6). New Zealand has no national thresholds for walkability indicators. Measuring is done through ‘desktop analyses of urban connectivity and on‐site assessment. Crowding is not specifically measured (NZTA, 2007, p. 85).
7423252
The Ministry of Urban Development (MOUD)
India 16 – 58% of trips made in Indian cities are made on foot, but the infrastructure and services for pedestrians neglected. The Ministry of Urban Development (MOUD) in India has outlined a walkability index to evaluate performance of pedestrian infrastructure. The index is as a function of available footpath on major corridors and facility ratings made by pedestrians (Government of India, MOUD, 2008, p. 44):
[(W1 x Availability of footpath) + (W2 x Pedestrian Facility Rating)] W1 and W2 are parametric weights (assumed 50% for both) Availability of footpath: Footpath length / length of major roads in the city Pedestrian Facility Rating: Score estimated based on opinion on available pedestrian facility.
7423249
The European COST project 358 “Pedestrian Quality Needs, PQN”
Europe WalkEurope.org is trying to set up a European standard on qualitatively and quantitatively recording pedestrian activity. Twenty European cities participate in the project with the main aim to get people to walk more (Sauter D., et al. 2008). What the project eventually will conclude in terms of measuring pedestrian levels might be interesting to review.
7366650

Mia Pantzar |Page 39
Asian Development Bank
Asia The Asian Development Bank has assessed 13 major Asian cities and their walkability based on field surveys. They used the Global Walkability Index (GWI) framework, developed by H. Krambeck for the World Bank (Krambeck, H., 2006). GWI is a qualitative analysis of urban walking conditions regarding safety, security and convenience of the pedestrian environment (Leather J., et al. 2011, p. 9). The rating scale is from one to five for each parameter. In the authors’ concluding suggestions for how future assessments of walkability in Asian cities ought to be constructed, they e.g. point out the following:
‘The range of the ratings for the parameters in the walkability surveys (currently 1–5) must be expanded (for example, to 1–10) to accentuate the differences between the walking environments of the cities. This would also allow the general public to better visualize the walking areas based on their ratings.’ [Walkability and Pedestrian Facilities in Asian Cities – State and Issues, Leather J., et al. (2011)]
The Asian Development Bank study also mentions the site Walk Score (www.walkscore.com) as a popular way for cities to assess their walkability, measuring the distance from residential houses to nearby amenities. However, as the study points out, ‘Walk Score does not include any assessment of the quality of pedestrian facilities, such as street width and block length, street design, safety from crime and crashes, pedestrian‐friendly community design, and topography’ (Leather J., et al. 2011, p. 9).
7423246
5.6 A Sample of Academic Studies on Pedestrian LOS
Title Author Published by Comment DM
Measuring Pedestrian Quality of Service for Midblock Street Crossings – Selection of Potential Determinants
Xuehao Chu and Michael R. Baltes
Transportation Research Record 1828, Paper No. 03‐5045
A suggested process for how potential determinants of perceived pedestrian quality of service for midblock street crossings may be selected. Applicable to other applications. An example from Florida, US have been described.
7379601
Level of service: the politics of reconfiguring urban streets in San Francisco, CA
Jason Henderson
Journal of Transport Geography 19 (2011) pp. 1138 –1144
The study describes the political movement in San Francisco, California, to eliminate the use of LOS in planning, since its bias towards automobiles at the expense of bicycling, transit, and walking, and it complicates smart growth or compact development. Henderson concludes that abolishing LOS would leapfrog the extended multimodal proposed elsewhere.
7424524
Assessment of Measures to Ease Pedestrian Congestion
Angela Lopez
Halcrow Group LTD
A focus on non‐conventional measures to improve the quality of pedestrian flow, such as directional lanes, street furniture relocation and fast/slow lanes. Case study: Oxford Street, London. Lopez uses Fruin and HCM LOS scales but also an environmental LOS set up by Khisty (1994). Lopez concludes that pedestrians are positive to her suggested changes to Oxford Street walk flow.
7424577
Mia Pantzar |Page 40
6 HIGHLIGHTS AND RECOMMENDATIONS This research presents some of the methodologies and policies applied on measuring levels of pedestrians in cities around the world. The main highlights most relevant for Melbourne are:
Pedestrian Trip Generation:
City of London methodology (section 4.1)
The City of London methodology described by Richard Lumley is the most elaborate pedestrian trip generation model found by this research. If City of Melbourne finds the First Principles assumption system applicable to Melbourne, they can be a good start for implementing a pedestrian trip generation system for Melbourne. Presumptions can be adjusted to Melbourne conditions through tests and surveys, and calculations conducted through a similar tool as TRAVL. The following would be required:
Categorisation of Melbourne’s principal land uses, including size of development, provision of parking facilities, proximity to public transport etc.
An assessment of a number of different sites for each land use (London uses five). The assessment needs to look at numbers of people entering and leaving the building, observe travel behaviour and measure travel activity.
This data is then used to calculate average trip generation rates per development area for each land use type. This is used to calculate the pedestrian impact created by new developments.
CASA model (section 4.2)
The Centre for Advanced Spatial Analysis’ methodology can be a way for Melbourne to predict pedestrian demand. It tests capacity, land use, street grid configuration, and accessibility to transport in an attempt to model future pedestrian demand. The tool is flexible and testable, which makes it attractive. At the same time, being based on Multiple Regression Analysis makes it relatively easy to understand and implement (Desyllas J. et al., 2003, p. 3).
Pedestrian Level of Service Analysis:
London Comfort Guidance methodology (section 5.3)
The Pedestrian Comfort Guidance could be directly implemented in Melbourne. The step-by-step implementation guide is comprehensive and software tools are provided. It would be required by City of Melbourne to:
Consider whether the area type definitions suggested in London are applicable in Melbourne or if they need adjustments.
Collect the required measurements at critical crowding sites in the city, ex. at Flinder Street Station, Swanston Street and Spencer Street. The measurements re footpath width, number of and size of street furniture etc. The standard wall and kerb buffer used in London can be applied (0.2m) if it seems applicable to Melbourne, or a customized figure can be decided based on measures at the sites.
Mia Pantzar |Page 41
At intersection crossings, the London method does not account for people waiting on the clear footpath width. This would need more research if it is implemented in Melbourne. The London methodology is nevertheless a good start
More detailed features of the street environment could also be included, similar to the PERS system from London.
Gehl Architects’ pedestrian analysis (section 5.2)
Considering the strong empirical experience behind the Gehl Architects’ crowding methodology of 13 people per meter per minute, it ought to be relevant for Melbourne to adopt. The Gehl calculations can be the basis of a Melbourne comfort level assessments. In that case, assessing crowding on Melbourne streets require:
Better and more pedestrian counters. Today, possibilities to analyse the pedestrian flow are limited. The current sensors only pick up the people walking under the sensor. At an intersection, pedestrian crossing or tram stop – sites with particular safety risks – the intensity of people is different. Melbourne needs more input data to pick up the full activity level in the pedestrian environment.
At an intersection, footpath calculations based on footpath width, street furniture etc. are probably less relevant and the intensity of people probably over 13 ppmm.
Data of available, unobstructed footpath width for the streets relevant for assessment
The pedestrian counts are compared to the footpath as follows:
Recommended pedestrian capacity:
13 person/minute/meter footway width x available footway width = no. of pedestrians/minute
Pedestrian counts are then plotted over time, compared to the recommended pedestrian capacity (see section 5.2).
NYCDOT and Fort Collins
The US reasoning resembles that of Gehl Architects that has been adopted in London. It seems clear that if Melbourne implements a pedestrian level of service analysis system, it ought to go down this path too. When a methodology is implemented in Melbourne, the Fort Collins differentiated LOS system offers interesting ways in how to further elaborate the analysis.

Mia Pantzar |Page 42
7 BIBLIOGRAPHY
24PM, 2012, ‘Pedestrian Monitoring System’, DM: 7304127
CEQR (City Environmental Quality Review), 2012, ‘Transportation – Chapter 16’ in CEQR Technical Manual, January 2012 Edition, DM: 7365296
City of London, 2012, ‘Footway widths’, URL www.cityoflondon.gov.uk/services/transport-and-streets/transport-planning/Pages/Footway-Widths.aspx
City of Melbourne, 2004, ‘Places for People’, City of Melbourne in collaboration with GEHL ARCHITECTS, Gehl Architechts website, www.gehlarchitects.dk/files/pdf/Melbourne_small.pdf, accessed on 20 September 2012
City of Melbourne, 2012, ‘Transport Strategy’
City of Melbourne, 2012b, ‘Growth Area Framework Plan’, Melbourne Planning Scheme, Municipal Strategic Statement – Clause 21, p. 10, DM: 7389307
City of Melbourne, 2012c, ‘CoM Central Melbourne Travel Survey 2012’, DM: 7370235
City of Melbourne, 2012d, ‘MILUTA Final Report – Draft’, DM 7012506
City of Melbourne, 2012e, ‘Docklands Public Realm Plan Melbourne’, City of Melbourne website: www.melbourne.vic.gov.au/getinvolved/Pages/DocklandsPublicRealmPlan.aspx, accessed on 18 October 2012
City of Vancouver, 2012, ‘How we walk the talk to support pedestrians’, City of Vancouver website, vancouver.ca/streets-transportation/walking-and-pedestrians.aspx, accessed on 31 August 2012
Department of Transport, State Government Victoria, 2012, ‘Victorian Integrated Survey of Travel and Activity (VISTA)’, Department of Transport website, www.transport.vic.gov.au/research/statistics/victorian-integrated-survey-of-travel-and-activity#overview, accessed on 20 September 2012
Desyllas J. et al., 2004, ‘Pedestrian Demand Modelling of Large Cities: an Applied Example from London’, Centre for Advanced Spatial Analysis, University College London, www.casa.ucl.ac.uk/working_papers/paper62.pdf, accessed on 4 October 2012
DeWolf C., 2012, ‘Pedestrians Feel the Squeeze from Cars and Planners’, South China Morning Post, Hong Kong, 25 March 2012
Engineering Timelines, 2012, ‘Pedestrianisation in Copenhagen’, URL www.engineering-timelines.com/why/lowCarbonCopenhagen/copenhagenPedestrianisation_01.asp
Gehl Architects, 2004, ‘Towards a Fine City for People – Public Spaces and Public Life – London 2004’, DM 7460245
Government of India, MOUD, 2008, ‘Study on Traffic and Transportation Policies and Strategies in Urban Areas in India’, Ministry of Urban Development, DM: 7423249
Hong Kong Transport Department, 2012, ‘Pedestrianisation’, Hong Kong Transport Departments website, www.td.gov.hk/en/transport_in_hong_kong/pedestrianisation/pedestrianisation/index.html, accessed on 4 October 2012
iamsterdam, 2012, ‘Transportation’, City of Amsterdam’s website, www.iamsterdam.com/en-GB/living/Transportation, accessed on 6 September 2012
Kajmats, 2012, email conversation September 7, 2012, DM: 7531885
Mia Pantzar |Page 43
Krambeck, H., 2006, ‘The global walkability index’, DSpace@MIT website, hdl.handle.net/1721.1/34409, accessed on 13 September 2012
Laing A., 2012, ‘Transport and the Central City’, DM 7359324
Leather J., Fabian H., Gota S., and Mejia A., 2011, ‘Walkability and Pedestrian Facilities in Asian Cities, State and Issues’, in ADB Sustainable Development Working Paper Series, No. 17, DM: 7423246
Littlejohn G., 2009, ‘Oxford Street opens first diagonal pedestrian system’, Metro, London, 2 November 2009
Living Streets, 2012, ‘Street Design and Management’, Living Streets website, www.livingstreets.org.uk/professionals/street-design-and-management
Lumley R., 2012a, ‘Pedestrian Trip Generation Rates’, Email conversation on the 13 September 2012, DM 7439008
Lumley R., 2012b, ‘2 Pedestrian Trip Generation Rates’, Email conversation on the 9 October 2012, DM 7482045
Main Roads Western Australia, 2006, ‘Guidelines for Assessing Pedestrian Level of Service’, Government of Western Australia, DM: 7424859
Municipality of Copenhagen, 2011, ‘More People to Walk More – The pedestrian strategy of Copenhagen’, DM: 7365325
NCHRP, 2009, ‘Multimodal Level of Service Analysis for Urban Streets: Users Guide’, DM: 7410736
NYC DCP, 2006, ‘Pedestrian Level of Service Study, Phase 1’, DM: 7365311
NYCDOT, 2008, ‘World Class Streets: Remaking New York City’s Public Realm’, DM: 7365283
NYCDOT, 2009, ‘Sustainable Streets – Progress Report’, DM 7365304
NZTA, 2007, ‘Pedestrian planning and design guide’, NZ Transport Agency, DM: 7423252
Roberts S., 2011, ‘You Like Walking in the City? So Do Plenty of Others’, The New York Times, New York City, 6 December 2011
Rizavi A., and Yeung A., 2010, ‘Urban Commuting Trends – Comparing Trip Generation Practices’, DM 7365319
Sauter D., et al. 2008, ‘Measuring Walking. Towards Internationally Standardised Monitoring Methods of Walking and Public Space’, 8th International Conference on Survey Methods in Transport, Annecy, France, May 25-31, 2008, DM: 7366650
Sprinkle Consulting, 2012, ‘Complete Streets’ Multi-Modal Level of Service’, Sprinkle Consulting website, www.sprinkleconsulting.com/Complete-Streets-Multi-Modal-Level-of-Service.aspx, accessed on 6 September 2012
Sprinkle Consulting, 2012b, ‘NCHRP 3-70 Multi-modal Level of Service for Urbanized Arterials’, Sprinkle Consulting website, www.sprinkleconsulting.com/Usercontrols/Project-Popup.aspx?ID=133, accessed on 6 September 2012
Steer Davies Gleave, 2011, ‘Walking segmentation – Introduction and description’, DM: 7366073
Still Prof. Dr. G. K., 2012, ‘4.1 Crowds - Levels of Service (Fruin)’, Safer Crowds website, www.safercrowds.com, accessed on 21 September 2012
The City of New York, 2012, ‘Citywide Performance Reporting (CPR)’, The City of New York website, www.nyc.gov/html/ops/html/data/cpr.shtml, accessed on 21 September 2012
The City of New York, 2012b, ‘Indicator Attribute – Pedestrian volume index’, The City of New York website, www.nyc.gov/html/ops/cpr/html/themes/all_frame.shtml?http://a858-anltw.nyc.gov/analytics/saw.dll?Dashboard&PortalPath=/shared/NYC311%20OTW/_Portal/CPR%20OTW&Page=Agency%20Performance&Options=f&Action=Navigate&P0=1&P1=eq&P2=Agency.AgencyName&P3=1+Department

Mia Pantzar |Page 44
of Transportation&NQUser=aye485xAWZp&NQPassword=ksTT3caK2a2z&Syndicate=Siebel, accessed on 21 September 2012
The City of New York, 2012c, ‘2012 CEQR Technical Manual’, The City of New York website, www.nyc.gov/html/oec/html/ceqr/technical_manual_2012.shtml, accessed on 21 September 2012
TfL, 2005, ‘Improving Walkability’, DM: 7366146
TfL (Transport for London), 2010, ‘Pedestrian Comfort Guidance London’, First Edition 2010, DM: 7366052
TfL, 2007, ‘Measuring Pedestrian Activity’, Version 1.0, DM: 7366062
TfL, 2012, ‘Walking Good Practice’, DM: 7398309
TfL, 2012b, ‘Walking’, Transport for London website, www.tfl.gov.uk/businessandpartners/publications/1427.aspx
TfL, 2012c, ‘What is PERS?’ DM: 7366082
Transportation for America, 2011, ‘Transportation for America, 2011’, Transportation for America website, t4america.org/resources/dangerousbydesign2011/, accessed on 4 October 2012
Vamberg H., 2012a, ‘Pedestrian Crowding’, email correspondence 21 September 2012, DM: 7464930
Vamberg H., 2012b, ‘SV Pedestrian Crowding’, email correspondence 10 October 2012, DM: 7482082
VicRoads, 2012, ‘Application and Use of Network Fit Assessments’, AITPM and VicRoads Seminar Training Manual, DM: 7412473
WRBC Services, Limited, 2012, ’52 – 54 Lime Street, London, EC3 Transport Assessment’, 29 august 2012, DM: 7482052