the effects of haloperidol on synaptic patterns in the rat...
TRANSCRIPT

Brain Research, 329 (1985) 265-274 265 Elsevier
BRE 10600
The Effects of Haloperidol on Synaptic Patterns in the Rat Striatum
FRANCINE M. BENES 2, PETER A. PASKEVICH, JESSICA DAVIDSON and VALERIE B. DOMESICK l
Department of lAnatomy and epsychiatry, Harvard Medical School, Boston, MA and McLean Hospital, Belmont, MA 02118 (U.S.A.)
(Accepted June 19th, 1984)
Key words: haloperidol - - corpus striatum - - synaptic organization
A morphometric analysis of the corpus striatum of rats chronically treated with haloperidol was performed at the light and electron microscopic levels. Although the density of striatal neurons was unchanged in the lialoperidol-treated group, there was a small in- crease in neuronal size (13%). This change in cell size was paralleled by a trend towards larger dendrite calibres occurring in the drug- treated animals. The distribution curve for axon terminal size indicated that 12% of the overall population was shifted from a range with a median size of 0.8/~m 2 to one with 1.6/~m 2 in the drug-treated group. This increase in size of some striatal terminals was accom- panied by a concomitant increase in numbers of their associated synaptic vesicles, resulting in a similar density of vesicles for both con- trol and drug-treated animals.
INTRODUCTION
Various clinical observations regarding the actions of neuroleptic drugs have led to conjectures that
these agents may induce structural alterations in the
brain. Some of these observations include: (1) the
time-course for full development of antipsychotic ef- fect of the neuroleptics may be as long as several
weeks; and (2) the occurrence of tardive dyskinesia,
an extra-pyramidal movement disorder associated
with neuroleptic use, can persist indefinitely after the
drug has been stopped. Recent animal studies indi-
cate that increased dopamine receptor binding itself
is not responsible for neuroleptic-induced oral dyski-
nesia, since equal increases were found with or with-
out tardive dyskinesia. This finding suggests that 'other factors' must mediate this effect 21. Support for
this 'factor ' being a structural one has recently come
from our morphometr ic analysis of synaptic connec-
tions in the substantia nigra of ratsL Despite the ab- sence of detectable neuroleptic-related changes at the light microscopic level, electron microscopic (EM) analysis of synaptic connections in these ani-
mals revealed a shift toward increased numbers of
axo-dendritic terminals occurring in the haloperidol-
treated group. This latter change was traced to a sin-
gle morphological sub-type of axon terminal for
which neither the transmitter nor the site of origin
has as yet been determined. The data, nonetheless,
raised the question of whether synaptic changes simi-
lar to those observed in the substantia nigra might be
found in other brain regions involved with the dopa- mine system. Theoretically, the neuroleptic drugs
might induce non-specific changes in synapses re- gardless of their location. Alternatively, these agents
might produce different alterations which reflect re-
gion-specific patterns of integration for the dopamine system.
The extension of analyses which were performed
in the substantia nigra to the rat striatum represents a logical approach to resolving this question. This re-
port describes a detailed EM morphometr ic analysis of axodendritic synapses in the striatum of control
and haloperidol-treated rats. This analysis was also performed at the light microscopic level to determine neuronal size and density, since some investigators have reported neuronal cell loss in striatum of rats treated for 16 weeks with neuroleptic agentsl8.
Correspondence: Francine M. Benes, Mailman Research Center, McLean Hospital, 115 Mill Street, Belmont, MA 02178, U.S.A.
0006-8993/85/$03.30 (~) 1985 Elsevier Science Publishers B.V. (Biomedical Division)

266
METHODS
Animals Male Sprague-Dawley rats weighing 200 + 5 g
were used for the studies. The rats (n = 4) were in-
jected daily with haloperidol (3 mg'kg, based on the daily body weight) which was dissolved in 0.02 mM
lactic acid for a period of 16 weeks. Control animals
(n = 4) were injected with appropriate volumes of
lactic acid alone. A detailed description of animal
handling has been presented elsewhere ̀ ) .
Tissue handling At the end of the 16 week interval, all animals were
anesthetized with Chloropent (1.0 ml'300 g body
weight) and perfused intracardially according to the two-step technique of Peters 19. Just prior to perfu-
sion, 0.1 ml of 2% sodium nitrite and heparin, 1000
USP units/ml, (1:1) were injected directly into the
left ventricle. A fixative containing 1% formalde-
hyde and 1.25% glutaraldehyde in 0.1 M cacodylate
buffer, pH 7.4, was then perfused through the heart.
Following 10 min of perfusion with this dilute fixa-
tive, a concentrated mixture containing 4% formal- dehyde and 5% glutaraldehyde was then perfused for
10 min. The brains were left overnight in situ at 4 °C.
The following day, the brains were removed from the calvarium and portions of the caudate nucleus were
excised using a Zeiss OpMi-1 surgical microscope.
The caudate tissues were post-fixed with 1.5% osmi-
um tetroxide in 0.1 M cacodylate buffer, pH 7.4,
stained en bloc with 2% uranyl acetate, dehydrated with a graded series of ethanol and propylene oxide
and embedded in Spurr epoxy resin. The tissue was
sectioned using a DuPont-Sorvall MT-2 ultramicro- tome. Thin sections (1 ~m) were stained with tolui-
dine blue. Ultra-thin sections (silver) were counter-
stained with lead citrate and viewed with a Siemens
Elmiskop electron microscope.
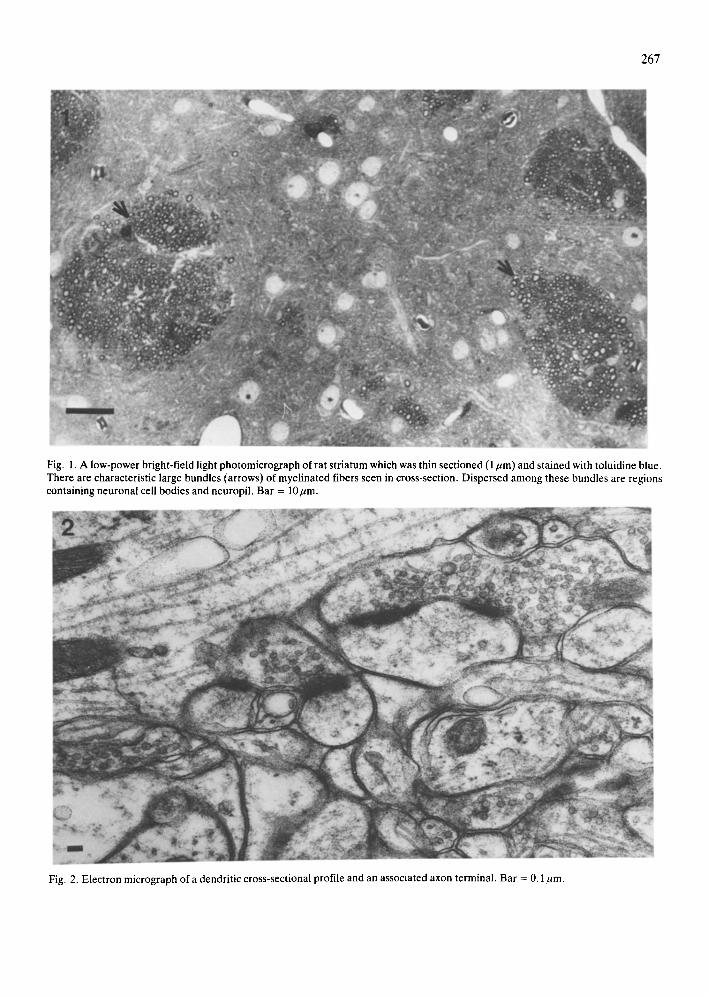
Morphometric analysis Light microscopy. Toluidine blue-stained thin sec-
tions were viewed with a Zeiss light microscope. Random fields of neuron somata within the caudate nucleus were localized among the bundles of mye- linated fibers which characteristically occur within
this brain region (Fig. 1). A reticule grid was aligned within the fields so that the myelinated axon bundles
were excluded from the sample. The number of neu-
ron somata within each field were counted and ex-
pressed as the number of cells per square micron of
tissue. Three such samples were obtained for each
animal. Criteria used to distinguish neurons from gila
were the presence of nucleoli and dendrites. Astrog-
lial cells were readily identified due to their very dark
appearance with toluidine blue staining. Oligoden-
droglia, on the other hand, are difficult to distinguish
from neuron somata and likely introduce some error
into the counting procedure. For the purpose of com-
parison between control and haloperidol-treated
groups, however, this consideration is not a signifi-
cant one since the counting was performed by one in- vestigator. The rater was known, on the basis of pre-
liminary studies, to have a high degree of consistency
in distinguishing oligodendroglia from neurons in re-
petitive samples. The counting error incurred from
oligodendroglia, therefore, was assumed to be a con-
sistent one for both experimental groups. The neuro-
nal density determined in this manner showed a nor-
mal distribution (data not shown), and the two-tailed
Student's t-test was, therefore, used to test the signif- icance of differences between control and drug-treat-
ed groups. The area of individual neuron somata in the cau-
date was determined using tracings of camera lucida projections taken at a magnification of 500 ×. The
reticule field was aligned at a low power (45 × ) as de-
scribed for the density determination above. The
magnification was then raised to 500 × and the first
10 neurons encountered were traced. These tracings were then entered into a Perkin Elmer 3220 Comput-
er using a Summagraphics digitizing board. The area
of these tracings was integrated and a mean and
standard deviation for each sample obtained. The means and standard deviations for each of the 4 ani-
mals within the two experimental groups were then combined and a two-tailed Student's t-test perform-
ed. Electron microscopy. Cross-sectionaL profiles of
dendrites were selected for sampling since they pro- vide a consistent unit for measurement of dendrite calibre, as well as determination of the number of axon terminals per dendrite (Fig. 2). Other param- eters assessed in these cross-sectional dendritic pro-
files were the volume of each axon terminal, its re- spective number of synaptic vesicles expressed as a
267
Fig. 1. A low-power bright-field light photomicrograph of rat striatum which was thin sectioned (1/~m) and stained with toluidine blue. There are characteristic large bundles (arrows) Of myelinated fibers seen in cross-section. Dispersed among these bundles are regions containing neuronal cell bodies and neuropil. Bar = lO~m.
Fig. 2. Electron micrograph of a dendritic cross-sectional profile and an associated axon terminal. Bar = 0.1 rum.

268
density (number per unit volume of terminal) , and
the length of the contact between terminal and den-
drite. The synaptic samples were obta ined from
fields similar to those descr ibed above for light mi-
croscopic de te rmina t ion of neuronal density and size.
The sampling of dendri tes in such a field was begun in
close proximity to a bundle of myel ina ted axons and
proceeded in a l inear t ra jectory toward the second
bundle. For the first round of sampling, 12 successive
fields of neuropil containing a dendri t ic profile were
photographed at a magnification of 9000 x and
pr inted to a final magnification of 55,000 x . Many of
the fields contained more than one dendr i te profile.
If one traverse from bundle to bundle failed to yield
12 samples of dendrites~ then a second traverse in a
t ra jectory just below the first was made. A n o t h e r set
of samples obta ined in a similar manner was ob ta ined
by a second investigator in o rder to test the consisten-
cy of the findings obta ined with this sampling proce-
dure. Both sets of samples were obta ined using
'bl ind ' conditions.
The various dendr i te cross-sections and their asso-
ciated axon terminals were then entered into the
computer as described for the light microscopic de-
terminat ion of neuronal size. The data were express-
ed in the form of distr ibution curves for each of the
variables examined. Parametr ic or non-paramet r ic
statistical tests were then selected for normal and
skewed distr ibutions, respectively. Since the synaptic
vesicle density and length of synaptic connect ion
showed a normal curve, the two-tai led Student ' s t-
test was used. Dendr i te calibre, axon terminal size
and the number of axon terminals per dendr i te cross-
section, on the other hand, showed variable degrees
of skewedness in their distr ibutions and required
non-parametr ic statistical tests. The computa t ion of
exact probabi l i t ies for R x C contingency tables was
chosen to analyze these variables, since it permits a
detai led, yet flexible, analysis of a dis tr ibut ion 11.
Thus, comparisons between control and drug- t rea ted
groups can be made for ei ther the entire distr ibution
or for discreet port ions of the curve (see Figs. 4 and
5). This approach has distinct advantages for the
analysis of synaptic parameters , since changes can
theoret ical ly occur within sub-popula t ions of various
synaptic components . Statistics such as the Wilcoxon
Rank Sum or the K o l m o g o r o v - S m i r n o v test, which
examine a populat ion as a whole, do not give ad-
TABLE 1
Comparison of neuronal size and density in striatum of haloperi- dol-treated rats
A light microscopic evaluation performed on 1 ,urn thick plastic- embedded material of striatum from control (n = 4) and halo- peridol-treated (n = 4) rats. The values shown represent the combined means and standard errors of the means for the ani- mals within each group.
Neuron size (/~m 2) Neuron densiO' (cells/ram 2 )
Control 196.4 + 0.2 (n = 40) 62.0 + 3.0 Haloperidol-treated 231.2 _+ 15.1" (n = 40) 63.9 _+ 2.1
* P < 0.05 using two-tailed Student's t-test.
equate t rea tment to the types of changes that might
occur in a mul t icomponent system.
Linear regression analysis and analysis of covari-
ance were per formed to assess the relat ionship be-
tween terminal size and vesicle number for the two
groups.
RESULTS
The results of the light microscopic evaluat ion of
neuronal density and size in control and haloper idol-
t reated rat s tr iatum are shown in Table I. While the
number of neuron somata per unit volume (density)
is nearly identical in the exper imenta l and control
groups, the size (volume) of the neurons is slightly
but significantly, larger in the drug- t rea ted animals.
There were no signs of art ifactual tissue swelling in
the str iatum of animals t rea ted chronical ly with halo-
peridol.
TABLE II
Comparison of axo-dendritic synaptic parameters in striatum of haloperidol-treated rats
The data were obtained from electron microscopic samples of axodendritic synapses from striatum of control (n = 4) and ha- loperidol-treated (n = 4) animals. The values shown represent the combined means and standard errors of the means for the animals within each group.
Synaptic vesicle Length of synaptic density (per ~m 2) connection (~m)
Control 185 + 6 0.59 + 0.03 (n = 110) (n = 110)
Haloperidol-treated 200 + 21" 0.58 _+ 0.02* (n = 110) (n = 110)
* Not significant using two-tailed Student's t-test.
269
100 90 ~ x,--x Control
--~ RO It 0,--,0 Haloperidol- ~ ;0 ~ Treated
4 o
ao
! ,o z l O ~
1 2 3 4 5 6 Number of Nerve Terminals Per Dendrite
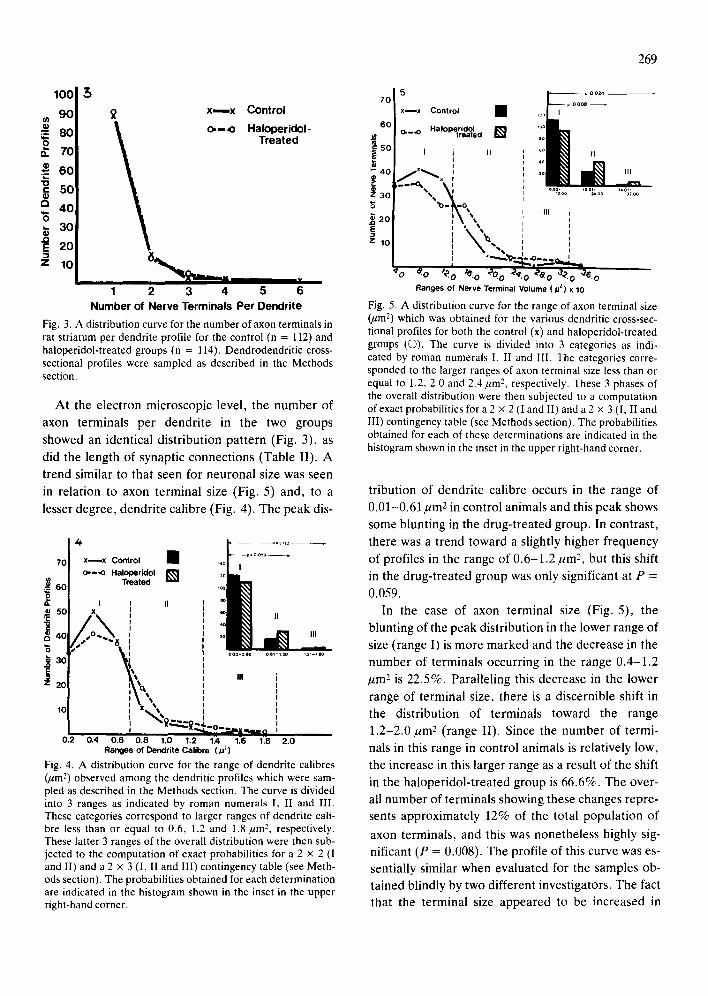
Fig. 3. A distr ibut ion curve for the number o f axon terminals in rat striatum per dendrite profile for the control (n = 112) and haloperidol-treated groups (n = 114). Dendrodendritic cross- sectional profiles were sampled as described in the Methods section.
At the electron microscopic level, the number of
axon terminals per dendrite in the two groups
showed an identical distribution pattern (Fig. 3), as
did the length of synaptic connections (Table II). A
trend similar to that seen for neuronal size was seen
in relation to axon terminal size (Fig. 5) and, to a
lesser degree, dendrite calibre (Fig. 4). The peak dis-
,° I 5O
,o 30
z 2o
1 0
x ~ x Control • ,.o
o.-.~, .a~,r~o,-T~,=,~ "[] ' i ~ x II
IN._ I_2k
I
0.2 0,4 0.6 0.8 1.O 1.2 1A 1.6 1~8 2.0 Ranges of Dendrite Calibre (,u 2)
Fig. 4. A distribution curve for the range of dendrite calibres (~m 2) observed among the dendritic profiles which were sam- pled as described in the Methods section. The curve is divided into 3 ranges as indicated by roman numerals I, II and III. These categories correspond to larger ranges of dendrite cali- bre less than or equal to 0.6, 1.2 and 1.8/2m 2, respectively. These latter 3 ranges of the overall distribution were then sub- jected to the computation of exact probabilities for a 2 × 2 (I and II) and a 2 × 3 (I, II and III) contingency table (see Meth- ods section). The probabilities obtained for each determination are indicated in the histogram shown in the inset in the upper right-hand corner.
I ~ D 0 o24 - - 70 ~ pOOOS
x ~ x Control i . o
o.-,Io treated [ ]
J~50 I II
• i o ~ o0 32 oo
30 •.o_~k. o [ \ " ,,, ,
~2o I \ \ ',
z lo : \ ", ,
, " ~ ' V - . _ H - . o - . . = . 2
~o e'o "~.o 1% ,~o. ° ~q.o ~'e.o ~ 'o ~.o Ranges of Nerve Terminal Volume (~u z) x 10
Fig. 5. A distribution curve for the range of axon terminal size (,urn 2) which was obtained for the various dendritic cross-sec- tional profiles for both the control (x) and haloperidol-treated groups (©). The curve is divided into 3 categories as indi- cated by roman numerals I, II and III. The categories corre- sponded to the larger ranges of axon terminal size less than or equal to 1.2, 2.0 and 2.4 ~m 2, respectively. These 3 phases of the overall distribution were then subjected to a computation of exact probabilities for a 2 × 2 (I and II) and a 2 × 3 (I, II and Ill) contingency table (see Methods section). The probabilities obtained for each of these determinations are indicated in the histogram shown in the inset in the upper right-hand corner.
tribution of dendrite calibre occurs in the range of
0 .01-0.61/ tm 2 in control animals and this peak shows some blunting in the drug-treated group. In contrast,
there was a trend toward a slightly higher frequency
of profiles in the range of 0 .6-1.2 j~m 2, but this shift
in the drug-treated group was only significant at P =
0.059. In the case of axon terminal size (Fig. 5), the
blunting of the peak distribution in the lower range of
size (range I) is more marked and the decrease in the
number of terminals occurring in the range 0 .4-1.2
pm 2 is 22.5%. Paralleling this decrease in the lower
range of terminal size, there is a discernible shift in
the distribution of terminals toward the range 1.2-2.0 ~m 2 (range II). Since the number of termi-
nals in this range in control animals is relatively low,
the increase in this larger range as a result of the shift
in the haloperidol-treated group is 66.6%. The over- all number of terminals showing these changes repre- sents approximately 12% of the total population of
axon terminals, and this was nonetheless highly sig- nificant (P = 0.008). The profile of this curve was es-
sentially similar when evaluated for the samples ob- tained blindly by two different investigators. The fact that the terminal size appeared to be increased in

270
drug-treated animals (Fig. 5), while synaptic vesicle
density remained unchanged (Table If), suggested
the possibility that the number of synaptic vesicles
may have been increased in these terminals. To as-
sess this possibility further, linear regression analyses
were performed for each group using terminal size as
the dependent and vesicle number as the indepen-
dent variable (Fig. 6). The regression lines were sim-
ilar for both the control (m = 0.003, b = 1.4, P <
0.001) and the haloperidol-treated (m = 0.004, b =
1.6, P < 0.001) groups. An analysis of covariance of
this data showed that the number of vesicles behaved
as a covariate for the two groups (P < 0.001) and that
the groups were significantly different (P = 0.005)
with respect to the two variables.
DISCUSSION
The results of this study support the idea that halo-
peridol and perhaps other neuroleptic agents can in-
duce structural alterations in the central nervous sys- tem. Unlike a previous report is, no difference in cell
number was observed in haloperidol-treated ani-
mals. Although the manner in which the data were
presented in that report preclude any direct compari-
sons, differences in experimental design probably ac-
count for the discrepancies noted. While in the pres-
ent study there is only a slight trend towards in-
creased size of neurons and dendrites, the size of axon terminals and their vesicle numbers appear to
have been more significantly affected in the haloperi-
dol-treated group. Specifically, the data suggest that approximately 12% of all the terminals may have been enlarged from a median size of 0.8/Am 2 (range
0 .4-1.2 ktm 2) to a median size of 1.6 ~tm 2 (range
1.2-2.0ktm2). Thus, some axon terminals could have
effectively doubled in size in the drug-treated group,
and might possibly represent a distinct sub-group. In- terestingly, there was no change in the density of syn- aptic vesicles in the haloperidol-treated animals, a finding which is consistent with the observation of a constan.t linear relationship between terminal size and vesicle numbers. The overall number of synaptic
vesicles were, therefore, doubled in some striatal ter-
minals. It is important to consider whether any of these al-
terations in synaptic parameters could arise seconda- rily to artifactual changes in the tissues. The antipsy-
1.4
1.2
1.0
0.8
0.6
< 0.4
0.2
6 Control
• . . o . ~ S " . , " • . r.0.73 • . , •'~'. • ° •
• ~! °° °° ° "o o
2 .",T: I .
.to
40 80 120 ' ~ 0 200 240 2110 320 3SO
Numb~ of Vesicles
1.41 H elol~u'kl~l -Tmllt~d 1.2
1.0
0.E •
0.~
0.l
0.2 ;°.o °° •
4 0 80 120 160 200 240 280 320 360 400 Number of Vesicles
Fig. 6. Linear regression lines obtained with a scattergram plot of points using number of vesicles as the independent and ter- minal size as the dependent variable. The upper graph shows the control (n = 110) and the lower graph the haloperidol- treated (n = 114) groups. There were 4 animals in each group.
chotic agents are known to have potent effects on the
physicochemical properties of biological mem-
branes. The planar configuration of these heterocy- clic molecules permits them to intercalate between
fatty acid chains within the lipid bilayer. It is conceiv-
able that such a mechanism could be associated with
the preferential occurrence of a fixation artifact aris- ing from a destabilization of the membrane structure. Such a consideration is of particular concern to these current findings since increases of the volume of den-
drites and axon terminals could reflect non-specific tissue swelling, a well-known fixation artifact. Two observations argue against this latter possibility, however. First, no morphological evidence of such swelling was seen in either the control or the halope- ridol-treated tissues. The most obvious manifesta- tions of fixation-induced swelling would be the ap- pearance of large intracellular vacuoles and areas of
cytoplasm which have lost their characteristic granu-
lar appearance. Neither feature was observed in the haloperidol-treated group. The second, and perhaps most important observation that argues against fixa- tion-related swelling having occurred, is the fact that the density of synaptic vesicles in the axon terminals of the haloperidol-treated group was unchanged. Where swelling of cellular compartments occurs, there is a relative volumetric dilution of particles within that compartment. Thus, the density of synap-
tic vesicles would be expected to decrease significant- ly in terminals which have swollen to twice their nor- mal size. The fact that this did not occur also argues
against the possibility of fixation-related artifact. An- other source of artifact to morphometric analyses which is unrelated to fixation is a poorly designed sampling procedure. This potential pitfall was ex- cluded as a serious problem by the use of replicate sampling which was performed by two investigators under 'blind conditions'. As a result of this proce- dure, it was found that no differences in either the light or electron microscopic results occurred for the respective groups. In addition, the results obtained for individual animals within each experimental group were generally similar, thus excluding a final
possibility that the sub-population of an axon termi-
nal which was of a larger size occurred idiosyncrati- cally in only one animal.
The finding of a modest degree of structural change in synapses of the striatum in relation to halo- peridol treatment may have some parallels in a vari- ety of biochemical and pharmacologic changes which
have been reported for striatum of neuroleptic-treat- ed animals. Both homovanillic acid I and 3,4-dihy- droxyphenylacetic acid, DOPAC 7.17, are increased in the striatum of rats treated both acutely and chron- ically with haloperidol. These accumulations of do- pamine metabolites have been interpreted as evi- dence of its increased turnover, which may in part be due to an activation of tyrosine hydroxylase kinet- ics 12.13A6,22.23 through changes in the feedback loop
between the striatum and substantia nigra14. Haloperidol also causes an acute increase of ace-
tylcholine turnover in striatum, but this latter effect is not observed after chronic administration of the drugtO. It is unlikely, therefore, that the structural changes which persisted up to 16 weeks of haloperi- dol administration in this present study reflect altera-
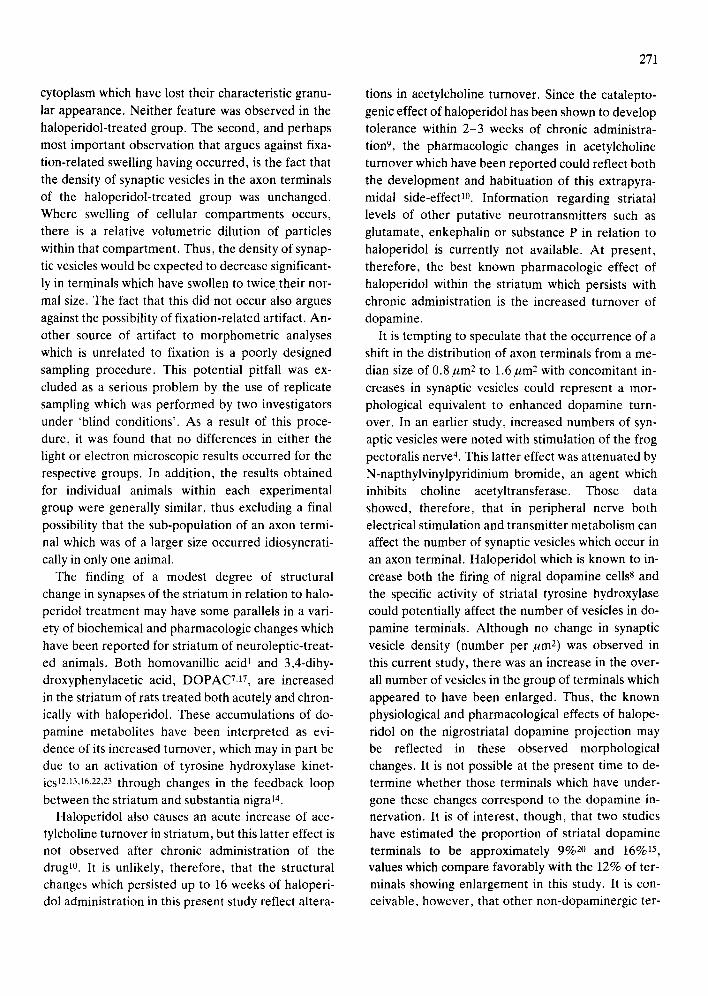
271
tions in acetylcholine turnover. Since the catalepto-
genic effect of haloperidol has been shown to develop tolerance within 2-3 weeks of chronic administra- tion 9, the pharmacologic changes in acetylcholine turnover which have been reported could reflect both
the development and habituation of this extrapyra- midal side-effect 10. Information regarding striatal levels of other putative neurotransmitters such as
glutamate, enkephalin or substance P in relation to haloperidol is currently not available. At present, therefore, the best known pharmacologic effect of haloperidol within the striatum which persists with chronic administration is the increased turnover of dopamine.
It is tempting to speculate that the occurrence of a shift in the distribution of axon terminals from a me- dian size of 0.8 ~m 2 to 1.6 ~m 2 with concomitant in- creases in synaptic vesicles could represent a mor- phological equivalent to enhanced dopamine turn- over. In an earlier study, increased numbers of syn- aptic vesicles were noted with stimulation of the frog pectoralis nerve 4. This latter effect was attenuated by N-napthylvinylpyridinium bromide, an agent which inhibits choline acetyltransferase. Those data showed, therefore, that in peripheral nerve both electrical stimulation and transmitter metabolism can affect the number of synaptic vesicles which occur in an axon terminal. Haloperidol which is known to in- crease both the firing of nigral dopamine cellsS and the specific activity of striatal tyrosine hydroxylase could potentially affect the number of vesicles in do- pamine terminals. Although no change in synaptic vesicle density (number per ~m 2) was observed in this current study, there was an increase in the over- all number of vesicles in the group of terminals which
appeared to have been enlarged. Thus, the known physiological and pharmacological effects of halope- ridol on the nigrostriatal dopamine projection may be reflected in these observed morphological changes. It is not possible at the present time to de- termine whether those terminals which have under- gone these changes correspond to the dopamine in- nervation. It is of interest, though, that two studies have estimated the proportion of striatal dopamine terminals to be approximately 9%20 and 16% 15 , values which compare favorably with the 12% of ter- minals showing enlargement in this study. It is con- ceivable, however, that other non-dopaminergic ter-

272
minals within the striatum could undergo structural
alterations which occur postsynaptically in response
to the blockade of dopamine receptors. For example,
tyrosine hydroxylase immunoreact ive terminals have
been noted to engage in axo-axonal synapses with
cortical afferents to the striatum6. The structural and
functional characteristics of these presumed gluta-
minergic cortical endings could potentially undergo
substantial alterations in response to blockade of do-
pamine receptors. At tempts to associate the increase
in terminal size in this current study with a particular
morphological subtype of axon terminal is con-
founded by the fact that a variety of striatal nerve
endings have a similar appearance, a feature pre-
viously noted by others 20. lndeed, the changes found
in this study could have occurred in more than one
type of nerve ending found in striatum.
The results of this study provide further evidence
that haloperidol can induce synaptic alterations in
the rat central nervous system, an effect which we
first noted in the rat substantia nigra 5. This agent,
however, does not appear to produce the same pat-
tern of synaptic change in all brain regions or cells,
since that noted in the striatum is strikingly different
from the change found in nigraL In striatum, no
change in the number of axon terminals per dendrite
was observed, while this variable in the substantia ni-
gra showed a significant increase. Thus, the different
effects noted in striatum and substantia nigra support
the idea that the morphological changes induced by
haloperidol may reflect alterations in region-specific
REFERENCES
1 Anden, N., Dopamine turnover in the corpus striatum and the limbic system after treatment with neuroleptic and anti- psychotic drugs, J. Pharm. Pharmacol., 24 (1972) 905-906.
2 Bannon, M. J., Bunney, E. B. and Roth, R. H., Mesocorti- cal dopamine neurons: rapid transmitter turnover com- pared to other brain catecholamine systems, Brain Re- search, 218 (1981) 376-382.
3 Bannon, M. J., Michaud, R. L. and Roth, R. H., Mesocor- tical dopamine neurons. Lack of autoreceptors modulating dopamine synthesis, Molec. Pharmacol.. t9 (1981) 270-275.
4 Benes, F. M. and Barrnett, R. J., Biochemical and mor- phometric studies of the relationship of acetylcholine syn- thesis and vesicle numbers after stimulation of frog neuro- muscular junctions: the effect of a choline-O-acetyltrans- ferase inhibitor, Brain Research, 150 (1978) 277-293.
5 Benes, F. M., Paskevich, P. A. and Domesick, V., Halope- ridol-induced plasticity of axon terminals in rat substantia nigra, Science, 221 (1983) 969-97t.
patterns of integration. It is of interest to knmv
whether another brain region which, like the stria-
turn, receives a major dopamine projection would
also show a pattern of synaptic alteration similar 1o
that seen in the striatum. The medial prefrontal cor-
tex of the rat is richly innervated by the ventral teg-
mental A10 dopamine cells. Studies are currentl~ in
progress which will determine whether haloperidol
can induce structural changes in cortical synapses as
well. This latter question is of obvious theoretical im-
portance to our understanding of the antipsychotic
agents, since their clinically useful effect on psychosis
is likely to be mediated, at least in part, through the
cortex. The complexity of the cortex and the fact that
it receives a dopamine input with pharmacological
properties which are different from those of the stria-
turn 2.3 could result in a pattern of synaptic change be-
ing induced by haloperidol, which is also different
from that observed in striatum.
ACKNOWLEDGEMENTS
The authors wish to thank Dr. Steven Matthysse
for his advice regarding appropriate statistical analy-
ses and the use of some of his programs for area de-
termination, Dr. Ross Baldessarini for his helpful
comments on this manuscript and Alexander Camp-
bell for assistance in animal preparation. This work
was supported by NIMH Grants K01 MH00423-01
and MH31154-06.
6 Bouyer, J. J., Pickel, V. M., Joh, T. H., Miller, R. J. and Reis, D. J., Synaptic relations between cortical and dopa- minergic afferents and enkephalin-containing neurons in the neostriatum, Proc. Soc. Neurosci., (1982) 119.
7 Bowers, M. B. and Rozitis, A., Regional differences in ho- movanillic acid concentrations after acute and chronic ad- ministration of antipsychotic drugs, J. Pharm. Pharmacol., 26 (1974) 743-745.
8 Bunney, B. S. and Grace, A. A., Acute and chronic halope- ridol treatment: comparison of effects on nigral dopaminer- gic cell activity, Life Sci., 23 (1978) 1715-1728.
9 Campbell, A. and Baldessarini, R. J., Tolerance to behav- ioral effects of haloperidol, Life Sci., 29 ( 1981) 1341-1346.
10 Costa, E., Cheney, D. L., Mao, C. C. and Moroni, F., Ac- tion of antischizophrenic drugs on the metabolism of y-ami- nobutyric acid and acetylcholine in globus pallidus, stria- turn and n. accumbens, Fed. Proc., 37 (1978) 24(t8-2414.
11 Freeman, G. H. and Halton, J. H., Note on an exact treat- ment of contingency, goodness of fit and other problems of significance, Biometrika, 38 (195l) 141-149.
12 Gale, K.. Costa, E., Toffano, G., Hong, J.-S. and Guidoni,
A., Evidence for a role of nigral 7-aminobutyric acid and substance P in the haloperidol-induced activation of striatal tyrosine hydroxylase, J. Pharmacol. exp. Ther., 206 (1978) 29-37.
13 Gale, K. and Guidoti, A., GABA-mediated control of rat neostriatal tyrosine hydroxylase revealed by intranigral muscimol, Nature (Lond.), 263 (1976) 691-693.
14 Groves, P. M., Wilson, C., Young, S. and Rebec, G., Self- inhibition by dopaminergic neurons, Science, 190 (1975) 522-529.
15 H0kfelt, T., In vitro studies on central and peripheral monoamine neurons at the ultrastructural level, Z. Zel- lforsch., 91 (1968) 1-74.
16 Leviel, V., Cheramy, A., Nieoullon, A. and Glowinski, J., Symmetric bilateral changes in dopamine release from the caudate nuclei of the cat induced by unilateral nigral appli- cation of glycine and GABA-related compounds, Brain Re- search, 175 (1979) 259-270.
17 Meller, E., Friedhoff, A. and Friedman, E., Differential ef- fects of acute and chronic haloperidol treatment on striatal and nigral 3,4-dihydroxyphenylacetic acid (DOPAC) lev- els, Life Sci., 26 (1980) 541-547.
18 Nielsen, B. and Lyon, M., Evidence for cell loss in corpus striatum after long-term treatment with a neuroleptic drug
273
(flupenthixol) in rats, Pharmacology, 59 (1978) 85-89. 19 Peters, A., The fixation of central nervous tissue and the
analysis of electron micrographs of the neuropil with special reference to the cerebral cortex. In W. J. H. Nauta and S. O. E. Ebbesson (Eds.), Contemporary Research Methods in Neuroanatomy, Springer, New York, 1970, pp. 56-76.
20 Tennyson, V., Heikilla, R., Mytilineou, C., Cote, L. and Cohen, G., 5-Hydroxydopamine 'tagged' neuronal boutons in rabbit neostriatum: interrelationship betwe°n vesicles and axonal membrane, Brain Research, 82 (19" ]41-348.
21 Waddington, J. L., Cross, S., Gamble, S. and Bourne, R., Spontaneous orofacial dyskinesia and dopaminergic func- tion in rats after 6 months of neuroleptic treatment, Sci- ence, 220 (1983) 530-532.
22 Zivkovic, B., Guidotti, A. and Costa, E., Effects of neuro- leptics on striatal tyrosine hydroxylase: changes in affinity for the pteridine cofactor, Molec. Pharmacol., 10 (1974) 727-735.
23 Zivkovic, B., Guidotti, A., Revuelta, A. and Costa, E., Ef- fect of thioridiazine, clozapine and other antipsychotics on the kinetic state of tyrosine hydroxylase and on the turn- over rate of dopamine in striatum and nucleus accumbens, J. Pharm. exp. Ther., 194 (1975) 37-46.