quantitativephosphotyrosineprofilingofpatient...
TRANSCRIPT

Therapeutics, Targets, and Chemical Biology
QuantitativePhosphotyrosineProfilingof Patient-DerivedXenografts IdentifiesTherapeuticTargetsin Pediatric LeukemiaSibasish Dolai1, Keith C.S. Sia1, Alissa K. Robbins1, Ling Zhong2, Sue L. Heatley3,4,Tiffaney L. Vincent5, Falko Hochgr€afe6, Rosemary Sutton1, Raushan T. Kurmasheva7,Tamas Revesz8,9, Deborah L.White3,4,8, Peter J. Houghton7, Malcolm A. Smith10,David T. Teachey5, Roger J. Daly11, Mark J. Raftery2, and Richard B. Lock1
Abstract
Activating mutations in tyrosine kinases (TK) drive pediatrichigh-risk acute lymphoblastic leukemia (ALL) and confer resis-tance to standard chemotherapy. Therefore, there is urgent needto characterize dysregulated TK signaling axes in patients withALL and identify actionable kinase targets for the developmentof therapeutic strategies. Here, we present the first study toquantitatively profile TK activity in xenografted patient biopsiesof high-risk pediatric ALL. We integrated a quantitative phos-photyrosine profiling method with "spike-in" stable isotopelabeling with amino acids in cell culture (SILAC) and quanti-fied 1394 class I phosphorylation sites in 16 ALL xenografts.Moreover, hierarchical clustering of phosphotyrosine sites
could accurately classify these leukemias into either B- or T-cell lineages with the high-risk early T-cell precursor (ETP) andPh-like ALL clustering as a distinct group. Furthermore, wevalidated this approach by using specific kinase pathway inhi-bitors to perturb ABL1, FLT3, and JAK TK signaling in fourxenografted patient samples. By quantitatively assessing thetyrosine phosphorylation status of activated kinases in xeno-graft models of ALL, we were able to identify and validateclinically relevant targets. Therefore, this study highlights theapplication and potential of phosphotyrosine profiling foridentifying clinically relevant kinase targets in leukemia. CancerRes; 76(9); 2766–77. �2016 AACR.
IntroductionAcute lymphoblastic leukemia (ALL) is the commonest cancer
in childhood and adolescent age groups, accounting for a third ofall pediatric malignancies and 80% of childhood leukemia (1, 2).The disease results from a clonal proliferation of malignant,immature white blood cells of B- and T-cell lineages in the bone
marrow. TheB-cell precursor (BCP) - andT-ALLare further dividedinto a number of subtypes based on clinical features, chromo-somal translocations, and genetic characteristics (3). Despite anoverall survival rate approaching 90%, the heterogeneous natureof ALL confers a differential response to treatment for the diversepatient groups (4). Given this heterogeneity in prognosis,moderntherapeutic approaches seek to modify treatment regimens basedon a patient's risk of relapse at diagnosis using clinical, cytogenet-ic, and biologic criteria, in risk-adapted therapy (5, 6). Morerecently, attempts have been made to improve risk stratificationby classifying these high-risk patients into distinct subtypes at amolecular level, via gene expression analysis and immunophe-notyping (7, 8). Whole-genome and transcriptome sequencing ofcertain high-risk patient subsets such as early T-cell precursor ALL(ETP-ALL; refs. 9, 10) and Philadelphia chromosome–like (Ph-like; refs.11, 12) ALL have also revealed several activating genefusions, alterations, and mutations that could result in constitu-tively activated tyrosine kinases (TK). This further leads to uncon-strained phosphorylation of downstream substrates by TKs,impacting several key signaling pathways and resulting inincreased cell survival and proliferation.
Recent advances inmass spectrometry (MS) and the use of anti-phosphotyrosine antibodies for the enrichment of tyrosine phos-phorylated peptides have greatly facilitated characterization ofkinase signaling networks and identified several activated TKs andtheir phosphorylated substrates in cancer cells (13–15). Further-more, quantitative tools such as stable isotope labeling by aminoacids in cell culture (SILAC) have also been efficiently integratedinto this phosphoproteomic workflow to globally map andquantify changes in phosphorylation events (16, 17). Using such
1Children's Cancer Institute, Lowy Cancer Research Centre, Universityof New South Wales Australia, Sydney, New South Wales, Australia.2Bioanalytical Mass Spectrometry Facility, Mark Wainwright Analyti-cal Centre, University of New South Wales Australia, Sydney, NewSouth Wales, Australia. 3South Australian Health and MedicalResearch Institute (SAHMRI), Adelaide, South Australia, Australia.4Discipline of Medicine, University of Adelaide, Adelaide, South Aus-tralia, Australia. 5Children's Hospital of Philadelphia, Philadelphia,Pennsylvania. 6Competence Centre – Functional Genomics, JuniorResearch Group Pathoproteomics, University of Greifswald,Germany.7Greehey Children's Cancer Research Institute, University of TexasHealth Science Center, San Antonio, Texas. 8Discipline of Paediatrics,University of Adelaide, Adelaide, South Australia, Australia. 9SAPathology (at Women's & Children's Hospital), Adelaide, South Aus-tralia, Australia. 10Cancer Therapy Evaluation Program, NCI, Bethesda,Maryland. 11Department of Biochemistry and Molecular Biology,School of Biomedical Sciences, Monash University, Melbourne,Victoria, Australia.
Note: Supplementary data for this article are available at Cancer ResearchOnline (http://cancerres.aacrjournals.org/).
Corresponding Author: Richard B. Lock, Children's Cancer Institute, PO Box 81,Sydney, NewSouthWales 2031, Australia. Phone: 612-9385-2513; Fax: 612-9662-6584; E-mail: [email protected]
doi: 10.1158/0008-5472.CAN-15-2786
�2016 American Association for Cancer Research.
CancerResearch
Cancer Res; 76(9) May 1, 20162766
on May 6, 2018. © 2016 American Association for Cancer Research. cancerres.aacrjournals.org Downloaded from
Published OnlineFirst March 9, 2016; DOI: 10.1158/0008-5472.CAN-15-2786

an approach, activated oncogenic kinases were identified in non–small cell lung cancer patient samples (15). Phosphotyrosineprofiling also revealed specific signaling networks in basal breastcancer cells and highlighted multiple kinases and substrates fortherapeutic evaluation (18). These studies also indicate thatpatient stratification is feasible based on activated kinase profiles,which could suggest specific kinase-targeted drugs to be usedeither alone or in combination with established chemotherapeu-tics. Although this quantitative approach has been successfullyextended to patient samples in solid tumors, studies in hemato-logic disorders have been confined to cell line models.
In this study, we have used an MS-based phosphotyrosineprofiling approach to characterize activated TK signaling inpatient-derived xenografts (PDX) of high-risk pediatric ALLpatients. Integrating a "spike-in" SILAC approach, we mappedclose to 1900 class I phosphosites with >0.75 localization prob-ability and 99% confidence in 16 PDXs, of which 1394 tyrosinephosphorylated sites had a heavy SILAC partner that allowedquantification. In particular, individual PDXs with ABL1, FLT3,and JAK mutations with aberrant kinase signaling were targetedwith commercially available TK inhibitors (TKI) both in vitro andin vivo. Aberrant ABL1 kinase signaling observed in a Phþ-ALL anda PDX with high phospho-ABL1 (harboring a NUP214-ABL1translocation) indicated dasatinib treatment and a significantdelay in disease progression was achieved in these PDXs. Simi-larly, the uniquely activated FLT3 in one PDX correlated with anobjective response to the multikinase inhibitor sunitinib. Thus,this study demonstrates an important step forward in the pre-clinical utility of an unbiased and quantitative tool to identifyaberrant TK signaling in high-risk ALL PDXs and highlights itspotential to identify tractable drug targets.
Materials and MethodsPatient-derived xenografts and sample preparation
All PDX studies had received prior approval from the respectiveinstitute's Human Research Ethics Committees and Animal Careand Ethics Committees. Continuous xenografts from childhoodALL biopsies (demographics detailed in Table 1) were establishedin immunodeficient mice as described previously (19, 20).Spleens with >95% infiltration of human leukemic cells wereharvested and mononuclear cells were used for sample prepara-tion. Methods for PDX engraftment and proteomic sample prep-aration are detailed in Supplementary Materials and Methods.
Cell culture and SILAC labelingThe JURKAT (T-ALL),NALM-6 (BCP-ALL),MUTZ-5, andMHH-
CALL-4 (JAK mutated/CRLF2 high BCP-ALL) cell lines were usedin this study to represent amixedpopulation of T-, BCP-, and JAK-mutated samples, and had been validated by STR analysis nomore than 3 months before use. Detailed culture conditions andSILACMIX preparation are described in Supplementary Materialsand Methods.
Phosphopeptide immunoprecipitationLysates from the PDX samples were spikedwith SILACMIX and
were reduced, alkylated, and trypsin digested as previouslydescribed (21, 22). Purified and lyophilized peptides were immu-noenriched using P-Tyr-100 antibody as described previously (14,18, 23). Enriched phosphotyrosine peptides were subjected toTiO2-based phosphopeptide enrichment using TiO2 microcol-
umns (GL Sciences) as described by Larsen and colleagues (24)following the manufacturer's protocol to facilitate removal ofantibody fragments and nonphosphorylated peptides that coe-lute in the elution step. Detailed methods of phosphopeptideimmunoprecipitation with SILAC-spiked PDX samples and TiO2microcolumn clean-up are described in Supplementary Materialsand Methods.
Mass spectrometry and data analysisMass spectra of phosphotyrosine immuno-purified peptides
were generated in an Orbitrap Velos (Thermo Electron) massspectrometer. Raw mass spectrometric files were analyzed inMaxQuant (25) version 1.3.0.5 for feature detection, proteinidentification, and quantification using the integrated Androm-eda search engine for database searching (26). Methods for liquidchromatography, MS, MaxQuant search criteria, protein identifi-cation, and quantification are detailed in the SupplementaryMaterials and Methods.
In vitro cytotoxicity assays and immunoblottingCryopreserved PDX cells were thawed at 37�C and washed
in RPMI1640 media (Invitrogen) supplemented with 10% FCS,100 U/mL penicillin, 100 mg/mL streptomycin, and 2 mmol/L L-glutamine. After centrifugation (500� g, 5minutes) and a secondwash, cell density, and viability were calculated following anexclusion assay using 0.4% Trypan blue (Sigma-Aldrich). Cellswere resuspended at the appropriate cell density (4–5� 105 cells/well) in QBSF-60/F [containing QBSF-60 media (Quality Biolog-ical) supplemented with 20 ng/mL Fms-like tyrosine kinase 3ligand (Flt-3L; ProSpec), 100 U/mL penicillin, 100 mg/mL strep-tomycin, and 2mmol/L L-glutamine]. For ETP-1 and ETP-8 PDXs,themediawere additionally supplementedwith 10ng/mL recom-binant human IL7 (Jomar Biosciences).
All drugs were obtained from Selleck Chemical, serially dilutedin QBSF-60/F, and 20 mL added to wells in triplicate to give finaldrug concentrations of 1 pmol/L to 10 mmol/L. Following a 48-hour incubation at 37�C/5% CO2, 15 mL of Alamar Blue[containing 75 mg resazurin, 12.5 mg methylene blue, 164.5 mgpotassium hexocyanoferrate (III) and 211 mg potassium hexa-cyanoferrate (II) trihydrate (Sigma Aldrich) in 500 mL PBS] wasadded to each well (27). Fluorescence was measured (560 nmexcitation, 590 nm emission) on a Victor X3 Multilabel PlateReader (PerkinElmer) immediately following the addition ofAlamar blue and at 6-hour postaddition. The 0-hour read wassubtracted from the 6-hour read and all readings were normalizedas a percentage of the corresponding control well. The experimentwas repeated as above for three biologic replicates for each PDXoron three passages of the cells lines to give a biologic triplicateresult. Dose–response curves were graphed and IC50 values cal-culated by GraphPad Prism 6 software (http://www.graphpad.com/scientific-software/prism/). Dephosphorylation of phos-phorylated kinase targets post inhibitor treatment was validatedusing immunoblotting (detailed in the Supplementary Materialsand Methods).
In vivo drug efficacyFor ruxolitinib efficacy studies, mice were randomized to
treatment or vehicle (4–7 mice per arm) once xenografts hadengrafted with sufficient disease burden to detect >1% peripheralhuman cCD3þ blasts. Ruxolitinib (INCB018424) was adminis-tered for the entire 3-week treatment period in chow formulation
Quantitative Phosphotyrosine Profiling in Leukemia Xenograft
www.aacrjournals.org Cancer Res; 76(9) May 1, 2016 2767
on May 6, 2018. © 2016 American Association for Cancer Research. cancerres.aacrjournals.org Downloaded from
Published OnlineFirst March 9, 2016; DOI: 10.1158/0008-5472.CAN-15-2786

Xe
nogr
aft
Age
at
diag
nosi
s (y
ears
) Se
x A
LL
subt
ype
Cyt
ogen
etic
s D
isea
se s
tatu
s at
bi
opsy
M
olec
ular
lesi
ons
B-ALL
CR
EB
BP
D14
81H
; EP
300
Q22
68de
l; FL
T3 Y
572S
; MA
PK
8IP
3 D
789N
; NT5
C2
Rel
apse
N
orm
al
BC
P
F 5.
5 A
LL-2
R
238W
; NTR
K1
G18
E; Z
NF7
46 R
31H
t(9
;22)
, BCR-ABL1
B
CP
M
8.
9 A
LL-4
B
AI1
V53
6I; B
CR
E55
2G; R
EC
QL4
A23
9V; T
MP
RS
S2
K35
3M; Z
BTB
32 P
438L
D
iagn
osis
t(17;
19), E2A-HLF
B
CP
M
7.
4 A
LL-7
N
o va
lidat
ed m
utat
ions
D
iagn
osis
ALG
8 R
41Q
; EP
HA
5 S
810G
; FA
NC
F P
117T
; MLH
1 Q
460K
; MYO
3A R
1495
Q; N
RA
S
Dia
gnos
is
Nor
mal
B
CP
F
8.11
A
LL-1
7 G
12D
; RE
CQ
L4 R
872K
; RU
NX1
Q37
0R
CS
MD
3 H
2714
fs; C
XC
R4
F342
fs; F
AT1
V29
5M; K
RA
S L
23R
; NU
P21
4 N
1404
fs
Rel
apse
N
orm
al
BC
P
M
16.2
A
LL-1
9
Ph-like-ALL
Dia
gnos
is
NA
P
h-lik
e M
13
.9
PA
KH
ZT
JAK
2 R
867Q
; IG
H@
-CR
LF2;
CD
KN
2A/B
del
JAK
2 R
683G
; IG
H@
-CR
LF2;
IKZF
1del
; PA
X5d
el, C
DK
N2A
del
Dia
gnos
is
NA
P
h-lik
e M
N
A
PA
LLS
D
Dia
gnos
is
46,X
Y
Ph-
like
M
7.9
PA
MD
RM
JA
K2
GP
insI
682;
IGH
@-C
RLF
2; IK
ZF1d
el; E
BF1
del;
PA
X5
V31
9fs;
CD
KN
2A/B
del
T-ALL
ALK
E14
35de
l; A
SX
L1 D
863G
; BR
CA
2 C
1290
Y; C
3orf3
5 A
29T;
EP
HA
7 K
941Q
; R
elap
se
Nor
mal
T
M
12.8
A
LL-8
FB
XW
7 R
465C
; KD
M6A
A30
T; N
T5C
2 R
367Q
; SC
N5A
R48
1W; S
MA
RC
A4
R11
89Q
C
RE
BB
P S
1934
P; F
BX
W7
R47
9Q; N
OTC
H1
L167
8P; P
IK3C
D C
416R
; RB
M28
D
iagn
osis
N
orm
al
T M
8.
6 A
LL-2
7 Y3
63F
BA
I1 Q
440R
; BC
L11B
G34
fs; E
PH
B3
A49
8T; F
AT1
G85
5R; J
AK
1 M
206K
; NO
TCH
1 D
iagn
osis
N
orm
al
T M
4.
9 A
LL-2
9 P
2514
fs; N
OTC
H1
R15
98P
; PIK
3R5
G61
2S; S
MYD
1 A
107E
46
,XY
,del
(6)(
q21)
,del
(1T
M
10.2
A
LL-3
1 1)
(q23
)[4]/4
6,X
Y[14
] D
iagn
osis
FBX
W7
15_1
6TR
>TLR
; HU
S1
R33
H; L
IPM
T33
6N; P
TEN
NS
GP
TRR
ED
228f
s
NA
D
iagn
osis
N
orm
al
T M
2.
7 A
LL-4
2
ETP-ALL
EZH
2 S
651L
; RU
NX
1 T1
48fs
; NO
TCH
1 S
2492
*; IK
ZF1
SV
; PH
F6 N
147f
s; S
UZ1
2 D
iagn
osis
N
A
ETP
M
16
E
TP-1
2 C
350R
; WT1
C35
0R L
564_
S56
8; S
H2B
3 S
V
EE
D S
259F
D
iagn
osis
N
A
ETP
M
3
ETP
-13
DN
M2
K557
_K55
8>K
; JA
K3
M51
1I; W
T1R
370f
s; C
TCF
SV
D
iagn
osis
N
A
ETP
M
8
ETP
-1
EC
T2L
E12
_spl
ice
and
W44
0G; G
ATA
3 A
310_
A31
4>A
, R27
6Q; J
AK
1 E
1012
>EK
; D
iagn
osis
N
A
ETP
F
19
ETP
-8
SH
2B3
V65
A, I
257T
Table
1.Clinical
andmolecularfeatures
ofthepatient-derived
xeno
graftpan
el
NOTE:M
olecularlesions
wereiden
tified
usingexomeseque
ncingfortheBCP-A
LLan
dT-A
LLgroup
s.Ph-likean
dETP-A
LLmolecularlesions
werepreviouslyreported
[Robertset
al.2012
(12)
andMau
deet
al.2015
(28),respective
ly].
Abbreviations:NA,n
otavailable;M,m
ale;
F,fem
ale;
m,m
utation;
del,d
eletion;
SV,structuralvariation;
fs,frameshift.
Dolai et al.
Cancer Res; 76(9) May 1, 2016 Cancer Research2768
on May 6, 2018. © 2016 American Association for Cancer Research. cancerres.aacrjournals.org Downloaded from
Published OnlineFirst March 9, 2016; DOI: 10.1158/0008-5472.CAN-15-2786

provided by Incyte. Studies were terminated and mice wereeuthanized after 3 weeks of treatment, when vehicle-treated micebecame ill according to standard parameters set on the Institu-tional Animal Care and Use Committee protocol. Spleen washarvested at the time of euthanasia. Disease burden was assessedevery 7 to 14 days by flow cytometric measurement of humancCD3þ blast count in peripheral blood, using CountBright abso-lute counting beads (Invitrogen) as described in the manufac-turer's instructions, and at euthanasia, by measuring absolutesplenic blasts (total splenic cell count�%human cCD3þ/CD45þ
cells) as we have described previously (28).
Gene expression analysisRNA samples were used to prepare cRNA with Illumina Total
Prep RNA Amplification Kit (Life Technologies). cRNA was thenhybridized to Illumina Human Beadchip HT12 Arrays. Geneexpression datasets were analyzed using GenePattern v3.2.3 aswe have described previously (29). Gene expression heatmapswere generated using GenePattern, whereby the range of colorcoding extends fromminimum tomaximum values per gene (perrow). In each case, red indicates high, and blue low, level ofexpression. Unsupervised hierarchical clustering was performedusing the Hierarchical Clustering module in GenePattern usingthe entire 47,323 probes representative of 34,694 genes present inthe Illumina Human Beadchip HT12 Arrays. Gene expressiondatasets can be accessed at www.ncbi.nlm.nih.gov/geo (accessionno. GSE52991, GSE57795, GSE74460).
ResultsPhosphotyrosine profiling in PDX models of pediatric ALL
To characterize the global tyrosine phosphorylation status inpediatric ALL PDXs, we adopted an immunoaffinity profiling ofphosphotyrosine peptides protocol as described previously (14,15, 18). Patient demographics of the 16 PDXs, along with theirsubtype classification and key molecular lesions, are listedin Table 1.
To initially establish the immunoaffinity profiling in PDXmodels, two T-ALL (ALL-8, ALL-31) and two BCP-ALL (ALL-17,ALL-19) PDXs were selected. Using the phosphotyrosine immu-noaffinity profiling method, we identified 540 Class I phospho-tyrosine sites along with 61 phosphoserine and 49 phospho-threonine sites (Supplementary Table S1). These sites correlatedto 424 phosphoproteins, of which 17% were kinases (Supple-mentary Fig. S1A). This method enabled us to identify phosphor-ylation on all the key TKs that have been reported in T-cellsignaling pathways in the two T-ALL PDXs, ALL-8, and ALL-31(30). For example, ZAP70 and LCK (Supplementary Fig. S1B)were identified alongwith other T-cell–associated signalingmole-cules CD3, CD247, LAT, GRAP2, and SH2D2A (highlighted inyellow in Supplementary Table S1). ZAP70 is an essential kinasein T-cell signaling and its phosphorylation is indicative of recruit-ment of other T-cell signaling proteins (LCK, LAT; ref. 16).
As expected, phosphorylation at the T-cell–specific siteswas notobserved in the BCP-ALL PDXs, in which the identified phospho-tyrosine sites were primarily B-cell signaling molecules. The TKsSYK, BTK, and LYN were highly phosphorylated in the BCP-ALLPDXs (Supplementary Fig. S1B; Supplementary Table S1; redhighlight). ALL-19 was the only BCP-ALL PDX with markedlyelevated tyrosine phosphorylation of ABL1 kinase. We thenplotted the combined intensity of all phosphorylated tyrosine
sites in a TK against the total intensity of all the identified TKs inthat PDX (Supplementary Fig. S1B). The pie charts clearly showthe distinction between the T- and BCP-ALL PDXs based on theintensity of TK-specific tyrosine phosphorylated peptides. Thephosphotyrosine sites of the TKs identified either in T-ALL or inthe BCP-ALL PDXs are listed in Supplementary Table S2.
Quantitative phosphotyrosine profilingTo compare phosphotyrosine profiles across multiple PDXs,
we undertook developing a more quantitative analysis method.The immunoaffinity protocol optimized for the PDX modelswas combined with a "spike in" SILAC (21, 31) approach togenerate a quantitative phosphotyrosine profile of high-riskpediatric ALL. Figure 1 shows a schematic of the quantitativephosphotyrosine profiling approach in PDX models of ALL. Asprofiling of phosphotyrosine sites in cellular signaling is com-pounded with artifacts when clinical sample processing isdelayed or when samples are frozen (32), extra care was takenfor extraction of proteins under optimal conditions from fresh-ly harvested human mononuclear cells from mice spleens. Infact, we compared phosphotyrosine enrichment of freshlyprocessed ALL-2 PDX cells with that of frozen ALL-2 PDX cellsthat were stored in liquid nitrogen in a FBSþ10% DMSOmedium. Both the frozen and fresh ALL-2 PDX samples werethe same in all respects (generated from the same patientbiopsy and harvested from mice at the same passage number)with freezing being the only variable. As expected, the numberof class I phosphotyrosine sites was reduced by 80% in frozensamples compared with freshly harvested ALL-2 spleens (Sup-plementary Fig. S2A). Furthermore, as a novel heterozygousFLT3 mutation (c.1715A>C; p.Y572S) was observed in the ALL-2 PDX, we tracked the tyrosine phosphorylated sites on FLT3. Inthe fresh ALL-2 samples, two autophosphorylated FLT3 sites(Y842 and Y969) were identified compared with only one(Y842) in the frozen ALL-2 samples. Moreover the intensityof the Y842 site was a third in frozen samples compared withfreshly lysed samples (Supplementary Fig. S2B). All the PDXsamples used in this study were freshly harvested and lysedunder optimal conditions using appropriate phosphatase andprotease inhibitors.
As all PDX samples were spikedwith equal concentration of theheavy labeled internal standard, the light (PDX) to heavy (SILAC)ratio generated for each of the enriched phosphopeptides enabledan accurate indication of their relative abundance. This allowed adirect comparison of phosphopeptide abundance between dif-ferent ALL PDXs relative to the SILAC standard. To ensure theamount of heavy labeled phosphopeptide enriched during theimmunoaffinity process was sufficient to provide quantitativeinformation on the light phosphopeptides enriched from thePDX sample, different ratios of starting material and "spike-in"standard were initially tested (Supplementary Fig. S3) and theoptimized 20:1(PDX:SILAC) ratio was then used to generatequantitative phosphotyrosine profiling data on a panel of 16PDXs, including 4BCP-ALL, 5 T-ALL, 4ETP-ALL, and3Ph-likeALL(Table 1).
Enriched phosphopeptides from at least two technicalreplicates for each PDX (up to 4 replicates for some) wereidentified by MS. Using this quantitative phosphotyrosinemethod, we mapped in total 1,912 class I phosphosites(1,375 phosphotyrosine, 376 phosphoserine, and 161 phos-phothreonine) with >0.75 localization probability and 99%
Quantitative Phosphotyrosine Profiling in Leukemia Xenograft
www.aacrjournals.org Cancer Res; 76(9) May 1, 2016 2769
on May 6, 2018. © 2016 American Association for Cancer Research. cancerres.aacrjournals.org Downloaded from
Published OnlineFirst March 9, 2016; DOI: 10.1158/0008-5472.CAN-15-2786

confidence (Supplementary Table S3). Of these, 1,394 class Iphosphosites (73%) had a heavy partner intensity thatallowed quantification (Supplementary Table S4). The num-ber of phosphosites identified and quantified in each of thePDXs is represented in Supplementary Fig. S4. Marked differ-ences were observed in the number of class I phosphositesthat were identified in each of the different subgroups.Although the highly aggressive ETP-ALL and the Ph-like ALLPDXs had higher number of phosphosites ranging from 400to 850, the other T-ALL and BCP-ALL PDXs had phosphositesranging from 250 to 400 (Supplementary Fig. S4).
Hierarchical clustering based on the average normalizedratios of all quantified phosphotyrosine sites (SupplementaryTable S4) for each PDX revealed clustering into two distinctgroups broadly based on B and T lineage (Fig. 2A), with thestem cell-like ETP-ALL clustering either with the B lineage (ETP-12 and ETP-1) or with the T lineage (ETP-13 and ETP-8). In theBCP-ALL group, the Phþ-ALL, ALL-4 clustered independently of
the remaining PDXs. Notably, segregating the molecularlydefined ETP, Ph-like, and Phþ-ALL PDXs and reclustering themresulted in grouping according to their subtype (SupplementaryFig. S5). Furthermore, the distinct clustering into the B and Tlineages was also validated by gene expression profiling. Unsu-pervised hierarchical clustering of basal gene expression pro-files of 14 PDXs revealed two broad branches reflecting eachleukemia subtype (Supplementary Fig. S6A).
Quantitative analysis of TK phosphotyrosine sitesUnsupervised hierarchical clustering was performed to identify
PDX clustering patterns based on the identified phosphotyrosinesites on TKs. As shown in Fig. 2B, the 16 PDXs clustered into twobroad groups, separating the BCP-ALL from the T-ALL and adistinct group consisting of the highly aggressive ETP-ALL andPh-like ALLs. The only exception was ETP-8, which clustered withthe T-ALLs. Unsupervised hierarchical clustering of TKs by micro-array analysis of gene expression in 14 PDXs also showed two
Mononuclear cellsfrom childhood ALLBM or PB biopsies
Mouse spleen
>95%Human CD45+
Ficoll gradient centrifugation
SILAC Spike inCell lysate
Reduction; Alkylation
Trypsin digestion
Desalting (Sep-Pak)
Lyophilize
8M UreaNa3VO4
Mouse CD45+
Jurkat NALM-6
SILAC MIX1:1:1:1
pY-100
Phosphopeptideenrichment (TiO2)
Protein A/G
MUTZ-5 MHH-CALL4
Hum
an C
D45
+
Figure 1.Schematic representation of "spike-in"SILAC quantitative phosphotyrosineprofiling method developed for PDXmodels of pediatric ALL. Mouse spleenswith >95% human CD45þ cells areenriched by Ficoll gradientcentrifugation and lysed using8 mol/L urea. The cleared lysates arespiked with SILAC mix beforereduction, alkylation, and trypsindigestion. The purified peptides arethen lyophilized and immunoaffinityenriched for tyrosine phosphopeptidesusing pY-100 antibody-bound proteinA/G beads. Eluted phosphopeptidesare filtered through TiO2microcolumnsbefore mass spectrometric analysis.BM, bonemarrow; PB, peripheral blood.
Dolai et al.
Cancer Res; 76(9) May 1, 2016 Cancer Research2770
on May 6, 2018. © 2016 American Association for Cancer Research. cancerres.aacrjournals.org Downloaded from
Published OnlineFirst March 9, 2016; DOI: 10.1158/0008-5472.CAN-15-2786

broad groups, separating the T-ALL PDXs from the BCP-ALL andPh-like ALLs,with one ETP-ALL clustering eachwith the T-ALL andBCP-ALL clusters (Supplementary Fig. S6B).
Analysis of individual PDXs revealed that in the Phþ-ALL, ALL-4the TKs ABL1 (Y469, Y393), DDR1 (Y792, Y796) and PTK2B(Y579, Y580) showed the highest levels of tyrosine phosphory-lation, along with BTK, CSK, FYN, and EPHB4 (Fig. 2B; Supple-mentary Table S5). Similarly, the receptor TK (RTK) ZAP70phosphosites (Y493, Y292 and Y248) were uniquely present inthe ETP group with Y248 having the highest level of phosphor-ylation in ETP-12, ETP-13, and ETP-1 (Supplementary Table S5).Y493 and Y292 have previously been reported as autophosphor-ylation sites responsible for the complete activation of ZAP70 bydisplacing the activation loop from the catalytic site (33). Fur-thermore, in the ETP group, ETP-8 had the highest levels ofphosphorylation of the JAK1 autophosphorylation phosphositesY1034/35, which could be a post translational effect of theactivating JAK1 mutations described by Zhang and colleagues inETP-ALL (10).
In the Ph-like ALL group, the TKs with the highest levels oftyrosine phosphorylation included INSR, JAK1, JAK2, LYN, FYN,SYK, andLCK(Fig. 2B; SupplementaryTable S5). TheRTK INSRhaspreviouslybeen reported tobe involved inpre-B leukemia (34)andthis kinase had the highest level of phosphorylation in this groupwith phosphorylation at five different sites (Y1190, Y1189, Y1185,Y1355, and Y1361). Conversely, Y842 FLT3 was unique toPAMDRM across the entire panel, whereas the Y570 site in JAK2
and the Y702 site in AXLwere unique to PALLSD. PALLSDalso hadY209HCK, Y344BTK, Y145DYRK1A, and Y188BLKphosphositesunique to itself. A complete list of all the TK phosphotyrosine sitesthat were identified in the ETP-ALL, Ph-like, and Phþ-ALL PDXs isshown in Fig. 2B and Supplementary Table S5.
As anticipated, the highest levels of TK phosphotyrosine sites inT-ALL PDXs included ZAP70, LCK, and FYN, with none of theseidentified in the BCP-ALL PDXs (Fig. 2B). In fact, the Y420 site ofFYN that regulates T-cell receptor signaling by autophosphoryla-tion was present at very high levels in all five T-ALL PDXscompared with the BCP-ALLs. Within the BCP-ALLs, ALL-19 hadthe highest level of phosphotyrosine sites on ABL1 (Y393), LYN(Y194, Y193), INSR (Y1189, Y1185), and JAK2 (Y1007). Inparticular, the autophosphorylation site Y1007 of JAK2 wasuniquely observed in ALL-19, whereas the RTK FLT3 and thenonreceptor TK (nRTK) TYK2 were uniquely identified in ALL-2.Both of the identified FLT3 phosphosites in ALL-2 (Y842 andY969) are key autophosphorylation sites for kinase signalingactivation (35). The profound differences in levels of pTyr sitephosphorylation of TKs (ABL1, FLT3 and JAK1) and key signalingsubstrates could not be explained by mere differences in geneexpression levels (Supplementary Fig. S7).
Dysregulated phosphotyrosine sites as drug targetsWe further investigated altered tyrosine phosphorylation in
pediatric ALL PDXs to assess the therapeutic potential of specificTKIs. Immunoblot analyses were performed to validate activated
Figure 2.Unsupervised hierarchical clustering of Class I phosphosites in 16 pediatric ALL PDXs. A, hierarchical clustering based on the average normalized ratios (PDX/SILAC)of all quantified tyrosine phosphorylated sites enriched by immunoaffinity profiling in 16 PDXs (ETP-ALL, green; Ph-like-ALL, yellow; BCP-ALL, red;and T-ALL, blue subtypes). B, clustering based on the average normalized ratios (PDX/SILAC) of TK tyrosine phosphorylation sites. The colors in the heatmapsrepresent the relative expression per phosphosite across all samples. Red, relative high (PDX/SILAC) ratio; blue, relative low ratio.
Quantitative Phosphotyrosine Profiling in Leukemia Xenograft
www.aacrjournals.org Cancer Res; 76(9) May 1, 2016 2771
on May 6, 2018. © 2016 American Association for Cancer Research. cancerres.aacrjournals.org Downloaded from
Published OnlineFirst March 9, 2016; DOI: 10.1158/0008-5472.CAN-15-2786
sites and their dephosphorylation uponTKI treatment, and in vitrocytotoxicity assays and/or in vivo efficacy experiments were per-formed to determine drug efficacy.
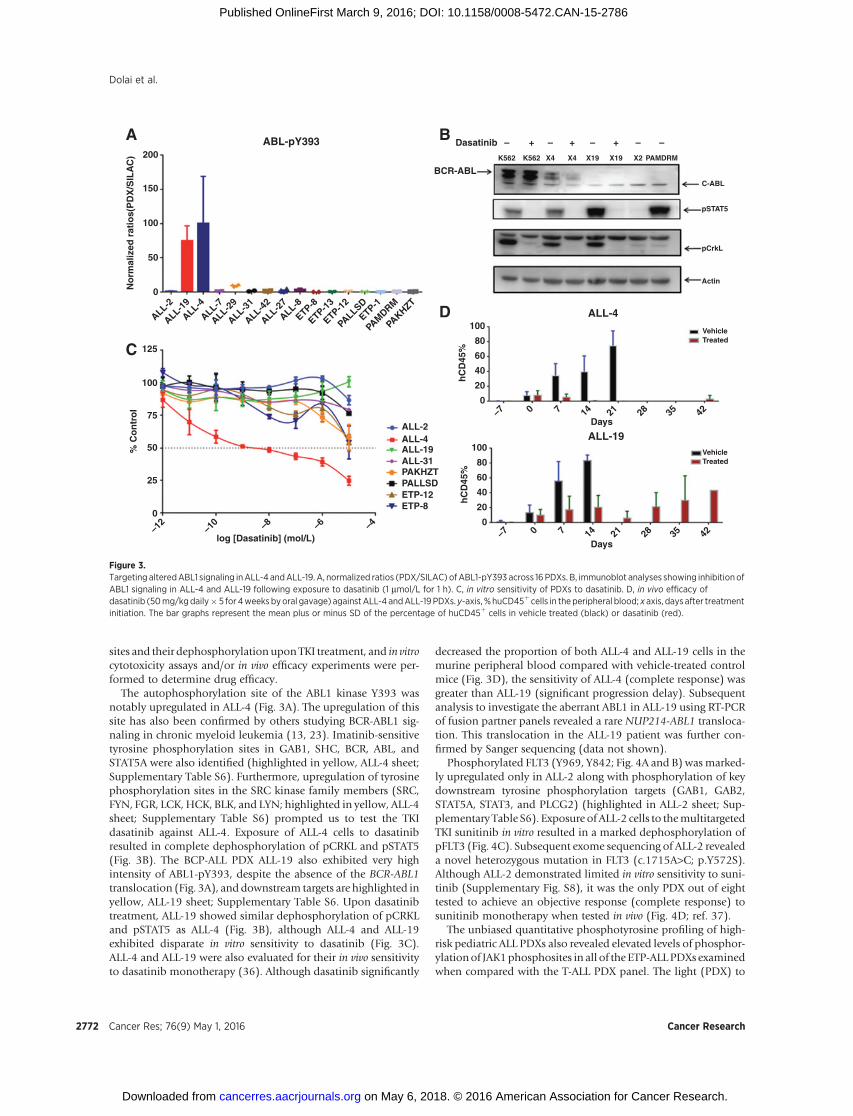
The autophosphorylation site of the ABL1 kinase Y393 wasnotably upregulated in ALL-4 (Fig. 3A). The upregulation of thissite has also been confirmed by others studying BCR-ABL1 sig-naling in chronic myeloid leukemia (13, 23). Imatinib-sensitivetyrosine phosphorylation sites in GAB1, SHC, BCR, ABL, andSTAT5A were also identified (highlighted in yellow, ALL-4 sheet;Supplementary Table S6). Furthermore, upregulation of tyrosinephosphorylation sites in the SRC kinase family members (SRC,FYN, FGR, LCK, HCK, BLK, and LYN; highlighted in yellow, ALL-4sheet; Supplementary Table S6) prompted us to test the TKIdasatinib against ALL-4. Exposure of ALL-4 cells to dasatinibresulted in complete dephosphorylation of pCRKL and pSTAT5(Fig. 3B). The BCP-ALL PDX ALL-19 also exhibited very highintensity of ABL1-pY393, despite the absence of the BCR-ABL1translocation (Fig. 3A), and downstream targets are highlighted inyellow, ALL-19 sheet; Supplementary Table S6. Upon dasatinibtreatment, ALL-19 showed similar dephosphorylation of pCRKLand pSTAT5 as ALL-4 (Fig. 3B), although ALL-4 and ALL-19exhibited disparate in vitro sensitivity to dasatinib (Fig. 3C).ALL-4 and ALL-19 were also evaluated for their in vivo sensitivityto dasatinib monotherapy (36). Although dasatinib significantly
decreased the proportion of both ALL-4 and ALL-19 cells in themurine peripheral blood compared with vehicle-treated controlmice (Fig. 3D), the sensitivity of ALL-4 (complete response) wasgreater than ALL-19 (significant progression delay). Subsequentanalysis to investigate the aberrant ABL1 in ALL-19 using RT-PCRof fusion partner panels revealed a rare NUP214-ABL1 transloca-tion. This translocation in the ALL-19 patient was further con-firmed by Sanger sequencing (data not shown).
Phosphorylated FLT3 (Y969, Y842; Fig. 4A and B) wasmarked-ly upregulated only in ALL-2 along with phosphorylation of keydownstream tyrosine phosphorylation targets (GAB1, GAB2,STAT5A, STAT3, and PLCG2) (highlighted in ALL-2 sheet; Sup-plementary Table S6). Exposure of ALL-2 cells to themultitargetedTKI sunitinib in vitro resulted in a marked dephosphorylation ofpFLT3 (Fig. 4C). Subsequent exome sequencing of ALL-2 revealeda novel heterozygous mutation in FLT3 (c.1715A>C; p.Y572S).Although ALL-2 demonstrated limited in vitro sensitivity to suni-tinib (Supplementary Fig. S8), it was the only PDX out of eighttested to achieve an objective response (complete response) tosunitinib monotherapy when tested in vivo (Fig. 4D; ref. 37).
The unbiased quantitative phosphotyrosine profiling of high-risk pediatric ALL PDXs also revealed elevated levels of phosphor-ylationof JAK1phosphosites in all of the ETP-ALLPDXs examinedwhen compared with the T-ALL PDX panel. The light (PDX) to
ABL-pY393200
A B
C
D
Dasatinib –
K562 K562 X4 X4 X19 X19 X2 PAMDRM
C-ABL
pSTAT5
pCrkL
Actin
Vehicle
ALL-4
ALL-19
Treated
VehicleTreated
+ + +– – – –
BCR-ABL
150
100
No
rmal
ized
rat
ios(
PD
X/S
ILA
C)
50
0
100
80
60
hC
D45
%
40
20
0
100
80
60
hC
D45
%
40
20
0
Days
Days
–7
0
25
50
ALL-2ALL-4ALL-19ALL-31PAKHZTPALLSDETP-12ETP-8
% C
on
tro
l
log [Dasatinib] (mol/L)
75
100
125
–12
–10 –8 –6 –4
0 7 14 21 28 35 42
–7 0 7 14 21 28 35 42
ALL-2
ALL-19
ALL-4
ALL-7
ALL-29
ALL-31
ALL-42
ALL-27
ALL-8
ETP-8
ETP-13
ETP-12
ETP-1
PALLSD
PAMDRM
PAKHZT
Figure 3.Targeting alteredABL1 signaling inALL-4 andALL-19. A, normalized ratios (PDX/SILAC) ofABL1-pY393 across 16 PDXs. B, immunoblot analyses showing inhibitionofABL1 signaling in ALL-4 and ALL-19 following exposure to dasatinib (1 mmol/L for 1 h). C, in vitro sensitivity of PDXs to dasatinib. D, in vivo efficacy ofdasatinib (50mg/kgdaily� 5 for 4weeks byoral gavage) against ALL-4 andALL-19PDXs. y-axis, %huCD45þ cells in theperipheral blood; x axis, days after treatmentinitiation. The bar graphs represent the mean plus or minus SD of the percentage of huCD45þ cells in vehicle treated (black) or dasatinib (red).
Dolai et al.
Cancer Res; 76(9) May 1, 2016 Cancer Research2772
on May 6, 2018. © 2016 American Association for Cancer Research. cancerres.aacrjournals.org Downloaded from
Published OnlineFirst March 9, 2016; DOI: 10.1158/0008-5472.CAN-15-2786
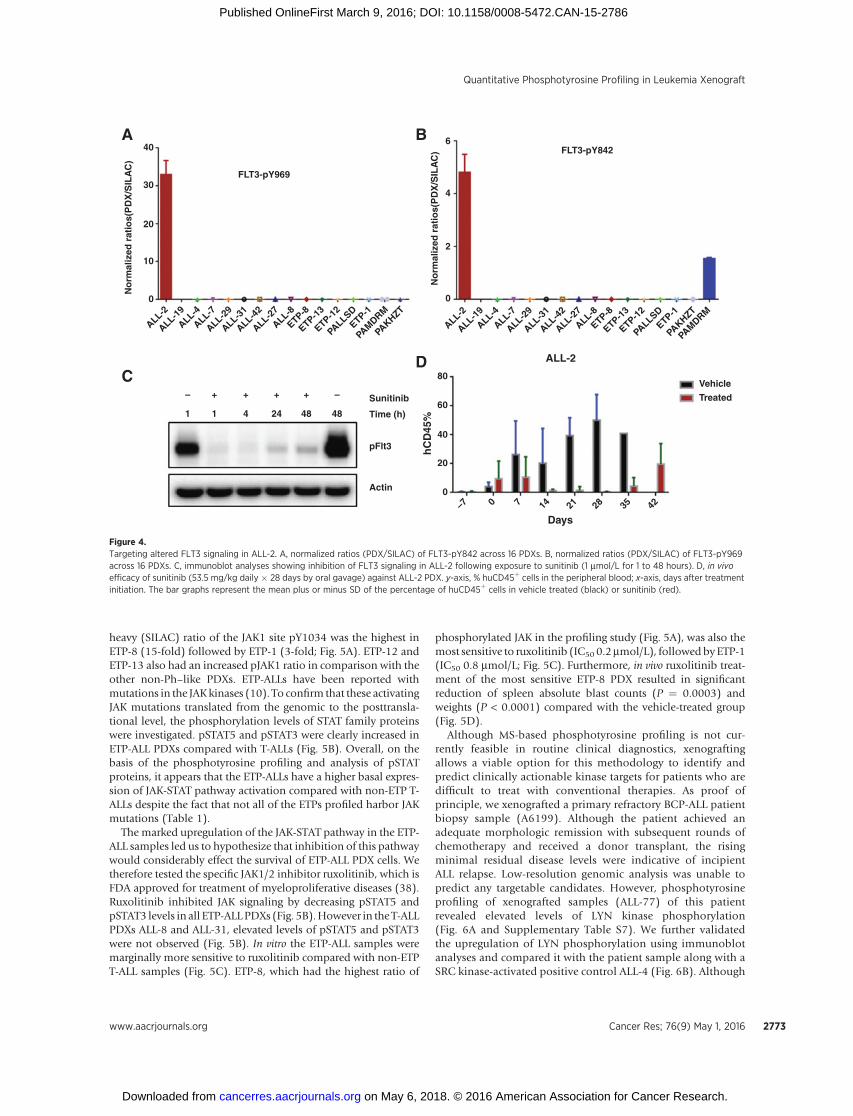
heavy (SILAC) ratio of the JAK1 site pY1034 was the highest inETP-8 (15-fold) followed by ETP-1 (3-fold; Fig. 5A). ETP-12 andETP-13 also had an increased pJAK1 ratio in comparison with theother non-Ph–like PDXs. ETP-ALLs have been reported withmutations in the JAKkinases (10). To confirm that these activatingJAK mutations translated from the genomic to the posttransla-tional level, the phosphorylation levels of STAT family proteinswere investigated. pSTAT5 and pSTAT3 were clearly increased inETP-ALL PDXs compared with T-ALLs (Fig. 5B). Overall, on thebasis of the phosphotyrosine profiling and analysis of pSTATproteins, it appears that the ETP-ALLs have a higher basal expres-sion of JAK-STAT pathway activation compared with non-ETP T-ALLs despite the fact that not all of the ETPs profiled harbor JAKmutations (Table 1).
The marked upregulation of the JAK-STAT pathway in the ETP-ALL samples led us to hypothesize that inhibition of this pathwaywould considerably effect the survival of ETP-ALL PDX cells. Wetherefore tested the specific JAK1/2 inhibitor ruxolitinib, which isFDA approved for treatment of myeloproliferative diseases (38).Ruxolitinib inhibited JAK signaling by decreasing pSTAT5 andpSTAT3 levels in all ETP-ALLPDXs (Fig. 5B).However in the T-ALLPDXs ALL-8 and ALL-31, elevated levels of pSTAT5 and pSTAT3were not observed (Fig. 5B). In vitro the ETP-ALL samples weremarginally more sensitive to ruxolitinib compared with non-ETPT-ALL samples (Fig. 5C). ETP-8, which had the highest ratio of
phosphorylated JAK in the profiling study (Fig. 5A), was also themost sensitive to ruxolitinib (IC50 0.2mmol/L), followed byETP-1(IC50 0.8 mmol/L; Fig. 5C). Furthermore, in vivo ruxolitinib treat-ment of the most sensitive ETP-8 PDX resulted in significantreduction of spleen absolute blast counts (P ¼ 0.0003) andweights (P < 0.0001) compared with the vehicle-treated group(Fig. 5D).
Although MS-based phosphotyrosine profiling is not cur-rently feasible in routine clinical diagnostics, xenograftingallows a viable option for this methodology to identify andpredict clinically actionable kinase targets for patients who aredifficult to treat with conventional therapies. As proof ofprinciple, we xenografted a primary refractory BCP-ALL patientbiopsy sample (A6199). Although the patient achieved anadequate morphologic remission with subsequent rounds ofchemotherapy and received a donor transplant, the risingminimal residual disease levels were indicative of incipientALL relapse. Low-resolution genomic analysis was unable topredict any targetable candidates. However, phosphotyrosineprofiling of xenografted samples (ALL-77) of this patientrevealed elevated levels of LYN kinase phosphorylation(Fig. 6A and Supplementary Table S7). We further validatedthe upregulation of LYN phosphorylation using immunoblotanalyses and compared it with the patient sample along with aSRC kinase-activated positive control ALL-4 (Fig. 6B). Although
0
– + + + + – Sunitinib
Time (h)
pFlt3
Actin 0
Days–7 0 7 14 21 28 35 42
20
40
60
hC
D45
%
80Vehicle
Treated
ALL-2
1 1 4 24 48 48
0
2
4
6
ALL-2
ALL-19
ALL-4
ALL-7
ALL-29
ALL-31
ALL-42
ALL-27
ALL-8
ETP-8
ETP-13
ETP-12
ETP-1
PALLSD
PAMDRM
PAKHZT
ALL-2
ALL-19
ALL-4
ALL-7
ALL-29
ALL-31
ALL-42
ALL-27
ALL-8
ETP-8
ETP-13
ETP-12
ETP-1
PALLSD
PAMDRM
PAKHZT
10
20
No
rmal
ized
rat
ios(
PD
X/S
ILA
C)
No
rmal
ized
rat
ios(
PD
X/S
ILA
C)
30
40
FLT3-pY969
A B
CD
FLT3-pY842
Figure 4.Targeting altered FLT3 signaling in ALL-2. A, normalized ratios (PDX/SILAC) of FLT3-pY842 across 16 PDXs. B, normalized ratios (PDX/SILAC) of FLT3-pY969across 16 PDXs. C, immunoblot analyses showing inhibition of FLT3 signaling in ALL-2 following exposure to sunitinib (1 mmol/L for 1 to 48 hours). D, in vivoefficacy of sunitinib (53.5 mg/kg daily � 28 days by oral gavage) against ALL-2 PDX. y-axis, % huCD45þ cells in the peripheral blood; x-axis, days after treatmentinitiation. The bar graphs represent the mean plus or minus SD of the percentage of huCD45þ cells in vehicle treated (black) or sunitinib (red).
Quantitative Phosphotyrosine Profiling in Leukemia Xenograft
www.aacrjournals.org Cancer Res; 76(9) May 1, 2016 2773
on May 6, 2018. © 2016 American Association for Cancer Research. cancerres.aacrjournals.org Downloaded from
Published OnlineFirst March 9, 2016; DOI: 10.1158/0008-5472.CAN-15-2786
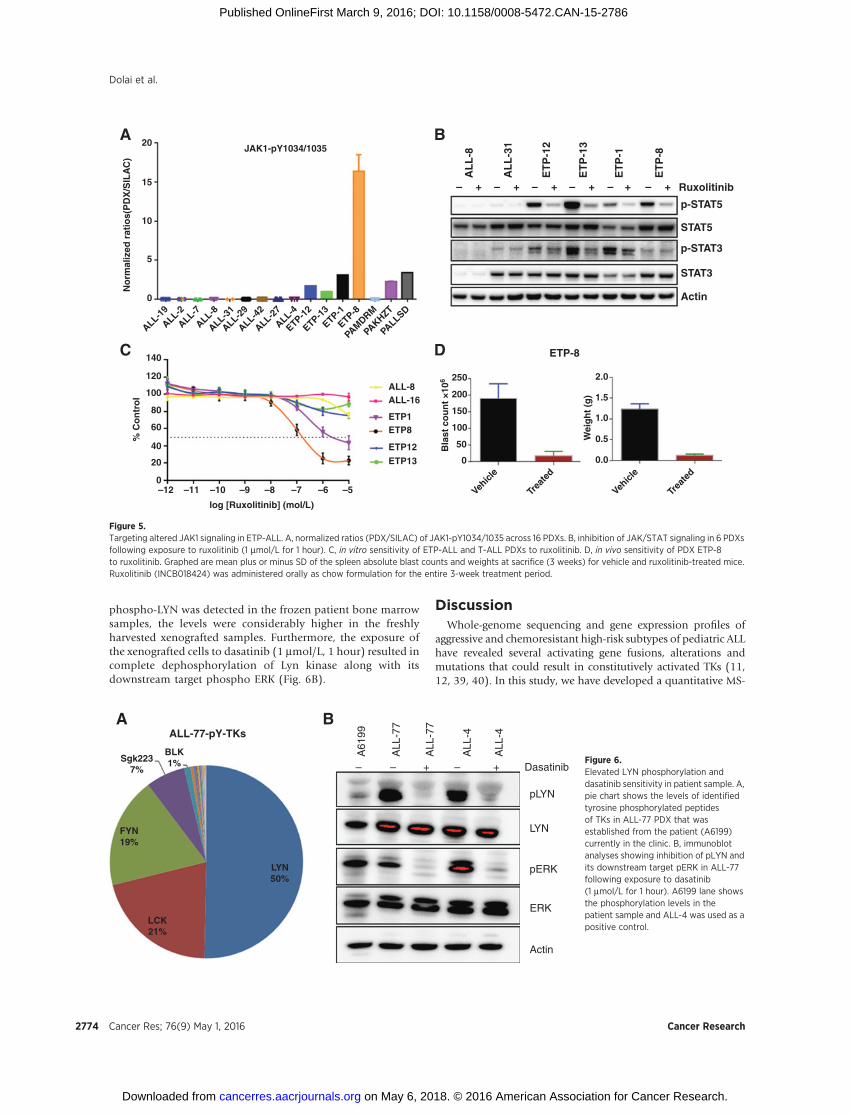
phospho-LYN was detected in the frozen patient bone marrowsamples, the levels were considerably higher in the freshlyharvested xenografted samples. Furthermore, the exposure ofthe xenografted cells to dasatinib (1 mmol/L, 1 hour) resulted incomplete dephosphorylation of Lyn kinase along with itsdownstream target phospho ERK (Fig. 6B).
DiscussionWhole-genome sequencing and gene expression profiles of
aggressive and chemoresistant high-risk subtypes of pediatric ALLhave revealed several activating gene fusions, alterations andmutations that could result in constitutively activated TKs (11,12, 39, 40). In this study, we have developed a quantitative MS-
ALL-77-pY-TKs
Dasatinib–
A61
99
ALL
-77
ALL
-77
ALL
-4
ALL
-4
– + – +
pLYN
LYN
pERK
ERK
Actin
Sgk2237%
A B
BLK1%
FYN19%
LCK21%
LYN50%
Figure 6.Elevated LYN phosphorylation anddasatinib sensitivity in patient sample. A,pie chart shows the levels of identifiedtyrosine phosphorylated peptidesof TKs in ALL-77 PDX that wasestablished from the patient (A6199)currently in the clinic. B, immunoblotanalyses showing inhibition of pLYN andits downstream target pERK in ALL-77following exposure to dasatinib(1 mmol/L for 1 hour). A6199 lane showsthe phosphorylation levels in thepatient sample and ALL-4 was used as apositive control.
0
0
0 0.0
0.5
1.0
1.5
Wei
gh
t (g
)
Bla
st c
ou
nt
×106
% C
on
tro
l
2.0
Actin
STAT3
p-STAT3
STAT5
p-STAT5
Ruxolitinib–
AL
L-8
AL
L-3
1
ET
P-1
2
ET
P-1
3
ET
P-1
ET
P-8
+ – + – + – + – + – +
Vehicl
e
Trea
ted
Vehicl
e
Trea
ted
50
100
150
200
250
–12 –11 –10
log [Ruxolitinib] (mol/L)
–9 –8 –7 –6 –5
ALL-8
ETP-8
ALL-16
ETP1ETP8
ETP12
ETP1320
40
60
80
100
120
140
5
10
15
20A B
C D
JAK1-pY1034/1035
ALL-2
ALL-19
ALL-4
ALL-7
ALL-29
ALL-31
ALL-42
ALL-27
ALL-8
ETP-8
ETP-13
ETP-12
ETP-1
PALLSD
PAMDRM
PAKHZT
No
rmal
ized
rat
ios(
PD
X/S
ILA
C)
Figure 5.Targeting altered JAK1 signaling in ETP-ALL. A, normalized ratios (PDX/SILAC) of JAK1-pY1034/1035 across 16 PDXs. B, inhibition of JAK/STAT signaling in 6 PDXsfollowing exposure to ruxolitinib (1 mmol/L for 1 hour). C, in vitro sensitivity of ETP-ALL and T-ALL PDXs to ruxolitinib. D, in vivo sensitivity of PDX ETP-8to ruxolitinib. Graphed are mean plus or minus SD of the spleen absolute blast counts and weights at sacrifice (3 weeks) for vehicle and ruxolitinib-treated mice.Ruxolitinib (INCB018424) was administered orally as chow formulation for the entire 3-week treatment period.
Dolai et al.
Cancer Res; 76(9) May 1, 2016 Cancer Research2774
on May 6, 2018. © 2016 American Association for Cancer Research. cancerres.aacrjournals.org Downloaded from
Published OnlineFirst March 9, 2016; DOI: 10.1158/0008-5472.CAN-15-2786

basedphosphotyrosine profiling approach compatiblewithbatchmode analysis of proteins obtained from pediatric ALL PDXs totrack the global phosphorylation status of TKs. By targeting theactivated kinase pathwayswith commercially available inhibitors,we have also shown that significant in vivo responses can beachieved. Overall, this study demonstrates the preclinical utilityof our approach and in particular its potential to identify novel,individualized treatments for aggressive and chemorefractorypediatric ALL.
The success of characterizing the tyrosine phosphoproteome incancer is exemplifiedby anumber ofMS-based studies (14, 15, 18,41). These studies have provided insights into the role of tyrosinephosphorylation in leukemia progression and identified alteredTK phosphorylation and novel targets for therapeutic opportu-nities (42–45). For example, a common phosphotyrosine signa-ture for the BCR-ABLkinase in chronicmyeloid leukemia cell linesalong with novel fusion kinase signaling and potential drug-responsive biomarkers was identified in one study (23), whereasin another, the changes in T-cell receptor signaling pathwaysfollowing cisplatin-induced apoptosis were analyzed (43). How-ever, phosphotyrosine profiling studies in leukemias have usedcell line models rather than primary patient samples due to thelarge amounts of protein extract required per experiment.
Even though in vitro model systems provide in-depth kinasesignaling information, it is very difficult to predict the true effectthat any signaling regulation observed would have within adiseasemicroenvironment. To fully understand the relevance andregulationof tyrosine phosphorylation and improve predictionofclinical response after inhibitor treatment, it becomes imperativeto study tyrosine phosphorylation in in vivomodels or directly inpatient samples. We recognize that there are significant technicalhurdles and challenges for the profiling approach to become adiagnostic clinical tool. One of the key limiting factors being theprocurement of large amounts of starting material (peripheralblood/bone marrow) required to profile the relatively low abun-dance (0.05%) phosphotyrosinemolecules (46). However, in theinterim, PDX models offer a relevant and feasible alternative todirect patient samples. We have previously shown that childhoodALL PDXs accurately reflect systemic disease and retain funda-mental biologic characteristics of the original disease (includingresponsiveness to treatment; refs.19, 20). The establishment of aquantitative phosphotyrosine profiling method to track the TKsignaling changes in a clinically relevant model of ALL is animportant step forward.
The regulation of cellular signaling events at a molecular scaleby TKs and phosphatases is not only affected by the phosphor-ylation at selected sites on a given protein, but also by their level ofphosphorylation. By adopting a decoupled "spike-in" SILACquantitative methodology (21) in PDX models of pediatric leu-kemia, we were able to successfully integrate this with the phos-photyrosine enrichment protocol. However, we initially observeda preferential capture of heavy SILAC-labeled phosphotyrosinepeptides when equal amounts of PDX sample and "spike-in"SILAC standard were used. The likely explanation for this differ-ence is that the xenografted samples had to go through extendedprocessing steps before the cleared mononuclear cells could belysed or frozen in comparison with cell lines that were directlylysed after a brief wash. It has been well established that proces-sing times in patient samples have an impact on the phosphor-ylation status due to hypoxia and stress (17). Another possibleexplanation is that the cell lines receive a pervanadate treatment
before cell lysis, in order to retain as many phosphorylatedpeptides as possible, whereas the PDX samples did not. Thepercentages of PDX phosphopeptides with a labeled SILAC part-ner and vice versa are shown in Supplementary Fig. S9.
One crucial finding in this analysis was a very high intensity ofthe Y393 site of TKABL1 in the ALL-19 (BCP-ALL) PDX alongwiththe classic B-cell signaling non receptor TKs. Y393 is an autopho-sphorylation site for the ABL1 kinase and is often constitutivelyactivated in BCR-ABL1þ ALL patients (23, 30). In this study, wereconfirmed the phosphorylation of Y393 in ALL-4, which has aBCR-ABL1 translocation. The identification of active ABL1 in theBCP-ALL PDX (ALL-19) was a unique discovery as there was nopreviously reported BCR-ABL translocation in this leukemia.Upon further genetic analysis, we were able to discover aNUP214-ABL1 translocation in ALL-19 (unpublished observa-tions). Episomal amplification of NUP214-ABL1 has beenreported in T-cell malignancies and this cell type has also shownsensitivity to dasatinib monotherapy (47, 48). Although theNUP214-ABL1 translocation is rare in B-cell malignancies, it hasbeen previously reported in Ph-like ALL (12). Moreover, weobserved similar sensitivity to dasatinib in ALL-19 in vivo indi-cating the potential of phosphotyrosine profiling to identifyactivated protein kinases without prior knowledge of kinasetranslocations and the therapeutic value of the targets. Similarly,the unique upregulation of phosphorylated FLT3 inALL-2 and thesubsequent exome sequencing identification of a novel Y572Smutation highlights the potential of phosphotyrosine profiling totrack functional aspects of kinase dysregulation due to pointmutations. A similar mutation at site Y572 (Y572 >C) has beenreported as a gain-of-functionmutation that induced constitutiveFLT3 activation. Y572, the first amino acid of the juxtamembranedomain of FLT3, plays a key role in kinase auto inhibition. Thecrystal structure of the auto inhibited form also reveals that anymutation at this site would result in disruption of its extensiveinteractions with the surrounding FLT3 subdomains and conse-quent destabilization of the inactive kinase conformation (49).The increase in phosphorylated FLT3 at known autophosphor-ylation sites (Y969, Y842) is consistent with high activity of FLT3(50).
Protein kinase inhibitors represent a possible new treatmentoption for the chemoresistant ETP-ALL subtype. This high-risksubtype has been reported with high frequency of activatingmutations within cytokine receptor and JAK/STAT signalingpathways (10, 51). In agreement with the genetic studies, weobserved activation of JAK family proteins (JAK1, JAK2, andTYK2) as well as tyrosine phosphorylation of downstreamtargets STAT5, STAM1, and STAM2A previously reported to bephosphorylated by JAK1-JAK3 (Supplementary Table S6;refs. 10, 52). Furthermore, inhibiting the JAK-STAT pathwaywith ruxolitinib, a specific JAK1/2 inhibitor, clearly demon-strated the reliance of the ETP cells on the JAK/STAT pathwayfor survival. Taken together, these findings and the previousgenetic studies suggest that JAK/STAT pathway hyperactivationmay be a hallmark of ETP-ALL and that specific inhibition ofthis pathway has clear therapeutic relevance, even for thoseETP-ALLs without JAK mutation. More recently, we haveextended in vivo efficacy studies of ruxolitinib to a panel of 6ETP-ALL PDXs and observed that ruxolitinib demonstratesrobust activity irrespective of their JAK mutational status (28).
Deregulation of signaling pathways, whether as a result offusion, deletion, mutation, or amplification of component gene
Quantitative Phosphotyrosine Profiling in Leukemia Xenograft
www.aacrjournals.org Cancer Res; 76(9) May 1, 2016 2775
on May 6, 2018. © 2016 American Association for Cancer Research. cancerres.aacrjournals.org Downloaded from
Published OnlineFirst March 9, 2016; DOI: 10.1158/0008-5472.CAN-15-2786

products is a hallmark of high-risk ALL. Targeted inhibition ofperturbed kinases, the key regulators of these signaling pathways,opens novel therapeutic options for high-risk pediatric ALL.Usingan unbiased and quantitative tool to identify, the tyrosine phos-phorylation state of activated kinases in xenograft models ofleukemia, we have demonstrated the practical application of thisapproach in a clinically relevant environment. This study there-fore highlights the potential of profiling relapsed and refractorypediatric ALL patients to identify and validate clinically relevantkinases for targeted inhibitionwith FDA-approved drugs in futureclinical trials.
Disclosure of Potential Conflicts of InterestR. Sutton is a Conjoint Associate Professor in the University of New South
Wales. No potential conflicts of interest were disclosed by the other authors.
Authors' ContributionsConception and design: S. Dolai, K.C.S. Sia, P.J. Houghton, M.A. Smith,R.J. Daly, R.B. LockDevelopment of methodology: S. Dolai, K.C.S. Sia, F. Hochgr€afe,P.J. Houghton, R.J. Daly, M.J. Raftery, R.B. LockAcquisition of data (provided animals, acquired and managed patients,provided facilities, etc.): S. Dolai, K.C.S. Sia, L. Zhong, A.K. Robbins,R. Sutton, T. Revesz, T. Revesz, D.T. Teachey, M.J. Raftery, R.B. LockAnalysis and interpretation of data (e.g., statistical analysis, biostatistics,computational analysis): S. Dolai, K.C.S. Sia, T. Revesz, P.J. Houghton,R.J. Daly, M.J. Raftery
Writing, review, and/or revision of the manuscript: S. Dolai, K.C.S. Sia,L. Zhong, A.K. Robbins, T.L. Vincent, R. Sutton, T. Revesz, T. Revesz,P.J. Houghton, M.A. Smith, D.T. Teachey, R.J. Daly, R.B. LockAdministrative, technical, or material support (i.e., reporting or organizingdata, constructing databases): S. Dolai, T.L. Vincent, R.T. Kurmasheva,P.J. HoughtonStudy supervision: R.T. Kurmasheva, P.J. Houghton, R.B. LockOther (Chief Investigator of grant funding this research): R. Sutton
AcknowledgmentsThe authors thank the Tissue Resources Core Facility of St. Jude Children's
Research Hospital (Memphis, TN) for the provision of primary ETP-ALLsamples and the Children's Oncology Group for the provision of the P9906JAK-mutated primary patient samples. The authors also thank Agnes M.Mendomo for her assistance in development of the phosphotyrosine enrich-ment protocol in xenograft models of leukemia. Children's Cancer InstituteAustralia is affiliated with UNSW Australia and the Sydney Children'sHospitals Network.
Grant SupportThis work was funded by Project Grant 1024232 from the Australian
National Health and Medical Research Council. R.B. Lock was supported bya Senior Research Fellowship (1059804) from the Australian National Healthand Medical Research Council.
The costs of publication of this articlewere defrayed inpart by the payment ofpage charges. This article must therefore be hereby marked advertisement inaccordance with 18 U.S.C. Section 1734 solely to indicate this fact.
Received October 6, 2015; revised January 12, 2016; accepted January 26,2016; published OnlineFirst March 9, 2016.
References1. Dores GM, Devesa SS, Curtis RE, Linet MS, Morton LM. Acute leukemia
incidence and patient survival among children and adults in the UnitedStates, 2001–2007. Blood 2012;119:34–43.
2. Onciu M. Acute lymphoblastic leukemia. Hematol Oncol Clin North Am2009;23:655–74.
3. Pui CH, Mullighan CG, Evans WE, Relling MV. Pediatric acute lympho-blastic leukemia: where are we going and how do we get there?Blood2012;120:1165–74.
4. Hunger SP, Raetz EA, Loh ML, Mullighan CG. Improving outcomes forhigh-risk ALL: translating new discoveries into clinical care. Pediatr BloodCancer 2011;56:984–93.
5. Moricke A, Reiter A, ZimmermannM, Gadner H, Stanulla M, DordelmannM, et al. Risk-adjusted therapy of acute lymphoblastic leukemia candecrease treatment burden and improve survival: treatment results of2169 unselected pediatric and adolescent patients enrolled in the trialALL-BFM 95. Blood 2008;111:4477–89.
6. Pui CH, Carroll WL, Meshinchi S, Arceci RJ. Biology, risk stratification,and therapy of pediatric acute leukemias: an update. J Clin Oncol2011;29:551–65.
7. Cleaver AL, Beesley AH, Firth MJ, Sturges NC, O'Leary RA, Hunger SP, et al.Gene-based outcome prediction in multiple cohorts of pediatric T-cellacute lymphoblastic leukemia: a Children's Oncology Group study. MolCancer 2010;9:105.
8. Yeoh EJ, Ross ME, Shurtleff SA, Williams WK, Patel D, Mahfouz R, et al.Classification, subtype discovery, and prediction of outcome in pediatricacute lymphoblastic leukemia by gene expression profiling. Cancer Cell2002;1:133–43.
9. Ma M, Wang X, Tang J, Xue H, Chen J, Pan C, et al. Early T-cell precursorleukemia: a subtype of high risk childhood acute lymphoblastic leukemia.Front Med 2012;6:416–20.
10. Zhang J, Ding L, Holmfeldt L, Wu G, Heatley SL, Payne-Turner D, et al. Thegenetic basis of early T-cell precursor acute lymphoblastic leukaemia.Nature 2012;481:157–63.
11. Zhang J,Mullighan CG,Harvey RC,WuG, Chen X, EdmonsonM, et al. Keypathways are frequently mutated in high-risk childhood acute lympho-blastic leukemia: a report from the Children's Oncology Group. Blood2011;118:3080–7.
12. Roberts KG, Morin RD, Zhang J, Hirst M, Zhao Y, Su X, et al. Geneticalterations activating kinase and cytokine receptor signaling in high-riskacute lymphoblastic leukemia. Cancer Cell 2012;22:153–66.
13. Salomon AR, Ficarro SB, Brill LM, Brinker A, Phung QT, Ericson C, et al.Profiling of tyrosine phosphorylation pathways in human cells usingmassspectrometry. Proc Natl Acad Sci U S A 2003;100:443–8.
14. Rush J, Moritz A, Lee KA, Guo A, Goss VL, Spek EJ, et al. Immunoaffinityprofiling of tyrosine phosphorylation in cancer cells. Nat Biotechnol2005;23:94–101.
15. Rikova K, Guo A, Zeng Q, Possemato A, Yu J, Haack H, et al. Global surveyof phosphotyrosine signaling identifies oncogenic kinases in lung cancer.Cell 2007;131:1190–203.
16. Wang H, Kadlecek TA, Au-Yeung BB, Goodfellow HE, Hsu LY, FreedmanTS, et al. ZAP-70: an essential kinase in T-cell signaling. Cold Spring HarbPerspect Biol 2010;2:a002279.
17. Baker AF, Dragovich T, Ihle NT, Williams R, Fenoglio-Preiser C, Powis G.Stability of phosphoprotein as a biologicalmarker of tumor signaling. ClinCancer Res 2005;11:4338–40.
18. Hochgrafe F, Zhang L, O'Toole SA, Browne BC, Pinese M, Porta CubasA, et al. Tyrosine phosphorylation profiling reveals the signalingnetwork characteristics of Basal breast cancer cells. Cancer Res 2010;70:9391–401.
19. Lock RB, Liem N, Farnsworth ML, Milross CG, Xue C, Tajbakhsh M, et al.The nonobese diabetic/severe combined immunodeficient (NOD/SCID)mousemodel of childhood acute lymphoblastic leukemia reveals intrinsicdifferences in biologic characteristics at diagnosis and relapse. Blood2002;99:4100–8.
20. Liem NL, Papa RA, Milross CG, Schmid MA, Tajbakhsh M, Choi S, et al.Characterization of childhood acute lymphoblastic leukemia xenograftmodels for the preclinical evaluation of new therapies. Blood 2004;103:3905–14.
21. Monetti M, Nagaraj N, Sharma K, Mann M. Large-scale phosphositequantification in tissues by a spike-in SILAC method. Nat Methods 2011;8:655–8.
22. Zhang G, Neubert TA. Use of stable isotope labeling by amino acids in cellculture (SILAC) for phosphotyrosine protein identification and quantita-tion. Methods Mol Biol 2009;527:79–92.
Cancer Res; 76(9) May 1, 2016 Cancer Research2776
Dolai et al.
on May 6, 2018. © 2016 American Association for Cancer Research. cancerres.aacrjournals.org Downloaded from
Published OnlineFirst March 9, 2016; DOI: 10.1158/0008-5472.CAN-15-2786

23. Goss VL, Lee KA, Moritz A, Nardone J, Spek EJ, MacNeill J, et al. Acommon phosphotyrosine signature for the Bcr-Abl kinase. Blood2006;107:4888–97.
24. Thingholm TE, Jorgensen TJ, Jensen ON, Larsen MR. Highly selectiveenrichment of phosphorylatedpeptides using titaniumdioxide.Nat Protoc2006;1:1929–35.
25. Cox J, Matic I, Hilger M, Nagaraj N, Selbach M, Olsen JV, et al. A practicalguide to the MaxQuant computational platform for SILAC-based quanti-tative proteomics. Nat Protoc 2009;4:698–705.
26. Cox J, Neuhauser N, Michalski A, Scheltema RA, Olsen JV, Mann M.Andromeda: a peptide search engine integrated into the MaxQuant envi-ronment. J Proteome Res 2011;10:1794–805.
27. Anoopkumar-Dukie S, Carey JB, Conere T, O'Sullivan E, van Pelt FN,Allshire A. Resazurin assay of radiation response in cultured cells. Br JRadiol 2005;78:945–7.
28. Maude SL, Dolai S, Delgado-Martin C, Vincent T, Robbins A, SelvanathanA, et al. Efficacy of JAK/STAT pathway inhibition in murine xenograftmodels of early T-cell precursor (ETP) acute lymphoblastic leukemia.Blood 2015;125:1759–67.
29. Bhadri VA, Cowley MJ, Kaplan W, Trahair TN, Lock RB. Evaluation of theNOD/SCID xenograft model for glucocorticoid-regulated gene expressionin childhood B-cell precursor acute lymphoblastic leukemia. BMC Geno-mics 2011;12:565.
30. Brownlie RJ, Zamoyska R. T cell receptor signalling networks: branched,diversified and bounded. Nat Rev Immunol 2013;13:257–69.
31. Geiger T, Cox J, Ostasiewicz P, Wisniewski JR, Mann M. Super-SILAC mixfor quantitative proteomics of human tumor tissue. Nat Methods2010;7:383–5.
32. Gajadhar AS, Johnson H, Slebos RJ, Shaddox K, Wiles K, Washington MK,et al. Phosphotyrosine signaling analysis in human tumors is confoundedby systemic ischemia-driven artifacts and intra-specimen heterogeneity.Cancer Res 2015;75:1495–503.
33. Watts JD, Affolter M, Krebs DL, Wange RL, Samelson LE, Aebersold R.Identification by electrospray ionization mass spectrometry of the sites oftyrosine phosphorylation induced in activated Jurkat T cells on the proteintyrosine kinase ZAP-70. J Biol Chem 1994;269:29520–9.
34. Newman JD, Harrison LC, Eckardt GS, Jack I. Enhanced insulin-receptortyrosine kinase activity associated with chromosomal translocation (1;19)in a pre-B-cell leukemia line. Int J Cancer 1992;50:500–4.
35. Razumovskaya E, Masson K, Khan R, Bengtsson S, Ronnstrand L. Onco-genic Flt3 receptors display different specificity and kinetics of autopho-sphorylation. Exp Hematol 2009;37:979–89.
36. Kolb EA, Gorlick R, Houghton PJ, Morton CL, Lock RB, TajbakhshM, et al.Initial testing of dasatinib by the pediatric preclinical testing program.Pediatr Blood Cancer 2008;50:1198–206.
37. Maris JM, Courtright J, Houghton PJ, Morton CL, Kolb EA, Lock R, et al.Initial testing (stage 1) of sunitinib by the pediatric preclinical testingprogram. Pediatr Blood Cancer 2008;51:42–8.
38. Verstovsek S. Ruxolitinib: an oral Janus kinase 1 and Janus kinase 2inhibitor in the management of myelofibrosis. Postgrad Med 2013;125:128–35.
39. Scheijen B, Griffin JD. Tyrosine kinase oncogenes in normal hematopoiesisand hematological disease. Oncogene 2002;21:3314–33.
40. Harvey RC, Mullighan CG, Wang X, Dobbin KK, Davidson GS, Bedrick EJ,et al. Identification of novel cluster groups in pediatric high-risk B-precur-sor acute lymphoblastic leukemia with gene expression profiling: correla-tion with genome-wide DNA copy number alterations, clinical character-istics, and outcome. Blood 2010;116:4874–84.
41. Harsha HC, Pandey A. Phosphoproteomics in cancer. Mol Oncol 2010;4:482–95.
42. Gu TL, Nardone J, Wang Y, Loriaux M, Villen J, Beausoleil S, et al. Survey ofactivated FLT3 signaling in leukemia. PLoS ONE 2011;6:e19169.
43. Storvold GL, Landskron J, Strozynski M, Arntzen MO, Koehler CJ,Kalland ME, et al. Quantitative profiling of tyrosine phosphorylationrevealed changes in the activity of the T cell receptor signalingpathway upon cisplatin-induced apoptosis. J Proteomics 2013;91:344–57.
44. Rubbi L, Titz B, Brown L, Galvan E, Komisopoulou E, Chen SS, et al. Globalphosphoproteomics reveals crosstalk between Bcr-Abl and negative feed-back mechanisms controlling Src signaling. Sci Signal 2011;4:ra18.
45. Preisinger C, Schwarz JP, Bleijerveld OB, Corradini E, Muller PJ, Ander-son KI, et al. Imatinib-dependent tyrosine phosphorylation profiling ofBcr-Abl-positive chronic myeloid leukemia cells. Leukemia 2013;27:743–6.
46. Hunter T, Sefton BM. Transforming gene product of Rous sarcoma virusphosphorylates tyrosine. Proc Natl Acad Sci U S A 1980;77:1311–5.
47. Deenik W, Beverloo HB, van der Poel-van de Luytgaarde SC, Wattel MM,van Esser JW, Valk PJ, et al. Rapid complete cytogenetic remission afterupfront dasatinib monotherapy in a patient with a NUP214-ABL1-positive T-cell acute lymphoblastic leukemia. Leukemia 2009;23:627–9.
48. Quintas-Cardama A, Tong W, Manshouri T, Vega F, Lennon PA, Cools J,et al. Activity of tyrosine kinase inhibitors against human NUP214-ABL1-positive T cell malignancies. Leukemia 2008;22:1117–24.
49. Frohling S, Scholl C, Levine RL, Loriaux M, Boggon TJ, Bernard OA, et al.Identification of driver and passenger mutations of FLT3 by high-through-put DNA sequence analysis and functional assessment of candidate alleles.Cancer Cell 2007;12:501–13.
50. Rocnik JL, Okabe R, Yu JC, Lee BH, Giese N, Schenkein DP, et al. Roles oftyrosine 589 and 591 in STAT5 activation and transformationmediated byFLT3-ITD. Blood 2006;108:1339–45.
51. NeumannM,Heesch S, Schlee C, Schwartz S, Gokbuget N, Hoelzer D, et al.Whole-exome sequencing in adult ETP-ALL reveals a high rate of DNMT3Amutations. Blood 2013;121:4749–52.
52. Rawlings JS, Rosler KM, Harrison DA. The JAK/STAT signaling pathway.J Cell Sci 2004;117(Pt 8):1281–3.
www.aacrjournals.org Cancer Res; 76(9) May 1, 2016 2777
Quantitative Phosphotyrosine Profiling in Leukemia Xenograft
on May 6, 2018. © 2016 American Association for Cancer Research. cancerres.aacrjournals.org Downloaded from
Published OnlineFirst March 9, 2016; DOI: 10.1158/0008-5472.CAN-15-2786

2016;76:2766-2777. Published OnlineFirst March 9, 2016.Cancer Res Sibasish Dolai, Keith C.S. Sia, Alissa K. Robbins, et al. Xenografts Identifies Therapeutic Targets in Pediatric LeukemiaQuantitative Phosphotyrosine Profiling of Patient-Derived
Updated version
10.1158/0008-5472.CAN-15-2786doi:
Access the most recent version of this article at:
Material
Supplementary
http://cancerres.aacrjournals.org/content/suppl/2016/03/09/0008-5472.CAN-15-2786.DC1
Access the most recent supplemental material at:
Cited articles
http://cancerres.aacrjournals.org/content/76/9/2766.full#ref-list-1
This article cites 52 articles, 22 of which you can access for free at:
Citing articles
http://cancerres.aacrjournals.org/content/76/9/2766.full#related-urls
This article has been cited by 2 HighWire-hosted articles. Access the articles at:
E-mail alerts related to this article or journal.Sign up to receive free email-alerts
Subscriptions
Reprints and
To order reprints of this article or to subscribe to the journal, contact the AACR Publications Department at
Permissions
Rightslink site. Click on "Request Permissions" which will take you to the Copyright Clearance Center's (CCC)
.http://cancerres.aacrjournals.org/content/76/9/2766To request permission to re-use all or part of this article, use this link
on May 6, 2018. © 2016 American Association for Cancer Research. cancerres.aacrjournals.org Downloaded from
Published OnlineFirst March 9, 2016; DOI: 10.1158/0008-5472.CAN-15-2786