cancer research different tumor microenvironments...
TRANSCRIPT

5728
Published OnlineFirst June 22, 2010; DOI: 10.1158/0008-5472.CAN-09-4672
Microenvironment and Immunology
CancerResearch
Different Tumor Microenvironments Contain FunctionallyDistinct Subsets of Macrophages Derivedfrom Ly6C(high) Monocytes
Kiavash Movahedi1,2, Damya Laoui1,2, Conny Gysemans4, Martijn Baeten1,2, Geert Stangé3,Jan Van den Bossche1,2, Matthias Mack5, Daniel Pipeleers3, Peter In't Veld3,Patrick De Baetselier1,2, and Jo A. Van Ginderachter1,2
Abstract
Authors' Aof MolecuImmunologBrussels,DepartmenLeuven, BeRegensbur
Note: SupResearch O
CorrespoBrussel, CPhone: 32-
doi: 10.115
©2010 Am
Cancer R
Downlo
Tumor-associated macrophages (TAM) form a major component of the tumor stroma. However, importantconcepts such as TAM heterogeneity and the nature of the monocytic TAM precursors remain speculative.Here, we show for the first time that mouse mammary tumors contained functionally distinct subsets of TAMsand provide markers for their identification. Furthermore, in search of the TAM progenitors, we show that thetumor-monocyte pool almost exclusively consisted of Ly6ChiCX3CR1
low monocytes, which continuously seededtumors and renewed all nonproliferating TAM subsets. Interestingly, gene and protein profiling indicated thatdistinct TAM populations differed at the molecular level and could be classified based on the classic (M1)versus alternative (M2) macrophage activation paradigm. Importantly, the more M2-like TAMs were enrichedin hypoxic tumor areas, had a superior proangiogenic activity in vivo, and increased in numbers as tumorsprogressed. Finally, it was shown that the TAM subsets were poor antigen presenters, but could suppressT-cell activation, albeit by using different suppressive mechanisms. Together, our data help to unravel the com-plexities of the tumor-infiltrating myeloid cell compartment and provide a rationale for targeting specializedTAM subsets, thereby optimally “re-educating” the TAM compartment. Cancer Res; 70(14); 5728–39. ©2010 AACR.
Introduction
Myeloid cells are frequently found to infiltrate tumors andhave been linked to diverse tumor-promoting activities (1). Inparticular, tumor-associated macrophages (TAM) are an im-portant component of the tumor stroma, both in murinemodels and human patients (2). TAMs can promote tumorgrowth by affecting angiogenesis, immune suppression, andinvasion and metastasis (2, 3). However, it seems unlikelythat these diverse functions are performed by a single celltype, and the existence of distinct TAM subsets, linked to dif-ferent intratumoral microenvironments, has been predicted(4). Nevertheless, studies identifying spatially and function-ally distinct TAM subpopulations are currently lacking.
ffiliations: 1Cellular and Molecular Immunology, Departmentlar and Cellular Interactions, VIB; 2Cellular and Moleculary and 3Diabetes Research Center, Vrije Universiteit Brussel,Belgium; 4Experimental Medicine and Endocrinology,t of Experimental Medicine, Katholieke Universiteit Leuven,lgium; and 5Department of Internal Medicine, University ofg, Regensburg, Germany
plementary data for this article are available at Cancernline (http://cancerres.aacrjournals.org/).
nding Author: Jo A. Van Ginderachter, Vrije UniversiteitMIM, Building E8, Pleinlaan 2, B-1050 Brussels, Belgium.2-6291978; Fax: 32-2-6291981; E-mail: [email protected].
8/0008-5472.CAN-09-4672
erican Association for Cancer Research.
es; 70(14) July 15, 2010
on July 13, 201cancerres.aacrjournals.org aded from
Tissue-resident macrophages can be maintained throughlocal proliferation or differentiation in situ from circulatingmonocytic precursors (5). Importantly, discrete subsets ofblood monocytes have been described. Mouse monocytescan be classified as Ly6ClowCX3CR1
hi (CCR2−CD62L−) orLy6ChiCX3CR1
low (CCR2+CD62L+) and are shown to havedistinct functions and migration patterns (6). However, in-formation on the nature and dynamics of the monocyticTAM precursors is lacking thus far.Macrophages are plastic cells that can adopt different
phenotypes depending on the immune context. Microenvir-onmental stimuli can drive a macrophage either toward a“classic” (M1) or an “alternative” (M2) activation state,two extremes in a spectrum (7). M1 macrophages are typ-ically characterized by the expression of proinflammatorycytokines, inducible nitric oxide synthase 2 (Nos2), andMHC class II molecules. M2 macrophages have a decreasedlevel of the aforementioned molecules and are identified bytheir signature expression of a variety of markers, includingarginase-1 and mannose and scavenger receptors. It hasbeen suggested that TAMs display an M2-like phenotype(8), although it is not clear whether these findings can begeneralized and are applicable to TAMs in different tumorregions. In addition, the processes and signaling pathwaysthat are driving the M2 phenotype of TAMs are not yet fullyunderstood. A factor that is believed to be crucial in shap-ing the TAM phenotype is tumor hypoxia (9). Although hyp-oxia is known to have dramatic effects on the activation
8. © 2010 American Association for Cancer Research.

Origin and Functions of Tumor Macrophage Subsets
Published OnlineFirst June 22, 2010; DOI: 10.1158/0008-5472.CAN-09-4672
and function of macrophages, it remains to be determinedhow this relates to the M2-like orientation of TAMs.In this study, we show the existence of molecularly and func-
tionally distinct TAM subsets, located in different intratumoralregions, and uncover Ly6Chi monocytes as their precursors.These results might prove important for therapeutic interven-tions targeted at specific TAM subsets or their precursors.
Materials and Methods
Mice, cell linesFemale BALB/c and C57BL/6 mice were from Harlan.
BALB/c CX3CR1GFP/GFP mice were provided by Dr. Grégoire
Lauvau (Université de Nice-Sophia Antipolis, Nice, France).The BALB/c mammary adenocarcinoma TS/A (10) was pro-vided by Dr. Vincenzo Bronte (Istituto Oncologico Veneto,Padova, Italy); BALB/c 4T1 mammary carcinoma (11) wasprovided by Dr. Massimiliano Mazzone (VIB-KULeuven, Leu-ven, Belgium); and 3LL-R clone of the C57BL/6 Lewis Lungcarcinoma was derived as described previously (12). Cellswere injected subcutaneously (s.c.) in the flank (3 × 10⁶) orin the mammary fat pad (106).
Tumor preparation, fluorescence-activated cell sortingTumors were treated with 10 U/mL collagenase I, 400 U/mL
collagenase IV, and 30U/mLDNaseI (Worthington). Density gra-dients (Axis-Shield) were used to remove debris and dead cells.To purify TAMs, CD11b+ cellswereMACS-enriched (anti–CD11bmicrobeads, Miltenyi Biotec) and sorted using a BD FACSAria II(BD Biosciences). To purify dendritic cells, spleens were flushedwith 200 U/mL collagenase III (Worthington). CD11c+ cells wereMACS-enriched (anti-CD11c microbeads, Miltenyi Biotec), andCD11c+MHC IIhiB220−Ly6C− dendritic cells were sorted.Antibodies used are listed in Supplementary Table S1.For tumor necrosis factor α (TNFα) stainings, TAMs were
cultured 5 hours with Brefeldin A (BD Biosciences). For in-ducible nitric oxide synthase (iNOS), TAMs were culturedwith 10 U/mL IFNγ and/or 10 ng/mL lipopolysaccharide(LPS) for 12 hours.Arginase activity was measured as described earlier (13).
In vivo monocyte labelingLatex labeling of monocytes was described earlier (14, 15).
For Ly6Clow monocyte labeling, mice were injected intrave-nously (i.v.) with 250 μL 0.5 μm yellow-green microspheres(Polysciences; 1:25). Twenty-four hours later, TS/A was in-jected s.c. For Ly6Chi monocyte labeling, mice were injectedi.v. with 250 μL clodronate liposomes (16) and 18 hours laterwith latex microspheres (i.v.) and TS/A (s.c.).
Bromodeoxyuridine staining, cell cycle analysisMice were injected intraperitoneally with 1 mg bromo-
deoxyuridine (BrdUrd) (Sigma), and 0.8 mg/mL BrdUrd wasadministered to drinking water. To stain for BrdUrd, Ki67(BD Biosciences), or propidium iodide (Invitrogen), cellswere fixed/permeabilized using the BD Biosciences BrdUrdlabeling kit.
www.aacrjournals.org
on July 13, 201cancerres.aacrjournals.org Downloaded from
RNA extraction, cDNA preparation, and quantitativereverse transcriptase-PCRThese tests were performed as described earlier (17).
Gene-specific primers are listed in Supplementary Table S2.
Immunohistochemistry, hypoxia measurementsFor hypoxia stainings, mice were injected with 80 mg/kg
body weight pimonidazole [hypoxyprobe-1 (HP-1), HPI, Inc.].Two hours later, tumors were snap frozen, sections wereacetone fixed, and stained. Pictures were acquired with aPlan-Neofluar 10×/0.30 or Plan-Neofluar 20×/0.50 (Carl Zeiss)objective on a Zeiss Axioplan 2 microscope equipped with anOrca-R2 camera (Hamamatsu) and Smartcapture 3 software(Digital Scientific UK). For HP-1 fluorescence-activated cellsorting (FACS) measurements, cells were fixed/permeabilizedusing the BD Biosciences Fix/Perm kit and rat anti–HP-1/FITC (HPI) was added (30–37°C).
Chorioallantoic membrane assaysChorioallantoic membrane (CAM) assays were performed
as described earlier (18). Gelatin sponges (1–2 mm3; Hospithera)with 5 × 10⁴ sorted TAM subsets were placed on the CAM. PBS/0.1% bovine serum albumin (BSA; 50 μg/CAM) and recombi-nant human vascular endothelial growth factor (VEGF)-A165
(5 μg/CAM) served as controls. At day 13, membranes werefixed and analyzed using a Zeiss Lumar V.12 stereomicroscopewith NeoLumar S 1.5× objective (15× magnification).
Mixed leukocyte reaction, suppression assaysFor allo–mixed leukocyte reaction (MLR) assays, 2 × 10⁵
MACS-purified CD4+/CD8+ C57BL/6 T cells were added to5 × 104 sorted TAMs or conventional dendritic cells and3 days later were [3H]thymidine pulsed.For T-cell suppression assays, 1 × 10⁵ to 1.25 × 10⁴ (1:2–
1:16) sorted TAMs/conventional dendritic cells were addedto 2 × 10⁵ naive BALB/c splenocytes with 1 μg/mL anti-CD3and were [3H]thymidine pulsed 24 hours later. L-NMMA(0.5 mmol/L, Sigma) and/or NorNoha (0.5 mmol/L, Calbio-chem) were added in a 1:4 ratio. Relative percent suppressionof proliferation was calculated as described earlier (19).
StatisticsSignificance was determined by Student's t test.
Results
TS/A tumors are highly infiltrated with a heterogeneouspopulation of myeloid cells containing distinctgranulocyte and monocyte/macrophage subsetsTo study the tumor-infiltrating myeloid compartment, we,
at first instance, used the BALB/c mammary adenocarci-noma model TS/A. Subcutaneous tumors contained a largeCD11b+ fraction, indicating a high infiltration of myeloid cells(Fig. 1A). Interestingly, this CD11b+ population was heteroge-neous and encompassed at least seven subsets, which couldbe readily distinguished based on their differential expressionof MHC class II and Ly6C (Fig. 1A). Ly6ChiMHC II− cells (gate 1:Fig. 1A) were F4/80+CX3CR1
lowCCR2hiCD62L+, did not express
Cancer Res; 70(14) July 15, 2010 5729
8. © 2010 American Association for Cancer Research.

Movahedi et al.
5730
Published OnlineFirst June 22, 2010; DOI: 10.1158/0008-5472.CAN-09-4672
Figure 1. TS/A tumors are infiltrated by distinct granulocyte and monocyte/macrophage subsets. A, identification of distinct myeloid subsets in single-cellsuspensions of 11-d-old tumors (n = 4). B, subsets in gated CD11b+ cells from 7-, 11-,14-, and 21-d-old tumors. Tumor diameters are shown (n = 3).C, numbers of TAM subsets at different time points. D, expression of indicated markers on TAM subsets. For CX3CR1, tumors were grown inCX3CR1
GFP/+ mice. Shaded histograms, isotype control (n = 6).
Cancer Res; 70(14) July 15, 2010 Cancer Research
on July 13, 2018. © 2010 American Association for Cancer Research.cancerres.aacrjournals.org Downloaded from

Origin and Functions of Tumor Macrophage Subsets
Published OnlineFirst June 22, 2010; DOI: 10.1158/0008-5472.CAN-09-4672
the granulocyte markers Ly6G or CCR3, and had a small sizeand granularity (FSClowSSClow), indicating that they were Ly6-Chi monocytes (Fig. 1A and D; Supplementary Fig. S1). TheCD11b+MHC II+ cells in gates 2 to 4 were reminiscent ofmacrophages, having an enlarged macrophage-like scatterand expressing high levels of F4/80 (Fig. 1A and D). Remark-ably, distinct subsets of TAMs were clearly distinguishable:Ly6CintMHC IIhi (Ly6Cint TAMs, gate 2), Ly6ClowMHC IIhi
(MHC IIhi TAMs, gate 3), and Ly6ClowMHC IIlow (MHC IIlow
TAMs, gate 4). The majority of Ly6ClowMHC II− cells wereCCR3+CX3CR1
− eosinophils (Fig. 1A, gate 5; SupplementaryFig. S1, gate E). However, Ly6ClowMHC II− cells also consistedof CCR3−CX3CR1
low (Supplementary Fig. S1, gate 2) andCCR3−CX3CR1
hi (Supplementary Fig. S1, gate 3) cells, the latterpossibly resembling Ly6ClowCX3CR1
hi monocytes. However,the majority of these CX3CR1
hi cells did not have a monocytescatter, suggesting they were TAMs (Supplementary Fig. S1).This suggests that Ly6Clow monocytes were not present in sig-nificant amounts in these tumors. Finally, TS/A tumors werealso infiltrated with CCR3+Ly6Cint eosinophils (Fig. 1A, gate 6)and Ly6Ghi neutrophils (Fig. 1A, gate 7).Interestingly, the relative percentages of these distinct
myeloid subpopulations dramatically changed as tumorsprogressed (Fig. 1B). Within the TAM compartment, thepercentage of Ly6Cint TAMs decreased, whereas the Ly6-ClowMHC IIlow TAM subset became gradually more prominent,reaching up to 60% of the myeloid tumor infiltrate in largetumors (>10 mm). Because the amount of tumor-infiltratingCD11b+ cells increased as tumors progressed (Fig. 1C), MHCIIlow TAMs also strongly accumulated in absolute numbers, toa much greater extent than MHC IIhi TAMs.
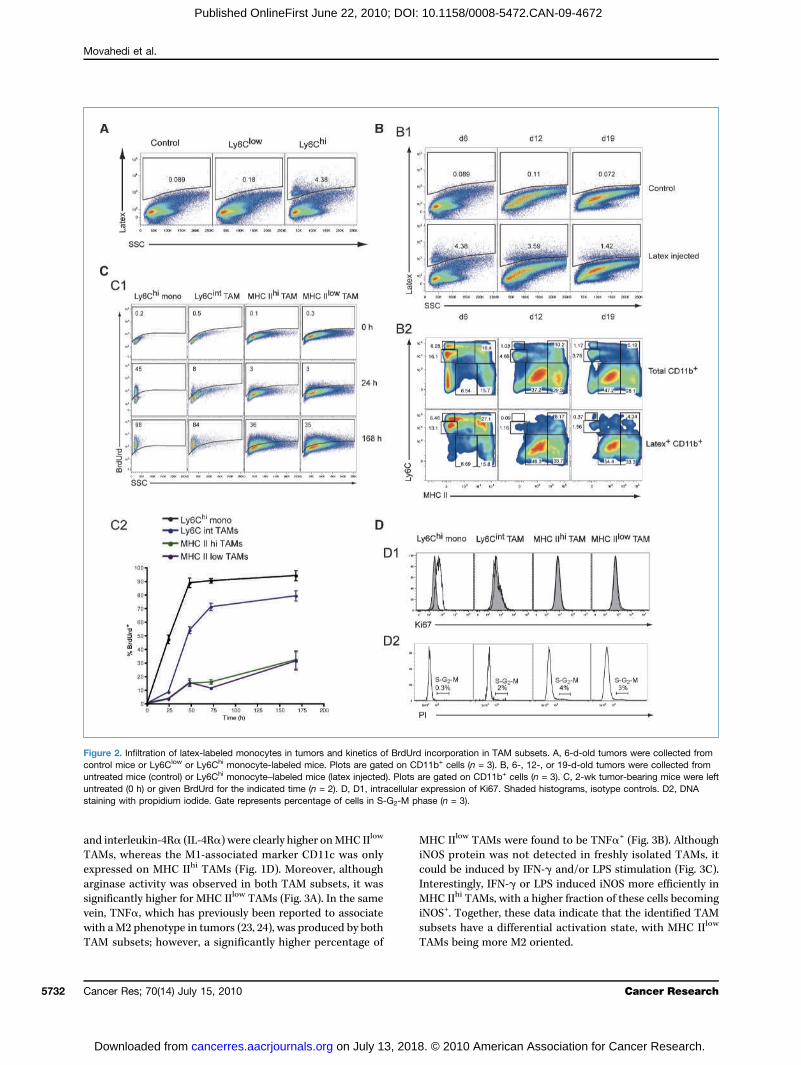
Ly6Chi monocytes are the precursors of all TAM subsetsin TS/A tumorsMacrophages typically derive from circulating blood-borne
precursors such as monocytes. The presence of Ly6Chi, butnot Ly6Clow, monocytes in TS/A tumors suggested that theformer could be more efficiently recruited to tumors andfunction as the TAM precursor. To investigate this, we selec-tively labeled Ly6Chi or Ly6Clow monocyte subsets in vivowith fluorescent latex beads, using a previously describedprocedure (14, 15). This method has been validated to stablylabel the respective monocyte subsets for 5 to 6 days in naivemice. Hence, TS/A was injected after Ly6Clow or Ly6Chi
monocyte labeling, and tumors were collected 6 days postinjection. No appreciable numbers of tumor-infiltratinglatex+ monocytes were observed when applying the Ly6Clow-labeling strategy (Fig. 2A). In contrast, Ly6Chi labeling resultedin the detection of a significant fraction of CD11b+latex+
monocytes, illustrating that Ly6Chi monocytes comprise themain tumor-infiltrating monocyte subset. With this approach,latex+ cells could be detected up to 19 days after tumor injec-tion (Fig. 2B), allowing a follow-up of the monocyte progeny inthe course of tumor growth. At day 6, latex+Ly6Chi monocyteshad differentiated into latex+Ly6Cint TAMs, and to someextent also into latex+MHC IIhi and latex+MHC IIlow TAMs(Fig. 2B). From day 12 onward, the majority of latex+
Ly6Chi monocytes had converted into latex+MHC IIhi and
www.aacrjournals.org
on July 13, 201cancerres.aacrjournals.org Downloaded from
latex+MHC IIlow TAMs. Together, these data show that allTAM subsets can be derived from Ly6Chi monocytes.Remarkably, the total number of peripheral blood mono-
cytes had significantly increased at later stages of tumorgrowth (≥21 days post injection; Supplementary Fig. S2A).Furthermore, around 4 weeks of tumor growth, there was asignificant increase in the percentage of the Ly6Chi monocytesubset (Supplementary Fig. S2B–C).
Ly6Cint, MHC IIhi, and MHC IIlow TAMs have distinctdifferentiation kinetics and turnover ratesTo determine the turnover rate and differentiation kinetics
of the monocyte/TAM subsets, BrdUrd was administeredcontinuously to tumor-bearing animals and its incorporationwas measured at consecutive time points. Tumor-infiltratingLy6Chi monocytes quickly became BrdUrd+, reaching plateauvalues after 48 hours of BrdUrd administration (Fig. 2C). Thisindicates a rapid monocyte turnover rate and/or prolifera-tion of monocytes inside tumors. Remarkably, although in-tratumoral Ly6Chi monocytes were Ki67+ (Fig. 2D1), nonewere found to be in the S-G2-M phase (Fig. 2D2), suggestingthat these cells were in the G1 phase and not proliferating(20). TAMs were Ki67−, and no appreciable numbers werefound in S-G2-M phase, indicating no significant levels of pro-liferation. Hence, TAMs were unable to directly incorporateBrdUrd so that BrdUrd+ TAMs must differentiate fromBrdUrd+ monocytes, resulting in a lag phase of BrdUrd pos-itivity. Indeed, only a minor fraction of MHC IIhi and MHCIIlow TAMs were BrdUrd+ upon 24 hours of BrdUrd adminis-tration (Fig. 2C). However, compared with these subsets, Ly6-Cint TAMs incorporated BrdUrd at a faster rate, with a higherpercentage being BrdUrd+ already at 24 hours. These resultssuggest that monocytes first give rise to Ly6Cint TAMs, whichthen differentiate into MHC IIhi and MHC IIlow TAMs. MHCIIhi and MHC IIlow TAMs incorporated BrdUrd slowly andwith similar kinetics, arguing for a comparable and low turn-over rate.
MHC IIhi and MHC IIlow TAMs differ at themolecular levelAlthough efforts have previously been made to character-
ize TAMs at the molecular level (21, 22), a thorough study ofTAM heterogeneity is lacking up to now. Hence, we furthercharacterized the distinct TAM subsets at the gene and pro-tein levels. Gene expression of sorted MHC IIhi and MHC IIlow
TAMs (Supplementary Fig. S3A) was analyzed through quan-titative reverse transcriptase-PCR (RT-PCR; Table 1). Ly6Cint
TAMs, constituting only a minor fraction in larger tumors,were not included in this analysis. Interestingly, when com-paring MHC IIhi with MHC IIlow TAMs (Table 1, hi/low),M2-associated genes such as Arg1 (arginase-1), Cd163, Stab1(stabilin-1), and Mrc1 (MMR) were higher expressed in theMHC IIlow subset. In contrast, more M1-type, proinflamma-tory genes, such as Nos2 (iNOS), Ptgs2 (Cox2), Il1b, Il6, andIl12b, were upregulated in MHC IIhi TAMs. This differentialactivation state was also reflected at the protein level. Mem-brane expression of the M2 markers macrophage mannosereceptor (MMR), macrophage scavenger receptor 1 (SR-A),
Cancer Res; 70(14) July 15, 2010 5731
8. © 2010 American Association for Cancer Research.
Movahedi et al.
5732
Published OnlineFirst June 22, 2010; DOI: 10.1158/0008-5472.CAN-09-4672
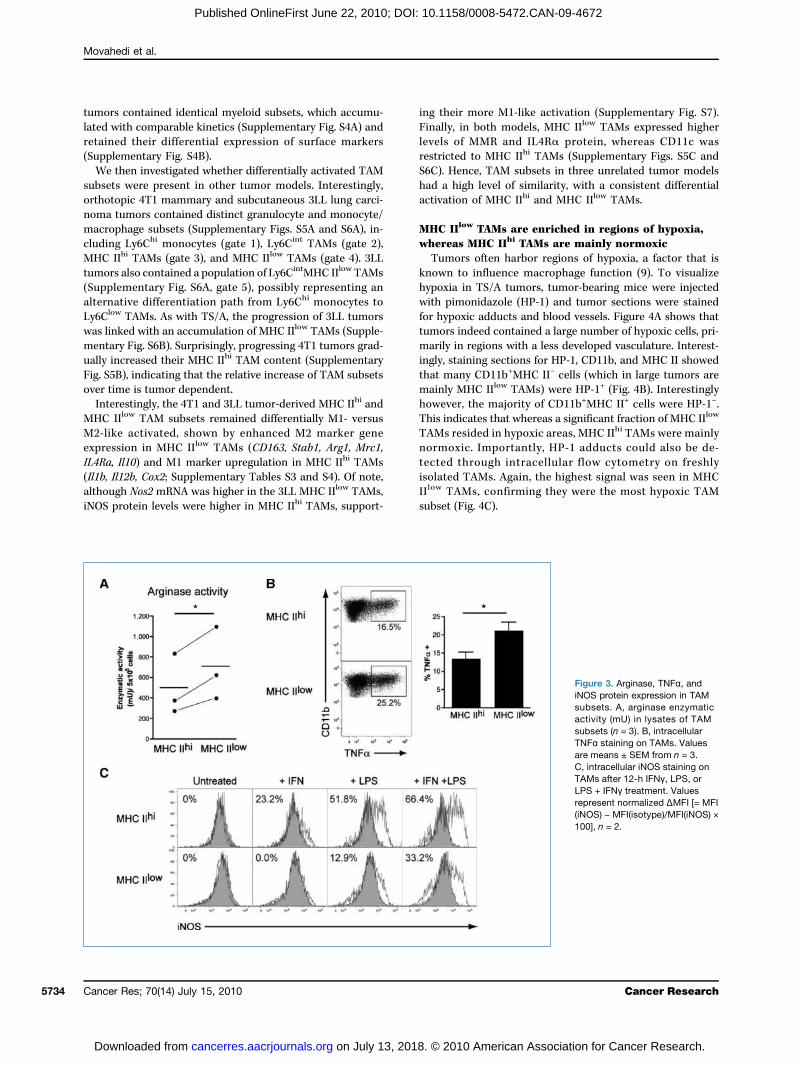
and interleukin-4Rα (IL-4Rα) were clearly higher onMHC IIlow
TAMs, whereas the M1-associated marker CD11c was onlyexpressed on MHC IIhi TAMs (Fig. 1D). Moreover, althougharginase activity was observed in both TAM subsets, it wassignificantly higher for MHC IIlow TAMs (Fig. 3A). In the samevein, TNFα, which has previously been reported to associatewith aM2 phenotype in tumors (23, 24), was produced by bothTAM subsets; however, a significantly higher percentage of
Cancer Res; 70(14) July 15, 2010
on July 13, 201cancerres.aacrjournals.org Downloaded from
MHC IIlow TAMs were found to be TNFα+ (Fig. 3B). AlthoughiNOS protein was not detected in freshly isolated TAMs, itcould be induced by IFN-γ and/or LPS stimulation (Fig. 3C).Interestingly, IFN-γ or LPS induced iNOS more efficiently inMHC IIhi TAMs, with a higher fraction of these cells becomingiNOS+. Together, these data indicate that the identified TAMsubsets have a differential activation state, with MHC IIlow
TAMs being more M2 oriented.
Figure 2. Infiltration of latex-labeled monocytes in tumors and kinetics of BrdUrd incorporation in TAM subsets. A, 6-d-old tumors were collected fromcontrol mice or Ly6Clow or Ly6Chi monocyte-labeled mice. Plots are gated on CD11b+ cells (n = 3). B, 6-, 12-, or 19-d-old tumors were collected fromuntreated mice (control) or Ly6Chi monocyte–labeled mice (latex injected). Plots are gated on CD11b+ cells (n = 3). C, 2-wk tumor-bearing mice were leftuntreated (0 h) or given BrdUrd for the indicated time (n = 2). D, D1, intracellular expression of Ki67. Shaded histograms, isotype controls. D2, DNAstaining with propidium iodide. Gate represents percentage of cells in S-G2-M phase (n = 3).
Cancer Research
8. © 2010 American Association for Cancer Research.

1
1
1
1
111
1
Origin and Functions of Tumor Macrophage Subsets
www.aacrjournals.org
on July 13, 201cancerres.aacrjournals.org Downloaded from
Published OnlineFirst June 22, 2010; DOI: 10.1158/0008-5472.CAN-09-4672
TAM subsets also showed a markedly distinct chemokineexpression pattern (Table 1). Notably, mRNAs for chemo-kines typically involved in lymphocyte attraction, such asCcl5, Cx3cl1, Cxcl11, Cxcl10, Cxcl9, and the CCR4 ligandsCcl17 and Ccl22 were upregulated in MHC IIhi TAMs. In con-trast, mRNAs for monocyte/macrophage chemoattractants,such as Ccl6; the CCR2 ligands Ccl7, Ccl2, and Ccl12; andthe CCR5/CCR1 ligands Ccl4, Ccl3, and Ccl9 were significantlyhigher in MHC IIlow TAMs. Furthermore, at the protein level, adifferential expression of the chemokine receptors CX3CR1and CCR2 was observed, with MHC IIhi TAMs beingCX3CR1
h iCCR2 − , whe reas MHC I I l ow TAMs wereCX3CR1
lowCCR2+ (Fig. 1D).Both TAM subsets expressed many potentially proangio-
genic genes, including Vegfa, Mmp9, Pgf, Spp1, and cathD(Table 1). However, several angiostatic factors such asangpt2, Cxcl9, Cxcl10, and Cxcl11 were upregulated in theMHC IIhi fraction. One of the most differentially expressedgenes (higher in MHC IIlow TAMs) was Lyve1, a markerpreviously associated with angiogenic/hypoxic macro-phages (25).We conclude that MHC IIhi and MHC IIlow TAMs have a
distinguishing profile of molecules involved in inflammation(M1/M2), chemotaxis, and angiogenesis.
Differentially activated MHC IIhi and MHC IIlow TAMsinfiltrate 4T1 mammary and 3LL lung carcinomasTo extrapolate these findings to orthotopically grown tu-
mors, TS/A was injected in the mammary fat pad. Orthotopic
Table 1. Gene expression profile of MHC IIhi
versus MHC IIlow TAMs from TS/A tumors
Gene
Hi/low Hi/low(90% CI)P
ΔCT hiCcl17
30 (19–47) ** 8.1 ± 0.3 Cx3cl1 9.2 (4.4–19) * 2.2 ± 0.5 Cxcl11 7.4 (4.2–13) ** 9.2 ± 0.1 Ccl5 6.1 (4.1–8.9) * 5.4 ± 0.4 Il6 5.9 (1.8–19) 14 ± 0.9 Cxcl10 5.9 (4.3–8.2) * 5.4 ± 0.4 Cxcl9 5.3 (4.2–6.6) *** 6.4 ± 0.0 Il12b 4.0 (1.6–10) 2.4 ± 0.4 Il1b 3.6 (2.6–5.1) *** 2.9 ± 0.1 Pgf 3.3 (0.68–16) 9.5 ± 0.5 Mmp9 2.9 (1.9–4.2) 4.0 ± 0.5 Ptgs2(Cox2)
2.3 (1.1–5.0) 7.3 ± 0.6Nos2(iNOS)
2.3 (1.4–3.8)
* 8.8 ± 0.1Angpt2
2.1 (1.6–2.7) ** 9.2 ± 0.1 Ccl22 2.0 (1.9–2.2) * 1.5 ± 0.3 Tek(Tie2)
1.8 (1.5–2.2) 5.7 ± 0.4Vegfa
1.6 (1.3–2.0) 6.2 ± 0.2 Thbs2(TSP2)
1.2 (0.9–1.8) 13 ± 0.0Il1a
1.2 (1.0–1.3) 6.8 ± 0.4 Il10 1.0 (0.69–1.5) 9.2 ± 0.3 Cxcl16 0.97 (0.67–1.4) 4.1 ± 0.0 Tnf 0.93 (0.64–1.3) 5.1 ± 0.3 Thbs1(TSP1)
0.89 (0.79–1.00) 6.2 ± 0.2Cx3cr1
0.85 (0.63–1.2) 7.4 ± 0.2 Mif 0.79 (0.67–0.93) 3.9 ± 0.1 Igf1 0.78 (0.63–0.97) 0.3 ± 0.4 Mmp14 0.77 (0.53–1.1) 8.3 ± 0.1 Ccr2 0.71 (0.39–1.3) 6.5 ± 0.5 Plau(uPA)
0.71 (0.62–0.81) 5.7 ± 0.1Ccl11
0.7 (0.39–1.2) 2.6 ± 0.3 Adamts1 0.68 (0.44–1.0) 4.1 ± 0.3 Ccl1 0.65 (0.43–0.99) 2.5 ± 0.5 Tgfb1 0.64 (0.58–0.70) * 4.5 ± 0.2 Cxcl1 0.64 (0.51–0.79) 3.5 ± 0.4 Ccl8 0.57 (0.33–0.98) 6.5 ± 0.4 Il4ra 0.50 (0.44–0.57) 0.6 ± 0.2 Arg1 0.48 (0.46–0.51) ** 1.7 ± 0.1 Spp1 0.45 (0.40–0.51) * 1.0 ± 0.1 Ccl12 0.44 (0.30–0.64) * 2.7 ± 0.2 Ccl6 0.39 (0.27–0.57) * 1.9 ± 0.3 Ccl4 0.34 (0.24–0.48) ** 4.8 ± 0.4 Ctsd 0.33 (0.30–0.36) ** 4.4 ± 0.2 Ccl9 0.33 (0.27–0.39) ** 2.5 ± 0.3 Ccl3 0.33 (0.25–0.43) ** 6.0 ± 0.2 Timp2 0.30 (0.15–0.59) * 4.8 ± 0.5(Continued on the following page)
8.
Table 1. Gene expression profile of MHC IIhi
versus MHC IIlow TAMs from TS/A tumors(Cont'd)
Gene
© 2010 Am
Hi/low
erican A
Hi/low(90% CI)
Cancer Res; 70(
ssociation for Canc
P
14) Ju
er Re
ΔCT hi
Ccl2
0.26 (0.19–0.36) * 2.7 ± 0.4 Ccl7 0.25 (0.18–0.35) ** 2.9 ± 0.5 Mrc1(MMR)
0.23 (0.21–0.25) *** 4.2 ± 0.0Stab1
0.22 (0.16–0.29) ** 5.5 ± 0.2 CD163 0.16 (0.12–0.21) ** 9.6 ± 0.1 Lyve1 0.033 (0.019–0.06) * 8.5 ± 0.1NOTE: Gene expression was assessed using quantitativeRT-PCR and normalized based on S12 and is shown asthe relative expression in MHC IIhi versus MHC IIlow TAMs(hi/low). Values are geometric means of three to four inde-pendent experiments. Accompanying 90% confidenceintervals (90% CI) and P values are shown: *, P < 0.05;**, P < 0.01; ***, P < 0.001. CT = threshold cycle. ΔCT
(calculated for MHC IIhi TAMs) = CT(gene) − CT(S12); lowerΔCt, corresponds to higher expression levels. , >5;
, 2–5; , 0.5–2; , 0.5–0.2; , <0.2.
ly 15, 2010 5733
search.
Movahedi et al.
5734
Published OnlineFirst June 22, 2010; DOI: 10.1158/0008-5472.CAN-09-4672
tumors contained identical myeloid subsets, which accumu-lated with comparable kinetics (Supplementary Fig. S4A) andretained their differential expression of surface markers(Supplementary Fig. S4B).We then investigated whether differentially activated TAM
subsets were present in other tumor models. Interestingly,orthotopic 4T1 mammary and subcutaneous 3LL lung carci-noma tumors contained distinct granulocyte and monocyte/macrophage subsets (Supplementary Figs. S5A and S6A), in-cluding Ly6Chi monocytes (gate 1), Ly6Cint TAMs (gate 2),MHC IIhi TAMs (gate 3), and MHC IIlow TAMs (gate 4). 3LLtumors also contained a population of Ly6CintMHC IIlow TAMs(Supplementary Fig. S6A, gate 5), possibly representing analternative differentiation path from Ly6Chi monocytes toLy6Clow TAMs. As with TS/A, the progression of 3LL tumorswas linked with an accumulation of MHC IIlow TAMs (Supple-mentary Fig. S6B). Surprisingly, progressing 4T1 tumors grad-ually increased their MHC IIhi TAM content (SupplementaryFig. S5B), indicating that the relative increase of TAM subsetsover time is tumor dependent.Interestingly, the 4T1 and 3LL tumor-derived MHC IIhi and
MHC IIlow TAM subsets remained differentially M1- versusM2-like activated, shown by enhanced M2 marker geneexpression in MHC IIlow TAMs (CD163, Stab1, Arg1, Mrc1,IL4Ra, Il10) and M1 marker upregulation in MHC IIhi TAMs(Il1b, Il12b, Cox2; Supplementary Tables S3 and S4). Of note,although Nos2 mRNA was higher in the 3LL MHC IIlow TAMs,iNOS protein levels were higher in MHC IIhi TAMs, support-
Cancer Res; 70(14) July 15, 2010
on July 13, 201cancerres.aacrjournals.org Downloaded from
ing their more M1-like activation (Supplementary Fig. S7).Finally, in both models, MHC IIlow TAMs expressed higherlevels of MMR and IL4Rα protein, whereas CD11c wasrestricted to MHC IIhi TAMs (Supplementary Figs. S5C andS6C). Hence, TAM subsets in three unrelated tumor modelshad a high level of similarity, with a consistent differentialactivation of MHC IIhi and MHC IIlow TAMs.
MHC IIlow TAMs are enriched in regions of hypoxia,whereas MHC IIhi TAMs are mainly normoxicTumors often harbor regions of hypoxia, a factor that is
known to influence macrophage function (9). To visualizehypoxia in TS/A tumors, tumor-bearing mice were injectedwith pimonidazole (HP-1) and tumor sections were stainedfor hypoxic adducts and blood vessels. Figure 4A shows thattumors indeed contained a large number of hypoxic cells, pri-marily in regions with a less developed vasculature. Interest-ingly, staining sections for HP-1, CD11b, and MHC II showedthat many CD11b+MHC II− cells (which in large tumors aremainly MHC IIlow TAMs) were HP-1+ (Fig. 4B). Interestinglyhowever, the majority of CD11b+MHC II+ cells were HP-1−.This indicates that whereas a significant fraction of MHC IIlow
TAMs resided in hypoxic areas, MHC IIhi TAMs were mainlynormoxic. Importantly, HP-1 adducts could also be de-tected through intracellular flow cytometry on freshlyisolated TAMs. Again, the highest signal was seen in MHCIIlow TAMs, confirming they were the most hypoxic TAMsubset (Fig. 4C).
8. © 2010 American Associat
Figure 3. Arginase, TNFα, andiNOS protein expression in TAMsubsets. A, arginase enzymaticactivity (mU) in lysates of TAMsubsets (n = 3). B, intracellularTNFα staining on TAMs. Valuesare means ± SEM from n = 3.C, intracellular iNOS staining onTAMs after 12-h IFNγ, LPS, orLPS + IFNγ treatment. Valuesrepresent normalized ΔMFI [= MFI(iNOS) − MFI(isotype)/MFI(iNOS) ×100], n = 2.
Cancer Research
ion for Cancer Research.

Origin and Functions of Tumor Macrophage Subsets
Published OnlineFirst June 22, 2010; DOI: 10.1158/0008-5472.CAN-09-4672
A consequence of MHC IIlow TAMs being in hypoxic regionsshould be a reduced access to blood-transported molecules. Totest this, fluorescent latex particles were injected i.v. in tumor-bearingmice. One to 2 hours later, a fraction of tumor-associatedCD11b+ cells were found to be latex+ (Supplementary Fig. S8A).However, latex uptake was not equal in all TAM subsets. Indeed,in relative terms, MHC IIlow TAMs phagocytosed less latex
www.aacrjournals.org
on July 13, 201cancerres.aacrjournals.org Downloaded from
than monocytes and other TAM subsets. This was not dueto an inherently reduced phagocytic capacity of MHC IIlow
TAMs because the latter showed the highest phagocytic latexuptake in vitro (Supplementary Fig. S8B). These data suggestthat the reduced in vivo latex uptake of MHC IIlow TAMswas dueto a restricted access to latex particles, which further substanti-ates the enrichment of MHC IIlow TAMs in hypoxic regions.
Figure 4.MHC IIlow TAMs are enriched in hypoxic regions; MHC IIhi TAMs are mainly normoxic. A, 3-wk tumor-bearing mice were injected with HP-1. Tumorsections were stained with MECA32, anti–HP-1, and 4′,6-diamidino-2-phenylindole (DAPI; n = 3). B, sections were stained for CD11b, MHC II, HP-1,and DAPI (n = 3). C, HP-1 adducts in TAM subsets using intracellular FACS (n = 4).
Cancer Res; 70(14) July 15, 2010 5735
8. © 2010 American Association for Cancer Research.

Movahedi et al.
5736
Published OnlineFirst June 22, 2010; DOI: 10.1158/0008-5472.CAN-09-4672
MHC IIlow TAMs show a superior proangiogenic activityin vivoHypoxia initiates an angiogenic program (26). In addition,
our gene profiling revealed the expression of angiogenesis-regulating molecules in TAMs. To directly test the proangio-genic activity of both TAM subsets in vivo, we used the CAMassay. Sorted MHC IIhi or MHC IIlow TAMs were implantedon developing CAMs, whereas BSA or rhVEGF served as neg-ative and positive controls, respectively. rhVEGF induced theoutgrowth of allantoic vessels specifically directed towardthe implants (Fig. 5A). Interestingly, compared with BSA con-trols, the presence of MHC IIhi or MHC IIlow TAMs signifi-cantly increased the number of implant-directed vessels,demonstrating a proangiogenic activity for both TAM sub-sets. However, the vessel count for implants containingMHC IIlow TAMs was on average 2-fold higher than withMHC IIhi TAMs. These data show that MHC IIlow TAMshad a superior proangiogenic activity in vivo.
TAMs are poor antigen presenters, but can efficientlysuppress T-cell proliferationWe wondered whether the TAM subsets were able to pro-
cess internalized antigens and activate T cells. Both TAMsubsets took up and processed DQ-Ovalbumin at 37°C. How-ever, examining DQ-Ovalbumin processing at consecutivetime points indicated that processing occurred more slowlyin the MHC IIlow fraction (Supplementary Fig. S9). To inves-tigate whether TAMs could directly activate naive T cells, aMLR assay was used. Sorted MHC IIhi or MHC IIlow TAMswere cultured with purified allogeneic C57BL/6 CD4+ orCD8+ T cells. Sorted splenic CD11chiMHC IIhi conventionaldendritic cells (Supplementary Fig. S3D) were used as a ref-erence T-cell–stimulating population (27). Compared withconventional dendritic cells, MHC IIhi or MHC IIlow TAMs in-duced poor proliferation of allogeneic CD4+ or CD8+ T cells(Fig. 5B), suggesting a limited antigen-presenting capacity or,alternatively, a T-cell suppressive capacity that overrulesantigen presentation.To investigate the latter possibility, T cells were polyclon-
ally activated in the presence of TAMs or conventional den-dritic cells. Interestingly, as opposed to conventionaldendritic cells, both MHC IIhi and MHC IIlow TAMs equallysuppressed anti–CD3-induced T-cell proliferation in a dose-dependent manner (Fig. 5C). In an attempt to identify thesuppressive molecules responsible for TAM-mediated sup-pression, inhibitors of iNOS (L-NMMA) and arginase (Nor-Noha) were added to the cocultures (Fig. 5D). BlockingiNOS significantly reduced T-cell suppression by MHC IIhi
TAMs, demonstrating a role for nitric oxide in its suppres-sive mechanism. In contrast, iNOS inhibition only hada minor effect on the suppressive potential of MHC IIlow
TAMs, showing that both subsets use different T-cell sup-pressive mechanisms.
Discussion
In this article, we show that the tumor-infiltrating myeloidcompartment can be highly heterogeneous, with the coexis-
Cancer Res; 70(14) July 15, 2010
on July 13, 201cancerres.aacrjournals.org Downloaded from
tence of distinct subsets of granulocytes and mononuclearphagocytes. Furthermore, we identified the nature and dy-namics of the monocyte precursor that was seeding tumorsand giving rise to distinct TAM subsets. Interestingly, thesesubsets differed at the molecular and functional levels andwere present in different intratumoral microenvironments(for an overview, see Supplementary Fig. S10).Within the tumor-infiltrating monocyte pool, Ly6ChiCX3-
CR1int monocytes were the most prominent subset, whereasLy6ClowCX3CR1
hi monocytes constituted only a small minor-ity. In addition, bead labeling and BrdUrd incorporationexperiments showed that Ly6Chi monocytes were the precur-sors of all the distinct TAM subsets in TS/A tumors. Ly6Chi
monocytes rely on the chemokine receptor CCR2 for theirmigration from the bone marrow into the circulation (28).Recent studies showing that tumors grown in CCR2−/− micehave significantly reduced numbers of TAMs (29, 30) aretherefore in line with our observation that Ly6Chi monocytescomprise the main tumor-infiltrating monocyte subset. Fur-thermore, TAMs (and in particular MHC IIlow TAMs) had ahigh gene expression of the CCR2 ligands CCL2, CCL7, andCCL8, suggesting an active role in the recruitment of Ly6Chi
monocytes. Most studies focusing on infection or immuniza-tion settings show that, at the site of insult, Ly6Chi monocytesgive rise to inflammatory dendritic cells (31–34). These inflam-matory dendritic cells remain Ly6Chi, express intermediate le-vels of CD11c, and can be efficient antigen presenters. Inaddition, a recent study has shown that shortly after Listeriamonocytogenes infection, Ly6Chi and Ly6Clow monocytes entera dendritic cell or a macrophage differentiation program,respectively (35). However, our results show that at the tu-mor site, Ly6Chi monocytes exclusively gave rise to distinctsubsets of inflammatory macrophages, further highlightingmonocyte plasticity and the impact of the tumor microen-vironment thereon.Strikingly, MHC IIhi and MHC IIlow TS/A TAMs tended
to be more M1- or M2-like, respectively. At the protein level,this included the differential expression of the M1 markersMHC II, CD11c, and iNOS, and the typical M2 markersMMR, SR-A, IL-4Rα, and arginase-1. Further proof for a dif-ferential activation state was delivered by gene expressionanalysis: an upregulation of proinflammatory genes in MHC IIhi
TAMs, whereas M2-associated genes preferentially adhered tothe MHC IIlow subset. Interestingly, Hagemann and colleaguesdescribed that macrophages cocultured with ovarian cancercells obtain anM2-like phenotype reminiscent of the MHC IIlow
TAMs in our present study, including upregulation of MMR,SR-A, and high expression levels of TNFα (23). In follow-upstudies, it was shown that inhibiting IκB kinase (IKK) β activ-ity in these macrophages results in a switch fromM2 toM1, asevidenced by enhanced expression of MHC II, iNOS, and IL-12,and a reduction in arginase, TNFα, and IL-4Rα (24, 36). Hence,MHC IIhi TAMs more closely resemble the phenotype of theIKKβ-deficient macrophages, raising the possibility that theopposing activation states of MHC IIhi and MHC IIlow TAMsmight be driven by a differential NF-κB activity in these subsets.Importantly, our findings in TS/A could be translated to
4T1 and 3LL tumors. The remarkable similarities between
Cancer Research
8. © 2010 American Association for Cancer Research.

Origin and Functions of Tumor Macrophage Subsets
Published OnlineFirst June 22, 2010; DOI: 10.1158/0008-5472.CAN-09-4672
Figure 5. Differential functions of TAM subsets. A, sorted TAMs, BSA, and rhVEGF were grafted on CAMs. Numbers of implant-directed vessels werequantified (n = 2). B, allo-MLR assays with TAMs or BALB/c conventional dendritic cells (cDC). Average level of [3H]thymidine incorporation (countsper minute, cpm) is shown (n = 3). C, suppression of syngeneic anti–CD3-induced T-cell proliferation by TAMs or conventional dendritic cells (n = 3).D, influence of indicated inhibitors on TAM-mediated suppression. ns, not significant.
Cancer Res; 70(14) July 15, 2010www.aacrjournals.org 5737
on July 13, 2018. © 2010 American Association for Cancer Research.cancerres.aacrjournals.org Downloaded from

Movahedi et al.
5738
Published OnlineFirst June 22, 2010; DOI: 10.1158/0008-5472.CAN-09-4672
TAM subsets from these unrelated tumors suggest thatsimilar environmental cues might shape their respectivephenotypes.Interestingly, in TS/A tumors, MHC IIlow TAMs were found
to preferentially reside in hypoxic regions, as shown bypimonidazole stainings and their reduced access to blood-transported molecules. Hypoxia is known to influence geneand protein expression of macrophages: inducing expressionof arginase, TNF, and proangiogenic factors while downregu-lating MHC II (37–39). Hypoxia-inducible factors (HIF) arethe main transcription factors involved in regulating hypox-ia-driven gene expression (26). Interestingly, a recent reportshowed that IKKβ is required for HIF-1α accumulationunder hypoxic conditions, thereby uncovering a link betweenthe hypoxic response and NF-κB (40). Hence, it is tempting tospeculate that the involvement of IKKβ in shaping the M2activation state of macrophages and its requirement forHIF-1α activity might be involved in the M2 skewing ofhypoxic TAMs. Irrespective of the molecular mechanism,these are the first data linking the M2-like orientation ofTAMs with a hypoxic environment.Another striking difference between TS/A MHC IIhi and
MHC IIlow TAMs was at the level of chemokine and chemo-kine receptor expression. MHC IIlow TAMs, possibly underthe influence of hypoxia, had the highest gene expressionof monocyte-recruiting chemokines, whereas chemokinesthat can recruit Th1, Th2, or natural killer cells, such asCx3cl1, Ccl5, Cxcl9, Cxcl10, Cxcl11, Ccl17, and Ccl22 (41), wereclearly upregulated in MHC IIhi TAMs. Hence, TAM subsetsmight contribute differently to shaping the inflammatory tu-mor infiltrate. In addition, the differential membrane expres-sion of CX3CR1 and CCR2 on the TAM subsets possibly reflectsthe use of different chemokine axes for their migration.A recent study compared the gene expression profile of
tumor-associated CD11b+Tie2+ cells (TEM) with that ofCD11b+Tie2− cells (42). Remarkably, many of the genes thatare differentially expressed between TEMs and the residualCD11b+ fraction were also key differential genes betweenMHC IIlow and MHC IIhi TAMs. For example, similar toMHC IIlow TAMs, TEMs have a higher mRNA expression levelof Lyve1, CD163, Stab1, Mrc1, Arg1, and Il4Ra, but lower Il1b,Nos2, Ptgs2, Ccl5, Cxcl10, and Cxcl11. However, TEMs are onlya minor fraction of CD11b+ cells in tumors and are suggestedto have a lineage relationship with Ly6ClowCX3CR1
hi mono-cytes (42). In contrast, MHC IIlow TAMs were the most abun-dant tumor-associated myeloid population and wereoriginating from Ly6Chi monocytes. In addition, antibodystaining did not reveal any Tie-2 expression on MHC IIlow
TAMs and Tie2 mRNA levels were slightly lower in MHC IIlow
compared with MHC IIhi TAMs. Although we do not excludethat TEMs might be present in the MHC IIlow fraction, ourresults suggest that MHC IIlow TAMs and TEMs are distinctpopulations, but have intriguing similarities in their pheno-types. Because TEMs are potent proangiogenic cells (43), it istempting to speculate that the similarities between TEMsand MHC IIlow TAMs might reflect a comparable function.Indeed, one of the key responses to hypoxia is the inductionof an angiogenic program (26).
Cancer Res; 70(14) July 15, 2010
on July 13, 201cancerres.aacrjournals.org Downloaded from
An in vivo CAM assay showed that both TS/A TAM subsetsstimulated angiogenesis. Interestingly, however, in line withtheir localization in hypoxic regions, MHC IIlow TAMsshowed a significantly higher proangiogenic activity, indicat-ing that the balance of proangiogenic versus antiangiogenicmediators was highest for this subset. At present, the exactmolecular basis for the increased angiogenic potential ofMHC IIlow TAMs is not clear, as several proangiogenic geneswere expressed at a high level in both TAM populations.However, MHC IIhi TAMs had the highest expression of theantiangiogenic CXC chemokines (Cxcl9-11; ref. 44), poten-tially limiting the effects of proangiogenic factors.The induction of myeloid-derived suppressor cells
(MDSC) is shown to be an important immune-evadingstrategy used by tumors (45, 46). We and others have pre-viously shown that splenic CD11b+Gr-1+ MDSCs consist oftwo major subsets: monocytic Ly6G− MO-MDSCs and gran-ulocytic Ly6G+ PMN-MDSCs (19, 47). Importantly, the phe-notype of TS/A tumor-infiltrating Ly6Chi(MHC II−)monocytes closely resembled that of MO-MDSCs, whereasthe tumor-infiltrating Ly6G+ neutrophils were reminiscentof PMN-MDSCs (19). However, whether these tumor-infil-trating cells have immune-suppressive potential remainsto be determined. In any case, within the TS/A tumor mi-croenvironment, cells with a MO-MDSC–like phenotype dif-ferentiate into CD11b+Gr-1−/Ly6C− macrophages, suggestinga potential lineage relationship between MDSCs and TAMs.Importantly, T-cell–suppressive activity was a prominentfeature of TAMs. Indeed, whereas MHC IIhi and MHC IIlow
TAMs were able to process antigens (albeit with differentkinetics), they inefficiently activated naive T cells. In con-trast, both subsets strongly suppressed polyclonal T-cellproliferation. Interestingly, in line with their M1-like activa-tion, MHC IIhi TAMs relied to a higher extent on iNOS forsuppression.It has been predicted that TAMs in different tumor regions
might have specialized functions (4). Our results provide thefirst evidence for this and describe markers for their discrim-ination in three independent tumor models. This offers theprospect of specifically targeting the M1-/M2-like or hypoxic/perivascular TAM subsets and investigating their impact ontumor biology. Eventually, this might lead to combinatorialstrategies for optimally “re-educating” the TAM compartmentand reverting its tumor-promoting activities.
Disclosure of Potential Conflicts of Interest
No potential conflicts of interest were disclosed.
Grant Support
Doctoral grants from FWO-Vlaanderen (K. Movahedi and J. Van denBossche), a doctoral grant from IWT-Vlaanderen (D. Laoui), and grants fromStichting tegen Kanker.
The costs of publication of this article were defrayed in part by the paymentof page charges. This article must therefore be hereby marked advertisement inaccordance with 18 U.S.C. Section 1734 solely to indicate this fact.
Received 12/23/2009; revised 04/15/2010; accepted 04/30/2010; publishedOnlineFirst 06/22/2010.
Cancer Research
8. © 2010 American Association for Cancer Research.

Origin and Functions of Tumor Macrophage Subsets
Published OnlineFirst June 22, 2010; DOI: 10.1158/0008-5472.CAN-09-4672
References
1. Mantovani A, Allavena P, Sica A, Balkwill F. Cancer-related inflam-mation. Nature 2008;454:436–44.2. Pollard JW. Tumour-educated macrophages promote tumour
progression and metastasis. Nat Rev Cancer 2004;4:71–8.3. Lin EY, Li JF, Gnatovskiy L, et al. Macrophages regulate the angio-
genic switch in a mouse model of breast cancer. Cancer Res 2006;66:11238–46.
4. Lewis CE, Pollard JW. Distinct role of macrophages in different tumormicroenvironments. Cancer Res 2006;66:605–12.
5. Varol C, Yona S, Jung S. Origins and tissue-context-dependent fatesof blood monocytes. Immunol Cell Biol 2009;87:30–8.
6. Auffray C, Sieweke MH, Geissmann F. Blood monocytes: develop-ment, heterogeneity, and relationship with dendritic cells. Annu RevImmunol 2009;27:669–92.
7. Martinez FO, Helming L, Gordon S. Alternative activation of macro-phages: an immunologic functional perspective. Annu Rev Immunol2009;27:451–83.
8. Sica A, Schioppa T, Mantovani A, Allavena P. Tumour-associatedmacrophages are a distinct M2 polarised population promotingtumour progression: potential targets of anti-cancer therapy. Eur JCancer 2006;42:717–27.
9. Lewis C, Murdoch C. Macrophage responses to hypoxia: implica-tions for tumor progression and anti-cancer therapies. Am J Pathol2005;167:627–35.
10. Nanni P, de Giovanni C, Lollini PL, Nicoletti G, Prodi G. TS/A: a newmetastasizing cell line from a BALB/c spontaneous mammary ade-nocarcinoma. Clin Exp Metastasis 1983;1:373–80.
11. Pulaski BA, Ostrand-Rosenberg S. Mouse 4T1 breast tumor model.Curr Protoc Immunol 2001. Chapter 20:Unit 20.2.
12. Remels LM, De Baetselier PC. Characterization of 3LL-tumor var-iants generated by in vitro macrophage-mediated selection. Int JCancer 1987;39:343–52.
13. Liu Y, Van Ginderachter JA, Brys L, De Baetselier P, Raes G, GeldhofAB. Nitric oxide-independent CTL suppression during tumor pro-gression: association with arginase-producing (M2) myeloid cells.J Immunol 2003;170:5064–74.
14. Tacke F, Ginhoux F, Jakubzick C, van Rooijen N, Merad M, RandolphGJ. Immature monocytes acquire antigens from other cells in thebone marrow and present them to T cells after maturing in theperiphery. J Exp Med 2006;203:583–97.
15. Tacke F, Alvarez D, Kaplan TJ, et al. Monocyte subsets differentiallyemploy CCR2, CCR5, and CX3CR1 to accumulate within atheroscle-rotic plaques. J Clin Invest 2007;117:185–94.
16. Van Rooijen N, Sanders A. Liposome mediated depletion of macro-phages: mechanism of action, preparation of liposomes and applica-tions. J Immunol Methods 1994;174:83–93.
17. Van Ginderachter JA, Meerschaut S, Liu Y, et al. Peroxisomeproliferator-activated receptor γ (PPARγ) ligands reverse CTLsuppression by alternatively activated (M2) macrophages in can-cer. Blood 2006;108:525–35.
18. Movahedi B, Gysemans C, Jacobs-Tulleneers-Thevissen D, MathieuC, Pipeleers D. Pancreatic duct cells in human islet cell preparationsare a source of angiogenic cytokines interleukin-8 and vascular en-dothelial growth factor. Diabetes 2008;57:2128–36.
19. Movahedi K, Guilliams M, Van den Bossche J, et al. Identification ofdiscrete tumor-induced myeloid-derived suppressor cell subpop-ulations with distinct T cell-suppressive activity. Blood 2008;111:4233–44.
20. Scholzen T, Gerdes J. The Ki-67 protein: from the known and theunknown. J Cell Physiol 2000;182:311–22.
21. Ojalvo LS, King W, Cox D, Pollard JW. High-density gene expressionanalysis of tumor-associated macrophages from mouse mammarytumors. Am J Pathol 2009;174:1048–64.
22. Biswas SK, Gangi L, Paul S, et al. A distinct and unique transcription-al program expressed by tumor-associated macrophages (defectiveNF-κB and enhanced IRF-3/STAT1 activation). Blood 2006;107:2112–22.
23. Hagemann T, Wilson J, Burke F, et al. Ovarian cancer cells polarize
www.aacrjournals.org
on July 13, 201cancerres.aacrjournals.org Downloaded from
macrophages toward a tumor-associated phenotype. J Immunol2006;176:5023–32.
24. Hagemann T, Lawrence T, McNeish I, et al. “Re-educating” tumor-associated macrophages by targeting NF-κB. J Exp Med 2008;205:1261–8.
25. Cho CH, Koh YJ, Han J, et al. Angiogenic role of LYVE-1-positivemacrophages in adipose tissue. Circ Res 2007;100:e47–57.
26. Pugh CW, Ratcliffe PJ. Regulation of angiogenesis by hypoxia: roleof the HIF system. Nat Med 2003;9:677–84.
27. Reis e Sousa C. Dendritic cells in a mature age. Nat Rev Immunol2006;6:476–83.
28. Serbina NV, Pamer EG. Monocyte emigration from bone marrow dur-ing bacterial infection requires signals mediated by chemokinereceptor CCR2. Nat Immunol 2006;7:311–7.
29. Sawanobori Y, Ueha S, Kurachi M, et al. Chemokine-mediated rapidturnover of myeloid-derived suppressor cells in tumor-bearing mice.Blood 2008;111:5457–66.
30. Pahler JC, Tazzyman S, Erez N, et al. Plasticity in tumor-promotinginflammation: impairment of macrophage recruitment evokes a com-pensatory neutrophil response. Neoplasia 2008;10:329–40.
31. Guilliams M, Movahedi K, Bosschaerts T, et al. IL-10 dampens TNF/inducible nitric oxide synthase-producing dendritic cell-mediatedpathogenicity during parasitic infection. J Immunol 2009;182:1107–18.
32. Auffray C, Fogg DK, Narni-Mancinelli E, et al. CX3CR1+ CD115+
CD135+ common macrophage/DC precursors and the role ofCX3CR1 in their response to inflammation. J Exp Med 2009;206:595–606.
33. Kool M, Soullie T, van Nimwegen M, et al. Alum adjuvant boostsadaptive immunity by inducing uric acid and activating inflammatorydendritic cells. J Exp Med 2008;205:869–82.
34. Nakano H, Lin KL, Yanagita M, et al. Blood-derived inflammatorydendritic cells in lymph nodes stimulate acute T helper type 1 im-mune responses. Nat Immunol 2009;10:394–402.
35. Auffray C, Fogg D, Garfa M, et al. Monitoring of blood vessels andtissues by a population of monocytes with patrolling behavior. Sci-ence 2007;317:666–70.
36. Fong CH, Bebien M, Didierlaurent A, et al. An antiinflammatory rolefor IKKβ through the inhibition of “classical” macrophage activation.J Exp Med 2008;205:1269–76.
37. Murdoch C, Muthana M, Lewis CE. Hypoxia regulates macrophagefunctions in inflammation. J Immunol 2005;175:6257–63.
38. Mancino A, Schioppa T, Larghi P, et al. Divergent effects of hypoxiaon dendritic cell functions. Blood 2008;112:3723–34.
39. Danet GH, Pan Y, Luongo JL, Bonnet DA, Simon MC. Expansion ofhuman SCID-repopulating cells under hypoxic conditions. J Clin In-vest 2003;112:126–35.
40. Rius J, Guma M, Schachtrup C, et al. NF-κB links innate immunity tothe hypoxic response through transcriptional regulation of HIF-1α.Nature 2008;453:807–11.
41. Mantovani A, Sica A, Sozzani S, Allavena P, Vecchi A, Locati M. Thechemokine system in diverse forms of macrophage activation andpolarization. Trends Immunol 2004;25:677–86.
42. Pucci F, Venneri MA, Biziato D, et al. A distinguishing gene signatureshared by tumor-infiltrating Tie2-expressing monocytes, blood“resident” monocytes, and embryonic macrophages suggests com-mon functions anddevelopmental relationships. Blood2009;114:901–14.
43. De Palma M, Murdoch C, Venneri MA, Naldini L, Lewis CE. Tie2-expressing monocytes: regulation of tumor angiogenesis and ther-apeutic implications. Trends Immunol 2007;28:519–24.
44. Belperio JA, Keane MP, Arenberg DA, et al. CXC chemokines in an-giogenesis. J Leukoc Biol 2000;68:1–8.
45. Gabrilovich DI, Nagaraj S. Myeloid-derived suppressor cells as reg-ulators of the immune system. Nat Rev Immunol 2009;9:162–74.
46. Ostrand-Rosenberg S, Sinha P. Myeloid-derived suppressor cells:linking inflammation and cancer. J Immunol 2009;182:4499–506.
47. Youn JI, Nagaraj S, Collazo M, Gabrilovich DI. Subsets of myeloid-derived suppressor cells in tumor-bearing mice. J Immunol 2008;181:5791–802.
Cancer Res; 70(14) July 15, 2010 5739
8. © 2010 American Association for Cancer Research.
2010;70:5728-5739. Published OnlineFirst June 22, 2010.Cancer Res Kiavash Movahedi, Damya Laoui, Conny Gysemans, et al. MonocytesDistinct Subsets of Macrophages Derived from Ly6C(high) Different Tumor Microenvironments Contain Functionally
Updated version
10.1158/0008-5472.CAN-09-4672doi:
Access the most recent version of this article at:
Material
Supplementary
http://cancerres.aacrjournals.org/content/suppl/2010/06/18/0008-5472.CAN-09-4672.DC1
Access the most recent supplemental material at:
Cited articles
http://cancerres.aacrjournals.org/content/70/14/5728.full#ref-list-1
This article cites 46 articles, 23 of which you can access for free at:
Citing articles
http://cancerres.aacrjournals.org/content/70/14/5728.full#related-urls
This article has been cited by 78 HighWire-hosted articles. Access the articles at:
E-mail alerts related to this article or journal.Sign up to receive free email-alerts
Subscriptions
Reprints and
To order reprints of this article or to subscribe to the journal, contact the AACR Publications
Permissions
Rightslink site. Click on "Request Permissions" which will take you to the Copyright Clearance Center's (CCC)
.http://cancerres.aacrjournals.org/content/70/14/5728To request permission to re-use all or part of this article, use this link
on July 13, 2018. © 2010 American Association for Cancer Research.cancerres.aacrjournals.org Downloaded from
Published OnlineFirst June 22, 2010; DOI: 10.1158/0008-5472.CAN-09-4672