making tables and figures - suny cortlandweb.cortland.edu/hendrick/apa making tables and...
TRANSCRIPT
199
Making Tables and Figures
Don Quick
Colorado State University
Tables and figures are used in most fields of study to provide a visual presentation of important information to the reader. They are used to organize the statistical results of a study, to list
important tabulated information, and to allow the reader a visual method of comparing related
items. Tables offer a way to detail information that would be difficult to describe in the text.
A figure is a graphic or pictorial representation, such as a chart, graph, photograph, or line
drawing. These figures may include pie charts, line charts, bar charts, organizational charts, flow
charts, diagrams, blueprints, or maps. Limit figures to situations in which a visual helps the reader understand the methodology or results. Use a table to provide specific numbers and summary
text, and use figures for visual presentations.
The meaning and major focus of the table or figure should be evident to the readers without their
having to make a thorough study of it. A glance should be all it takes for the idea of what the
table or figure represents to be conveyed to the reader. By reading only the text itself, the reader may have difficulty understanding the data; by constructing tables and figures that are well
presented, readers will be able to understand the study results more easily.
The purpose of this appendix is to provide guidelines that will enhance the presentation of research findings and other information by using tables and figures. It will highlight the important
aspects of constructing tables and figures using the Publication Manual of the American Psychological
Association, Sixth Edition (2010) as the guide for formatting.
General Considerations Concerning Tables
Be selective as to how many tables are included in the total document. Determine how much data the reader needs to comprehend the material, and then decide if the information would be better
presented in the text or as a table. A table containing only a few numbers is unnecessary, whereas
a table containing too much information may not be understandable. Tables should be easy to
read and interpret. If at all possible, combine tables that repeat data, so that results are presented only once.
Keep a consistency to all of your tables throughout your document. All tables and figures in your document should use a similar format, with the results organized in a comparable fashion. Use the
same name and scale in all tables, figures, and the text that use the same variable.
In a final manuscript such as a thesis or dissertation, adjust the column headings or spacing
between columns so the width of the table fits appropriately between the margins. Fit all of one
table on one page. Reduce the data, change the type size, or decrease line spacing to make it fit. A
short table may be on a page with text as long as it follows the first mention of it. Each long table is on a separate page immediately after it is mentioned in the text. If the fit and appearance would
be improved, turn the table sideways (landscape orientation, with the top of table toward the
spine) on the page.

200 APPENDIX C
Each table and figure must be discussed in the text. An informative table will supplement but will
not duplicate the text. In the text, discuss only the most important parts of the table. Make sure the table can be understood by itself without the accompanying text; however, it is never
independent of the text. There must be a reference in the text to the table.
Construction of the Table
Table 1.1 is an example of an APA table for displaying simple descriptive data collected in a
study. It also appears in correct relation to the text of the document; that is, it is inserted below
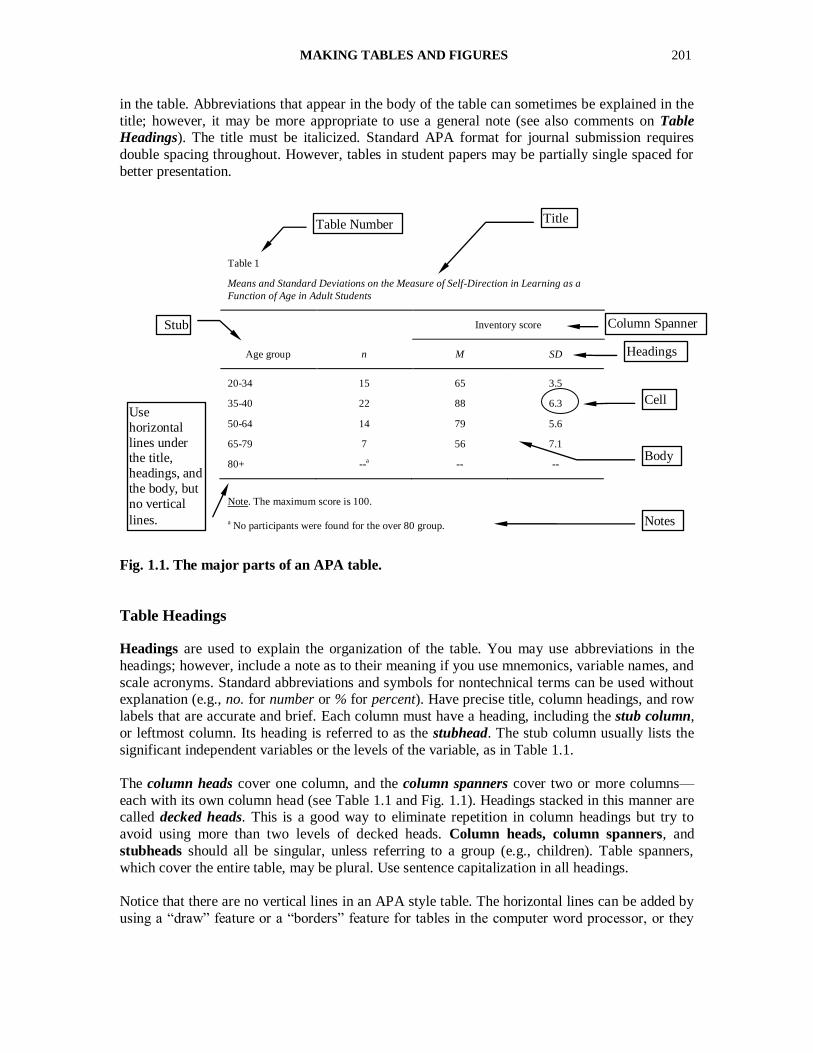
the place that the table is first mentioned either on the same page, if it will fit, or the next page. (Fig. 1.1 shows the same table with the table parts identified.) The major parts of a table are the
number, the title, the headings, the body, and the notes.
Table 1.1. An Example of a Table in APA Format for Displaying Simple Descriptive Data
Table 1
Means and Standard Deviations on the Measure of Self-Direction in Learning as a Function of Age in Adult Students
Self-directed learning inventory score
Age group n M SD
20–34
35–40
50–64
65–79
80+
15
22
14
7
--a
65
88
79
56
--
3.5
6.3
5.6
7.1
--
Note. The maximum score is 100. a No participants were found for the over 80 group.
Table Numbering
Arabic numerals are used to number tables in the order in which they appear in the text. Do NOT
write in the text “the table on page 17” or “the table above or below.” The correct method would
be to refer to the table number like this: (see Table 1) or “Table 1 shows…” Left-justify the table number (see Table 1.1). In an article, each table should be numbered sequentially in the order of
appearance. Do not use suffix letters or numbers with the table numbers in articles. However, in a
book, tables may be numbered within chapters; for example, Table 7.1. If the table appears in an
appendix, identify it with the letter of the appendix capitalized, followed by the table number; for instance, Table 1.3 is the third table in Appendix C.
Table Titles
Include the variables, the groups on whom the data were collected, the subgroups, and the nature of the statistic reported. The table title and headings should concisely describe what is contained
MAKING TABLES AND FIGURES 201
in the table. Abbreviations that appear in the body of the table can sometimes be explained in the
title; however, it may be more appropriate to use a general note (see also comments on Table
Headings). The title must be italicized. Standard APA format for journal submission requires
double spacing throughout. However, tables in student papers may be partially single spaced for
better presentation.
Fig. 1.1. The major parts of an APA table.
Table Headings
Headings are used to explain the organization of the table. You may use abbreviations in the
headings; however, include a note as to their meaning if you use mnemonics, variable names, and
scale acronyms. Standard abbreviations and symbols for nontechnical terms can be used without explanation (e.g., no. for number or % for percent). Have precise title, column headings, and row
labels that are accurate and brief. Each column must have a heading, including the stub column,
or leftmost column. Its heading is referred to as the stubhead. The stub column usually lists the
significant independent variables or the levels of the variable, as in Table 1.1.
The column heads cover one column, and the column spanners cover two or more columns—
each with its own column head (see Table 1.1 and Fig. 1.1). Headings stacked in this manner are called decked heads. This is a good way to eliminate repetition in column headings but try to
avoid using more than two levels of decked heads. Column heads, column spanners, and
stubheads should all be singular, unless referring to a group (e.g., children). Table spanners,
which cover the entire table, may be plural. Use sentence capitalization in all headings.
Notice that there are no vertical lines in an APA style table. The horizontal lines can be added by
using a “draw” feature or a “borders” feature for tables in the computer word processor, or they
Table 1
Means and Standard Deviations on the Measure of Self-Direction in Learning as a
Function of Age in Adult Students
Inventory score
Age group n M SD
20-34
35-40
50-64
65-79
80+
15
22
14
7
--a
65
88
79
56
--
3.5
6.3
5.6
7.1
--
Note. The maximum score is 100.
a No participants were found for the over 80 group.
Table Number Title
Headings
Stub
Colu
mn
Column Spanner
Body
Notes
Cell Use
horizontal
lines under the title,
headings, and
the body, but
no vertical
lines.
202 APPENDIX C
could be drawn in by hand if typed. If translating from an SPSS table or box, the vertical lines
must be removed.
The Body of the Table
The body contains the actual data being displayed. Round numbers improve the readability and
clarity more than precise numbers with several decimal places. A good guideline is to report two digits more than the raw data. A reader can compare numbers down a column more easily than
across a row. Column and row averages can provide a visual focus that allows the reader to
inspect the data easily without cluttering the table. If a cell cannot be filled because the information is not applicable, then leave it blank. If it cannot be filled because the information
could not be obtained, or was not reported, then insert a dash and explain the dash with a note to
the table.
Notes to a Table
Notes are often used with tables. There are three different forms of notes used with tables: (a) to
eliminate repetition in the body of the table, (b) to elaborate on the information contained in a particular cell, or (c) to indicate statistical significance:
A general note provides information relating to the table as a whole, including explanations
of abbreviations used:
Note. This could be used to indicate if the table came from another source.
A specific note makes a reference to a specific row, column, or cell of the table and is
given a superscript lowercase letter, beginning with the letter “a”:
an = 50. Specific notes are identified in the body with a superscript.
A probability note is to be included when one or more inferential statistics have been
computed and there isn’t a column showing the probability, p. Asterisk(s) indicate the
statistical significance of findings presented within the table. Try to be consistent across all tables in a paper. The important thing is to use the fewest asterisks for the largest p value.
It is common to use one asterisk for .05 and two for .01. For example:
*p < .05. **p < .01.
Notes should be listed with general notes first, then specific notes, and concluded with probability
notes, without indentation. They may be single spaced for better presentation. Explain all uses of
dashes and parentheses. Abbreviations for technical terms, group names, and those of a similar nature must be explained in a note to the table.
MAKING TABLES AND FIGURES 203
Constructing a Table in Microsoft Word 2007
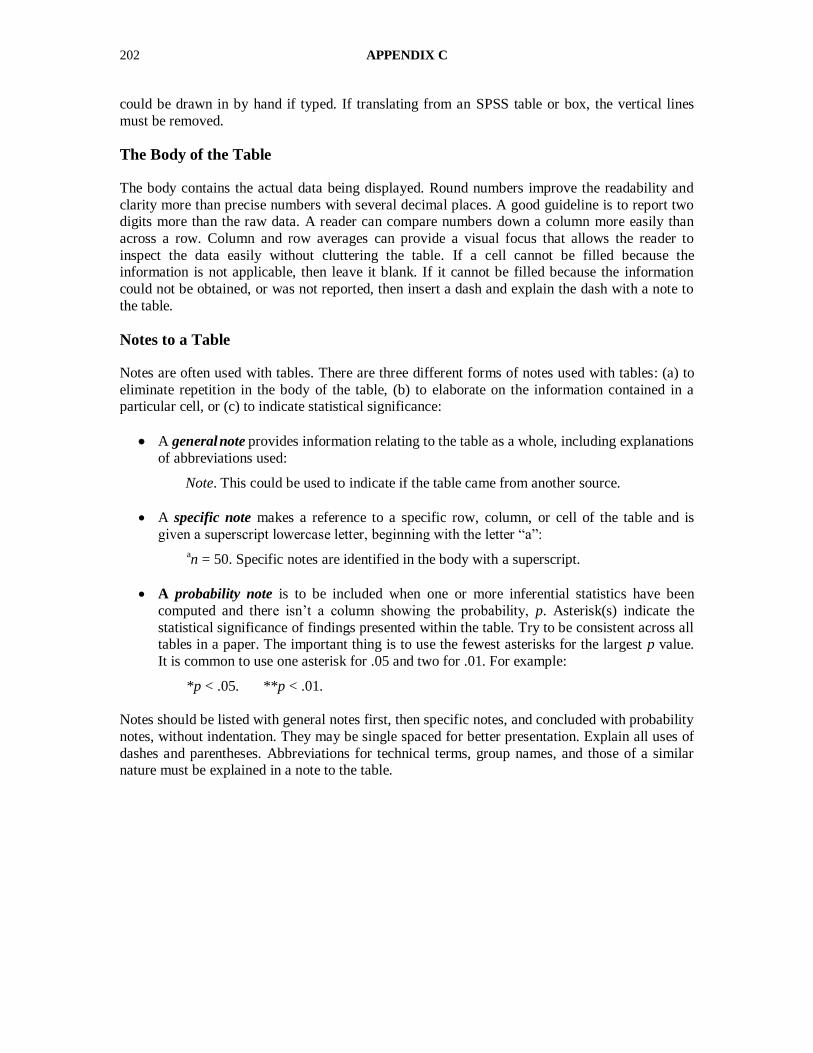
For this step-by-step example, results from an ANOVA analysis were chosen from previous
examples in the book. See Fig. 1.2. The data are transferred from the standard SPSS output to an
APA table.
ANOVA
grades in h.s.
18.143 2 9.071 4.091 .021
155.227 70 2.218
173.370 72
Between Groups
Within Groups
Total
Sum of
Squares df Mean Square F Sig.
Fig. 1.2. An example of the type of default table generated from an SPSS ANOVA output.
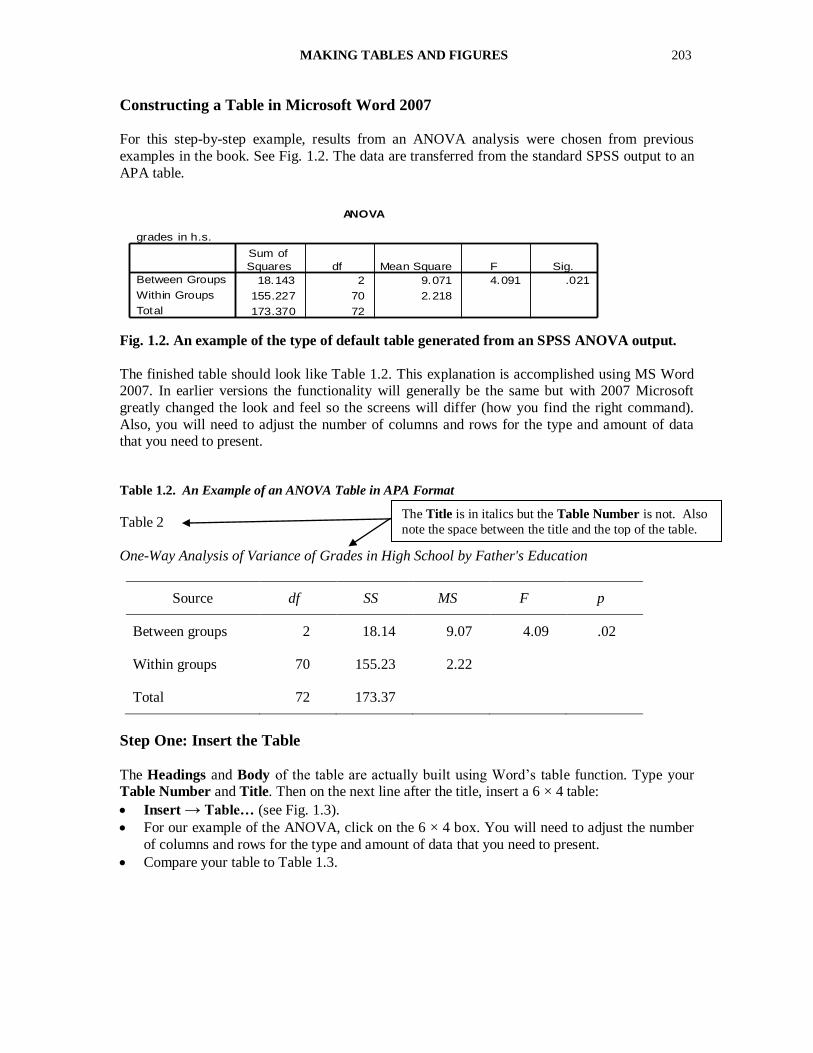
The finished table should look like Table 1.2. This explanation is accomplished using MS Word 2007. In earlier versions the functionality will generally be the same but with 2007 Microsoft
greatly changed the look and feel so the screens will differ (how you find the right command).
Also, you will need to adjust the number of columns and rows for the type and amount of data that you need to present.
Table 1.2. An Example of an ANOVA Table in APA Format
Table 2
One-Way Analysis of Variance of Grades in High School by Father's Education
Source df SS MS F p
Between groups 2 18.14 9.07 4.09 .02
Within groups 70 155.23 2.22
Total 72 173.37
Step One: Insert the Table
The Headings and Body of the table are actually built using Word’s table function. Type your Table Number and Title. Then on the next line after the title, insert a 6 × 4 table:
Insert → Table… (see Fig. 1.3).
For our example of the ANOVA, click on the 6 × 4 box. You will need to adjust the number
of columns and rows for the type and amount of data that you need to present.
Compare your table to Table 1.3.
The Title is in italics but the Table Number is not. Also
note the space between the title and the top of the table.

204 APPENDIX C
Table 1.3. Step 1
Step Two: Correcting the Grid Lines
APA uses no vertical and just a few horizontal lines, so it is best to remove them all and then put
back the ones that are needed. However, you need to first turn on your table gridlines if they
aren’t on already:
Home → In the Paragraph Box click the arrow next to the Border button and select View
Gridlines. See Fig. 1.4.
Then remove all the table border lines by:
Right click anywhere on the table and select: Borders and Shading… to get Fig. 1.5.
Fig. 1.3. Using MS Word
to make a table.
Fig. C.4. Turning the
View Gridlines on.
MAKING TABLES AND FIGURES 205
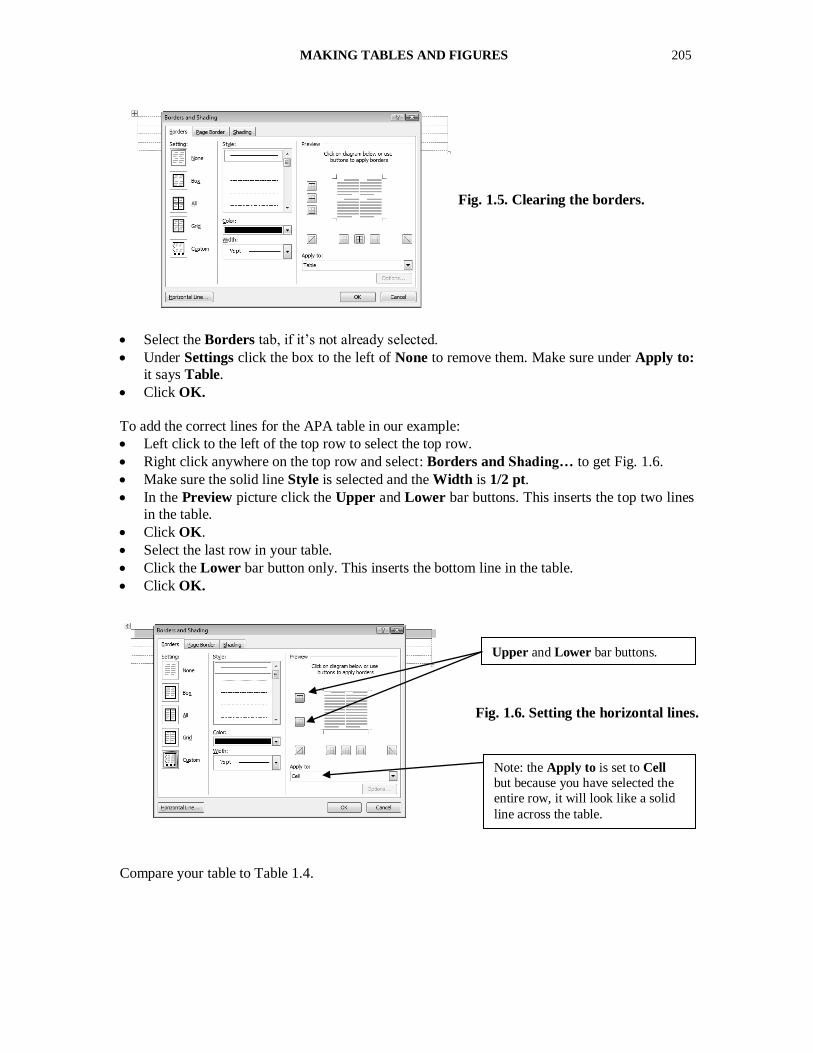
Select the Borders tab, if it’s not already selected.
Under Settings click the box to the left of None to remove them. Make sure under Apply to:
it says Table.
Click OK.
To add the correct lines for the APA table in our example:
Left click to the left of the top row to select the top row.
Right click anywhere on the top row and select: Borders and Shading… to get Fig. 1.6.
Make sure the solid line Style is selected and the Width is 1/2 pt.
In the Preview picture click the Upper and Lower bar buttons. This inserts the top two lines
in the table.
Click OK.
Select the last row in your table.
Click the Lower bar button only. This inserts the bottom line in the table.
Click OK.
Compare your table to Table 1.4.
Fig. 1.5. Clearing the borders.
Upper and Lower bar buttons.
Note: the Apply to is set to Cell
but because you have selected the
entire row, it will look like a solid
line across the table.
Fig. 1.6. Setting the horizontal lines.
206 APPENDIX C
Table 1.4. Step 2
Step 3: Adding the Text and Data
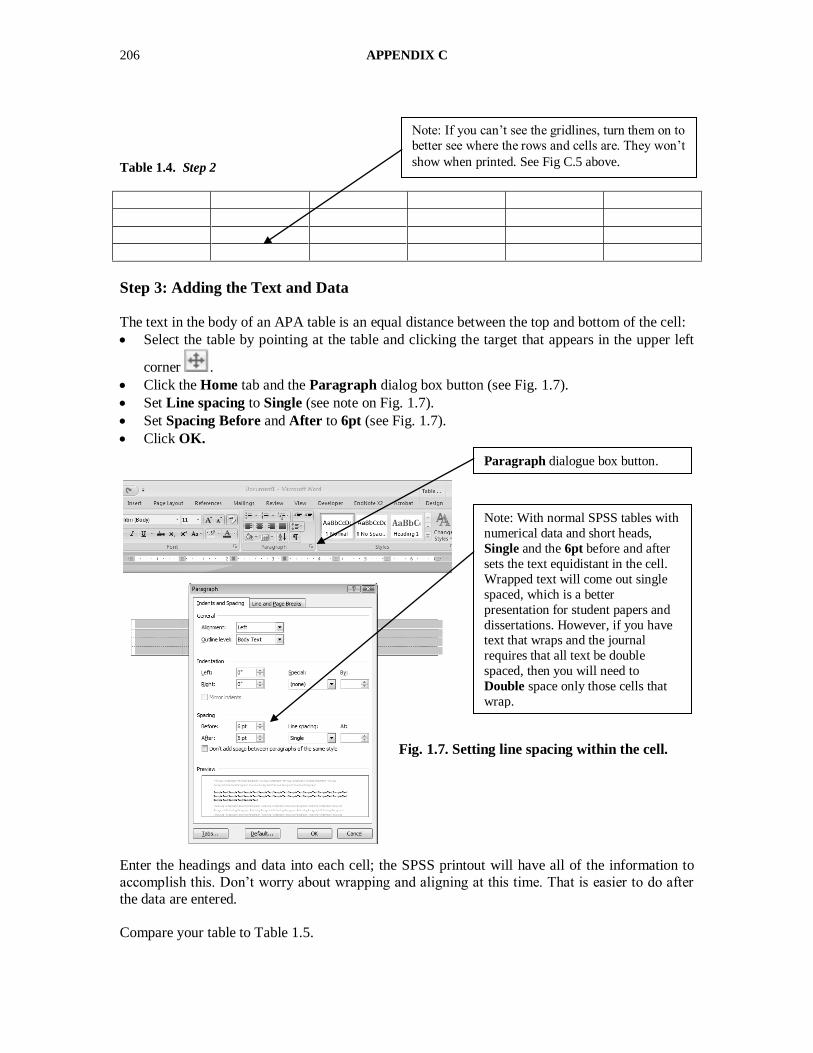
The text in the body of an APA table is an equal distance between the top and bottom of the cell:
Select the table by pointing at the table and clicking the target that appears in the upper left
corner .
Click the Home tab and the Paragraph dialog box button (see Fig. 1.7).
Set Line spacing to Single (see note on Fig. 1.7).
Set Spacing Before and After to 6pt (see Fig. 1.7).
Click OK.
Enter the headings and data into each cell; the SPSS printout will have all of the information to
accomplish this. Don’t worry about wrapping and aligning at this time. That is easier to do after
the data are entered.
Compare your table to Table 1.5.
Note: If you can’t see the gridlines, turn them on to
better see where the rows and cells are. They won’t
show when printed. See Fig C.5 above.
Fig. 1.7. Setting line spacing within the cell.
Note: With normal SPSS tables with
numerical data and short heads,
Single and the 6pt before and after
sets the text equidistant in the cell.
Wrapped text will come out single
spaced, which is a better
presentation for student papers and
dissertations. However, if you have text that wraps and the journal
requires that all text be double
spaced, then you will need to
Double space only those cells that
wrap.
Paragraph dialogue box button.
MAKING TABLES AND FIGURES 207
Table 1.5. Step 3
Source df SS MS F p
Between
groups
2 18.14 9.07 4.09 .02
Within groups 70 155.23 2.22
Total 72 173.37
Step 4: Adjusting the Column Widths In an APA table, the Heads should be center aligned in the cell and the Stubs are left aligned.
The numbers in the Cell are decimal aligned and centered under the Heads. Notice also that
“Between groups” wrapped. Let’s first align the Heads and Stubs, then fix that wrap and finally align the data under the Heads.
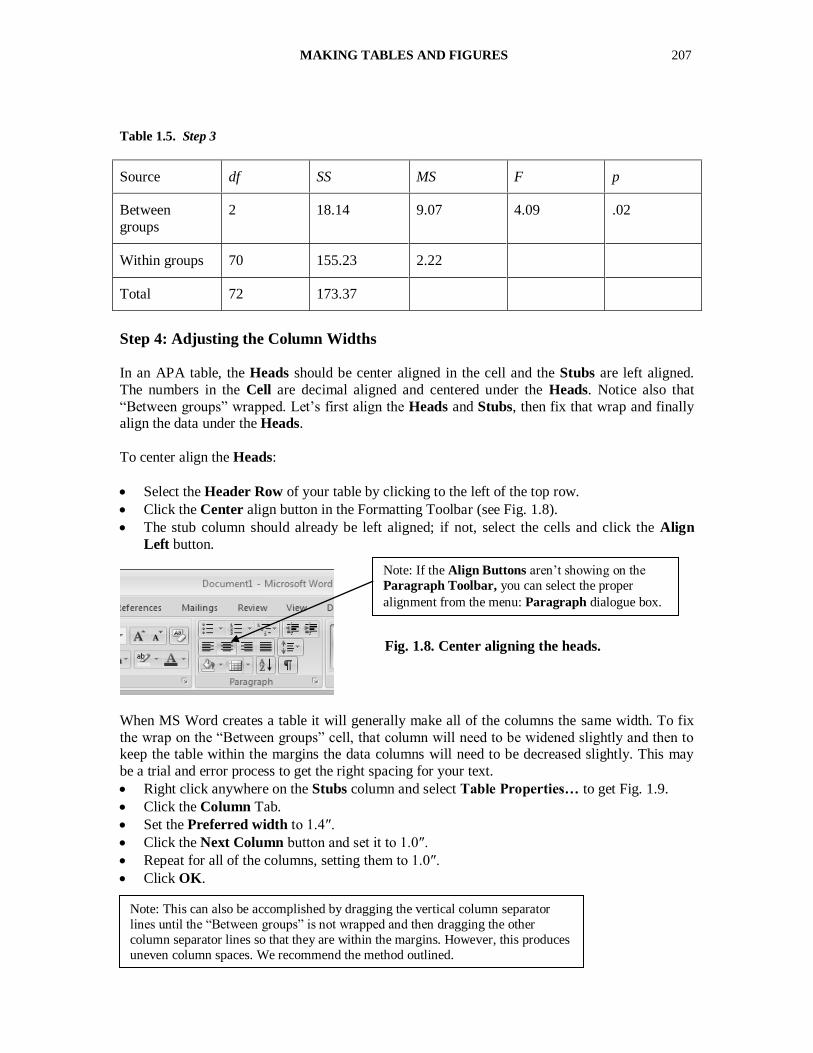
To center align the Heads:
Select the Header Row of your table by clicking to the left of the top row.
Click the Center align button in the Formatting Toolbar (see Fig. 1.8).
The stub column should already be left aligned; if not, select the cells and click the Align
Left button.
When MS Word creates a table it will generally make all of the columns the same width. To fix
the wrap on the “Between groups” cell, that column will need to be widened slightly and then to keep the table within the margins the data columns will need to be decreased slightly. This may
be a trial and error process to get the right spacing for your text.
Right click anywhere on the Stubs column and select Table Properties… to get Fig. 1.9.
Click the Column Tab.
Set the Preferred width to 1.4″.
Click the Next Column button and set it to 1.0″.
Repeat for all of the columns, setting them to 1.0″.
Click OK.
Note: If the Align Buttons aren’t showing on the
Paragraph Toolbar, you can select the proper
alignment from the menu: Paragraph dialogue box.
Note: This can also be accomplished by dragging the vertical column separator
lines until the “Between groups” is not wrapped and then dragging the other
column separator lines so that they are within the margins. However, this produces
uneven column spaces. We recommend the method outlined.
Fig. 1.8. Center aligning the heads.

208 APPENDIX C
Compare your table to Table 1.6.
Table 1.6. Step 4
Source df SS MS F p
Between groups 2 18.14 9.07 4.09 .02
Within groups 70 155.23 2.22
Total 72 173.37
Step 5: Centering the Data Cells
To set the Cell columns so that they are all centered under their Heads, you will need to set the
Tabs for each column of data cells to a Decimal Tab. We recommend this method of setting all columns the same and then adjusting them separately so they look right, because it requires less
individual column adjustment:
Select just the data cells by clicking in the upper left one, holding the shift key down, and
then clicking in the lower right cell.
Click the Paragraph dialog box button and then the Tabs button to get Fig. 1.10.
Clear all of the Tabs in the selected cells first by clicking the Clear All button.
Click Alignment Decimal.
Type .35″ in the Tab stop position box.
Click the Set button.
Click OK.
Fig. 1.9. Adjusting the
column widths.
Fig. 1.10. Setting the decimal tabs.
MAKING TABLES AND FIGURES 209
Compare your table to Table 1.7.
Table 1.7. Step 5
Source df SS MS F p
Between groups 2 18.14 9.07 4.09 .02
Within groups 70 155.23 2.22
Total 72 173.37
Step 6: Touch Up the Finished Table
The df numbers looks like they could be adjusted slightly to the right and the p slightly to the left.
We show you this so that you will know how to get a perfect decimal alignment of the data under
the column head text. This may be trial and error depending on your data.
Select the cells of the df column by clicking first on the top data cell, “2,” hold the Shift key
down, and then click on the bottom data cell, “72.”
Click the Paragraph dialog box button and then the Tabs button.
Clear all of the Tabs in the selected cells first by clicking the Clear All button.
Under Alignment, Click Decimal.
Type .45″ in the Tab stop position box, to set decimal tab .45″ from the left edge of the cell.
Click the Set button.
Click OK.
Repeat for the p column but set it to .25″ to set decimal tab .25″ from the left edge of the cell.
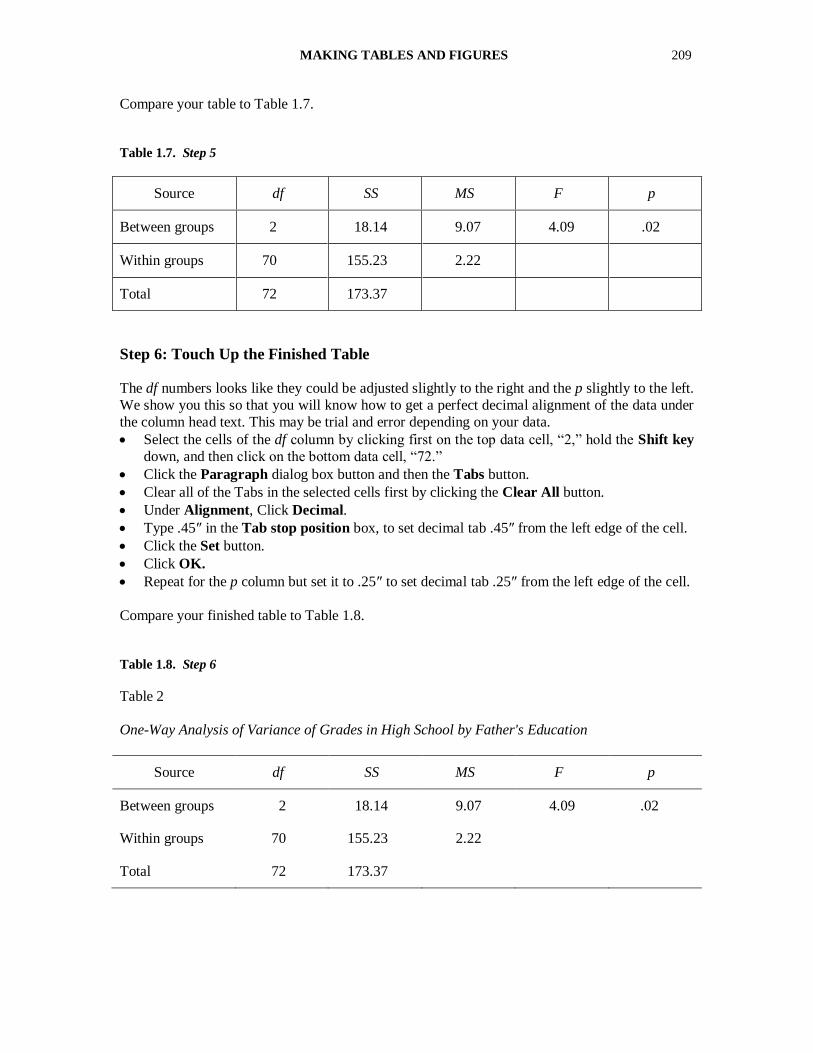
Compare your finished table to Table 1.8.
Table 1.8. Step 6
Table 2
One-Way Analysis of Variance of Grades in High School by Father's Education
Source df SS MS F p
Between groups 2 18.14 9.07 4.09 .02
Within groups 70 155.23 2.22
Total 72 173.37
210 APPENDIX C
Adjusting the SPSS Output to Approximate the APA Format
The preceding example shows how the standard SPSS output can be used to create a table in APA
format. However, this does require some knowledge of your word processing program's table
creation capabilities in order to accomplish this task. It also requires retyping the data into the
table. You can adjust SPSS so that the output will approximate the APA format. We would not recommend submitting this to an APA journal, but it may be acceptable for student papers and
some graduate program committees.
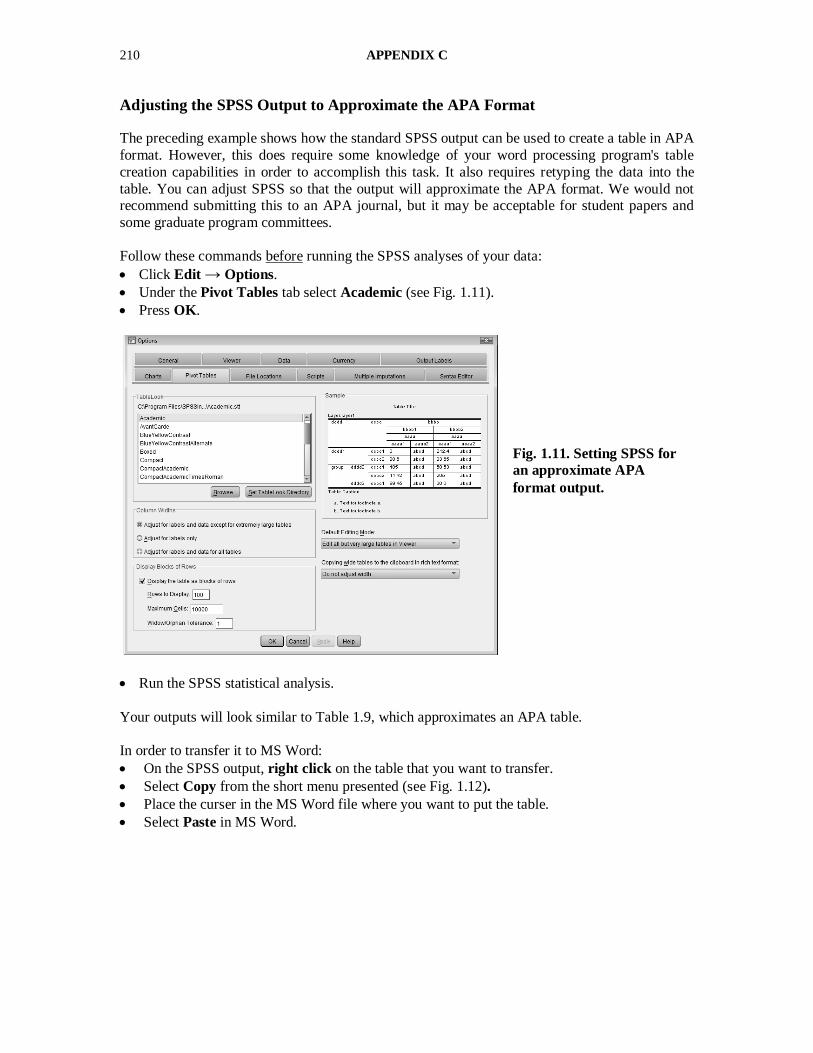
Follow these commands before running the SPSS analyses of your data:
Click Edit → Options.
Under the Pivot Tables tab select Academic (see Fig. 1.11).
Press OK.
Run the SPSS statistical analysis.
Your outputs will look similar to Table 1.9, which approximates an APA table.
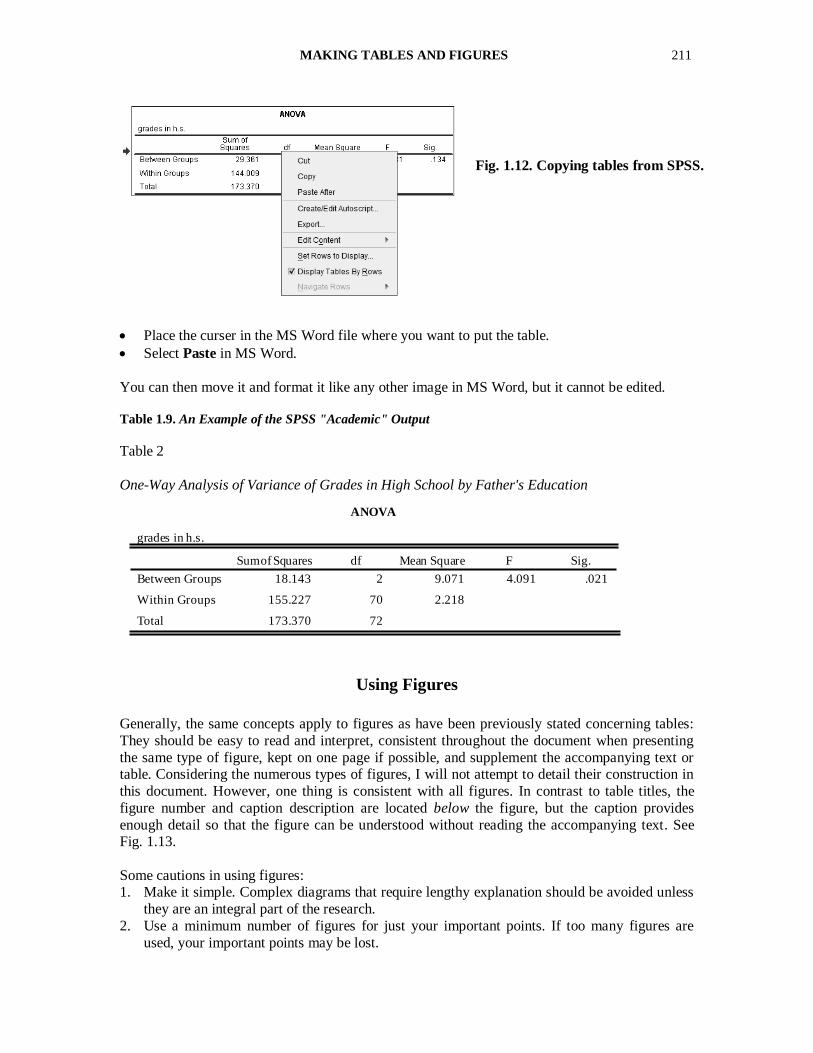
In order to transfer it to MS Word:
On the SPSS output, right click on the table that you want to transfer.
Select Copy from the short menu presented (see Fig. 1.12).
Place the curser in the MS Word file where you want to put the table.
Select Paste in MS Word.
Fig. 1.11. Setting SPSS for
an approximate APA
format output.
MAKING TABLES AND FIGURES 211
Place the curser in the MS Word file where you want to put the table.
Select Paste in MS Word.
You can then move it and format it like any other image in MS Word, but it cannot be edited.
Table 1.9. An Example of the SPSS "Academic" Output
Table 2
One-Way Analysis of Variance of Grades in High School by Father's Education
ANOVA
grades in h.s.
18.143 2 9.071 4.091 .021
155.227 70 2.218
173.370 72
Between Groups
Within Groups
Total
Sum of Squares df Mean Square F Sig.
Using Figures
Generally, the same concepts apply to figures as have been previously stated concerning tables:
They should be easy to read and interpret, consistent throughout the document when presenting
the same type of figure, kept on one page if possible, and supplement the accompanying text or table. Considering the numerous types of figures, I will not attempt to detail their construction in
this document. However, one thing is consistent with all figures. In contrast to table titles, the
figure number and caption description are located below the figure, but the caption provides
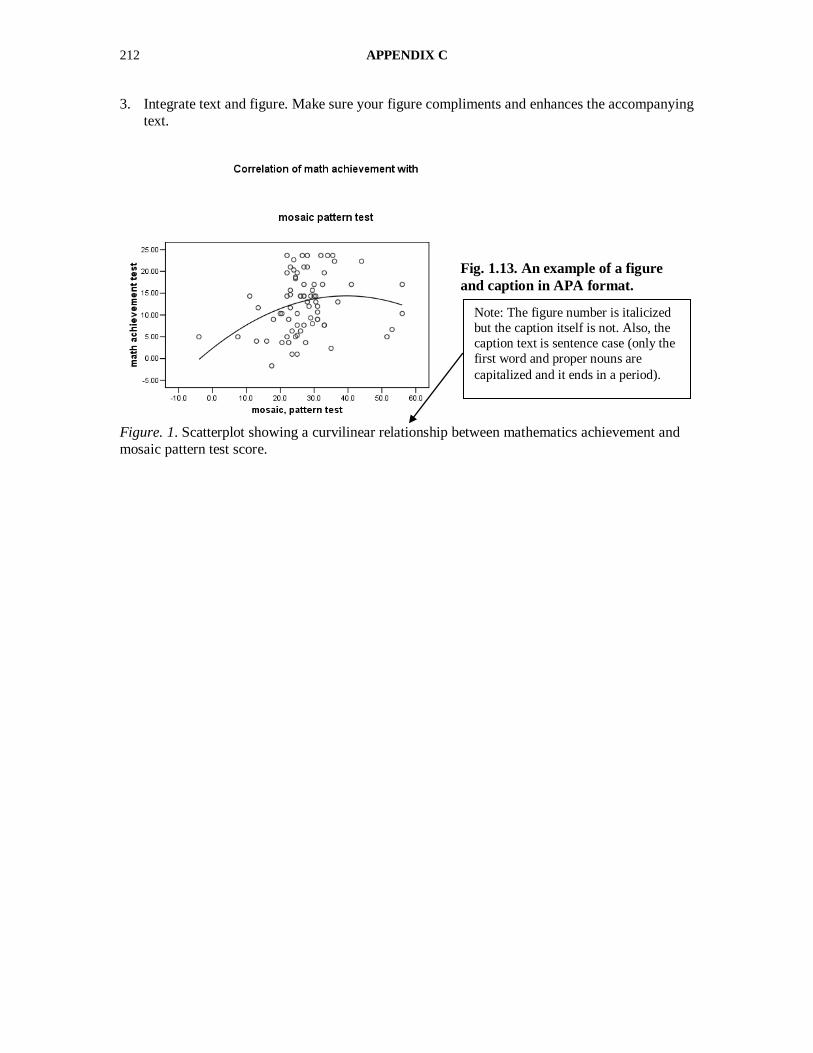
enough detail so that the figure can be understood without reading the accompanying text. See Fig. 1.13.
Some cautions in using figures: 1. Make it simple. Complex diagrams that require lengthy explanation should be avoided unless
they are an integral part of the research.
2. Use a minimum number of figures for just your important points. If too many figures are
used, your important points may be lost.
Fig. 1.12. Copying tables from SPSS.
212 APPENDIX C
3. Integrate text and figure. Make sure your figure compliments and enhances the accompanying
text.
Figure. 1. Scatterplot showing a curvilinear relationship between mathematics achievement and
mosaic pattern test score.
Fig. 1.13. An example of a figure
and caption in APA format.
Note: The figure number is italicized
but the caption itself is not. Also, the
caption text is sentence case (only the
first word and proper nouns are
capitalized and it ends in a period).