intermediate sanctions for non-violent offenders … of program policy analysis & government...
TRANSCRIPT

Office of Program Policy Analysis & Government Accountability an office of the Florida Legislature
March 2010 Report No. 10-27
Intermediate Sanctions for Non-Violent Offenders Could Produce Savings at a glance Some states have implemented policies to reduce criminal justice costs by reserving prison beds for the most dangerous criminals and using intermediate sanctions for non-violent offenders. By 2015, Florida’s prison population is expected to grow to over 115,000 inmates, which would require building nine new prisons at a cost of over $862 million.
The Legislature could consider creating pilot programs to use intermediate sanctions for some non-violent offenders. These programs could produce significant cost savings by diverting some low-risk offenders to alternatives such as community supervision with electronic monitoring, probation and restitution centers, day reporting centers, and community residential substance abuse treatment.
Scope ________________ As requested by the Legislature, OPPAGA identified alternatives for reducing prison costs by expanding the use of community-based intermediate sanctions.
Background ____________ Florida’s prison population has grown 47% over the past decade, from 68,599 inmates in Fiscal Year 1998-99 to 100,894 in Fiscal Year 2008-09. This population is projected to
increase another 12% by 2015 to over 115,500 inmates.
According to the Florida Department of Corrections, Florida pays an average of $20,414 to incarcerate each inmate for a year and approximately $95 million to build a new prison that houses 1,335 inmates. The projected increase of 15,000 inmates by 2015 would require building nine prisons at a total cost of over $862 million. Each new prison adds $27 million to the department’s annual operating budget.
There has been nationwide interest in exploring options to reduce corrections costs. Several states have implemented policy changes to target prison beds for the most dangerous criminals. Texas, in particular, has gained national recognition for its efforts to divert some offenders from prison. In 2007, the Texas legislature appropriated $241 million, which would have otherwise been spent on prison construction and operation, to create a network of short-term residential diversion and treatment facilities that serve low-level offenders; the state also expanded outpatient drug and mental health treatment resources. These steps were successful in stabilizing the state’s prison population, which grew by only 529 inmates between January 2007 and December 2008, compared to the 5,141 increase that had been projected.

OPPAGA Report Report No. 10-27
2
The 2009 Florida Legislature took steps to divert some offenders from prison. Chapter 2009-64, Laws of Florida, provided that the court may place an offender into a post-adjudicatory treatment-based drug court program if the offender is not violent and the offender’s Criminal Punishment Code score sheet total is 52 points or fewer. In addition, Ch. 2009-63, Laws of Florida, created a prison diversion pilot program in two judicial circuits, which provided funding to divert up to 300 felony offenders from prison in Fiscal Year 2009-10.
Findings _______________ The Legislature could consider additional options to reduce prison costs by authorizing increased use of intermediate sanctions for some felony offenders. These sanctions are more restrictive than probation but not as restrictive as incarceration, and include alternatives such as community supervision with electronic monitoring, probation and restitution centers, day reporting centers, and community residential substance abuse treatment. These options may be appropriate for a large number of Florida’s criminal justice population, as over 70% of new prison admissions and 40% of current prisoners are non-violent offenders, most of whom do not have violent criminal histories.1
Many offenders being sent to prison may be appropriate for intermediate sanctions
However, while diverting such felony offenders from prison would generate cost savings, such action also has both positive and negative considerations.
Section 944.012, Florida Statutes, provides that non-violent felony offenders should be
1 This report classifies offenders as not having a violent history if
they had no prior commitments to the Department of Corrections (prison or felony probation) for violent offenses. However, it should be noted that some such offenders may have had prior federal convictions, convictions in other states, or have committed offenses that differed from those reflected by their conviction; some offenders, for example, may have plea bargained for convictions on lesser offenses.
diverted from the prison system through community-based sanctions, thereby reserving prison beds for those offenders who are deemed to be most dangerous to the community. However, many non-violent offenders are sentenced to prison.
Of the 100,899 offenders in prison on August 31, 2009, approximately 40% (40,185) were convicted of non-violent offenses (see Exhibit 1).2
Exhibit 1 Approximately 40% of Inmates in Prison Were Convicted of Non-Violent Offenses
For example, 20% of inmates (19,887) had been convicted of drug offenses.
Prison Population on August 31, 2009 Number Percentage Non-violent Offenses Burglary (non-violent) 3,106 3% Property (theft, fraud, damage) 8,210 8% Drugs 19,887 20% Weapons (non-violent) 2,770 3% Other non-violent offenses 6,212 6% Subtotal 40,185 40%
Violent Offenses Murder/Manslaughter 12,689 13% Sexual/ Lewd Behavior 10,875 11% Robbery 12,597 12% Burglary(violent) 11,794 12% Weapons (violent) 362 <1% Other violent offenses 12,188 12% Subtotal 60,505 60%
Other/Missing Information Other/Missing Information 209 <1%
Total 100,899 100% Source: OPPAGA analysis of inmate population data on August 31, 2009, obtained from the Department of Corrections.
While some persons convicted of non-violent offenses are sentenced to prison because of prior violent offenses, most (61%) of the non-violent offenders currently in prison do not have prior commitments for violent offenses (see Exhibit 2). 2 For purposes of this report, non-violent offenses are defined by
omission from the class of forcible felonies defined in s. 776.08, F.S., which include treason, murder, manslaughter, sexual battery, carjacking, home invasion robbery, robbery, burglary, arson, kidnapping, aggravated assault, aggravated battery, aggravated stalking, aircraft piracy, unlawful throwing, placing, or discharging of a destructive device or bomb, and any other felony which involves the use or threat of physical force or violence against any individual.
Report No. 10-27 OPPAGA Report
3
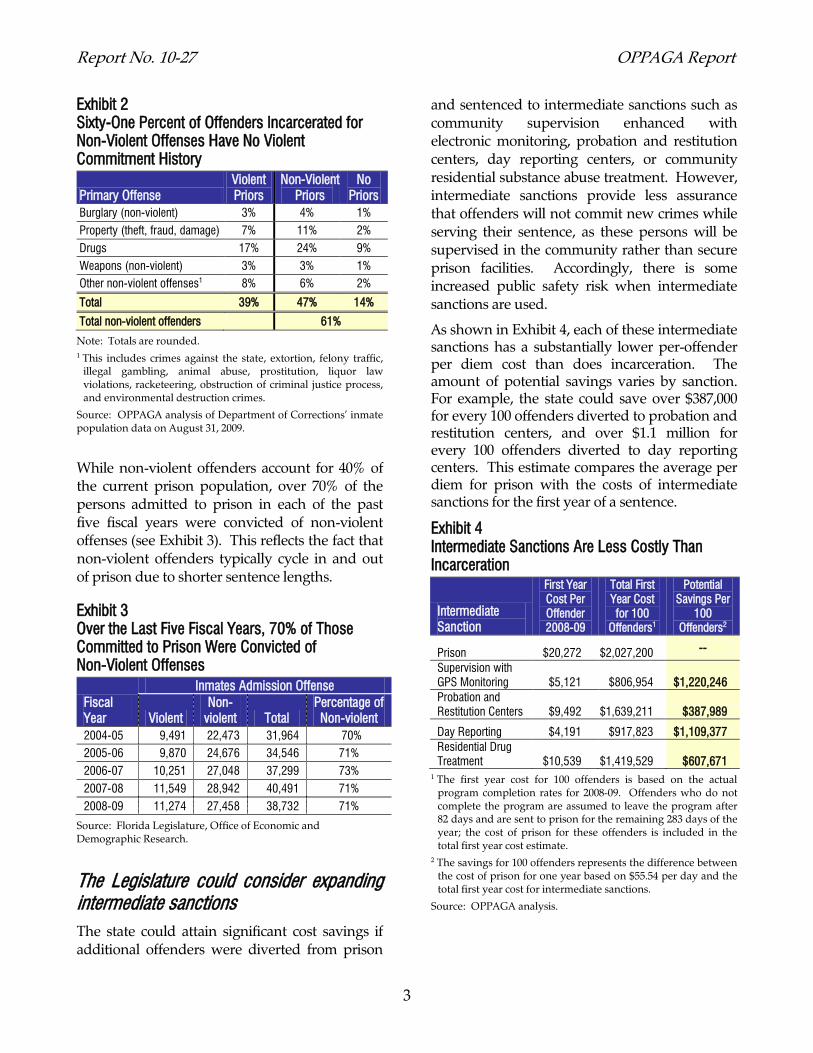
Exhibit 2 Sixty-One Percent of Offenders Incarcerated for Non-Violent Offenses Have No Violent Commitment History
Primary Offense Violent Priors
Non-Violent Priors
No Priors
Burglary (non-violent) 3% 4% 1% Property (theft, fraud, damage) 7% 11% 2% Drugs 17% 24% 9% Weapons (non-violent) 3% 3% 1% Other non-violent offenses1 8% 6% 2%
Total 39% 47% 14%
Total non-violent offenders 61%
Note: Totals are rounded. 1 This includes crimes against the state, extortion, felony traffic,
illegal gambling, animal abuse, prostitution, liquor law violations, racketeering, obstruction of criminal justice process, and environmental destruction crimes.
Source: OPPAGA analysis of Department of Corrections’ inmate population data on August 31, 2009.
While non-violent offenders account for 40% of the current prison population, over 70% of the persons admitted to prison in each of the past five fiscal years were convicted of non-violent offenses (see Exhibit 3). This reflects the fact that non-violent offenders typically cycle in and out of prison due to shorter sentence lengths.
Exhibit 3 Over the Last Five Fiscal Years, 70% of Those Committed to Prison Were Convicted of Non-Violent Offenses
Fiscal Year
Inmates Admission Offense
Violent Non-
violent Total Percentage of Non-violent
2004-05 9,491 22,473 31,964 70% 2005-06 9,870 24,676 34,546 71% 2006-07 10,251 27,048 37,299 73% 2007-08 11,549 28,942 40,491 71% 2008-09 11,274 27,458 38,732 71%
Source: Florida Legislature, Office of Economic and Demographic Research.
The Legislature could consider expanding intermediate sanctions The state could attain significant cost savings if additional offenders were diverted from prison
and sentenced to intermediate sanctions such as community supervision enhanced with electronic monitoring, probation and restitution centers, day reporting centers, or community residential substance abuse treatment. However, intermediate sanctions provide less assurance that offenders will not commit new crimes while serving their sentence, as these persons will be supervised in the community rather than secure prison facilities. Accordingly, there is some increased public safety risk when intermediate sanctions are used.
As shown in Exhibit 4, each of these intermediate sanctions has a substantially lower per-offender per diem cost than does incarceration. The amount of potential savings varies by sanction. For example, the state could save over $387,000 for every 100 offenders diverted to probation and restitution centers, and over $1.1 million for every 100 offenders diverted to day reporting centers. This estimate compares the average per diem for prison with the costs of intermediate sanctions for the first year of a sentence.
Exhibit 4 Intermediate Sanctions Are Less Costly Than Incarceration
Intermediate Sanction
First Year Cost Per Offender 2008-09
Total First Year Cost for 100
Offenders1
Potential Savings Per
100 Offenders2
Prison $20,272 $2,027,200 --
Supervision with GPS Monitoring $5,121 $806,954 $1,220,246 Probation and Restitution Centers $9,492 $1,639,211 $387,989
Day Reporting $4,191 $917,823 $1,109,377 Residential Drug Treatment $10,539 $1,419,529 $607,671
1 The first year cost for 100 offenders is based on the actual program completion rates for 2008-09. Offenders who do not complete the program are assumed to leave the program after 82 days and are sent to prison for the remaining 283 days of the year; the cost of prison for these offenders is included in the total first year cost estimate.
2 The savings for 100 offenders represents the difference between the cost of prison for one year based on $55.54 per day and the total first year cost for intermediate sanctions.
Source: OPPAGA analysis.

OPPAGA Report Report No. 10-27
4
Research indicates that sentencing low-level, non-violent offenders to intermediate sanctions has both positive and negative public safety implications. Therapeutic sanctions, such as residential drug treatment, have been shown to reduce the probability that the offenders will commit new offenses, both improving public safety and reducing future criminal justice costs.
Community supervision with electronic monitoring has low costs but with caveats. Community supervision with electronic monitoring oversees offenders via an electronic device that verifies that offenders are in a specific location (such as their home) and/or tracks their movements.3 It costs an average of $14.03 per day to supervise an offender under community supervision with GPS monitoring, compared to the average of $55.54 per day cost for incarceration.4 In addition, some offenders pay these monitoring costs, which reduce the state costs of this sanction.5 The state could save over $1.2 million for every 100 offenders diverted to community control with electronic monitoring in lieu of incarceration during the first year of supervision (see Exhibit 5).6
As of September 30, 2009, the department was supervising 2,595 offenders on electronic monitoring. Most of these persons (70%) were sentenced for sex offenses. However, a different target group for this sanction may be non-violent offenders with a Criminal Punishment Code
3 Probation is supervision in the community under conditions
specified by the court, such as abstaining from alcohol and drugs and maintaining employment. Community control or ‘house arrest’ is a more intensive supervision in which offenders are court-ordered to remain within the confines of their residence and may only leave with permission of their probation officers.
4 Electronic monitoring may be done through either radio frequency monitoring, which detects whether offenders are within a specified distance of a mandated location (such as remaining in their homes), or through global positioning satellite monitoring, which tracks offenders’ movements. The cost of the two systems is $7.06 and $14.03 per day, respectively.
5 Section 948.09(2), F.S., provides that offenders are to pay the costs for electronic monitoring. However, judges may waive these costs for offenders who are indigent.
6 The successful outcome rate is based on a 2003 study conducted by the Florida Department of Corrections Bureau of Research and Data Analysis.
score sheet total in the 45 to 60 point range who would otherwise spend one to two years in prison.7
Electronic monitoring has been shown to significantly reduce the risk that offenders supervised in the community commit new offenses or technical violations, or abscond from supervision. A 2006 study of Florida’s electronic monitoring efforts concluded that people on radio frequency monitoring were 95.7% less likely and those on GPS monitoring were 90.2% less likely to be committed to prison for technical violations than those offenders sentenced to home confinement without electronic monitoring..
8 ,9
7 Section 921.002, F.S., the Criminal Punishment Code, provides
for sentencing of all felony offenses, except capital felonies, committed on or after October 1, 1998. Section 921.0024, F.S., provides a score sheet for determining the lowest permissible prison sentence under the code. The lowest permissible sentence for an offender with 45 or 60 points is 12 or 24 months, respectively.
Further, the study showed that electronic monitoring also significantly reduced the likelihood of revocation for a new offense or absconding.
8 “Under Surveillance: An Empirical Test of the Effectiveness and Consequences of Electronic Monitoring”; Kathy G. Padgett, William D. Bales, and Thomas G. Blomberg; Criminology & Public Policy; Feb 2006; 5,1.
9 Technical violations are not new offenses, but rather violations of conditions of probation. Technical violations range in seriousness from moving without permission to contact with the victim.

Report No. 10-27 OPPAGA Report
5
Exhibit 5 Community Supervision with Electronic Monitoring Is Significantly Less Costly Than Prison
Note: Unsuccessful exits are program outcomes that denote non-compliance with program requirements and result in termination from the program. For purposes of estimating cost savings in this report, all offenders that unsuccessfully exit are assumed to be sent to prison.
Source: OPPAGA analysis.
However, as indicated in Exhibit 5, we estimate that 25% of the offenders will violate supervision conditions and be sent to prison. This estimate is based on a 2003 Department of Corrections study of electronic monitoring effectiveness. Most of these violations will be due to technical violations such as not reporting as required or moving without permission, but 4% were arrested for a new crime while under supervision.
There are also logistical problems associated with electronic monitoring for some offenders. For example, electronic monitoring is less effective for homeless persons who lack a permanent residence, requiring more scrutiny of their movements. Also, offenders must be able to recharge the monitoring unit for eight hours each day. Further, real-time GPS monitoring requires access to a cellular signal, which may be difficult to obtain in rural areas, while radio frequency monitoring requires offenders to have a land-line telephone.
Expanding electronic monitoring to serve additional offenders would require expanding the number of probation officers employed by the Department of Corrections. This consideration is incorporated in our savings estimates.
Probation and restitution centers have relatively low costs but low completion rates. Probation and restitution centers are residential facilities
that house offenders without serious substance abuse problems who are experiencing difficulty complying with their conditions of supervision or owe restitution to victims. Offenders are required to sleep at the center at night, work during the day, pay room and board, and make restitution payments to crime victims during the first six months of their sentence. As offenders progress through their sentences, they live in the community, continue to work full time, and participate in rehabilitative programs as required by the department.
Probation and restitution centers are less expensive to operate than prisons, with an average first-year per diem rate of $26.01 per offender for Fiscal Year 2008-09, which was less than half the average prison per diem of $55.54 per offender in Fiscal Year 2008-09.10 In addition, offenders pay to providers a subsistence fee of $8 per day. As shown in Exhibit 6, the state could realize an annual savings of over $387,000 for each 100 offenders diverted to probation and restitution centers.11
10 The per diem cost for probation and restitution centers for
offenders’ first six months of sentence is $46.92, and is $5.09 per day when offenders no longer live in the facility.
11 For purposes of estimating cost savings in this report, all offenders who unsuccessfully exit a program are assumed to be sent to prison.
Prison
75 successful outcomes
Supervision with GPS Monitoring
$383,563
$423,39125 unsuccessful outcomes
for every 100 diversions
to prison
$806,954TOTAL: $2,027,200
POTENTIAL SAVINGS: $1,220,246

OPPAGA Report Report No. 10-27
6
Exhibit 6 Probation and Restitution Centers Are Less Costly Than Prisons
Note: Unsuccessful exits are program outcomes that denote non-compliance with program requirements and result in termination from the program. For purposes of estimating cost savings in this report, all offenders that unsuccessfully exit are assumed to be sent to prison.
Source: OPPAGA analysis.
The target group for probation and restitution centers includes offenders who have violated the conditions of their probation, non-violent offenders who owe victim restitution, and/or non-violent offenders who need a structured environment that will help them obtain employment and establish stability. The department currently contracts for three probation and restitution centers run by private vendors in Jacksonville, Pensacola, and Orlando; these centers served 502 offenders in Fiscal Year 2008-09.12
However, outcomes for probation and restitution centers are mixed. The completion rate for offenders assigned to probation and restitution centers was only 31.5% in Fiscal Year 2008-09; the department attributes this outcome to the center’s lack of rehabilitative programming. Outcomes are positive for those offenders who complete the program; data shows that only 5.5% of program completers had returned to prison for a new offense within two years of their release, significantly below the 15% two-year recidivism rate for released incarcerated offenders.
12 Florida formerly had nine probation and restitutions centers,
which served an average of 1,077 offenders between Fiscal Years 1994-95 through 1999-00. However, the department reports that several facilities closed when the program was outsourced.
The completion rates of probation and restitution centers would likely increase if these centers offered more extensive rehabilitative programming to their participants. The department reports it will likely add such services due to its new focus on implementing evidence-based practices. A recent pilot program conducted by one provider offered programs such as life skills training and anger management courses at no additional cost to the state. This provider reported that completion rates subsequently increased from 42% in Fiscal Year 2006-07 to 51% in Fiscal Year 2007-08, exceeding the 31.6% average successful completion rate for all centers in Fiscal Year 2007-08. The department plans to add more programming criteria to the program model in its next invitation to negotiate and does not anticipate that this requirement will increase program costs.
Expanding probation and restitution centers could be done through either contracting for new locations or expanding capacities at existing facilities. Current providers reported no significant impediments to increasing the capacities of their centers. Expanding probation and restitution centers to serve additional offenders would require expanding the number of probation officers employed by the Department of Corrections. This consideration is incorporated in our savings estimates.
Prison
32 successful completions
Probation and Restitution Center
$298,998
$1,340,21368 unsuccessful exits
for every 100 diversions
to prison
POTENTIAL SAVINGS: $387,989
$1,639,211TOTAL: $2,027,200

Report No. 10-27 OPPAGA Report
7
Day reporting centers have relatively low costs and have potential for relatively high completion rates. Day reporting centers require offenders to work or attend rehabilitative programs during the day but allow these persons to go home to sleep at night. The centers typically offer a range of programs that can be tailored to each offender through needs assessment and case management. These programs may include marriage and family counseling, financial management, domestic violence counseling, and substance abuse treatment and testing. The centers may also provide community resource referrals, assistance in locating housing and employment, and job training programs such as GED preparation, interviewing skills, and vocational training. Centers typically have phases that decrease required participation over time; for example, an offender may be required initially to report to the center eight
hours per day, five days per week, but be allowed to report less frequently after establishing a record of compliance and gaining employment.
Day reporting centers are less expensive to operate than prisons; we estimate that centers such as these would have an average per diem cost of $11.48, which includes the department’s cost of supervision.13 The state could thus save over $1.1 million for each 100 offenders diverted to the center in lieu of prison during the first year of supervision (see Exhibit 7).14
13 This estimate is based on the cost of the two programs created
pursuant to the prison diversion pilot plus the cost of community supervision as a proxy for the cost of day reporting centers in Florida.
14 Successful completions in substance abuse treatment programs are used as a proxy for successful completions in a day reporting program. The services provided in these programs are substantially similar, without the substance abuse specific treatment.
Exhibit 7 Day Reporting Centers Are Significantly Less Costly Than Prisons
Note: Successful completions in substance abuse treatment programs are used as a proxy for successful completions in the day reporting program. Unsuccessful exits are program outcomes that denote non-compliance with program requirements and result in termination from the program. For purposes of estimating cost savings in this report, all offenders that unsuccessfully exit are assumed to be sent to prison.
Source: OPPAGA analysis.
Prison
60 successful completions
Day Reporting Center
$251,460
$666,36340 unsuccessful exits to prison
POTENTIAL SAVINGS: $1,109,377
for every 100 diversions
$917,823TOTAL: $2,027,200

OPPAGA Report Report No. 10-27
8
The Florida Department of Corrections does not currently operate day reporting centers; however, the Broward County Sheriff’s Office operates three such facilities. The centers were established in 2004 to alleviate jail overcrowding and to provide reentry services to reduce recidivism. The centers collectively serve up to 300 offenders sentenced for low-level felonies or misdemeanors. The program imposes curfews and restrictions based on individual assessments of offenders’ risk level and needs. Higher-risk offenders are placed on electronic monitoring and those suspected of drug involvement undergo random drug screening. The program is frequently used as a special condition of probation or community control or as part of a split sentence of jail followed by probation. The Broward County Sheriff’s Office reports a 77% successful completion rate and a recidivism reduction of 35% for program completers.15
The state could implement day reporting centers by contracting with vendors or funding additional slots at existing local programs such as those in Broward County. Implementing day reporting centers to serve additional offenders would require expanding the number of probation officers employed by the Department of Corrections. This consideration is incorporated in our savings estimates.
Community-based substance abuse treatment has lower costs than incarceration and reduces recidivism. Almost half (19,887) of the non-violent offenders currently in Florida prisons were sentenced for drug offenses; many such offenders commit crimes either under the influence or to support their addictions. Programs that treat offenders’ addictions can help reduce the likelihood that
15 While Broward County’s program has a 77% successful
completion rate, our cost savings estimate assumes a 60% successful completion rate. We assumed a lower successful completion rate because offenders sentenced to the department are convicted of more serious offenses than those sentenced to the county program.
these persons will commit future crimes. Community-based residential substance abuse treatment programs provide intensive services to offenders with substance abuse issues; offenders receive substance abuse treatment and other therapeutic services, such as life skills and anger management courses. The department offers a six-month program which is comprised of two months of residential substance abuse treatment followed by a four-month employment and re-entry component in which the offender resides and works in the community.16
Residential treatment is a cost-effective alternative to prison. The average per-offender cost for supervision with drug treatment in the department’s six month program in Fiscal Year 2008-09 was $28.88 per day, or $10,539 for the first year.
17 The state could save over $607,000 for every 100 offenders diverted to six-month residential treatment in lieu of prison during the first year of supervision, as shown in Exhibit 8.18
16 The department also offers an intensive 18-month treatment
program for offenders with the most serious substance abuse issues.
As treating the substance abuse issues lowers the likelihood of recidivism, such programs can also reduce future correctional costs.
17 Treatment cost for the first six months of the first year is $52.66 per day, while the community supervision cost for the last six months of the first year is $5.09 per day.
18 This estimate illustrates cost savings for the six-month program as this program is appropriate for most offenders.

Report No. 10-27 OPPAGA Report
9
Exhibit 8 Residential Substance Abuse Treatment Is Less Costly Than Prison
Note: Unsuccessful exits are program outcomes that denote non-compliance with program requirements and result in termination from the program. For purposes of estimating cost savings in this report, all offenders that unsuccessfully exit are assumed to be sent to prison.
Source: OPPAGA analysis.
As shown in Exhibit 8, most offenders in residential treatment complete the program. Those that complete the program also have low recidivism rates (see Exhibit 9).
Exhibit 9 Successful Completion and Recidivism Rates for Community Residential Substance Abuse Treatment
Program
Bed Capacity
(FY 2008-09)
Number of Enrollments (FY 2008-09)
Successful Completers (FY 2008-09)
Two-year Recidivism for Completers (FY 2006-07)
6-month 787 3,376 61.5% 4.7%
18-month 286 879 52.2% 2.9%
Source: Florida Department of Corrections.
The state could expand residential substance abuse treatment beds by contracting with existing vendors for additional capacity. According to the department, the existing treatment network could expand by approximately 2,000 residential beds if the Legislature appropriated such funding. Expanding residential substance abuse treatment to serve additional offenders would require expanding the number of probation officers employed by the Department of Corrections. This consideration is incorporated in our savings estimates.
The Legislature should balance intermediate sanctions with prison bed construction If the Legislature wishes to achieve cost savings by expanding alternative sanctions, it could do so by creating pilot projects that could serve a portion of the anticipated increase in Florida’s offender population. This approach would test the outcomes of the programs and enable judges, state attorneys, and public defenders to become more familiar with these sanctions as an alternative to prison while maintaining sufficient prison bed capacity to house dangerous offenders as well as those who fail to complete intermediate sanction programs. It would also enable the Department of Corrections to more precisely determine the level of cost savings attributed to prison diversion sanctions, which could vary somewhat as offender characteristics and treatment needs vary greatly. OPPAGA’s estimated savings assume average inmate characteristics and prison per diem costs.
If the Legislature implements this approach, it may wish to direct OPPAGA to periodically study the effectiveness of intermediate sanctions in reducing recidivism and
Prison
62 successful completions
Residential Substance Abuse Treatment
$648,149
$771,38038 unsuccessful exits
for every 100 diversions
POTENTIAL SAVINGS: $607,671
$1,419,529TOTAL: $2,027,200
to prison

OPPAGA Report Report No. 10-27
10
achieving cost savings and to make recommendations on how to expand the pilot programs to maximize these benefits.
Agency Response ______ In accordance with the provisions of s. 11.51(5), Florida Statutes, a draft of our report was submitted to the Secretary of the Florida Department of Corrections to review and respond. The Secretary’s written response is reprinted herein in Appendix A.

Report No. 10-27 OPPAGA Report
11
Appendix A

12
The Florida Legislature
Office of Program Policy Analysis and Government Accountability
OPPAGA provides performance and accountability information about Florida government in several ways.
Reports deliver program evaluation, policy analysis, and Sunset reviews of state programs to assist the Legislature in overseeing government operations, developing policy choices, and making Florida government better, faster, and cheaper.
PolicyCasts, short narrated slide presentations, provide bottom-line briefings of findings and recommendations for select reports.
Government Program Summaries (GPS), an online encyclopedia, www.oppaga.state.fl.us/government, provides descriptive, evaluative, and performance information on more than 200 Florida state government programs.
The Florida Monitor Weekly, an electronic newsletter, delivers brief announcements of research reports, conferences, and other resources of interest for Florida's policy research and program evaluation community.
Visit OPPAGA’s website at www.oppaga.state.fl.us
OPPAGA supports the Florida Legislature by providing evaluative research and objective analyses to promote government accountability and the efficient and effective use of public resources. This project was conducted in accordance with applicable evaluation standards. Copies of this report in print or alternate accessible format may be obtained by telephone (850/488-0021), by FAX (850/487-3804), in person, or by mail (OPPAGA Report Production, Claude Pepper Building, Room 312, 111 W. Madison St., Tallahassee, FL 32399-1475). Cover photo by Mark Foley.
OPPAGA website: www.oppaga.state.fl.us
Project supervised by Rashada Houston (850/487-4971) Project conducted by Steve Lize (850/410-4747) and Kelley Seeger (850/487-9214)
Marti Harkness (850/487-9233), Staff Director
Gary R. VanLandingham, Ph.D., OPPAGA Director