dr s. k. tandon files/a0710/04011.pdf• late seedling in nursery • efficient nutrient, water...
TRANSCRIPT

Conservation Agriculture Policy –Perspective & Scope
By
Dr S. K. TandonAssistant Director General (Engg)
Indian Council of Agricultural ResearchNew Delhi, India
Email: [email protected]
Introduction
Mid sixties – high yielding varieties – Green Revolution
Production 50 mt (1950-51) to 203 m.t. (1998-99)
Required
higher doses of fertilizer
more irrigation water
increase use of plant protection chemicals
increase use of diesel and electricity
Resulted in widespread problems of resource degradation and environmental problems & GHGs
IntroductionFuel crisis in 1970 and uncertainty in
supply of hydrocarbons
growing concern of environmental pollution
by Inefficient use of energy led to emphasis on
energy efficiency
energy conservation
Increase demand on energy from Agricultural Sources
large scale deforestation
soil erosion
loss of fertility
manifold increase in commercial energy

IntroductionHigh mechanized system of USA uses 16.5% of total national energy (80% of which is provided by petroleum products)
Rice-wheat system (R-W) – main cropping system of IGP.
30% of rice and 42% of wheat grown in IGP
IGP – R-W – 13.5 m.ha.
India – 10.5 m.ha.
Pakistan 1.6 m.ha.
Bangladesh – 0.8 m.ha.
Nepal – 0.6 m.ha.
China – 10 m.ha.
Rice-wheat in India – contributes 52% of India’s total food production (220 m.t.)

Introduction
The rice-wheat areas of the Indo-
GangeticPlains and
the five agro-ecological transects
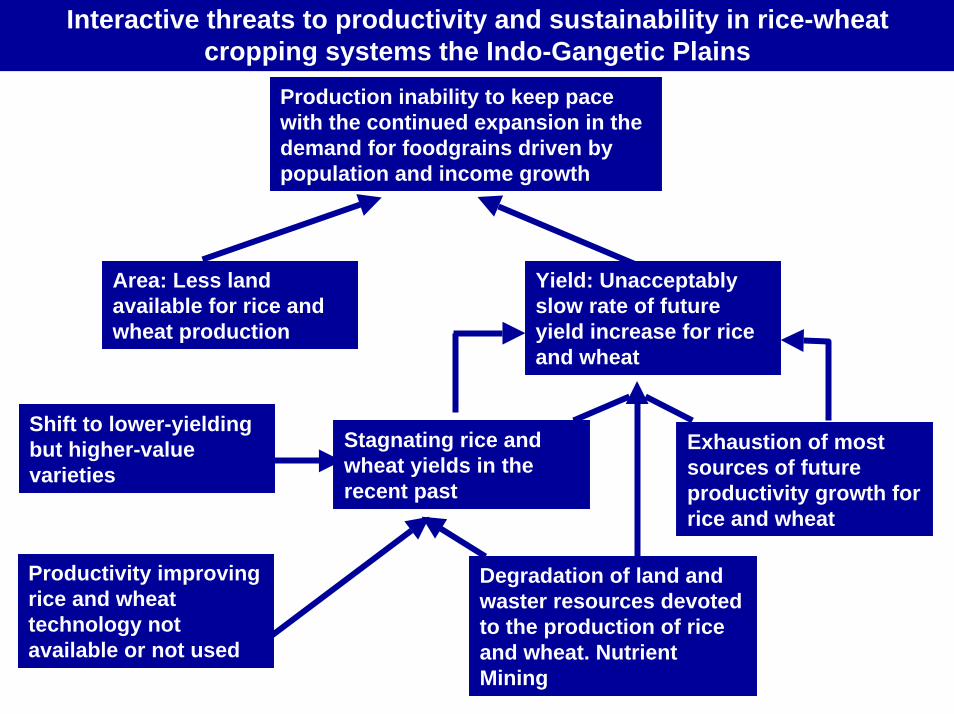
Production inability to keep pace with the continued expansion in the demand for foodgrains driven by population and income growth
Area: Less land available for rice and wheat production
Yield: Unacceptably slow rate of future yield increase for rice and wheat
Shift to lower-yielding but higher-value varieties
Stagnating rice and wheat yields in the recent past
Exhaustion of most sources of future productivity growth for rice and wheat
Productivity improving rice and wheat technology not available or not used
Degradation of land and waster resources devoted to the production of rice and wheat. Nutrient Mining
Interactive threats to productivity and sustainability in rice-wheat cropping systems the Indo-Gangetic Plains

Interrelated Sustainability concerns in rice-wheat cropping systems of the Indo-Gangetic Plains
• Yield stagnation• Yields below potential• Declining factor productivity• Receding water table• Nutrient mining & K
deficiency• Low input use efficiency• Decline in SOM,
Biodiversity/ diversification• Surface cover/burning• Competition for residues• Environmental pollution• Rice fallows• Salinity buildup and• Ground water quality
• Late onset of monsoon• Available groundwater not used in eastern IGP• Labor shortage, seasonality• Excessive tillage and puddling• Lack of water for break of GM crops in Summers• Pre-germinated weeds force tillage• Late seedling in nursery• Efficient nutrient, water management practices
Delayed rice transplanting
Late planting of winter crops
• Short turn-around time• Excessive preparatory tillage• Long duration rice varieties• Fields don’t come to condition eastern GP• Ruts of combines spoils field leveling• Pre-germinated weeds• Efficient nutrient, water management practices• Intercrops- agronomic and crop management practices• Climate change
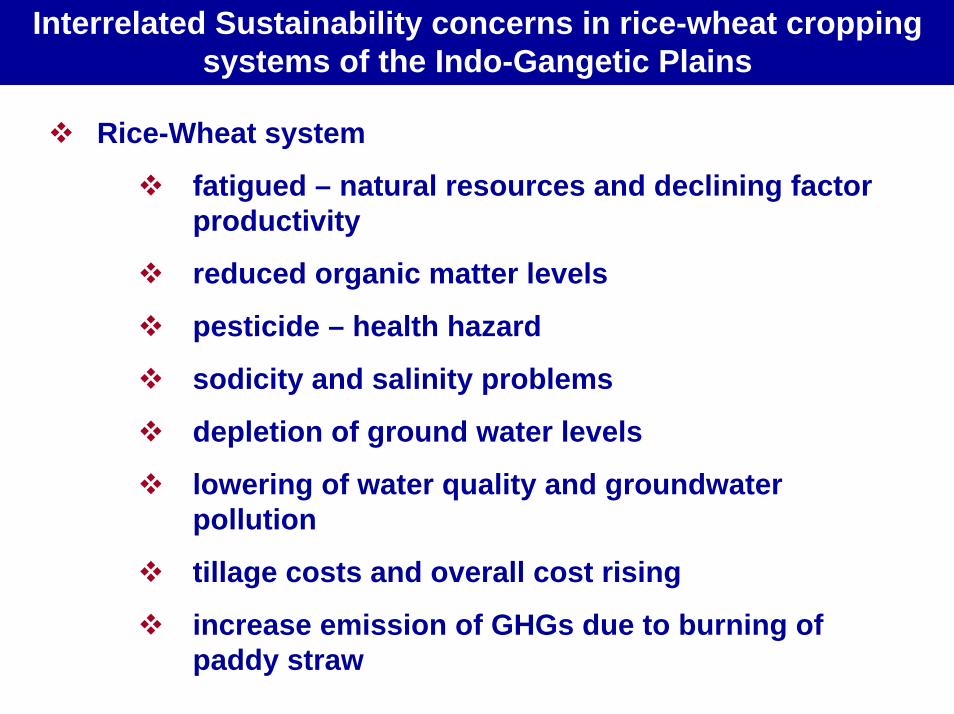
Interrelated Sustainability concerns in rice-wheat cropping systems of the Indo-Gangetic Plains
Rice-Wheat system
fatigued – natural resources and declining factor productivity
reduced organic matter levels
pesticide – health hazard
sodicity and salinity problems
depletion of ground water levels
lowering of water quality and groundwater pollution
tillage costs and overall cost rising
increase emission of GHGs due to burning of paddy straw

Interrelated Sustainability concerns in rice-wheat cropping systems of the Indo-Gangetic Plains
Sustainability of the system is in question
Consortium of South Asian NARS to address R-W system
(R-W Consortium)Bangladesh, India, Nepal, PakistanInternational Centres (CIMMYT, CIP,ICRISAT,IRRI & IWMI)ARIsNGOsPrivate entrepreneurs and farmersIGPBangladesh, India, Nepal and Pakistan – most productive agriculture region24 m.ha.30% rice and 42% wheat

Interrelated Sustainability concerns in rice-wheat cropping systems of the Indo-Gangetic Plains
Tillage – Intensive farm operations – maximum energyFuel crises 70’s – forced scientists to reduce energy requirementReduced tillage – minimum tillageConservation Tillage (CT)
development of zero-till drillsrota till drillsone pass equipment
Zero-till drills resulted in saving infueltimelabourcost of operationreduced energy requirement

Interrelated Sustainability concerns in rice-wheat cropping systems of the Indo-Gangetic Plains
CT – Conservation Agriculture (CA)
reduce input use – seed, chemicals, fertilizer, water and excessive tillage
CA - refers to a system of raising crops without tilling the soil while retaining the crop residues
Aim – Conserve, improve and make efficient use of natural resources
Soil
Water
fossil fuels through integrated management
Good number of equipment and technology developed to address to
CA and these will be discussed.
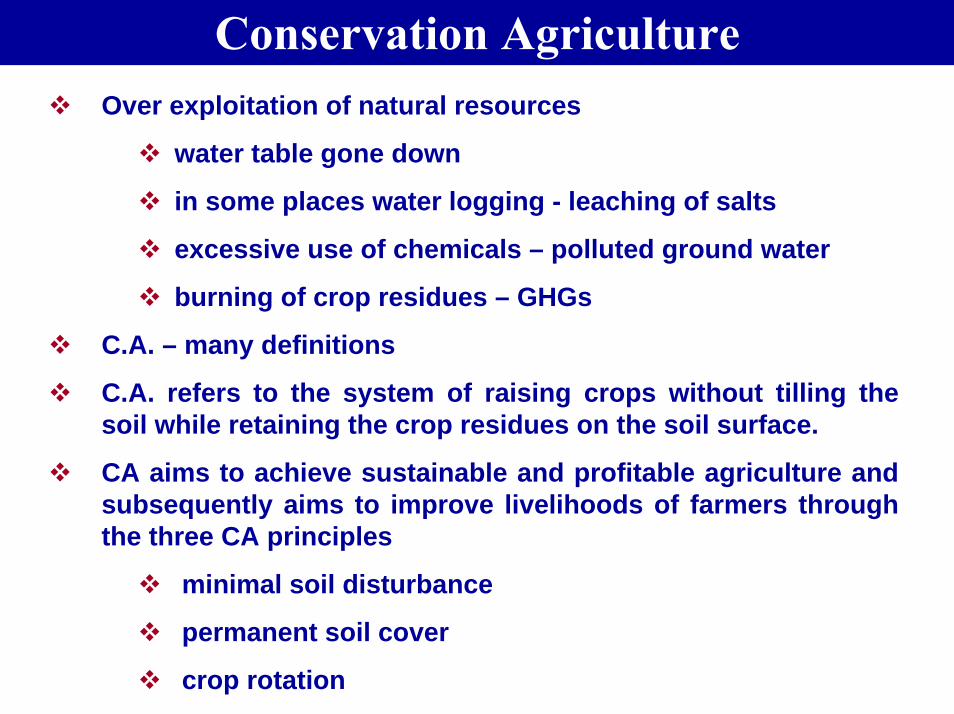
Conservation AgricultureOver exploitation of natural resources
water table gone down
in some places water logging - leaching of salts
excessive use of chemicals – polluted ground water
burning of crop residues – GHGs
C.A. – many definitions
C.A. refers to the system of raising crops without tilling the soil while retaining the crop residues on the soil surface.
CA aims to achieve sustainable and profitable agriculture and subsequently aims to improve livelihoods of farmers through the three CA principles
minimal soil disturbance
permanent soil cover
crop rotation

Conservation AgricultureCA aims to conserve, improve and make more efficient use of natural resources through integrated management of available water and biological resources through integrated management of available soil, water and biological resources combined with external inputs – referred as resource efficient/ resource effective agriculture.CA – range of soil management practices that minimize affects on composition structure and natural biodiversity and reduce erosion and degradation.
ChallengeStrategies : address twin concerns of
maintaining and enhancing the integrity of natural resourcesimproved productivity
CA – different agro – ecological regionsCA – 80 m.ha. Globally – US, Brazil, Mexico, Newzeland, Australia, Argentina, Canada, South Asia, China, etc.

Conservation Agriculture
CA – India – IGP
Need to evolve a scientifically land use system, a sound CA Policy and mission orient programme.
CA defer from soil type, rainfall, climate and socio-economic condition.
Call for developing new strategies and promotion of new technologies to enhance crop production, productivity and formulation of long term perspective.

Advantages Disadvantages
Reduces labour, time and fuel costsFormation of hard pan below soil surface due to zero
tillage and requires use of sub-soiler to break hard pan after 5-7 years
Reduces overall cost of operation Need to control weeds by using herbicides thus increasing cost
Reduce use of fossil fuel leads to less environmental pollution Not suitable to all crop rotations
Reduces soil compaction due to less trafficability
May result in soil borne pests and pathogens in transition stage
More yields in dry yearsHigh cost of machinery such as, laser land leveler, zero-
till drill, strip till drill, raised bed planter, straw cutter cum incorporator, straw combine, straw baler, biomass digesters
Saving in water
Less soil erosion less flooding
Less environmental pollution, Carbon sequestration (green house effect)
Less leaching of chemicals & solid nutrients into ground water
Less pollution of water
Increased crop intensity
Recharge of aquifers due to better infiltration
It may also result in low yields
Advantages and Disadvantages of CA

Concern leading to interest in CA
Water regime
Concerns Possible approaches
High rainfall
Rapid erosion and land degradationNutrient lose
Residue cover Sensible crop rotations
Low rainfall
Late sowingDrought stressLow soil fertility High weeds
Direct drillingResidue cover Residue+crop rotation+ mech., chopper+ Pesticides
Dryland Drought stressSoil erosion
Straw coverSub-soiling for in-situ moisture conservation
Irrigated Ground water depletionHigh cost of pumpingHigh cost of productionScarcity of labourCompaction
Water managementEfficient use of input resourcesProfitable crop rotationsControlled traffic cultivation Permanent bed system

CAM : Requirements
Alleviate soil compaction
Soil loosening only in crop rows
Surface soil loosening with or without straw mulch
Soil working condition
Residue cover

Studies on Conventional and Minimum Tillage Comparison
madeNo. of
Comparisons
Harvest population per acre Yield, bushel per acre
Conventional Tillage
Minimum Tillage
Conventional Tillage
Minimum Tillage
RESEARCH RESULTS ON AGRICULTURAL ENGINEERING FIELD
Total comparisions 70 14,500 14,000 95 93
Comparisons in which minimum
tillage gave higher yields than
conventional tillage
12 13,800 14,800 97 110*
Comparisons in which conventional tillage gave higher yields than minm
tillage
13 13,900 12,300 90 77*
RESULTS OF DEMONSTRATION FIELDS
Total comparisons 16 11,800 11,200 100 103

Studies on Conservation Agriculture
Conservation TillageTillage – mechanical manipulation of soil to provide conditions favourable for crop growth.
Primary and secondary tillage (m.b. plough, disc plough, rotavator, cultivator, harrow, tractor)
Tillage consumes
1600 MJ/ ha – wheat
2200-2600 MJ/ha- rice
Baleman & Bowers (1962) – Illinois – Corn-conventional tillage and minimum tillage
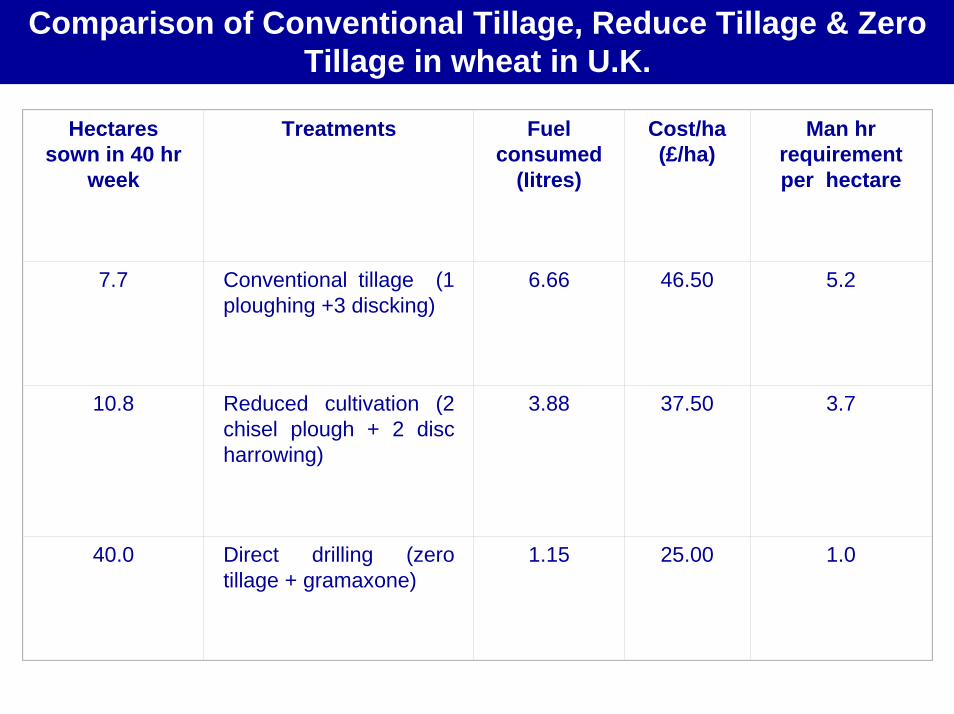
Comparison of Conventional Tillage, Reduce Tillage & Zero Tillage in wheat in U.K.
Hectares sown in 40 hr
week
Treatments Fuel consumed
(Iitres)
Cost/ha (£/ha)
Man hr requirement per hectare
7.7 Conventional tillage (1 ploughing +3 discking)
6.66 46.50 5.2
10.8 Reduced cultivation (2 chisel plough + 2 disc harrowing)
3.88 37.50 3.7
40.0 Direct drilling (zero tillage + gramaxone)
1.15 25.00 1.0
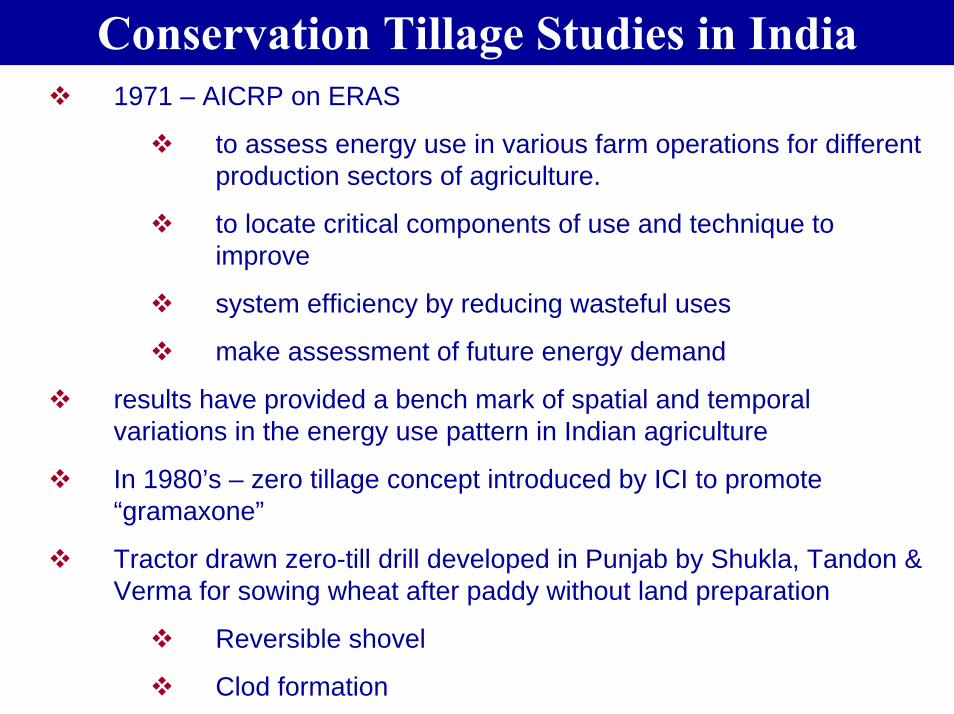
Conservation Tillage Studies in India1971 – AICRP on ERAS
to assess energy use in various farm operations for different production sectors of agriculture.
to locate critical components of use and technique to improve
system efficiency by reducing wasteful uses
make assessment of future energy demand
results have provided a bench mark of spatial and temporal variations in the energy use pattern in Indian agriculture
In 1980’s – zero tillage concept introduced by ICI to promote “gramaxone”
Tractor drawn zero-till drill developed in Punjab by Shukla, Tandon & Verma for sowing wheat after paddy without land preparation
Reversible shovel
Clod formation

Comparative performance of No-Tillage and conventional Tillage Systems for Growing wheat after paddy
Field No.
Plot No.
Treatment Moisture Content of
soil in percentage
Average germinati
on count/m
Wheat Yield
(Quintal/ha)
I 1. No-till 12.00 41.50 31.61
2 1 discking+ 2 cultivator+1 planking
12.50 39.00 30.12
II 3 No-till 14.00 43.10 34.58
4. 1 discking+ 2 cultivator+1 planking
14.00 41.30 34.58
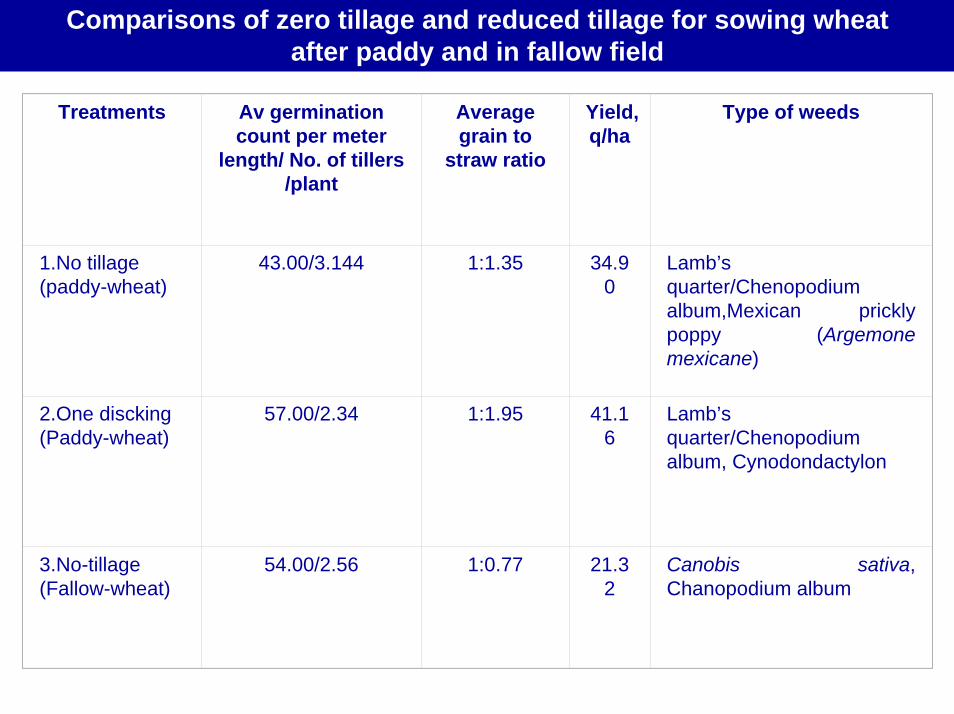
Comparisons of zero tillage and reduced tillage for sowing wheatafter paddy and in fallow field
Treatments Av germination count per meter
length/ No. of tillers /plant
Average grain to
straw ratio
Yield, q/ha
Type of weeds
1.No tillage (paddy-wheat)
43.00/3.144 1:1.35 34.90
Lamb’s quarter/Chenopodiumalbum,Mexican prickly poppy (Argemonemexicane)
2.One discking(Paddy-wheat)
57.00/2.34 1:1.95 41.16
Lamb’s quarter/Chenopodiumalbum, Cynodondactylon
3.No-tillage (Fallow-wheat)
54.00/2.56 1:0.77 21.32
Canobis sativa, Chanopodium album

In 1996 :-Pantnagar (GBPUAT) – zero-till drill with “Inverted T-type” furrow openers.
100 drills sanctioned under FLD.
NATP – 30 centres – zero-till drills.
RWC formed for address problems of R-W growing countries of IGP.
In India – 3 m.ha. – zero-tillage – Punjab, Haryana, Bihar, U.P.

Advantages of use of zero tillageSaves INR 2000-3000/ haHigher yields (1-2 q/ ha)Less lodgingNo crop yellowing after first irrigationControls Phalaris minor (30-50%) - weedLess tractor use/ wear of parts Better germination in salt affected areaLess need of herbicideImproved residue managementSaving in time (30-40%)Saving in labour and fuel (60 lt/ ha)Less incidence of stem borer

Reasons for adoption of zero-tillagefor wheat by the farmers
AdoptersAll categories of farmers
______ for Adoption
Reduction in cost of cultivation
Reduction in fuel consumption
Timely sowing of wheat
Reduction in philaris minor population

Other direct benefitsHigh crop yieldSoil fertility increases due to residue managementIrrigation water - saves 1st irrigation – quicker spread of water, reduces pumping time
Major adoption facility factorsRefinement of no-till drillPromotion of manufacturers - by private manufacturersSteady government support and subsidiesIntegration of research efforts and large scale demonstration at farmers fields

Conservation drills
Particulars Zero till drill Strip till drill Roto dill drill
Source of power 45 hp tractor 45 hp tractor 45 hp tractor
Type/no. of furrow openers
Inverted ‘T’ type/09-11
Shoe type/09 Shoe type/11
Row spacings, mm 180 (Adjustable) 200 (Fixed) 160 (Adjustable)
Working width, mm 1600-2000 1800 1750
Drive wheel Angle lug – front mounted
Angle lug – side mounted
Star lug – rear hinged
Weight, kg 210 250 280Unit price, Rs 15000 45000 60000

Field Performance
Particular(s) Zero tillage seeding
Strip tillage seeding
Roto tillage seeding
Conv. tillage (3 passes) –
sowing
Time, h/ha 3.23 (70.15) 4.17 (61.46) 3.45 (68.11)10.82
Fuel used, l/ha 11.30 (67.36) 17.50 (49.45) 13.80 (60.14) 34.62
Operational energy, MJ/ha
648.96 (67.16) 1001.76 (49.31) 783.60 (60.35) 1976.11
Cost of operation, Rs/ha
639.54 (66.39
979.95 (48.51)807.30 (57.58)
1903.04
() : % savings over conventional practice

Production–economics : Conservation drilling
Particulars Zero till drilled
Strip till drilled Roto till
drilledConventionally
sown
Grain yield, t/ha 4.84 4.62 4.78 4.60
Cost of production, Rs/ha
8635 9114 9315 10710
Benefit-cost ratio 3.64 3.29
3.342.79
Operational energy, MJ/ha 8114 8712 8444 9516

Area under Zero Tillage in different Countries
Sl. No.
Name of the country Area under Zero tillage
1 USA 19,347,000
2 Brazil 11,200,000
3 Argentina 7,270,000
4 Canada 4,080,000
5 Australia 1,000,000
6 Paraguay 790,000
7 India 3,000,000
8 Mexico 500,000
9 Bolina 200,000
10 Chile 96,000
11 Uruguay 50,000
12. Others 1,000,000
Total 46,533,000

Conservation Practices in PaddyPaddy raised in nurseryTransplanted
Laboriousdrudgerous operationrequires frequent irrigation2000-3000 lit of water-1 kg of rice
Pre-germinated paddy seederMat type transplanterDirect drilling on raised bed
Sesbania sisbon (brown manuring)

Experience of Bangladesh & NepalExperience of Bangladesh & Nepal
Participants discussing effect of single transplants, date of transplanting and suitability of rice cultivars (sudha and Parbhat) in cropping system perspective

Direct Seeded Rice – A promising Resource Conserving Technology (RCT)
SesbaniaSesbania crop crop planted with riceplanted with rice

Traveling seminar participants visit a DSR field

Comparative input cost in puddled transplanted rice and saving in DSR
Input cost in Puddled Transplanting Saving in DSR
PuddledTransplanted
DSR ∆Value
Total Cost US$ 518±48 275±47 73Net IncomeUS$ 445±63 354±48 79
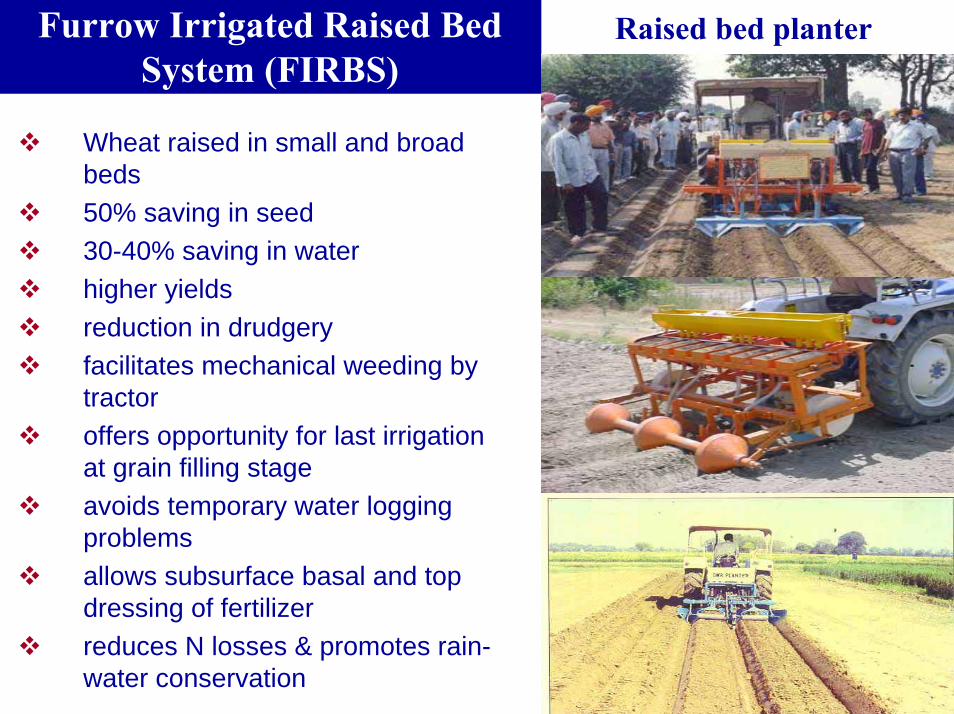
Furrow Irrigated Raised Bed System (FIRBS)
Raised bed planter
Wheat raised in small and broad beds50% saving in seed30-40% saving in waterhigher yieldsreduction in drudgeryfacilitates mechanical weeding by tractoroffers opportunity for last irrigation at grain filling stageavoids temporary water logging problemsallows subsurface basal and top dressing of fertilizerreduces N losses & promotes rain-water conservation

Paddy sown or raised bed

DSR in flat and Raised Bed in no-till and reduced till land
Sesbania brown manuring
Reducing unproductive evaporation losses of water byResidue managementseedling age at transplantingSeeding timeCultivar choiceLaser land leveling

Raised bed planting
Particular Particular Planting on Planting on fresh fresh
preparatory preparatory tillagetillage
Planting on Planting on permanent permanent
bedsbeds
Flat sowing Flat sowing zero tillagezero tillage
ConvConv. . Flat Flat
sowingsowing
Time required, h/haTime required, h/ha 13.0413.04 4.80 (55.6) 4.80 (55.6) [63.2][63.2]
3.233.23 10.8210.82
Operational energy, Operational energy, MJ/haMJ/ha
2605.362605.36 1154.03 (41.6) 1154.03 (41.6) [55.7][55.7]
648.96648.96 1976.111976.11
Cost of operation, Cost of operation, RsRs/ha/ha
2479.842479.84 1060.80 (44.3) 1060.80 (44.3) [57.2][57.2]
639.54639.54 1903.041903.04
( ) % savings over conventional practice
[ ] %savings over fresh bed planting

Production economics of rice after wheat : straw covered and straw incorporated
Particular
Straw incorpo-
rated rototillage rice
Non-straw roto
tillage rice
Straw covered
zero tillage
rice
Non-straw zero
tillage rice
Conv. Tillager
ice
Grain yield, t/ha 3.31 3.24 3.36 3.30 2.94
Cost of production, Rs/ha 8801 9740 8640 9115 10610
Benefit cost ratio 1.88 1.66 1.94 1.81 1.39
Operational energy, MJ/ ha
5579 6605 5512 5594 9642
Sp. Cost of production, Rs/kg 2.66 3.00 2.57 2.76 3.61

Production economics
Raised bed wheatParticular Fresh
bedPermanent
bedGrain yield, t/ha 5.03 5.08 4.84 4.60Cost of production, Rs/ha 10030 8540 8635 10710
Benefit-cost ratio 3.26 3.87 3.64 2.79Operational energy, MJ/ha 8750 7684 8444 9516
Special operational energy, MJ/kg 1.74 1.51 1.74 2.07
Special cost of production, Rs/kg 1.99 1.68 1.78 2.33
Zero tillage wheat sown
Conventional Flat sown
wheat
Saving in water
Fresh bed = 30%
Permanent beds = 40%

Cracking pattern in DSR and puddled rice fields

Leaf color chart

Site specific N Management practices - U.S.G. leaf colour chart

Surface Seeding of Rice in Water Logged Area
Wheat seeds broadcasted in standing paddy field or after paddy harvest
Avoids fallow fields
Helps in taking one more crop
Additional yield 3-4 t/ ha
Low lying areas of IGP of India, Bangladesh and Nepal
Popular in Yangtze River in China
Saves labour, fuel and tillage costs

R.C. through use of laser land levelingLeveling byLeveling by
animal drawn leveleranimal drawn levelertractor drawn levelertractor drawn levelerlaser land leveler laser land leveler (both (both direction) direction)
Poor crop standPoor crop standLaser land levelerLaser land levelerOver irrigation and uneven distribution Over irrigation and uneven distribution due to unevennessdue to unevenness
increase water application increase water application efficiency up to 50%efficiency up to 50%cropping intensity by 40%cropping intensity by 40%labourlabour requirement by 35%requirement by 35%crop yield by 15 to 66%crop yield by 15 to 66%
Laser land leveler

Uneven distribution of irrigation Uneven distribution of irrigation water under traditional land water under traditional land
levelingleveling
WaterloggingWaterlogging in a wheat fieldin a wheat field NonNon--uniform crop stand in an uniform crop stand in an undulated fieldundulated field
Laser leveled field prepared for Laser leveled field prepared for rice transplantingrice transplanting

Direct seeded rice in a laser-leveled field
Save irrigation waterSave irrigation water
Increase cultivable area by 3 to 5% Increase cultivable area by 3 to 5% approximatelyapproximately
Improve crop establishmentImprove crop establishment

Total water use (m3 ha-1) in wheat under precision and traditional land leveling
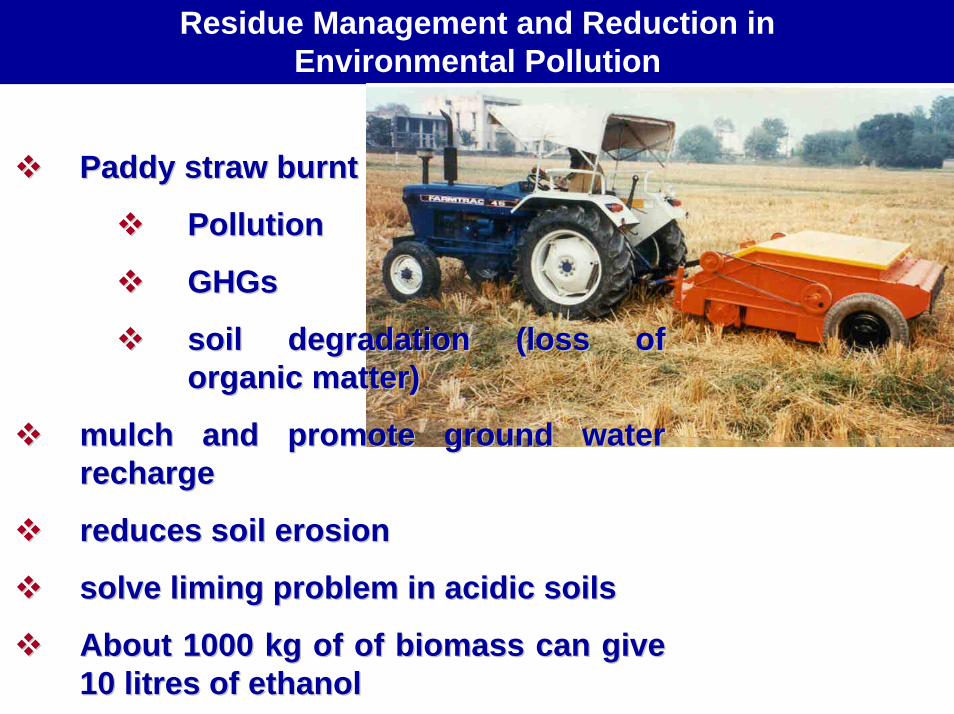
Residue Management and Reduction in Environmental Pollution
Paddy straw burntPaddy straw burnt
PollutionPollution
GHGsGHGs
soil degradation (loss of soil degradation (loss of organic matter)organic matter)
mulch and promote ground water mulch and promote ground water rechargerecharge
reduces soil erosionreduces soil erosion
solve liming problem in acidic soilssolve liming problem in acidic soils
About 1000 kg of of biomass can give About 1000 kg of of biomass can give 10 10 litreslitres of ethanolof ethanol

Happy combo seederHappy combo seederTurbo seeder seeding in full residueTurbo seeder seeding in full residue
RDD seeding in full residueRDD seeding in full residueRotoRoto till drilltill drill

Straw incorporated
tillage seeding

Rotavator (in-chopped straw) shallow working-higher work rate than MB plough based cultivation system
Type of straw field
Implement used Time required,
h/ha
Direct energy used, MJ/ha
Cost of operation,
Rs/ha
Amount of straw incorp-
orated, %Stubble shaver (1) 2.75 508.06 511.99 -
MB plough (1) 5.13 1151.46 1041.84 76.70
Rotavator(1) 3.00 644.58 617.84 13.00Seed-Fertilizer drill(1)
3.71 696.63 678.93 -
Stubbler shaver(1) 2.75 508.06 511.99 -
Rotavator(1) 3.58 721.30 768.71 60.43
Straw fields Seed fertilizer drill(1) 4.88 916.39 893.04 -
Duck foot sweeps(3) 7.71 1446.87 1386.90 -
Seed fertilizer drill(1) 2.99 560.53 546.26 -
Non-straw rice and wheat fields (T3)
Combine harvested rice and wheat (T2)
Combine harvested rice and wheat straw field (T1)

Production economics : straw fields
Wheat straw/non straw (control) -rice sown
Rice straw/non straw (control)-wheat sown
Rice-wheat straw/non straw (control)-field
T1 T2 T3 T1 T2 T3 T1 T2 T3
Grain yield, t/ha 3.54 3.18 2.94 4.68 4.64 4.60 8.22 7.82 7.51
Cost of production,
Rs/ha10569 9805 10610 12020 10128 10710 22589 19933 21320
Benefit cost ratio 1.67 1.62 1.39 2.53 2.98 2.79 2.10 2.30 2.09
Particular(s)

Straw mulch minimum tillage rice-wheat
Treat-ment Equipment
used
Time requ-ired, h/ha
Operat-ional
energyMJ/ha
Cost of operation, Rs/ha
Total time requi-red,
h/ha
Total opera-tional energy,
MJ/ha
Total cost of opera- tion,
Rs/ha
Amount of straw
incorpora-tion, %
Stubble shaver drill 3.45 653.68 648.60
Roto till drill 5.26 1205.38 1230.84Stubbleshaver 3.45 653.68 648.60
Zero till drill 4.76 956.78 942.48Stubbleshaver 3.45 653.68 648.60
Rotavator 3.57 710.59 763.98
Seed cum fertilizer drill 4.55 837.71 864.50
11.57 2201.98 2277.08 62.1T3
8.21 1610.46 1591.08 -T2
8.71 1859.06 1979.44 54.4T1

Production economics of wheat after rice : straw covered and straw incorporated
Rice straw condition Non-straw conv. practice
Rototill
drilled wheat
Zero till
drilled wheat
Rotavator+ drill
combination wheat
Rototill
drilled wheat
Zero till
drilled wheat
Rotavator+drill
combination wheat
Grain yield, t/ha 4.92 5.10 4.80 4.78 4.84 4.64 4.60
Cost of production, Rs/ha
9728 8885 10503 9315 8635 10128 10710
Benefit cost ratio 3.29 3.73 2.97 3.34 3.64 2.98 2.79
Operational energy, MJ/ ha 8746 8345 8946 8444 8114 9116 9516
Non-straw conv. Prac-tice
Parameter(s)

Straw Combine
Straw Baler

Conservation Development situations in the World and Member Countries and Policy Implication of C.A.
CA adopted in America, Australia, U.K., Brazil, Canada
Latin America and South Asian countries
CA promoted
easy credit
extension programmes
pasture conversion by providing free seedlings
enforced land retirement due to excessive soil erosion and taxes due to soil erosion
In France, Europe, Spain – CA – 1 m.ha.
European Agriculture Federation (EAFs)
United National Associations in France, Germany, UK, Spain, Portugal and Italy founded to promote CA.

CA has been adopted in Japan, Malaysia, Indonesia, Nepal and Bangladesh
Community led initiative strongly supported by R&D organizations and farmers and industry participation –widespread adoption.
Targeted Policy Approach and Motivate Farmers
Punjab – Water table going down-grow other crops than rice
Pride and Peer pressure- Canada, Ontario’s Environmental Farm
Plan(EFO) Programme- innovative approach to Envirn. Conservation & voluntary participation of farmers to assess theEnvir. Risks & riase environmental awareness
Farmers driven process supported by Govt. through funds & technical advise.
Appropriate Incentives- short & long term impact, diversification & Infrastructure

Conservation Policies & Programmes
CA Programmes/Studies launchedAfrican Conservation Tillage network(ACT)French Agriculture research Centre for International development(CIRAD), swedishSIDA funded Regional land Mgt. Unit FAO
Study throws light onChallenges farmers face in keeping soil covered gaining access to adequate equipmentControlling weedsChallenges faced ti implement true PA

Farm Conservation Bill of USLays emphasis on- Cons. of resources, clean water,
improvement in Grassland habitat & biofuel
FRPP – protect Ag. land from urban sprawl & other development- one time paymentEQUIP- to reduce air and pollution use, energy use and wildlife impacts( 70% cost sharing)CWLCP- ensure no ovarall net loss & achieve net gain in performance of wet land acreage
CSP- maintain & enhance quality of water, air, soil & habitat-$ 45,000/yearCRP-reduce soil erosion-plant grasses-rental payments & 50 % cost sharing WRP-restore & protect wetlands- 100 % fundingGRP- help to protect & restore grasslands, pasture , range and other lands( 90 % restoration cost funded)

Conservation Policy in India No Policy as suchGovt- Watershed Development Programme- to conserve water & reduce soil erosionPromotion of RCT-zero-till drill, laser land leveling, straw baler, straw combine etc.R-W Consortium- ICAR- CIMMYTAlternate crops –Diversification
Following recommendedMinimum support price, subsidy, Institutional financing, no free electricity, PPP, Land consolidation, Encourage Cooperatives, voluntary participation of farmers, NGOs, etc.

Conservation Ag. Strategies in IndiaConservation of water through
paddy sown in unpuddled soils paddy sown on ridgesLess frequency of irrigationlaser land leveling- 25 % saving in water
Conservation Tillage StudiesDevelopment & demonstyration of zero-till drill, strip till drill, roto-till drill, till planting, raised bed planter etc.

Conservation Ag. Strategies in IndiaFarm Residue Management through
stubble shaver,straw chopper cum incorporatorstraw combinestraw baler
Environmental PollutionExhaust gas emission norms for tractors/enginesFuel standardsCNG Biofuel Mission

ConclusionsBenefits accrued of CAT
Reduction in cultivation cost (1500-2000 Rs/ha)
Savings in water and nutrients (25-30%)
Reduced occurrence of weeds and savings in pesticides (20-25%)
Increased yield (05%)
Protection of environment by elimination of burning of straw (Cattle feed)
Facilitating recycling of residue and plant nutrients (Back to soil)
Opportunities for sensible/profitable crop rotations.

WE to Conserve for US