cru mineral commodity outlook 2020 vision trench.pdfcommodity price ‘climate change’: zinc to...
TRANSCRIPT

CRU Mineral Commodity Outlook – 2020 Vision
Dr Allan Trench

What is driving commodity prices?
• ...that depends on which commodity you are looking at
• Each has it’s own dynamics
• CRU looks at the fundamentals: Supply of raw materials, production capacity, industry demand, stocks & the market balance, costs of production & investment capital and financial market influence, as well as prices
• Each commodity has a story & individual fundamentals
• China’s growth in consumption is common to all and this has been a factor in driving prices higher
3
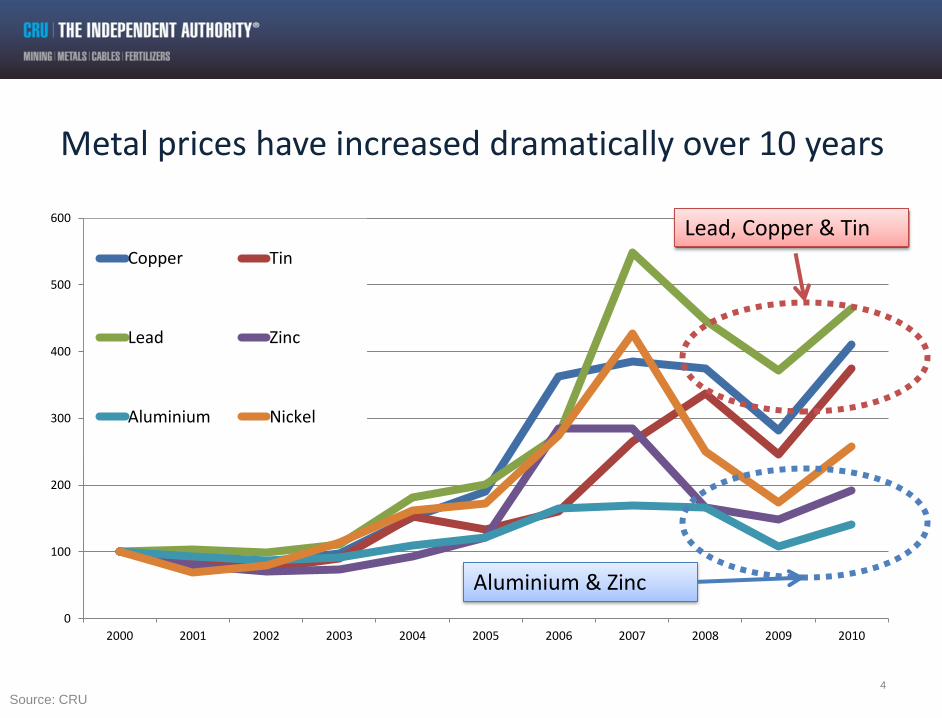
Metal prices have increased dramatically over 10 years
4
0
100
200
300
400
500
600
2000 2001 2002 2003 2004 2005 2006 2007 2008 2009 2010
Copper Tin
Lead Zinc
Aluminium Nickel
Lead, Copper & Tin
Aluminium & Zinc
Source: CRU

Here’s on reason why: China has accounted for more than 100% of global metals demand growth this millennium
0%
20%
40%
60%
80%
100%
120%
140%
160%
Copper Nickel Lead Zinc Steel Aluminium
Chinese metals consumption growth as a proportion of global metals consumption growth 2000-2010
Data: CRU Analysis
Average growth as proportion
of total global growth =118%

China’s share of metal consumption
At the turn of the last millennium China accounted for around10% metal consumption
Today China’s share of world consumption is over 40%
The industry size and structure has changed in the last decade; and continues to be shaped by China’s growth
There are industry constraints to be managed...
0%
10%
20%
30%
40%
50%
60%
70%
80%
90%
100%
2000 2001 2002 2003 2004 2005 2006 2007 2008 2009 2010 2011 2012 2013
Copper World Ex-China Lead World Ex-China Zinc World Ex-China
Nickel World Ex-China Aluminium World Ex-China Copper China
Lead China Zinc China Nickel China
Aluminium ChinaSource: CRU

• Looking at consumption growth of industrial metals China is driving demand growth
• The World Ex-China is cyclical but stable
China’s development has compensated for lower metal growth elsewhere
Source: CRU
Metal Consumption
Copper Zinc Lead Aluminium Tin Nickel
yoy 10/09 8.5% 15.8% 7.9% 19.5% 15.0% 15.9%
yoy 11/10 3.5% 4.4% 5.3% 8.8% 5.8%
CAGR 00-10 2.1% 2.9% 3.6% 5.1% 2.4% 2.7%
CAGR 10-15 4.7% 5.0% 4.5% 7.6% 5.7%

8
China is reliant on imports across a range of major commodities
0%
5%
10%
15%
20%
25%
30%
35%
40%
45%
50%
Aluminium Alumina Bauxite Fe Ore Copper Nickel
Net imports/Demand
Source: CRU

But importantly China is self-sufficient in Aluminium & Steel
9
0
50
100
150
200
250
300
350
400
450
0
100
200
300
400
500
600
700
800
0
50
100
150
200
250
300
350
400
0
100
200
300
400
500
600
700
800
900
1000
0
100
200
300
400
500
600
700
800
0
100
200
300
400
500
600
700
800
900
20
00
20
01
20
02
20
03
20
04
20
05
20
06
20
07
20
08
20
09
20
10
20
11
20
12
20
13
20
14
20
15
Copper Lead Zinc
Nickel Aluminium Steel
Indexed Price Production Consumption Source: CRU

Business costs & 2010 average metal price ...at these prices just about every miner is making money
10
-500
500
1500
2500
3500
4500
5500
6500
7500
0 5000 10000 15000 0
5000
10000
15000
20000
25000
0 200 400 600 800 1000 1200
0
500
1000
1500
2000
2500
3000
0 500 1000 1500 2000 2500
0
500
1000
1500
2000
2500
0 1000 2000 3000 4000 5000 6000
Zinc US$/t
0
500
1000
1500
2000
2500
3000
0 10000 20000 30000 40000 50000
0
50
100
150
200
250
300
350
400
0 20000 40000 60000 80000 100000
Alumina US$/t
Copper US$/t Nickel US$/t Aluminium US$/t
Lead US$/t

Business costs $/t 2005 v 2010 Changes in the shape of the cost curve over time reflect changes in industry structure
11
0
500
1000
1500
2000
2500
3000
0 10000 20000 30000 40000
0
5000
10000
15000
20000
25000
0 200 400 600 800 1000
0
1000
2000
3000
4000
5000
6000
7000
0 2000 4000 6000 8000 10000 12000 140000
500
1000
1500
2000
2500
3000
0 500 1000 1500 2000
Costs $/t 2005 Costs $/t 2010 Linear Costs
Aluminium US$/t
Copper US$/t
Nickel US$/t
Lead US$/t

Supply-side Challenges to buoy Long-Term prices
• Influences vary from commodity to commodity
• Mining houses can’t do ‘everything’ simultaneously – adding to the challenge
• Room for smaller scale commodity-specific producers to add to contestable supply - Examples
– Copper
– Nickel
– Iron Ore
– Coking Coal
– Zinc
12

8
12
16
20
24
28
32
2000 2003 2006 2009 2012 2015 2018 2021 2024 2027 2030 2033
We need more mines to meet consumption growth...
Copper Example
13
Probable projects Possible projects
World copper mine production, 2000-2035
Existing mines
Firm projects
New
technology
Incremental
Discoveries
Prospects
Extra potential
supply requirement
= 13.1Mt
Production needed
2.67% per year
(2010 -2035)
(Mt co
nta
ine
d C
u in
co
nce
ntr
ate
s a
nd
SX
EW
ca
tho
de)
Source: CRU

Escondida Collahuasi
Los Pelambres
0
200
400
600
800
1000
1200
1988 1992 1996 2000 2004 2008 2012 2016 2020
Oyu Tolgoi
Tenke Fungurume
Toromocho
Mining start-up
gap of approx
10 years
Pro
du
ctio
n (
„00
0 t c
on
tain
ed
Cu
)
Significant volumes from
relatively “new” locations:
Mongolia, Pakistan, Alaska
After Escondida,
insufficient influx of
new supply
Source: CRU
Expected Year of production start-up
Miners are responding but it takes time ...on average it take 10 years to bring a project on stream
14

Mainly small-sized sulphide mines
starting up over this 10-year period
Pro
du
ctio
n (
„00
0 t c
on
tain
ed
Ni)
Many large-sized
projects scheduled to
start-up at the same
time
Two medium sized
operations start-up
Expected year of production start-up
Threat of several large-scale nickel projects...
15
New conventional* nickel operations and their start-up dates, ‘000
tonnes, 1995-2015
*Excluding mines in the Philippines and Indonesia that supply the Chinese nickel pig iron sector.
Voisey’s Bay
Raglan
Murrin Murrin
Talvivaara
Koniambo
VNC
Onca-
Puma
Barro
Alto
Data: CRU Analysis
Ravensthorpe
Ambatovy
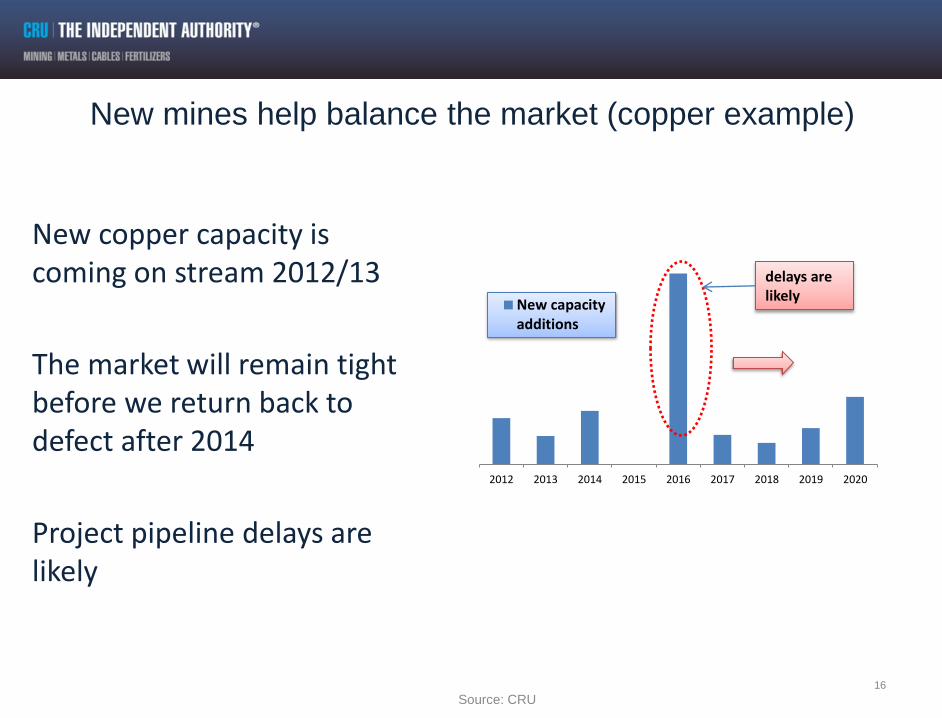
New copper capacity is coming on stream 2012/13
The market will remain tight before we return back to defect after 2014
Project pipeline delays are likely
16
2012 2013 2014 2015 2016 2017 2018 2019 2020
New capacityadditions
delays are likely
Source: CRU
New mines help balance the market (copper example)

0
1,000
2,000
3,000
4,000
5,000
6,000
7,000
2004 2005 2006 2007 2008 2009 2010 2011
Cu Mining, Refining and Smelting…
CRU estimates real
development cost inflation of
13% pa over this time period
US
$/t
on
ne
(2
011
$)
Copper development costs have increased
substantially...
17 Source: CRU

Projects compete for capital
18
Source: BHP Billiton Half Year Results Presentation – 16th Feb 2011

Iron Ore – A great business to be in........ Global business cost curve for iron ore fines, (UScents/dmtu)
...demand firmly at the high end of a steep cost curve –
providing strong pricing support & strong margins
Data: CRU iron ore cost model
cents/
dmtu
M tonnes

Iron ore Demand: The original China story – and still running Iron ore steel construction, transport, infrastructure....
-
500
1,000
1,500
2,000
2,500
Mill
ion
to
nn
es
Rest of World China
Chinese percentage of global steel production rising
Data: CRU Analysis

2
1
With China tracking towards more than 1 billion tonnes steel demand by 2020
0 100 200 300 400 500 600 700 800 900 1000 1100
GuizhouGansu
YunnanTibet
NingxiaQinghaiXinjiangHainanShanxiAnhui
GuangxiJiangxi
SichuanShaanxi
HunanChongqing
HubeiHebei
Inner MongoliaHeilongjiang
JilinFujian
LiaoningShandong
Inner MongoliaGuangdong
ZhejiangJiangsuBeijingTianjin
Shanghai
Per capita crude steel equivalent consumption kg/head
Regional
Kg/head 2009
610
341
258
Coastal
Central
Western
National average
2009 = 450kg/head
Source: CRU China
1000
700
600
Coastal
Central
Western
Regional
Kg/head 2020 National average
2020 = 794kg/head
39% POPULATION
39% POPULATION
22% POPULATION

But is future steel demand-growth simply about Asia? % of global growth in crude steel production 2007-2021
-20%
0%
20%
40%
60%
80%
100%
WesternEurope
Other Europe& CIS
North America South America Africa Asia Oceania
YES!
>95%
Data: CRU Analysis

0
200
400
600
800
1,000
1,200
0 5 10 15 20 25 30 35 40 45 50
Longer term, continued and rapid industrialisation expected in
China, India and other developing nations
23
X-axis: 2010 GDP/capita, US$’000(1), Y-axis: 2010 Apparent finished steel
consumption/capita, kg
Bubble area proportional to 2010 apparent finished steel consumption
Data: International Monetary Fund, CRU Analysis Note: (1) – current prices
China
Russia
Brazil
India
South Korea
Taiwan
Turkey
Saudi Arabia Spain
Japan Italy
Germany Canada
USA UK
France
Russia

Continued recovery in developed markets and further growth in emerging economies will see steel demand rise steadily
Data: CRU Analysis, OE Note: f forecast
0
200
400
600
800
1000
1200
1400
1600
1800
2000
-10%
-5%
0%
5%
10%
15%
20%
2004 2005 2006 2007 2008 2009 2010 2011f 2012f 2013f 2014f 2015f
Consumption Global China
India USA Germany
LHS: Industrial production by country, year-on-year change, %
RHS: Global finished steel consumption, m tonnes

Coking Coal - Chinese import potential is great, though Mongolia will
help fill the gap
-70
-60
-50
-40
-30
-20
-10
0
10
20
2003
2004
20
05
20
06
20
07
20
08
20
09
2010
2011
2012
2013
2014
2015
m t
on
ne
s
Imports from Mongolia Seaborne Imports Exports Net exports
25
Data: CRU Analysis, GTIS
Net imports/exports of metallurgical coal, China, 2003-2015

26
Steel mills have been aggressive in acquiring captive
coal supply, and this should continue
USA
Essar Trinity Coal 2010
JSW Steel WV ops 2010
Metinvest United Coal 2009
Mechel Bluestone Coal 2009
Severstal PBS Coals 2008
ArcelorMittal Mid-Vol Coal 2008
Mozambique
Nippon Revuboe 2010
POSCO Revuboe 2010
WISCO Zambeze 2010
CSN Benga, etc. 2009
ArcelorMittal CoAL (S Afr.) 2008
Tata Steel Benga 2007
Australia
Nippon Foxleigh 2010
POSCO Sutton Forest 2010
Xinyang Maryborough 2010
Jindal Rockalds Richfield jv 2010
Baosteel Aquila 2009
JFE Steel Byerwen 2009
ArcelorMitta
l Macarthur 2008
POSCO Cockatoo, Macarthur 2008
Bhushan
Steel Bowen Energy 2007
Russia
MMK Belon 2009
ArcelorMittal Kuzbass mines 2008
Mongolia
ArcelorMittal?
POSCO? Tavan Tolgoi ?
Data: CRU Analysis, TEX Report
Recent upstream integration movements from steel mills

27
But there are no perfect solutions for coking coal supply,
and the market will be dependent on higher-risk areas
Western Canada
High cost to develop, run
coal operations Appalachia
Dwindling base of quality
reserves, high operating
costs, decreasing yields,
increased regulation
Mozambique
Good reserves and
mining conditions, but
limited infrastructure, and
high ash
Central Queensland
Costs rising, fewer development
opportunities though substantial reserve
base remains
Indonesia
Limited current production.
Development of hard coal
deposits has proven difficult
logistically
Mongolia
Political risks, no infrastructure,
and limited seaborne export
options
Siberia (Elga deposit)
Infrastructure lacking, transport
costly, and export capacity
uncertain
Primary seaborne supply sources
Other important suppliers
Prospective major projects
Poland, E. Europe
Deep reserves, poor
geology, increased
local demand.
Western Ukraine
Size and quality of
deposits largely
unknown
Russia (Kuzbass)
Quality questionable. Will
continue to struggle with transport
limitations, and focus on domestic
market

“Torrid”
“Frigid”
“Warm Temperate”
* Relative forecast average 2015 prices versus June 1st 2011 e as a base level
Commodity Price ‘Climate Change’: Zinc to lead Global Warming
in Prices – Even ‘cooling’ commodities will be highly profitable
CRU Commodity Price Climatic Zones – What’s hot to 2015?
“Cool Temperate”
Zinc (2015, not before)
Uranium, Tin, Nickel, Molybdenum,
Alumina, Lead, Copper, Aluminium,
Manganese, Cobalt, Vanadium
Platinum, Iron Ore, Palladium, Gold
Phosphate Rock, Coking Coal, Met
Coke, Ammonia, Urea, Silver, Sulphur,
Sulphuric Acid

Thank you
29
Dr Allan Trench – Associate Consultant, CRU Strategies [email protected] Philip Sewell – Business Development Manager, Australasia [email protected] With Thanks to Peter Ghilchik CRU International Ltd 31 Mount Pleasant, London WC1X 0AD Phone: +44 20 7903 2208 [email protected] http://www.crugroup.com