pcg nutritional supplement industry newsletter 2q13
DESCRIPTION
Partnership Capital Growth, in collaboration with SPINS and Nutrition Business Journal / NewHope360, is pleased to present our second quarter 2013 newsletter, which focuses on the U.S. Vitamin, Mineral, Herb, & Supplement (VMHS) industry. Key highlights include: • The VMHS industry continues to exhibit robust growth as an aging and increasingly ill – yet also increasingly health-conscious – American population focuses on health, wellness, and the benefits of preventive/proactive care. The industry grew 7.5% to an estimated $32.4 billion in 2012 and has not had a single year of decline in the last decade. • Retail sales data supports these trends and shows strong growth across channels and product categories. We remain impressed by the significant growth rates across major channels and product categories given their already-massive scale, and we are equally excited by new products, ingredients, and channels that have surfaced over the last couple years. • Industry consolidation continues, with a broader range of buyers showing interest in the space than ever before. Numerous landmark acquisitions by major pharmaceutical, CPG and food companies are changing the landscape of the industry, presenting both benefits and new challenges to industry players. • In the public markets, our PCG supplement index has significantly outperformed the overall market since Jan. 2011, growing ~55% vs. the overall market which has grown ~30% in the same period, driven by the positive performance of the vast majority of the underlying VMHS companies. • Overall, PCG’s outlook on the VMHS sector remains very positive with industry challenges – NDI stalemate, rising commodity costs, product adulteration – more than offset by opportunities – personalization, rise of integrative medicine, innovation, etc.TRANSCRIPT

Partnership capital growthSupplement Industry Perspectives Industry Newsletter
2Q:13
In Partnership With: SPINS & Nutrition business journal

1
Brent Knudsen Janica LaneBrian Smith
Brittany Larsen
Managing Partner & Founder
(415) 705-8001
Partner
Vitamins/Supplements
(415) 705-8011
Partner
Sports Nutrition/Weight Loss
(415) 705-8002
Analyst
(415) 705-5270
Chris SpahrPartner
Retail
(415) 705-5276
Eric SchillerPrincipal
(415) 705-8010
Mary Elisabeth PlowdenPrincipal
(415) 705-7879
Jason MetzlerVP of Business Development
(415) 705-8016
OURKEYCONTACTS

2
Key Themes
The Vitamin, Mineral, Herb, and Supplement (VMHS) Market is thriving; industry challenges are more than offset by opportunities.
Market-Specific Trends Product/Channel Trends
Industry Trends
• Industry growth: 10+ years of outperformance, led by internet
• Usage: Growing usage rates among American public, though significant opportunities remain
• Industry risk/reward: challenges – NDI stalemate, rising commodity costs, product adulteration – more than offset by opportunities – personalization, rise of integrative medicine, innovation, etc.
• M&A: Continued industry consolidation at robust valuations
• Channels: VMHS in natural channel grew 13.5% to $1B; $10B+ conventional channel grew 7.5%
• Products: Vitamins/supplements still dominant in mass (90% of VMHS sales), while they account for 78% in natural; significant growth continues despite scale
• Specific products/ingredients demonstrating strong growth: Plant proteins, ancient grains, probiotics, herbs and whole food supplements, sports nutrition
See NBJ supplement industry overview in section 1, plus PCG commentary in
sections 3-5
See SPINS retail sales update in section 2

Supplement Industry Overview
2012 SPINS Retail Sales Update
Transaction News and Review
Implications for Growth
Update on Top Companies
Appendix
1
3
4
2
5
6

4
The U.S. supplement industry has demonstrated strong and consistent growth throughout the years and varying economic climates, with no declines in over a decade.
Supplement Industry Overview Key Facts & Figures
0
5
10
15
20
25
30
$35B
2001
$18.0B
2002
$18.7B
2003
$19.8B
2004
$20.4B
2005
$21.3B
2006
$22.5B
2007
$23.8B
2008
$25.4B
2009
$26.9B
2010
$28.7B
2011
$30.2B
2012E
$32.4B
2013E
$34.9B
6.8% 5.1% 7.5% 7.5%3.8% 5.8% 3.0% 4.6% 5.4% 5.9% 6.4% 6.0%% Growth
• The U.S. supplement industry has seen a compound annual growth rate of 5.2% over the last decade (vs. ~1.7% real U.S. GDP growth from 2003-2012)
• In 2013, NBJ anticipates a continuation of the strong growth rate seen in 2012E as VMHS continue to move into the mainstream
Sources: Nutrition Business Journal (NBJ)NOTE: Forward estimates including 2012 were created in May and do not reflect NBJ's current best estimates. NBJ will update its estimates in its June/July 2013 Industry Overview issue, which will be available at www.newhope360.com/nbj
U.S. Supplement industry retail sales
Nutr
itio
n bu
sine
ss jo
urna
l

5
SportsNutrition
13%
Herbs &Botanicals
17%Specialty
19%
Vitamins33%
Minerals7%
MealReplacements
11%
Looking at sales by product category, Meal Replacements showed the greatest growth in 2012E, followed by Sports Nutrition. Vitamins, which remain the largest category, have also sustained strong growth rates.
Supplement Industry Overview Key Facts & Figures
Source: NBJ
Supplement Sales & Growth by Product
Nutr
itio
n bu
sine
ss jo
urna
l
0
5
10
15% 14.8%
11.6%
Specialty
8.2%
Herbs &Botanicals
5.6%
Vitamins
5.2%
Minerals
3.7%
MealReplacements
SportsNutrition
2012E supplement sales growth by product type2012E Supplement sales by product type
NOTE: Forward estimates including 2012 were created in May and do not reflect NBJ's current best estimates. NBJ will update its estimates in its June/July 2013 Industry Overview issue, which will be available at www.newhope360.com/nbj

6
0
4
8
12
16%
Internet
15.3%
Practitioner
9.5%
MLM
9.5%
Retail -Natural&Specialty
7.3%
Retail -Mass
Market
5.4%
Mail Order
4.2%
The majority of supplement sales take place through retail outlets, but the fastest growing channel is the internet.
Supplement Industry Overview Key Facts & Figures
Sources: NBJ, U.S. Department of Commerce E-Commerce data
Supplement Sales by Channel
Nutr
itio
n bu
sine
ss jo
urna
l
2012E supplement sales growth by channel2012E Supplement sales by channel
0
10
20
30
$40B
2012E SupplementSales by Channel
MLM
Retail - Mass Market
Retail - Natural & Specialty
Mail OrderInternet
Practitioner
$32.4B
28.5%
16.2%
8.3%
5.2%5.4%
36.3%
% of Total
0
10
20
30
40%
2002
30.7%
21.2%
2003
28.7%
37.2%
2004
27.4%
16.8%
2005 2006
23.8%
19.0%
2007 2008
3.0%
25.5%
2009
16.4%
2010
16.3%
2011
11.2%
2012
25.3%24.8%
20.0%
24.2%
2.1%
18.2%15.2% 15.8%
15.3%
VMHS Internet Sales GrowthTotal U.S. E-Commerce Growth
Internet supplement sales growth
NOTE: Forward estimates including 2012 were created in May and do not reflect NBJ's current best estimates. NBJ will update its estimates in its June/July 2013 Industry Overview issue, which will be available at www.newhope360.com/nbj

7
Supplement Industry Overview Key Facts & Figures
0
20
40
60
80%
1971-1974
23%
1976-1980
35%
1988-1994
42%
1999-2000
52%
2006
66%
2007
68%
2008
64%
2009
65%
2010
66%
2011
69%
2012
68%
Close to 70% of U.S. adults use supplements, with reasons for use varying depending on demographics and other factors.
Consumer Trends and Insights
Nutr
itio
n bu
sine
ss jo
urna
l
Supplement use motivationsU.S. supplement usage1
Supplement usage has remained fairly steady in recent years with a sizeable portion of the American population placing value on their
health benefits
• A recent national study2 found that the most commonly reported reasons Americans cite for using supplements include “improving overall health” (45%) and “maintaining overall health” (33%)
• Another recent survey3 showed that the top 5 reasons people choose to take supplements include:
1. “To feel better” – 41%
2. “To improve overall energy” – 41%
3. “To boost their immune system” – 36%
4. “For digestive issues” – 28%
5. “To lower cholesterol” – 21%
• Adults 60 years of age and older are more likely than younger people to report motivations related to condition-specific reasons like heart, bone and joint, and eye heath. Older adults are also more likely to take supplements with 67% of those over 50 using supplements vs. 45% of those 50 and under1
• Supplement usage based on the advice or recommendation of a healthcare provider only accounts for 23% of supplement use
• Use of supplements has been shown to correlate with favorable health and lifestyle choices including non-smoking, exercising, and health insurance coverageSources: (1) Council for Responsible Nutrition 2012 Consumer Survey on Dietary Supplements, NHANES I,
NHANES II, NHANESIII, and NHANES 1999-2000 (2) JAMA Internal Medicine – Feb 2013 – “Why U.S. Adults Use Dietary Supplements” (3) JAMA Internal Medicine – 2012 – “Users’ Views of Dietary Supplements”
0
20
40
60
80
100%
2012
OccasionalUsers
RegularUsers
Seasonal Users
76%
18%
6%2012

8
0
100
200
300M
2012E
253M
2017P
264M
2022P
Age 35-44
Age 25-34
Age 15-24
Age 45-54
Age 75+
Age 65-74
Age 55-64
274M
U.S. Population
-2.9%
10.3%
7.2%
-9.4%
9.2%
43.8%
30.9%
% Growth2012E-2022P
0.0
20.0
40.0
60.0
80.0%
18-44
7% 9%
45-64
33% 35%
65 & over
Men Women
63% 62%
0
1,000
2,000
$3,000B
0
100
200
300
400M
1960$27B
1970
$75B
1980
$256B
1990
$724B
2000
$1,377B
2010
$2,600B
U.S. Population(right axis)
The supplement industry will likely benefit from the aging U.S. population and an increasing focus on preventative health and alternatives to prescription medicines.
Supplement Industry Overview Key Facts & Figures
Demographics & Population Trends
Nutr
itio
n bu
sine
ss jo
urna
l
Incidence of chronic health issues by age2National health expenditures1
U.s. population trends3
National health expenditures have outpaced overall population growth nearly tenfold over the last 5 decades. Since 1960, the U.S. population
has grown about 1% each year, while health expenditures have increased at a compound annual growth rate of 9.5%, largely due to the
aging population and the rise in obesity and other epidemics.
Health exp.(left axis)
Sources: (1) Centers for Medicare & Medicaid Services (2) Centers for Disease Control and Prevention (3) United States Bureau of the Census

9
Consumers are seeking products that are closer to their natural, whole state. NBJ estimates that the U.S. whole-food supplement market grew 12% in 2012 to reach $1.2 billion – almost double the growth rate of the overall dietary supplement industry. Major players have taken notice, as evidenced by Procter & Gamble’s recent acquisition of New Chapter, a market leader in the category.
Other Industry Trends (1 of 2)We expect several other key trends – both positive and negative – to influence the industry over the long term.
Sources: NBJ, PCG
Uncertainty around the FDA’s New Dietary Ingredient (NDI) guidelines has continued for nearly 2 years, since the FDA released a draft in June 2011. In April 2013, industry groups asked the FDA to clarify what information it requires to identify an ingredient that is the subject of an NDI notification. Other issues also remain outstanding: “grandfathered” ingredients, parameters for chemical alterations of old ingredients, etc.
NDI Stalemate?
While one-size-fits-all and mass customization approaches to providing consumers with supplements make up the majority of the industry, some companies are providing customers with truly personalized solutions based on genetic tests (e.g., geneME) and blood tests (e.g., WellnessFX).
Personalization
Supplements have been a frequent subject of the Dr. Oz show; products/brands and retailers have experienced sales spikes of particular ingredients profiled by Dr. Oz. On April 9, 2013, Consumerlab.com appeared on the show, stating that 40% of multivitamins it tested for nutrient content quality failed. This has been a common theme in the industry, with high-integrity producers continuing to encourage the weeding out of “bad apples,” though the industry had hoped for a chance to comment in this case.
The oz effect
Integrative medicine, which brings together modern and “alternative” medicine, has grown in popularity at mainstream establishments, from university hospitals to private clinics. A greater focus on nutrition and supplementation by these institutions is paving the way for significant growth in the VMHS industry and redefining the “target customer” (e.g., traditional medical doctors) for brands focused on the healthcare practitioner segment.
Integrative medicine
Supplement Industry Overview Key Facts & Figures
Nutr
itio
n bu
sine
ss jo
urna
l
Trusted source

10
The supplement industry has seen two new mega-markets emerge recently – gut health, thanks to microbiome research on the effects of microorganisms inhabiting the human body; and brain health, thanks to age-related cognitive decline in Baby Boomers and depression in millennials. These markets have seen active involvement from supplement manufacturers, as well as food companies interested in solutions that satisfy the large and growing demand.
Other Industry Trends (2 of 2)
Sources: NBJ, PCG
As with food, supplements have been at the center of the GMO debate. Despite the failure of Prop 37 in California, state legislation on the GMO issue is likely to continue, presenting clear problems due to the prevalence of GMOs in the U.S. and the lack of a single regulatory standard. The Non-GMO Project, a nonprofit verification and labeling organization, has verified a handful of VMHS brands’ products (e.g., New Chapter, Nordic Naturals, Barlean’s, Flora, Garden of Life, etc.) but all large brands are noticeably absent.
GMOS
Supplement innovation continues, with the introduction of new flavors and textures, cutting-edge delivery systems, unique sourcing options, and customization. This innovation has allowed for expansion into bordering industries like beauty and food with the introduction of multivitamins for the skin and vitamin-infused food.
innovation
Although the adulteration of dietary supplement products is not new, the recall of the prescription form of sibutramine and the growth in the black market trade of this weight-loss ingredient, as well as adulteration problems associated with muscle-building and male sexual enhancement supplements, have fueled increased regulatory action on the part of the FDA recently. The issue of product adulteration and its potential fallout could impact every part of the dietary supplements sector.
adulteration
With the growth in sports nutrition and greater awareness of the benefits of protein – for sports/ fitness and more generally – whey protein prices have continued to present challenges for industry players. Similarly, the cost of sourcing crude fish oils has reached an all-time high, causing many supplement companies to increase prices on popular fish-based omega-3 products. These are just two of many examples of ongoing commodity cost challenges.
Commodity Costs
Supplement Industry Overview Key Facts & Figures
Nutr
itio
n bu
sine
ss jo
urna
l
Mega Markets

Supplement Industry Overview
2012 SPINS Retail Sales Update
Transaction News and Review
Implications for Growth
Update on Top Companies
Appendix
1
3
4
2
5
6

12
Consistent with the NBJ data, SPINS reports 8% growth in retail sales of VMHS in 2012, with the natural channel outperforming.
SPINS VMHS Product and Channel Trends2012 SPINS Product trends
2012 spins channel trends0
3
5
8
10
$13B
2010
$10.1B
2011
$10.8B
2012E
Herbs &Homeopathic
Vitamins andSupplements
$11.7B
0
3
5
8
10
$13B
2010
$10.1B
2011
$10.8B
2012E
ConventionalChannel
Natural Channel
$11.7BSpecialty Gourmet
% Growth 5.1% 7.6% 8.0%
$1.3B+8.0%
+$94.9M
$10.4B+8.0%
+770.2M
2012 Totals
$1.0B+13.5%
+$123.8M
$10.6B+7.5%
+$737.5M
Conventional as % of Total 91.2% 91.1% 90.7%
2012 Totals$0.05B+9.0% +$3.8M
– In 2012, Vitamins & Supplements accounted for 89% of total VMHS sales tracked by SPINS. Leading categories within this segment include ready-to-drink meal replacements, food supplement oils, and multi-vitamins. See page 15 for growth drivers.
– Herbs & Homeopathic accounts for 11% of total 2012 VMHS sales tracked by SPINS, with this share remaining steady over the last 3 years. Leading product categories within this segment include cold and flu/immune system formulas, herbal singles, and homeopathic children’s and allergy & respiratory medicines. Please see page 16.
– Conventional• With FDM outlets and major players like Walmart* included, the
conventional channel dominates, accounting for 91% of SPINS-tracked sales in 2012.
– Natural• Given strong growth in the natural channel over the last 3 years,
the channel has increased as a percentage of total VMHS retail sales.
• Whole Foods, which is excluded from these figures, is estimated to be as large as the natural channel ex-Whole Foods.
– Specialty Gourmet*• While a small percentage of total sales (less than 0.5%), growth
is strong and Specialty Gourmet is becoming a more recognized channel for supplement sales.
Source: SPINS retail sales data (stores w/ >$2M revenue), Whole Foods excluded from all SPINS data.* = New data not included in our last (2011) VMHS report.
2012 SPINS retail sales update trends

13
0.0
0.0
0.0
0.0
0.0
$0.1B
2011
$0.04B
2012
Vitamins &Supplements
$0.05B
Specialty Gourmet Sales
Herbs &Homeopathic
All three SPINS-tracked channels enjoyed robust growth in VMHS sales in 2012.
Channel TrendsSpecialty gourmet channel
2012 spins channel trends
0.0
0.3
0.5
0.8
1.0
$1.3BNatural Channel Sales
2011
$0.92B
2012
Vitamins &Supplements
Herbs &Homeopathic
$1.04B
0.0
2.5
5.0
7.5
10.0
$12.5B
2011
$9.86B
2012
$10.60B
Conventional Channel Sales
Vitamins &Supplements
Herbs &Homeopathic
– Herbs & Homeopathic • Strongest in the Natural channel, accounting for 22% of total
VMHS sales; Herbs & Homeopathic also grew most rapidly in natural (up 12.5%).
• Smallest share in the Conventional channel, only accounting for 10% of total sales.
– Vitamins & Supplements• Strongest in the Conventional channel, accounting for 90% of
total sales.• Smallest share in Natural (78% of total sales), although the
strongest growth of all channels at 13.8%.
Totals & Growth
$1,040.4M+7.1%
+$68.9M
$231.2M+12.5%
+$25.7M
$809.4M+13.8%
+$98.0M
$9,557.6M+7.5%
+$668.6M
Totals & Growth
Natural channel
conventional channel
$7.0M+4.8%
+$0.3M
$39.0M+9.8%
+$3.5M
Totals & Growth
Source: SPINS retail sales data (stores w/ >$2M revenue), Whole Foods excluded from all SPINS data.Note: See page 21 which describes and defines SPINS channels.
2012 SPINS retail sales update trends

14
-200
0
200
400
600
800
$1,000MDollars
TotalUp
$878.6M
TotalDown
-$108.4MNet
Increase
$770.2M
-10
0
10
20
30Units (# of Subcategories)
TotalUp
25
TotalDown
-8Net
Increase
17
-10
0
10
20
30Units (# of Subcategories)
TotalUp
22
TotalDown
-6
NetIncrease
16
Sales grew in nearly all product subcategories* across VMHS in 2012.
Department gains and lossesHerbs & Homeopathic Dept.
-25
0
25
50
75
100
$125M
TotalUp
$104.3M
TotalDown
-$9.4M
NetIncrease
$94.9M
Dollars
-20
0
20
40
60Units (# of Subcategories)
TotalUp
47
TotalDown
-14Net
Increase
33
-250
0
250
500
750
$1,000MDollars
TotalUp
$982.9M
TotalDown
-$117.8M
NetIncrease
$865.1M
Vitamins & Supplements Dept. totals
2012 SPINS retail sales update trends
Source: SPINS retail sales data (stores w/ >$2M revenue); Whole Foods excluded from all SPINS data.*See page 20 for SPINS category/subcategory breakdown.

15
2012 SPINS retail sales update leaders & laggards
Vitamin & Supplement 2012 Leaders and Laggards
$4.3M
Soy is an allergen for many people. Concerns over GMO content and estrogens in soy may also be contributing factors.
Nutritional yeast and brewer’s yeast are often used as a salt alternative for taste, while also providing additional nutritional value.
Use of creatine supplements by weightlifters, bodybuilders, and increasingly mainstream consumers is driving growth in this category.
The hormone melatonin is a leader in natural sleep products and has also been shown in studies to be beneficial to nerve health.
We may see a turnaround in vitamin E sales in 2013, as several recent studies have shown benefits for heart, brain, and liver health.
Consumers are becoming aware that high levels of calcium may not be the most effective way to promote bone health.
Yeast Products
Creatine
DHEA, Pregnenolone & Hormones
Soy Supplements
Vitamin E
Calcium & Calcium Formulas
$164.4M
$4.2M
$93.5M
$442.8M
$27.5M
32.7%
26.5%
-16.8%
-13.5%
31.0%
-7.3%
$602.4M Influenced by the powerful vegan movement, plant-based proteins lead sales growth in powdered meal replacements. Powdered Meal Replacements 21.6%
$37.6M The demographics of the typical sports supplement user has expanded to include women and youth, as well as new fitness categories.
Other Sports Supplements 21.3%
$436.5M Shelf-stable technology and other innovations promise to keep this category on the fast track for the next several years.
Prebiotics and Probiotics 21.1%
Overfishing of many endangered species and high mercury levels found in shark combined with non-beneficial scientific findings in regards to cancer have steered consumers away.
Cartilage Products $0.5M -14.3%
Press on laxatives has not been very positive. Now more focus on maintaining digestive tract health with ingredients like chia & probiotics.Fiber Products & Laxatives $416.5M -8.5%
Aloe Products $31.8M -4.0 %The decline in aloe products can be attributed to the decline of laxative-based cleanse products.
subcategory 2012 sales comments2012 growth
Growth Leaders
(by %)*
Growth Laggards
Source: SPINS retail sales data (stores w/ >$2M revenue); Whole Foods excluded from all SPINS data.Does not include all subcategories, only those showing greatest PERCENTAGE increases and declines.
*Leaders by 2012 dollar sales growth include: 1) Ready-to-Drink Meal Replacements, 2) Powdered Meal Replacements, 3) Other Misc. Supplements, 4) Prebiotics and Probiotics and 5) Supplement Oils.

16
Herbs & Homeopathic 2012 Leaders and Laggardssubcategory 2012 sales comments2012 growth
Growth Laggards The trend appears to have shifted from whole-body cleansing to general
digestive health (probiotics and prebiotics).
Probiotics, digestive enzymes and fiber are the leaders in digestive health currently. DA medicines, which include only homeopathic, do not resonate well with consumers looking for options in digestive health.
Homeopathic cold & flu support and mood support products are the key drivers of sales in this subcategory.
Herbal formulas for pain and inflammation continue to drive sales.
This subcategory has a small number of products overall, and has been lacking in new product introductions.
Prostate and libido products drive sales here, as well as supportive ingredients like saw palmetto, tribulus, and pumpkin seed.
Stress and anxiety formulas are the most popular in the natural channel; sleep remedies are best sellers in the conventional channel.
Nettles & quercetin formulas that target allergy relief continue to be the foundation in this subcategory.
Children’s cold/flu products and baby colic products are examples of more popular children’s supplements in this subcategory.
The recent press that’s been surrounding homeopathics in general has been mostly negative, resulting in the decline in this category.
Homeopathic remedies for sinus and allergy relief, as well as herbal remedies for lung support drive sales in this health focus.
Cortisol and adrenal support supplements have been increasing in popularity, pushing St. John’s Wort out of the limelight.
$65.1M
$16.8M
$1.0M
$0.3M
$67.8M
$42.8M
40.8%
30.8%
-40.8%
-13.3%
32.1%
-5.4%
$78.3M 27.9%
$2.3M 26.9%
$37.8M 24.2%
$0.7M -32.7%
$35.8M -6.3%
$39.1M -5.0%
Children’s Medicines
Other Herbal Formulas
Allergy/Respiratory Medicines
Calmative Herbal Formulas
Allergy Herbal Formulas
Children’s Herbal Formulas
Digestive Aid Medicines
Flower Essence Topicals
Men’s Herbal Formulas
St. John’s Wort Formulas
Cleansing/Organ Herbal Formulas
Other Homeopathic Medicines
2012 SPINS retail sales update leaders & laggards
Growth Leaders
(by %)*
*Leaders by 2012 dollar sales growth include: 1) Children’s Medicines, 2) Calmative Herbal Formulas, 3) Cold & Flu/Immune System Formulas, 4) Other Herbal Formulas and 5) Other Herbal Singles. Source: SPINS retail sales data (stores w/ >$2M revenue); Whole Foods excluded from all SPINS data.
Does not include all subcategories, only those showing greatest PERCENTAGE increases and declines.

17
2012 SPINS retail sales update ingredients
Ingredient Trendssubcategory 2012 sales comments2012 growth
Heavy hitters
Up & comers
Multi-source proteins, popular with body builders, are purported to be absorbed more effectively by the body because the different protein sources digest at different rates.
Studies show milk proteins promote weight maintenance, muscle synthesis, and blood glucose control. Many food manufacturers are adding milk protein to their products to enhance their nutritional value.
Strong links to digestive health have driven robust growth over the last few years, although growth is now slowing, similar to fish oil.
12.4%/ 26.0%
20.4%
19.9%
$724M/$236M
$440M
$579M
Multi-Source Protein with/without Soy
Milk Protein
Probiotic Supplement
Across the supplement industry, several stand-out ingredients drove growth.
Referred to as “Golden Root” or “Arctic Root”, Rhodiola is known as a natural anti-depressant.
Among the highest antioxidant capacities of all fruits and vegetables, as well as memory benefits, according to recent studies.
Shown to aid in weight loss and lean muscle building without typical side effects.
Recent studies have lent credence to the touted benefits of Carnosine including anti-aging effects, and life-span extension.
396.6%
282.7%
699.9%
351.4%
$9M
$3M
$2M
$1M
Rhodiola
Blueberry
7-Keto
Carnosine & Metabolites
228% 2-yr growth
66% 2-yr growth
44% 2-yr growth
-9% 2-yr growth
Chia seed, oil DHA products Vitamin K Resveratrol
How did our previous
up & comers fare?
(2011 newsletter)
Source: SPINS retail sales data (stores w/ >$2M revenue); Whole Foods excluded from all SPINS data.

18
2012 SPINS retail sales update trends
The Oz Effect – Key Ingredient MentionsIngredient Date of oz mention commentsGrowth
Dr. Oz has also played a role in ingredient popularity. Recommendations have driven consumers toward supplements with specific ingredients, causing immediate and immense impacts on product sales.
Saffron
Dr. Oz called Saffron Extract with Satiereal a “Miracle appetite suppressant” to curb emotional eating and control hunger. Satiereal Saffron is said to increase satiety while decreasing stress hormones and improving emotional health.
Feb 20, 2012
Green Coffee Extract
Sept 10, 2012
Green Coffee Bean Extract was touted by Dr. Oz as “The fat burner that works!” Dr. Oz conducted a study with 100 women, half of whom took the extract and lost twice as much weight as those taking a placebo. The extract is lauded as being natural, effective, and free from side-effects.
Market Size: $1.0M
2012 Growth: 8,416%
2011 Growth: 211%
Market Size: $29.7M
2012 Growth: 139,807%
2011 Growth: -35%
Ketones
Feb 6, 2012
On a show about fat busters, Dr. Oz touted Raspberry Ketones as “the #1 miracle in a vial.” Their regulation of the adiponectin protein, which is used by the body to control metabolism, is purported to help the body burn fat faster.
Market Size: $26.6M
2012 Growth: 263,572%
2011 Growth: NA
Dr. Oz presents a unique opportunity as well as a challenge to both manufacturers and retailers, who can struggle to meet increased short-term demand resulting from a Dr. Oz mention
Source: SPINS retail sales data (stores w/ >$2M revenue); Whole Foods excluded from all SPINS data.

19
Organic and non-GMO supplements are leading indicators of industry trends.
Organic and non-gmo trends
2012 Non-gmo vmhs sales2012 Organic vmhs sales
0
100
200
300
$400M
AnyOrganic Content
$358M
$305M
70%+Organic Content
$156M$125M
USDA(95%+ Organic Content)
20122011
$91M$70M
Growth of organic products significantly outpaced the overall industry growth rate of 8% in 2012, with growth
rates increasing with the level of organic content
% Growth 17.2% 24.3% 29.8%
2012 SPINS retail sales update trends
0
20
40
60
80
$100M
Non-GMO Herbs &Homeopathic
$21M$17M
Non-GMO Vitamins &Supplements
20122011
$77M$69M
% Growth 12.1% 20.8%
Non-GMO products (as verified by the Non-GMO Project) saw much greater growth in 2012 than the overall
VMHS market, albeit from a small base
Overall growth: 20.7%
Overall growth: 13.8%
Source: SPINS retail sales data (stores w/ >$2M revenue); Whole Foods excluded from all SPINS data.

20
In addition to ingredients, SPINS tracks sales for distinct product departments, categories and subcategories.
2012 SPINS retail sales update spins
SPINS Product categories
Homeopathic Medicines
Herbs & Homeopathic
Vitamins & Supplements
Herbal Singles
HerbalFormulas
Flower Essences
Amino Acids
DietFormulas
MealReplacements & Supplement
Powders
FoodSupplements
DigestiveAids &
Enzymes
Vitamins &Minerals
Misc.Supplements
• Remedies
• Topicals
• Allergy
• Brain/Circulation
• Calmative
• Children’s
• Cleansing / Organ Support
• Brain/ Circulation
• Calmative
• Cold & Flu & Immune System
• Allergy/Respiratory
• Children’s
• Cold/Flu
• Digestive Aid
• Homeopathic
• Amino Acids • Diet Formulas • Meal Replacements & Supplements
• Ready To Drink Meal Replacement
• Aloe Products
• Bee Products
• Cartilage Products
• Green Food
• Misc Fruit & Vegetable & Grain
• Soy
• Supplement Oils
• Yeast Products
• Fiber Products & Laxatives
• Misc Enzyme Products and Digest Formulas
• Prebiotics & Probiotics
• Calcium & Calcium Formulas
• Carotenoids & Antioxidant Formulas
• Children’s
• Multi-Vitamins
• Other
• Vitamin B
• Vitamin C
• Vitamin E
• Vitamins A, D & K
• Women’s
• Chromium Picolinate
• Coenzyme Q-10
• DHEA & Pregnenolone & Hormones
• Glucosamine & Chondroitin Supplements
• Other Misc. Supplements
• Polyphenols
Sports Nutrition
• Creatine
• Other Sports Supplements
Key (SPINS Terminology):• Yellow and Green boxes = Departments • Grey boxes = Categories • Bulleted items = Subcategories
• Other
• Pain Relief
• Stress & Sleep
• Women’s
• Men’s
• Other
• Women’s
• Cold & Flu/ Immune
• Herbal Energy
• Men’s
• Other
• St. John’s Wort
• Women’s’
Source: SPINS

21
3 Channels Covered by SPINS:
• Defined as any full-format supermarket with more than $2 million in annual sales, at least 50% of sales generated from natural and organic products, and less than 50% of sales from supplements.
• More than 900 natural retailers throughout the U.S. fit this criteria to make up the Natural Channel and range from independent retailers to larger regional chains and associations including the National Cooperative Grocers Association (NCGA) and the Independent Natural Food Retailers Association (INFRA).
• Defined as full-format supermarkets with more than $2 million in annual sales, with SPINS-defined specialty items comprising at least 25% of their overall volume.
• These experiential retail stores bring high-quality products to the variety-seeking consumer, provide full-service gourmet departments, and have a strong focus on specialty, imported, ethnic, natural, and organic items.
• The Specialty Gourmet Channel is represented by more than 800 specialty supermarket stores that have traditionally been undistinguished within broader retail measurement services.
• Also known as All Outlet Combined (AOC). AOC includes Conventional Food, Drug, and Mass stores, along with Military, Club, Dollar, and Walmart.
• SPINS provides a comprehensive source of information on UPC-coded Natural, Organic, Specialty Gourmet, and Health & Wellness positioned products selling through these conventional channels.
• SPINSscan Conventional is powered by Nielsen Scantrack. SPINS analyzes products with the Nielsen Scantrack™ library to identify and code nearly 400,000 UPCs that align with our core services based on their positioning, ingredients, and attributes.
SPINS data covers the natural, specialty gourmet, and conventional channels.
Specialty Gourmet
Natural
Conventional
2012 SPINS retail sales update spins
Source: SPINS

Supplement Industry Overview
2012 SPINS Retail Sales Update
Transaction News and Review
Implications for Growth
Update on Top Companies
Appendix
1
3
4
2
5
6
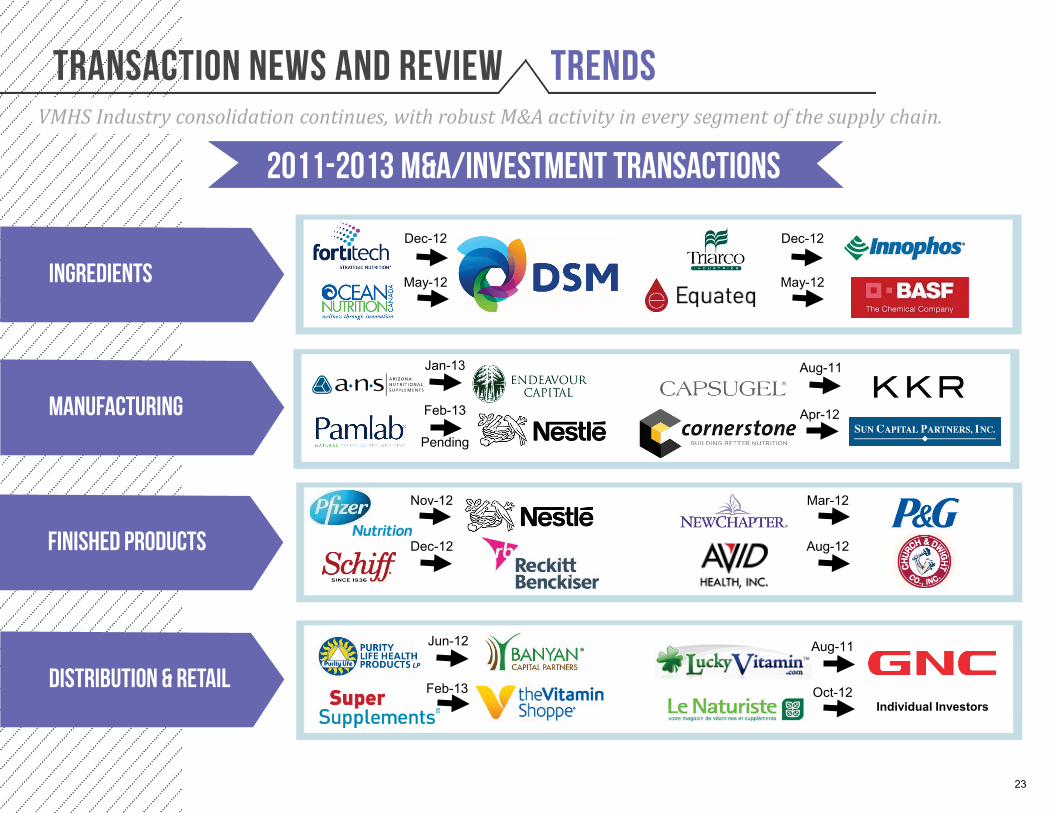
23
2011-2013 M&A/Investment Transactions
VMHS Industry consolidation continues, with robust M&A activity in every segment of the supply chain.
Transaction News and Review Trends
Dec-12
May-12
Dec-12
May-12
Jan-13
Feb-13
Pending
Apr-12
Nov-12
Dec-12
Mar-12
Aug-12
Jun-12
ingredients
manufacturing
Finished products
Distribution & retailIndividual Investors
Feb-13 Oct-12
Aug-11
Aug-11

24
Corporate Venture
Venture Capital Private Equity
MLM/DTCCrowdfunding Food Companies
Exemplary VMHS Buyers
Supplement company buyers span a broader range than ever before.
VMHS Companies & Manufacturers cPG Companies
Retailers Angel Groups
Pharma/OTCIngredient Companies
Transaction News and Review Trends

25
Large strategics like Reckitt Benckiser, a previously unlikely VMHS acquirer, now see investment in VMHS and healthy living as a core component of their growth strategies.
Transaction News and Review Reckitt benckiser case study
2012
RB acquires Schiff Nutrition.
2012
RB announces new corporate strategy, vision and purpose
focused on health and better living.
RB acquires Boots Healthcare International for £1,926M, gaining
a new platform for growth in attractive OTC healthcare market.
2006
RB acquires Adams Respiratory Therapeutics, Inc., allowing it to enter the U.S. OTC market with
Mucinex, the #1 U.S. cough remedy.
2008RB completes acquisition of SSL International and adds Durex and Scholl to its list of
power brands.
2010
Reckitt & Colman and Benckiser merge to become
Reckitt Benckiser, the world’s No.1 household
cleaning company.
1999
Historical
RB has a long history dating back to1823
and involving numerous core
brands/products.
Reckitt Benckiser announced a refreshed corporate strategy in 2012, which includes a focus on the faster growth and higher margin consumer health and hygiene categories. The acquisition of Schiff Nutrition in
2012 was the first actualization of this new strategy and continued on the heels of various successful consumer health acquisitions.
RB disposes of 2 non-core businesses.
2000
2001
RB acquires Tiga Roda, an Indonesian pest control business;
and Oxy, a leading Korean household products company.

26
Private Equity19%
Public13%
Private/Other42%
Pharma21%
CPG5%
Significant consolidation in the VMHS industry is expected to continue.
Transaction News and Review consolidation
Vmhs industry consolidation
CPG8%
Private Equity18%
Public16%
Private/Other18%
Pharma40%
Nutrition Business Journal founder and editorial advisory board chairman, Tom Aarts, forecasted that industry consolidation due to acquisitions by pharmaceutical and CPG companies could lead to these two groups owning ~50% of VMHS assets within five years. We have already seen significant movement in that direction, with recent large-scale deals by Pfizer (acquisition of Alacer), Reckitt Benckiser (acquisition of Schiff Nutrition), Procter & Gamble (acquisition of New Chapter), andChurch and Dwight (acquisition of Avid Health).
• VMHS industry may be influenced by greater sophistication in consumer research, marketing, and branding brought by big pharma, CPG, and other parent companies.
• Increased competition/barriers to entry as VMHS companies receive strong backing from parent companies.
Potential Implications:• Potential for blurring lines between the nutrition,
pharmaceutical, and food industries as brands come under common ownership. Will this impede innovation?
• Pharmaceutical companies with supplement holdings may become more involved in DSHEA and associated VMHS-related FDA interactions.
2011 2015E

27
0.0
25.0
50.0
75.0
100.0
125.0X
High
118.0X
Mean
19.9X
Median
11.1X
Low
5.0X
0
2
4
6X
High
5.6X
Mean
2.4X
Median
2.3X
Low
0.2X
Strong valuations in 2011-13 are a tribute to strength and attractiveness of the industry and competition for quality assets.
Transaction News and Review m&a activity
Transaction Multiples – Aggregates for 2011-13 vmhs Transactions
Source: CapitalIQ, PitchbookSee transaction details on p. 28-33
Sales multiples
ebitda multiples
Year # Deals EV Sales multiple
EBITDAmultiple
2011 63 $22M 2.3x 10.2x
2012 48 $116M 2.0x 12.3x
YTD2013 14 $107M 2.6x 6.0x
Valuation chronology - medians
Valuation chronology - Averages
Year # Deals EV Sales multiple
EBITDAmultiple
2011 63 $475M 2.4x 27.9x
2012 48 $843M 2.4x 15.7x
YTD2013 14 $246M 2.6x 6.0x

28
Transaction News and Review M&A activity
Key 2011 - YTD2013 Transactions (1 of 6)Transaction Details EV / LTM
Date Target Investor / Buyer Sales EBITDA
May-13Pending Steigerwald Arzneimittelwerk Gmbh Bayer AG (DB:BAYN) - - -
Apr-13 UAS Laboratories, Inc. Lakeview Equity Partners - - -Feb-13Pending Pamlab, L.L.C. Nestlé Health Science S.A. - - -
Feb-13Pending Wisconsin Specialty Protein, LLC Omega Protein Corp. (NYSE:OME) $26.5 2.3x -
Feb-13 Pharco SA, Arterin Business Omega Pharma Belgium N.V. $13.1 - -
Feb-13 Bayer AG, Customer and Standard Vitamin Premix Business DSM Nutritional Products (UK) Ltd - - -
Feb-13 Super Supplements, Inc. Vitamin Shoppe, Inc. (NYSE:VSI) $50.0 - -
Feb-13 Natur Produkt International, JSC Valeant Pharmaceuticals International, Inc. (TSX:VRX) $163.0 - -
Jan-13 Botanical Laboratories, Inc. Schwabe North America, Inc. - - -
Jan-13 Scitec Nutrition Enterprise Investors, Morgan Stanley Alternative Investment Partners - - -
Jan-13 Bariatrix Nutrition Corporation Caisse de Depot et Placement du Quebec - - -
Jan-13 Arizona Nutritional Supplements, Inc. Endeavour Capital, Inc. - - -
Jan-13 Pronova BioPharma ASA (OB:PRON) BASF AS $926.6 2.9x 6.0x
Jan-13 Proventiv Therapeutics, LLC Opko Health, Inc. (NYSE:OPK) $299.0 - -
Dec-12 Triarco Industries, LLC Innophos, Inc. $45.8 1.8x -
Dec-12 Dalblads Nutrition AB Midsona AB (publ) (OM:MSON B) $5.3 0.7x -
Dec-12 KeyView Labs, Inc. Ballast Point Ventures - - -
Dec-12 Fortitech, Inc. Koninklijke DSM N.V. (ENXTAM:DSM) $634.0 - -
Dec-12 Schiff Nutrition International Inc. (NYSE:SHF) Reckitt Benckiser LLC $1,433.0 5.0x 33.4x
Dec-12 AeroDesigns, Inc. Polaris Partners - - -
Dec-12 Laboratorio Franco Colombiano Lafrancol S.A. CFR International SPA $562.0 2.8x -
Enterprise Value ($M)

29
Transaction News and Review M&A activity
Key 2011 - YTD2013 Transactions (2 of 6)Transaction Details EV / LTM
Date Target Investor / Buyer Sales EBITDA
Dec-12 Cargill, Incorporated, Cultures and Enzymes Business DSM Food Specialties B.V. $110.0 1.9x -
Nov-12 McNeil Nutritionals, Viactiv Business Sands Brothers Asset Management - - -
Nov-12 Fluxome Sciences A/S, Certain Assets Evolva Holding SA. (SWX:EVE) $1.5 - -
Nov-12 Pfizer Nutrition Inc. Nestlé S.A. (SWX:NESN) $11,850.0 5.6x 23.7x
Nov-12 Veracus GmbH B.& C.Tönnies Fleischwerk GmbH & Co. KG - - -Oct-12
Pending Tournay Biotechnologies Nexira SAS - - -
Oct-12 Goerlich Pharma International GmbH BayBG - - -
Oct-12 Le Naturiste Mélanie Kau and Stephen Rosenhek - - -
Sep-12 To Go Brands, Inc. MedPodium Health Products, Inc. $2.0 - -
Sep-12 ATF Fitness Products, Inc., Sci-Fit and Nature's Science Brands Creative Edge Nutrition, Inc. (OTCPK:FITX) - - -
Sep-12 Decas Botanical Synergies Inc. Naturex, Inc. - - -
Aug-12 SCD Enterprises, LLC Creative Edge Nutrition, Inc. (OTCPK:FITX) - - -
Aug-12 Avid Health, Inc. Church & Dwight Co. Inc. (NYSE:CHD) $650.0 2.8x 11.2x
Aug-12 CNS Wellness, LLC Wellness Center USA, Inc. (OTCPK:WCUI) $14.2 - -
Jul-12 Walmark, a.s. Mid Europa Partners LLP - - -
Jul-12 Mycell Technologies LLC Undisclosed Institutional Investor - - -
Jul-12 AMT Labs, Inc. Innophos, Inc. $20.0 - -
Jul-12 FIT-Bioceuticals Limited Blackmores Limited (ASX:BKL) $40.9 1.1x 8.8x
Jun-12 Pacific Pure-Aid Company DIANA Group SA - - -
Jun-12 Improve USA, Inc. Pharmachem Laboratories, Inc. - - -
Jun-12 Purity Life Health Products Limited Banyan Capital Partners $14.3 0.2x -
May-12 Accera, Inc. Nestlé Health Science S.A. - - -
Enterprise Value ($M)

30
Transaction News and Review M&A activity
Key 2011 - YTD2013 Transactions (3 of 6)Transaction Details EV / LTM
Date Target Investor / Buyer Sales EBITDA
May-12 Pharmline Inc. Stauber Performance Ingredients, Inc. - - -
May-12 NuMe Health LLC BVM Capital, LLC - - -
May-12 Manuka Health New Zealand Ltd Waterman Capital - - -
May-12 Equateq Limited BASF SE (DB:BAS) - - -
May-12 CNP Professional Limited First Milk Limited - - -
May-12 Ocean Nutrition Canada Ltd. Koninklijke DSM N.V. (ENXTAM:DSM) $529.9 2.8x -
May-12 Supreme Protein Inc. Dymatize Enterprises, Inc. - - -
May-12 Asantae Holdings International Inc. (TSXV:JVA) Two Kings LLC - - -
Apr-12 CornerStone Research & Development Sun Capital Partners, Inc. - - 5.0x
Mar-12 Airborne Health, Inc. Schiff Nutrition Group, Inc. $150.0 2.1x 13.3x
Mar-12 New Chapter, Inc. Procter & Gamble Co. (NYSE:PG) $122.0 1.5x 10.0x
Feb-12 Sequel Naturals (Vega) VMG Partners - - -
Feb-12 Pharma Vinci A/S Axellus A/S - - -
Feb-12 Alacer Corp. Pfizer Inc. (NYSE:PFE) $360.0 3.6x 20.0x
Feb-12 Probiótica Laboratórios Ltda. Valeant Pharmaceuticals International, Inc. (TSX:VRX) $86.3 1.9x -
Feb-12 GreatLife International LLC Jeunesse Global, LLC - - -
Feb-12 Euticals SpA Private Equity Partners SpA; Clessidra SGR S.p.A.; IDeA Capital Funds SGR SPA $218.7 - -
Jan-12 Neways, Inc. Z Capital, American Capital, Silver Point Capital and SAC Capital - - -
Jan-12 Soluble Products Co. Associated Brands, LP - - -
Dec-11 Indevex Biotech AB (publ) Bropelaren Invest AB, Centrecourt AB - - -
Dec-11 Alcresta, Inc. Bessemer Venture Partners, Frazier Healthcare Ventures, Third Rock Ventures, LLC - - -
Dec-11 BioSan Laboratories, Inc. 2x Consumer Products Growth Partners - - -
Enterprise Value ($M)

31
Transaction News and Review M&A activity
Key 2011 - YTD2013 Transactions (4 of 6)Transaction Details EV / LTM
Date Target Investor / Buyer Sales EBITDA
Dec-11 Nutrialys Triballat Noyal S.A. - - -
Dec-11 Ferrosan A/S (consumer health care business) Pfizer, Inc. (NYSE: PFE) - - -
Dec-11 Milk Specialties Company HM Capital Partners LLC - - -
Nov-11 Kelatron Innophos Holdings (NASDAQ:IPHS), Bain Capital $21.0 - -
Nov-11 EPAX A.S. Trygg Pharma AS $142.9 2.6x 9.2x
Nov-11 Nutrition 21 Inc., Substantially All Assets Phillip and Michael Satow $7.5 - -
Oct-11 Burgundy Extracts S.A.S. Naturex SA (ENXTPA:NRX) $22.2 1.2x -
Oct-11 Prolacta Bioscience Inc. Health Evolution Partners - - -
Oct-11 Nature's Bioceuticals Mistral Ventures, Inc. - - -
Oct-11Johnson & Johnson Consumer Nordic, ACO Branded Vitamin and Nutritional Supplements Range
ACO Hud AB $4.3 - -
Oct-11 BioCalth International Corp., Giantceutical, Inc., and Herb Source Enterprise, Inc. LTS Nutraceuticals, Inc. (OTCPK:LTSN) $17.5 - -
Oct-11 TRC Nutritional Laboratories, Inc. Nutra Inc. (Nutraceutical Intl. Corp) $4.6 - -
Sep-11 Granco Minerals, Inc., Animate® Prince Agri Products, Inc. - - -
Sep-11 A.M. Todd Ingredients WILD Flavors, Inc. - - -
Sep-11 Premier Nutrition Joint Juice - - -
Aug-11 The Healthy Bowels Company Ltd. Probiotics International Ltd. - - -
Aug-11 LuckyVitamin.com GNC Holdings, Inc. - - -
Aug-11 Botanical Science, Inc. IMD Companies, Inc. (OTCPK:ICBU) - - -
Aug-11 Novogen Limited, Consumer Products Division PharmaCare Laboratories Pty Limited $11.0 - -
Aug-11 Wockhardt Ltd., Nutritional Business Danone (ENXTPA:BN) $144.6 2.0x -
Aug-11 Capsugel, Inc. Kohlberg Kravis Roberts & Co. (NYSE:KKR) $2,375.0 3.2x -
Aug-11 Baby Care Ltd. (China) USANA Health Sciences Inc. (NasdaqGS: USNA) $62.2 4.1x -
Jul-11 Vital Foods Nestle Health Science - - -
Enterprise Value ($M)

32
Transaction News and Review M&A activity
Key 2011 - YTD2013 Transactions (5 of 6)Transaction Details EV / LTM
Date Target Investor / Buyer Sales EBITDA
Jun-11 Lipid Nutrition B.V, Clarinol®, Marinol® and Pinnothin® Product Lines Stepan Company (NYSE:SCL) - - -
Jun-11 Velvet Energy UK Ltd. Warburg Pincus LLC; Trilantic Capital Management LLC; Zam Ventures LP - - -
Jun-11 Sis (Science in Sport) Ltd. Provexis plc $13.0 1.7x -
Jun-11 Myprotein, Inc. The Hut Group Ltd. $95.3 3.6x -
Jun-11 Ganeden Biotech, Inc., Certain Assets Schiff Nutrition Group, Inc. $40.0 2.4x -
Jun-11 Lipid Nutrition B.V, Clarinol®, Marinol® and Pinnothin® Product Lines Stepan Company (NYSE:SCL) - - -
May-11 Herb Pharm White Road Investments, Adventure Funds $19.9 1.9x 7.6x
May-11 Danisco A/S DuPont Denmark Holding ApS $7,277.4 2.4x 12.9x
May-11 Pharmetics Inc., Certain Assets Monitor Clipper Partners, LLC - - -
May-11 Thorne Research, Inc. Helsinn Healthcare S.A. - - -
May-11 Carbboom Nutrition Bullish Brands - - -
May-11 HWSM Pharmaceuticals, L.L.C. Metrics, Inc. - - -
May-11 Vitatene S.A.U. Koninklijke DSM N.V. (ENXTAM:DSM) - - -
May-11 Mix1, Inc. Hershey Co. (NYSE:HSY) $11.8 - -
May-11 Advanced Vision Research, Inc. Akorn, Inc. (NasdaqGS:AKRX) $28.8 1.4x 118.0x
Apr-11 Robert & Fils Inc. Atrium Innovations Inc. (TSX:ATB) - - -
Apr-11 BioSan Laboratories, Inc. The Riverside Company - - -
Apr-11 Dr Sears Family Essentials, Inc. Intuitive Venture Partners, LLC - - -
Apr-11 NEXT Proteins (Designer Whey) Stockton Road, GarMark, Northwood - - -
Mar-11 LTS Nutraceuticals, Inc. (OTCBB:LTSN) Stone Harbor Investments - - -
Mar-11 Vitarich Laboratories, Inc. NBTY, Inc. $3.1 - -
Mar-11 EPIC Nutrition Blue Gold Beverages, Inc. - - -
Mar-11 Nutrilida Healthcare (Pty) Ltd Adcock Ingram Holdings Limited (JSE:AIP) - - -
Enterprise Value ($M)

33
Transaction News and Review M&A activity
Key 2011 - YTD2013 Transactions (6 of 6)Transaction Details EV / LTM
Date Target Investor / Buyer Sales EBITDA
Mar-11 Great HealthWorks The Florida Mezzanine Fund - - -
Feb-11 CM&D Pharma Ltd. Nestlé S.A. (SWX: NESN) - - -
Feb-11 Oy Bio-Vita AB Midsona AB (OM:MSON B) $5.4 0.6x -
Feb-11 Genisoy Food Company, Inc. Johnvince Foods Limited - - -
Feb-11 Ferrosan A/S Pfizer, Inc. (NYSE: PFE) - - -
Feb-11 Martek Bioseciences Corp. Koninklijke DSM N.V. (ENXTAM:DSM) $1,024.1 2.3x 8.3x
Feb-11 Maxinutrition Limited Glaxo Group Limited $258.7 4.5x -
Jan-11 Jemo-pharm A/S Hwo Holding A/S - - -
Jan-11 Bio-Engineered Supplements & Nutrition, Inc. Glanbia plc (ISE:GL9) $144.0 1.1x -
Jan-11 Dymatize Enterprises, Inc. TA Associates, Inc. - - -
Jan-11 Punch Power SA Institut Phytoceutic SAS - - -
Jan-11 DC Brands International (OTCBB: DCBR) Roswell Capital Partners, LLC - - -
Jan-11 Seroyal International, Inc. Atrium Biotech Investments $111.1 2.8x 11.1x
Jan-11 Bionor Pharma ASA (Nutrilett brand) Axellus $18.2 - -
High 5.6x 118.0xMean 2.4x 19.9xMedian 2.3x 11.1xLow 0.2x 5.0x
Enterprise Value ($M)

Supplement Industry Overview
2012 SPINS Retail Sales Update
Transaction News and Review
Implications for Growth
Update on Top Companies
Appendix
1
3
4
2
5
6

35
The industry tailwinds; product, channel, and ingredient trends; consolidation; and competitive dynamics profiled throughout this report provide several considerations for growth.
Implications for growth
Industrydynamics
• Changing demographics = changing product mix
• Consumer interest in condition-specific products and preventative “medicine”
• Concern re: quality, efficacy, and science balanced against demand for attractive price-value equation
• Uncertainty around NDI guidelines• Pet supplements a growing, though
nascent, market
• FDM is dominant (but crowded, competitive) channel
• Natural and healthcare practitioner channels are bellwethers of innovation, industry trends
• Highest growth is online• Retailers sensitive to
channel conflict
• Consumers seeking ways to identify quality products
• FTC scrutiny of claims• Large companies with strong
consumer research capabilities and propensity to spend on marketing have entered industry in meaningful ways
• Continued attractiveness of U.S. market; high growth, strong demand, no end in sight
• Interest in U.S. brands overseas; dearth of product in some markets
• Varying regulatory environments, language requirements, etc.
• Evaluate current SKUs – which are hero products and which are obsolete? Rationalize product line accordingly
• New product categories: focus on high-growth areas supported by demographics and take into account relative competition– Also provides opportunity to
increase SKUs at existing retailers and/or purchase size/frequency by customers
• Decide where to spend on science and where to leverage others’– Identify opportunities for
competitive advantage through science
• Take potential for slow FDA response on products/ingredients subject to NDI into account
• Maximize sell-through at existing accounts
• Fill in gaps in current channel presence
• Experiment with complementary channels– Channel strategy must take
into account potential for cannibalization and need to maintain relationships with existing channel partners
• Define channel strategy and orient sales/marketing teams around it
• Consider whether sub-brand can reduce channel conflict
• Get creative re: alternative channels: gyms, DRTV, etc.
• Fill in gaps in U.S. footprint• Consider whether/how to
pursue international business, balancing opportunity against resource requirements; possible alternatives:– Bring existing brands
overseas or create new brands in other countries
– Distributor vs. direct vs. other
• If preparing a company for sale, “headroom” internationally can be growth opportunity for new owner, especially one with global distribution
• Focus on making all channel partners as successful as possible, which may require customized strategies
• Assure that packaging, brand messaging, etc. are appropriate for customers; consider rebranding to avoid staleness and/or clarify messaging
• Track tactics with analytics to assess success and fine tune
• Consider benefits of demos/sampling and other interactive programs
• Promote science, quality, health benefits, uniqueness of products (as appropriate from a regulatory perspective)
• Assure all initiatives reviewed by regulatory experts
Products/ingredients
Possible suggestions/ ImplicationsFor growth
channels geographies Branding/marketing

36
Implications for growth
analytics customers Supply/facilities competition
• Industry becoming increasingly sophisticated, especially with participation of multinational CPG, pharma, other companies
• Careful balance of qualitative/creative with quantitative
• Strong focus on sell-through data, analyzing online data, customer research, ROI on promotions, etc.
• Handful of population is “hard core” supplement users; significant white space still exists
• Changing demographics impacting consumption
• Chronic disease increasing in prevalence and severity
• Power of customer research in VMHS industry
• Concern over adulteration, particularly in certain categories (SNWL) or if products made overseas
• Industry players pursue combination of vertical integration and outsourced co-packing
• Commodity price challenges
• Don’t let quantification trump innovation!
• Opportunity to better analyze distributor, retailer and customer data in “real time” and use to make shifts in strategy
• Focus on customer retention/ longevity
• Analyze SKU- and account-level profitability; use data to guide product and customer decisions
• Assess pricing relative to competitors
• For online business, significant opportunities to analyze consumer purchase behavior, provide highly customized marketing, and drive retention through right level of interactions
• Know your customer and target; a brand can’t be everything to everyone
• Consider how to engage with customer; importance of education
• Provide generous levels of customer service/support; often a key indicator of loyalty
• Interact with customers in-store through sampling/demos/ events; interact online through surveys, social media, etc.
• Understand what customers want and expect from your brand
• Ensure adequate capacity and supply to support growth
• Budget adequate expense for R+D and quality control
• Audit suppliers thoroughly; avoid unnecessary risk
• Consider supply/demand and pricing dynamics of products, ingredients and manufacturing processes well in advance of new product commercialization
• Competition varies by product/channel:
– Some “commodity” products (e.g., vitamin C)
– Some categories with high concentration of market share (e.g., Schiff in krill oil)
– Healthcare practitioner channel has higher barriers to entry but represents potentially large opportunity as MDs become more involved in VMHS
• Pick and choose battles
• Make strategic decisions in context of competitive dynamics and your company’s resources and expertise
• Consider where being nimble, performing grassroots marketing, spending heavily on advertising/marketing, providing education and other tactics can be most effective
Industrydynamics
Possible suggestions/ ImplicationsFor growth

37
Implications for growthWithin U.S. brick-and-mortar and online retail, a handful of key partners may be essential to a company’s growth strategy.
Door counts for key retailersChain # of DoorsGroceryAhold USA 775Albertsons 874BI-LO 207Delhaize America 1,300H-E-B 315Harris Teeter 211Kroger 3,619Publix 1,093Raley's 128Safeway 1,641Savemart 243Supervalu 1,522Trader Joe's 395Wakefern 68Wegmans 81Winn Dixie 485Natural GroceryEarth Fare 31Sprouts Farmers Market 157Vitamin Cottage 59Whole Foods 335
Chain # of DoorsDrugBartell Drug Company 58CVS Pharmacy 7,300Drugstore Networks 12,600Duane Reade 257Fruth Pharmacy 26Kerr Drug 76Kinney Drugs 95Lewis Drug 32Navarro Discount Pharmacies 32Pharmaca 24Rite Aid 4,667Walgreens 8,385
Chain # of DoorsMass99 Cents Only Stores 311Army Air Force Exch. Service 3,700BJ's Wholesale Club 198Costco 576Dollar General 10,000+Dollar Tree 4,671Family Dollar 7,442Fred's 700Harmon Stores 47Kmart 1,221Marc's 57Meijer 200Sears 1,320Shopko 332Sam's Club 612Target 1,778Wal-Mart 10,773
Chain # of DoorsSpecialty Retail ChainsGNC 5,967GNC LiveWell (within Rite Aid) 2,181Vitamin Shoppe 579Vitamin World 446Onlineamazon.com NAbodybuilding.com NAdrugstore.com NAHSN.com NAiHerb.com NAluckyvitamin.com NAmothernature.com NApuritan.com (NBTY) NAQVC.com NAsupersupplements.com NAswansonvitamins.com NAvitacost.com NAvitaminshoppe.com NAwalgreens.com NA
Note:• Mass, drug and grocery are all included in “Conventional” for SPINS and in Retail – “Mass Market” for NBJ• NBJ groups Natural & Specialty into one category, whereas SPINS separates them• Only NBJ reports on internet retailers
Sources: PCG estimates, TSG Consumer Partners, company websites and SEC filings. “Drugstore Networks” includes Family Pharmacy (2,100), Good Neighbor Pharmacy (3,400), Leader Drug Stores (3,100), Valu-Rite (4,000).

38
• The online/mail order channel continues to be a major growth avenue and is made up of multi-channel companies like NBTY, as well as direct-only companies like New Vitality and Healthy Directions.
• The growth in e-commerce sales of vitamins is consistent with consumers’ increasing propensity to consult the internet for health and wellness matters.
• The practitioner channel has also remained very strong.Sources: Nutrition Business Journal (NBJ), PCG, WSJ, consumerlabs.com
• Supercenters and mass merchandisers top the charts for supplement sales, due primarily to Wal-Mart’s massive footprint in the sector.
• Value channels and brands have been favored in this post-recessionary period. A Consumerlabs.com survey of top brands named Costco’s private-label products as #1 in club.
• Mass continues to be most competitive, most concentrated, and has the highest proportion of private-label sales.
mass
• #3 channel for supplement purchase after mass and natural/specialty.• RiteAid continues to roll out GNC store-within-a-store concept and is also converting 1,200 stores to a new
“wellness center” format (with GNC presence, greater organic and gluten-free options, in-house wellness ambassador, etc.). Walgreen Co. has launched a similar concept called Well at Walgreen’s.
• For pharma and OTC companies, VMHS presence is thought to be a way to capitalize on existing distribution and supply chains, and gain leverage with the large drug chains that dominate the industry.
drug
• Traditional grocery is the #4 sales channel after mass, natural/specialty, and drug.• According to Vestcom, 80% of consumers have bought VMHS in the grocery or drug channels in the last 2 years.
Trader Joe’s is the favored private-label brand.• Grocers have more proactively addressed the VMHS category in recent years. While “center store” grocery items
grew a total of 5.4% from 2008 to 1Q:12, VMHS grew 28.5% over the same period, according to Nielsen.
Conventional grocery
• Natural grocery and specialty stores together were the #2 channel after mass (incl. Wal-Mart). • Natural tends to be a breeding ground for industry innovation, second only to the practitioner channel. The channel
employs a more experiential customer service- and information-based model, and offers a greater variety of products. This is necessary given their discerning, education-oriented shoppers.
• Barlean’s is noted as a favorite brand by the natural channel shopper.• As FDM retailers continue to build out their vitamin sections, natural will need to continue to innovate.
Natural grocery/specialty
Other: Direct, MLM, Practitioner
Implications for growth
Trends in key supplement sales channels

Supplement Industry Overview
2012 SPINS Retail Sales Update
Transaction News and Review
Implications for Growth
Update on Top Companies
Appendix
1
3
4
2
5
6

40
Update on top companies supplement companies
Top Supplement Companies ($200M+ in Supplement Sales)company
Abbott Labs * • Ensure• EAS
• Develops, manufactures, and sells pharmaceutical and nutritional products.
~$560M
Schwabe NA • Nature’s Way• Enzymatic Therapy
• Develops and markets pharmaceutical and nutritional products.
~$320M
NBTY, Inc. • Nature’s Bounty• Sundown • Private Label
• Owned by The Carlyle Group, the company manufactures, markets and distributes branded and private-label supplements.
~$1,820M
Pharmavite (Otsuka) • Nature Made• Private Label
• Part of Otsuka (Japan), the company manufactures branded and private-label supplements.
~$1,230M
Perrigo* • Private Label • Private-label manufacturer of nutritional supplements.
~$540M
• One A Day• Flintstones
• Develops, manufactures, and markets pharmaceutical and nutritional products.
~$350MBayer*
Pfizer * • Centrum• Caltrate• Emergen-C (Alacer)
• Develops, manufactures, and markets pharmaceutical and nutritional products.
~$440M
GNC* • GNC• Third-party contract
manufacturing
• Leading global specialty retailer of VMHS products with over 8,200 locations, as well as a contract manufacturer.
~$440M
Glanbia* • Optimum Nutrition• BSN
~$380M• International nutritional solutions and cheese group, headquartered in Ireland.
* Public CompaniesSource: NBJ; sales represent wholesale U.S. supplement sales only
brands Business description Est. 2012 sales
Top players in the supplement market include pharmaceutical businesses, supplement-only companies, retailers with product offerings, and others.

41
0
3
5
8
10
$13B
2012E DTC SupplementSales by Channel
Mail, TV, Radio
Internet
Practitioner
MLM
$11.5B
14.8%
46.0%
23.9%
15.3%
%of Total
A robust direct-to-consumer supplement industry has also emerged in recent years. Network marketing businesses dominated from a scale perspective, but internet and practitioner channels won on growth.
Update on top companies direct-to-consumer
Direct-to-consumer supplement sales
Source: NBJ; sales represent U.S. supplement sales in the Network Marketing channel only.
2012 Growth
4%
15%
10%
9%
10%
Top network marketing companies - 2012 sales
0 200 400 600 800 $1,000M
USANA $110
LifeVantage $130
Nature's Sun. $140
XanGo $140
Advocare $140
Melaleuca $170
Medifast $210
Isotonix $220
MonaVie $250
Forever Lvg $260
Juice Plus+ $290
ViSalus Sciences $380
Shaklee $390
Herbalife $640
Alticor $930

42
Update on top companies public market update
company
Public company updates - supplements
1Q 2013• Atrium saw high organic growth in 1Q 2013 with the North American Retail and Health Care Practitioners
(HCP) businesses doing very well• 8.7% year-over-year growth with strong margins at 19.6%• A joint venture was announced with Fosun Pharma to distribute Atrium products in China• Vertical integration is important• Sports nutrition business is expanding with the Klean Athlete line of products
• The Nutritionals segment grew 13.3% year-over-year with growth in all categories, plus $5M of new product sales
• Closed a manufacturing facility in Lake Worth, Florida • Lower gross margins due to more VMHS sales and production inefficiencies in infant formula• Focused on other areas currently, including acquiring Sergeant’s pet food (categorized in consumer
healthcare)
2Q of FY2013 (qtr ended 3/31/13)
• 5% growth from both acquisitions and organic growth• A focus on manufacturing efficiency and sourcing is expected to drive costs down• There is an emphasis on continued merger and acquisition activity after consolidating and integrating
previous acquisitions• There is also a focus on new product development and existing product repositioning
period updates
Source: Company websites, 10Q filings
1Q 2013

43
Update on top companies public market update
company
Public company updates - ingredientsperiod updates
Source: Company websites, 10Q filings
2Q of FY2013 (qtr ended 2/28/13)
• Revenue grew 5.8% year-over-year, although EBITDA was down slightly• The Health & Nutrition division showed the highest growth – up 17% mainly due to strong performance in
human and animal health in North America• For the first half of fiscal 2013, Health & Nutrition sales accounted for 15% of total sales vs. 14% last year • GI study was not successful - 8M euro impairment charge• Chr Hansen brought on a new CEO on April 1, 2013
• Net sales grew 4% year-over-year, driven by 10% growth in Nutrition, the company’s largest segment (988M euros of 2,376M euros total in 1Q 2013)
• The 1Q 2013 growth in Nutrition was due mainly to high growth acquisitions of Fortitech and Ocean Nutrition• Nutrition segment EBITDA grew 12% to 215M euros of 311M euros total in 1Q2013
• Revenue grew 13.2% to 83.2M euros.• The Food & Beverage category was down 2.3% (46.7M euros vs. 47.8M euros) while the Nutrition & Health
category grew 32.7% (29.2M euros vs. 22.0M euros)– Strong growth in NATlife extracts (proven clinical benefits)
• The Americas are 40.2% of total business with growth of 20% in 1Q. Europe was 48.4% of total business, with growth of 10.2% in 1Q 2013
• Decas Botanical Synergies was acquired in September 2012.• In December 2012, Caravelle acquired a 15.4% stake in the company from Nutraceutical (Spain). Caravelle
is a diversified French business operating in pharma, mechanics, hotels, etc.• Moved further into developing markets with the purchase of Valentine (India) in April 2012. Valentine
produces fruit and vegetable powders and natural food colors
1Q 2013
1Q 2013

44
Update on top companies public market update
company
Public company updates - retailperiod updates
Source: Company websites, 10Q filings
1Q 2013• Fulfillment improvements have led to a 17% increase in shipments, including 271,000 new customers on
vitacost.com• Vitacost is pulling back Amazon sales to focus on vitacost.com and operational efficiencies• Adding 1,000 new SKUs and expanding on food offering• Biggest growth has been in food, sports nutrition, beauty, pet, household, etc. VMHS sales are up 12%• The focus is on private label products, sports nutrition, and non-GMO line as of April 2013• International – added local China and Brazil websites• Upgraded mobile e-commerce site and smart phone apps with new functionality
1Q 2013• Same-store sales grew 1.9% year-over-year for GNC company-owned stores. This was the 31st consecutive
quarter of same-store sales growth for the company • Revenues grew 6.5% year-over-year. The leap year and the timing of Easter both had negative impacts on sales
– Retail sales were up 5% - includes GNC.com and 14 new company stores since the end of 1Q 2012– Franchise revenue grew 6.3% with increased wholesale product sales and franchise income from the U.S.
and abroad– Manufacturing and wholesale grew 19.6%
• New Member Pricing program launched with regular discounts for Gold Card members rather than just the 1st week of the month. This will cost $.05 - $.06 per share in Q2 2013, but should be offset by better revenues and margins in the rest of the year
• In the 1st quarter of 2013, GNC opened 32 new domestic co-owned stores, 31 new international franchise stores, 9 new domestic franchise stores, and 9 new Rite Aid store-within-a-store units
• There was a big stock buyback of $61.3M and dividend in the 1st quarter of 2013. $14.7M was paid out in dividends in 1Q 2013, with $.15 per share expected in Q2
• Same-store sales grew 4.5% in the first quarter due to a combination of higher traffic and higher average ticket value ($9.6M contribution in 1Q2013). This was the 30th consecutive quarter of same-store sales growth
• E-commerce sales grew 16.7%• Vitamin Shoppe added 13 new U.S. stores, and also acquired 31 stores in the Pacific Northwest as part of the
acquisition of Super Supplements• Making “strategic investments” this year to position for growth• Took down the comp-store sales estimate after a soft April 2013• The first quarter saw strength in sports nutrition, specialty supplements and natural bath/beauty • The 2013 outlook for Vitamin Shoppe includes 50 new stores, capital expenditures of $45-$50M including the
construction of a new distribution center in Ashland, VA (opening summer 2013), and slight dilution due to the acquisition of Super Supplements
• Added a line of private label multivitamins and also doing well with sales of Mytrition multipacks (6 SKUs now and will expand to 10 SKUs in 4Q)
• Introducing natural sweeteners in stores• Increasing the availability of Health Enthusiasts for customer service online and over the phone• Continued website upgrades are driving strong growth
1Q 2013

45
Update on top companies public market update
company
Public company updates - mlmperiod updates
1Q 2013• First quarter 2013 was great despite issues, with revenue increasing 13% year-over-year• 18% increase in independent distributors across all regions – Herbalife now in 88 countries• $9.5M of legal and advisory expenses were incurred in 1Q related to the KPMG insider trading case • Herbalife also discontinued their relationship with KPMG given their involvement in the insider trading
debacle. They have hired PricewaterhouseCoopers as their new accounting firm and will have to re-audit the last 3 years of financials
• There was a $15.1M impact from the devaluation of the Venezuelan currency• Herbalife has had success with weight management and nutrition products:
– Expanding meal replacements– Success with the Express meal bar in the U.S. – to roll-out in other countries– Developing meal replacement soups– Expanding Nutrition 24 line to outer countries
• Investing in a Winston-Salem manufacturing facility, with construction to start in June 2013, as well as a botanical extract facility in China
• Have 600 local access points globally, expanding to 700 this year• Strong focus on customer insights• Bill Ackman called Herbalife a pyramid scheme in February 2013 and divulged a large short position
3Q of FY2013 (qtr ended 3/31/13)
• Sales grew 39% year-over-year to $50.4M• There are now 63,000 active LifeVantage distributors, up from 37,000 in March 2012• Recovering from a product recall that took place in December 2012 (a large-scale voluntary recall of
Protandim that took place due to metal bits being found in product)• The Protandim product recall caused an enhanced focus on quality control in manufacturing and sourcing• Engaged investment bank to secure a $30M-$40M credit facility, which is to be used for a share buyback• Built infrastructure in Japan in Q3, which added costs• LifeVantage has seen huge growth yet sees continued references to headwinds as a result of Protandim
recall in prior year• Focus going forward will be on gaining new distributors as opposed to preferred customers (who only buy for
themselves); new distributors accounted for 8 of 10 enrollments in Q3• Successful launch of canine health product in late January 2013
Source: Company websites, 10Q filings
1Q 2013• Net sales for the first quarter of 2013 were $41.7M, a decrease of 6.3% as compared to $44.5M in the first
quarter of 2012• Sales declined in North America by 8.9%; in Asia Pacific by 1.7%; and in Europe, the Middle East, and Africa
by 12.8%• The decline in North American sales was primarily due to the reduction in the average revenue per order• International sales were effected by fluctuations in foreign currency exchange rates• New independent associates in 1Q increased 17% year-over-year with 23,900 new associates and members
in 1Q. Total associates and members is approximately 231,000 as of March 2013

46
Update on top companies public market update
company
Public company updates - mlmperiod updates
Source: Company websites, 10Q filings
1Q 2013 • Total revenue for 1Q 2013 was $96.5M, compared with $92.9M in 1Q 2012, an increase of 3.9%• Sales of Synergy WorldWide increased 16.5% during 1Q 2013 compared to the same period a year ago• As of March 31, 2013, there were 18,200 total active managers and 341,200 total active distributors and
customers• The company incurred one-time expenses in the first quarter surrounding the resignation and severance of
the former CEO in March, as well as $1.5M investment in sales, marketing, and product development personnel meant to drive sales and profitability
• EBITDA declined 15.8% in the first quarter to $9.2M, while net income was down 32.7% to $4.9M
• Total sales grew 19% year-over-year to reach $550.1M • Regional growth:
– North Asia: 3.3% year-over-year growth to $188.2M sales– Greater China: 90% year-over-year growth to $175.7M sales– Americas: 15% year-over-year growth to 76.5M sales– South Asia Pacific: 13% year-over-year decline to $67.2M sales– EMEA: 3% year-over-year decline to $42.4M sales
• International revenue growth was negatively impacted by foreign currency fluctuations• The company increased full-year 2013 revenue guidance by $190 million to the $2.51 to $2.54 billion range• Operating margins decreased slightly in Q1, mainly due to planned brand-building efforts in China and Japan
as well as increased research and development costs• The ageLOC product platform is expected to be a primary growth driver for NuSkin for the near-term. This
fall, NuSkin will be launching the ageLOC weight management system• NuSkin is currently training and preparing the sales force for ageLOC weight management product launch,
which is expected to be the largest product launch in company history
1Q 2013
1Q 2013 • 1Q 2013 net sales increased 9.7% year-over-year to $169.1M• Net earnings increased 29.3%, while earnings per share increased 42.2% to $1.28• Favorable exchange rates contributed to sales growth, as did strong results in both the Asia Pacific and
North America/Europe regions:– Asia Pacific: 9.9% year-over-year growth to $104.9M in sales– North America/Europe: 9.4% year-over-year growth to $64.2M in sales

47
Update on top companies public market update
company
Public company updates - diversified*period updates
Source: Company websites, 10Q filings
1Q 2013
4 months ending 4/27/13
1Q 2013
* Companies not included in PCG Supplement Index (pages 48-50)
• 9% growth – 5% based on volume, 4% based on growth• U.S. Cheese & Global Nutritionals treated as one division – grew 14%
– Performance Nutrition, which falls within Global Nutritionals, was high point: double-digit growth (no specific figures cited). Performance Nutrition includes Optimum, BSN, ABB brands
– Performance Nutrition is undergoing a $45M plant capacity expansion in the U.S., which should be completed in 2Q:14
– Outlook very positive for Performance Nutrition despite whey costs near all-time highs• Ingredient Technologies and Consumer Products groups are under pressure
• Sales up 2.1% after negative FX, to 10.3B euros• Consumer health sales grew 2.3%, to 4.4B euros
– Consumer health up 3% to 1.9B euros. Consumer health divided into 3 components:• Consumer Care – 955M euros, up 7.8%; top consumer products are Aspirin, Bepanthen, Aleve,
Canesten, and Alka-Seltzer Plus. Consumer Care also includes Bayer’s vitamin/supplement brands
• Medical Care – 597M euros, down 3.6%• Animal Health – 327M euros, up 2.5%
– Pharmaceuticals up 1.9% to 2.6B euros– North America and Asia Pacific drove growth in consumer health category
1Q 2013• 40% of sales in the first quarter came from emerging markets; a key priority for the company• Sales were up 15% in emerging markets• 45% of Nutrition sales came from emerging markets with 1Q growth of 20% year-over-year• 19 new products were introduced in 1Q with 70 new products expected for the full year 2013• Adult nutrition grew 6% year-over-year led by Ensure and Glucerna• Nutrition sales of $1.699B in 1Q13
– U.S. sales grew 2.1% to $718M– International sales grew 14.2% to $981M– Pediatric sales were $987M of total nutrition sales ($608M international), while adult sales were $712M
($373M international) • Pediatric sales grew 13.2%, led by international• Adult sales grew 3.1%, led by international
• Pfizer repurchased $6.3B of stock in 2013 (through 4/30/13)• IPO of 19.8% interest in Zoetis (animal health)• Total revenue was down 9% in 1Q 2013, but consumer healthcare grew 12% and Zoetis grew 5%• Consumer healthcare growth was mainly driven by the Alacer acquisition, plus growth in Advil and Robitussin

48
0
2
4
6X
High
5.6X
Mean
1.6X
Median
1.3X
Low
0.1X
Update on top companies public market update
Sales multiple
PCG Supplement Index - Public Market Performance
Favorable trends led to strong public market performance across the industry.
0
5
10
15
20X
High
16.9X
Mean
9.0X
Median
8.9X
Low
2.8X
0
10
20
30
40
50X
High
40.4X
Mean
20.6X
Median
19.1X
Low
10.8X
-20
0
20
40
60%
16.7%11.8%
-12.2%
High
108.3%
Mean Median Low
Source: CapitalIQ.Constituents of PCG Supplement Index and individual company performance shown on following page.
ebitda multiple
p/e ratios 1-year revenue growth

49
Update on top companies public market update
PCG Supplement Index Companies – Recent Market Results
Source: CapitalIQ.Note: All companies listed here are included in the PCG Supplement Index on page 50.
Valuation Multiples of Publicly-Traded Comparable Companies($ in millions, except per share data)
Last Twelve Months EV / LTM Revenue GrowthSupplements Revenue EBITDA Revenue EBITDA 1-year 3-year
Atrium Innovations Inc. TSX:ATB $13.63 $427 $682 $447 $88 1.6x 7.9x 11.7x 7.2% 9.6%Nutraceutical International Corporation NasdaqGS:NUTR 19.50 189 219 206 37 1.1x 5.9x 11.5x 6.4% 5.9%Perrigo Company NasdaqGS:PRGO 117.03 11,005 12,097 3,404 818 3.6x 14.8x 25.7x 11.8% 16.4%
High 3.6x 14.8x 25.7x 11.8% 16.4%Median 1.6x 7.9x 11.7x 7.2% 9.6%Low 1.1x 5.9x 11.5x 6.4% 5.9%
Ingredients
Chr. Hansen Holding A/S CPSE:CHR $36.37 $4,657 $5,242 $941 $313 5.6x 16.9x 30.1x 8.3% 11.8%Koninklijke DSM N.V. ENXTAM:DSM 65.60 11,119 13,425 11,810 1,393 1.1x 9.5x 33.7x 1.2% 4.2%Naturex Société Anonyme ENXTPA:NRX 73.64 575 731 395 69 1.9x 10.8x 19.7x 18.2% 43.3%
High 5.6x 16.9x 33.7x 18.2% 43.3%Median 1.9x 10.8x 30.1x 8.3% 11.8%Low 1.1x 9.5x 19.7x 1.2% 4.2%
Retail
GNC Holdings Inc. NYSE:GNC $44.75 $4,400 $5,321 $2,470 $491 2.2x 10.8x 18.5x 12.8% 0.0%Vitacost.com, Inc. NasdaqGS:VITC $8.20 $276 $246 $345 ($9) 0.7x NM NM 23.0% 19.3%Vitamin Shoppe, Inc. NYSE:VSI $44.44 $1,330 $1,299 $982 $130 1.3x 10.0x 21.2x 10.6% 12.3%
High 2.2x 10.8x 21.2x 23.0% 19.3%Median 1.3x 10.4x 19.8x 12.8% 12.3%Low 0.7x 10.0x 18.5x 10.6% 0.0%
MLM
Herbalife Ltd. NYSE:HLF 46.59 4,797 5,051 4,232 753 1.2x 6.7x 10.9x 16.8% 20.5%Lifevantage Corporation NasdaqCM:LFVN 2.35 267 240 201 26 1.2x 9.2x 23.7x 108.3% 185.3%Mannatech, Incorporated NasdaqGS:MTEX 10.00 26 13 171 5 0.1x 2.8x 40.4x (12.2%) (15.2%)Nature's Sunshine Products Inc. NasdaqCM:NATR 15.40 244 164 371 37 0.4x 4.4x 10.8x 0.9% 2.4%Nu Skin Enterprises Inc. NYSE:NUS 58.56 3,421 3,282 2,258 384 1.5x 8.5x 15.9x 24.7% 17.3%USANA Health Sciences Inc. NYSE:USNA 69.45 936 865 664 113 1.3x 7.7x 14.4x 12.0% 13.1%
High 1.5x 9.2x 40.4x 108.3% 185.3%Mean 0.9x 6.6x 19.3x 25.1% 37.2%Median 1.2x 7.2x 15.1x 14.4% 15.2%Low 0.1x 2.8x 10.8x (12.2%) (15.2%)
Ticker Enterprise Value PE RatioShare Price5/29/13 Market Cap

50
-30.00%
-10.00%
10.00%
30.00%
50.00%
70.00%
PCG Supplement Index S&P 500 Index (^SPX) - Index Value NASDAQ Composite Index (^COMP) - Index Value
Update on top companies public market update
Relative Stock Price Performance: Supplement Index
The PCG Supplement Index has increased ~55% since 2011, while the overall market increased by ~30%.
% Growth
Source: CapitalIQ. Market cap-weighted index. Please see page 49 for companies included in the PCG Supplement Index.

Supplement Industry Overview
2012 SPINS Retail Sales Update
Transaction News and Review
Implications for Growth
Update on Top Companies
Appendix
1
3
4
2
5
6

52
Appendix partnership capital growth overview
About us
Partnership Capital Growth is a leading investment bank exclusively focused on consumer-oriented companies in the areas of healthy, active and sustainable living.
Representative transactions
45 87.5% 60% $2.2B
TransactionsSince 2006
2012 CloseRate
% M&ADeals
Total Transaction Enterprise Value
Acquisition ofAcquired by
Recapitalization by
Investment by
Acquired by Investment by
• What We Do: We raise capital for and sell middle-market consumer businesses
• Core Values: PCG’s foundation is built on guiding principles of integrity, trust, respect, excellence and balance
• Mission: Deliver superior returns for our clients and their stakeholders through our value-added approach
• Results: An industry-leading close rate of ~80% over the last 7 years at superior relative valuations. Former clients remain our best advocates and referral sources

53
Appendix partnership capital growth overview
PCG Sports Nutrition & Nutritional Supplement (VMHS) Experience
Excluding current clients, the PCG team has been involved in transactions with well over a dozen dietary supplement and sports nutrition companies.
Acquired by Acquired by Acquired by Acquired by Investment by
Unannounced Weight
Management Co.
Recapitalizationby
Private Equity Investor
December 2012 April 2011 June 2010December 2011 August 2010May 2011
Investment by Investment by Investment by Investment by
July 2006June 2007May 2009 January 2008
Pre-PCG experience based on partners’ activities at North Castle Partners and William Blair.
PCG experience Pre-PCG experience

54
Appendix nbj/new hope 360 overview
NewHope360 is the premiere digital marketplace that connects the healthy lifestyle industry from supply to shelf.
For Suppliers and Manufacturers: We connect you to your next customer, and provide you with the sourcing, market research, standards and legislative information you need to develop a trusted consumer product.
For Retailers: We provide the trends, operation tactics, products, and consumer concerns that give you the insight you need to grow your store.
Marc Brush
Nutrition Business Journal
Editor in Chief
Carlotta Mast
New Hope 360
Editor in Chief
Nutrition Business Journal and NewHope360.com are brought to you by New Hope Natural Media, a division of Penton Media, Inc. For more than 25 years, New Hope Natural Media has been the leading media resource and information provider for the natural, organic and healthy-lifestyle products industry. Our publications, events, e-business products and services deliver industry information and provide community-building forums that connect you to your next customer. In print, we offer the best consumer and trade publications, respected for their high quality of content; in person, the largest natural, organic and healthy-lifestyle products trade shows; and online, the leading-edge consumer and trade websites in the natural products industry.
Nutrition Business Journal is a research, publishing and consulting company serving the nutrition, natural products and alternative health care industries. Nutrition and natural products include, but are not limited to, dietary supplements, herbs/botanicals, vitamins/minerals, natural/organic foods and natural personal care. Alternative health care embraces services related to insurance, HMOs, investment and alternative therapies (e.g. chiropractic, acupuncture, naturopathy).
NBJ is a monthly executive journal focusing primarily on the nutrition industry. NBJ also addresses how this industry impacts the larger food, pharmaceutical and health care industries. Each issue discusses business activities, market size/growth, trends, and opportunities in the nutrition industry, which NBJ defines as dietary supplements, herbs, natural foods, and natural personal care products

55
Appendix spins overview
Mary Ellen Lynch
SPINS
Director of Consumer Insights and Strategic Partnerships
Kerry Watson
SPINS
Manager, SPINS Product Library
Since 1995, we have provided market measurement information and specialized insights into the trends that are top of mindfor health and wellness consumers. As a passionate advocate for the natural and specialty products industry, we support thesuccess of our retail and manufacturer partners and are invested in connecting them with their consumers and helping themto understand the dynamics and opportunities within the sector. Our comprehensive offerings include retail measurementservices, consumer information and advanced analytics for the natural, specialty and conventional retail channels.
Our alliances and partnerships with key industry leaders and retail partners, as well as our extensive product content codingare at the core of our business and what make our services go unmatched.
• Exclusive natural and specialty channel and retailer reporting
• Unparalleled insights into trends thanks to our extensive product coding capturing the attributes underlying consumers’ purchasing decisions
The Natural and Specialty Product Industry’s Premier Information Provider
Public company updates - spins

56
Partnership capital growth
THANK YOU
Brent Knudsen Janica LaneBrian SmithManaging Partner & Founder
(415) 705-8001
Partner
Vitamins/Supplements
(415) 705-8011
Partner
Sports Nutrition/Weight Loss
(415) 705-8002
Chris SpahrPartner
Retail
(415) 705-5276
Eric SchillerPrincipal
(415) 705-8010
Mary Elisabeth PlowdenPrincipal
(415) 705-7879
THIS PRESENTATION IS FOR INFORMATIONAL PURPOSES ONLY. THE INFORMATION CONTAINED IN THIS PRESENTATION IS CONFIDENTIAL. ANY REPRODUCTION OR DISTRIBUTION OF SUCH INFORMATION, IN WHOLE OR IN PART, OR THE DISCLOSURE THEREOF TO ANY OTHER
PARTY WITHOUT PRIOR WRITTEN CONSENT IN EACH INSTANCE IS PROHIBITED.