pcachem-eng.utoronto.ca/~datamining/presentations/pca.pdfpca principal component analysis dr. saed...
TRANSCRIPT

PCAPrincipal Component Analysis
Dr. Saed SayadUniversity of Toronto
2010
1http://chem-eng.utoronto.ca/~datamining/

Basic Statistics
2http://chem-eng.utoronto.ca/~datamining/

Statistics - Example
X SumX Count Average X-Xbar (X-Xbar)^2 Sxx Variance SD
0 40 4 10 -10 100 208 69.33 8.33
8 -2 4
12 2 4
20 10 100
Y SumY Count Average Y-Ybar (Y-Ybar)^2 Syy Variance SD
8 40 4 10 -2 4 10 3.33 1.83
9 -1 1
11 1 1
12 2 4
X Y Count X-Xbar Y-Ybar (X-Xbar)(Y-Ybar) Sxy CoVariance
0 8 4 -10 -2 20 44 14.67
8 9 -2 -1 2
12 11 2 1 2
20 12 10 2 20
3http://chem-eng.utoronto.ca/~datamining/

Covariance Matrix
4http://chem-eng.utoronto.ca/~datamining/
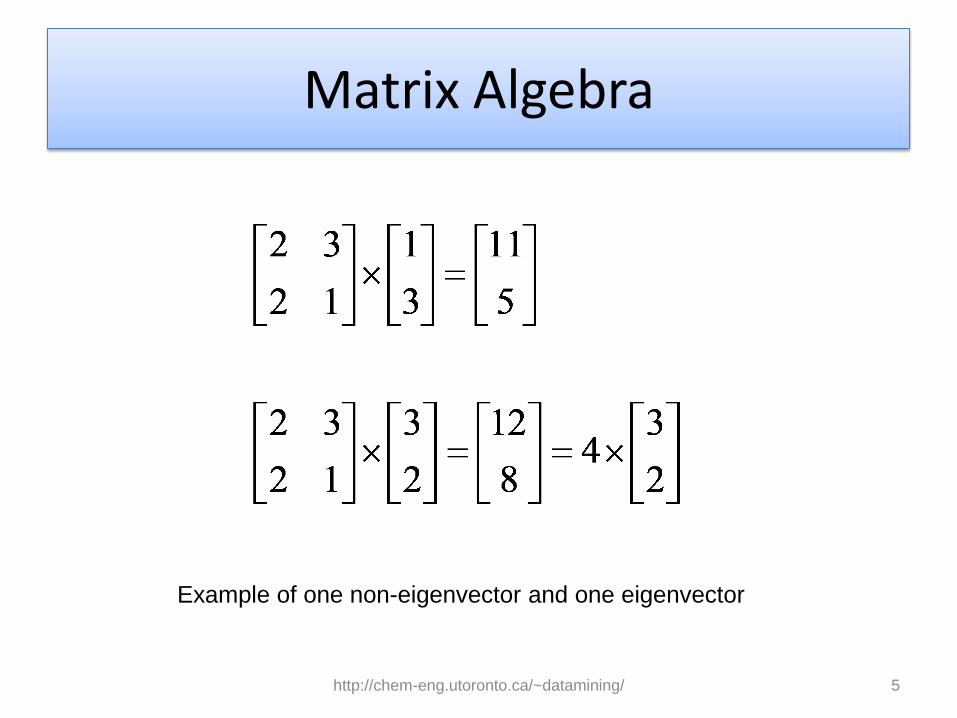
Matrix Algebra
Example of one non-eigenvector and one eigenvector
5http://chem-eng.utoronto.ca/~datamining/
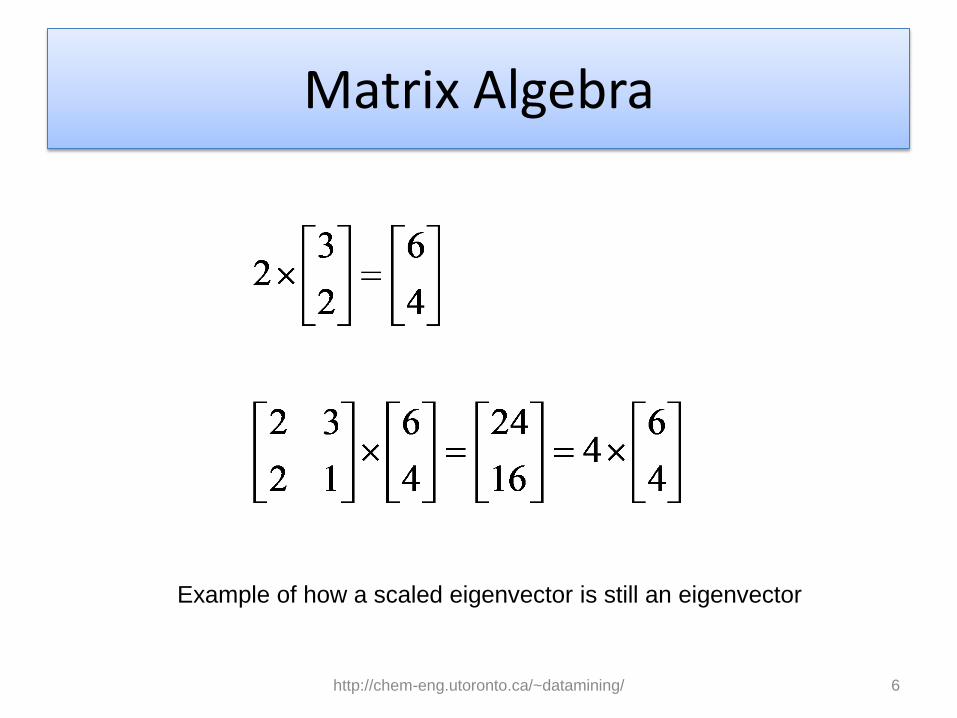
Matrix Algebra
Example of how a scaled eigenvector is still an eigenvector
6http://chem-eng.utoronto.ca/~datamining/

Eigenvectors Properties
• Eigenvectors can only be found for square matrices and not every square matrix has eigenvectors.
• Given an n x n matrix that does have eigenvectors, there are n of them.
• Another property of eigenvectors is that even if we scale the vector by some amount before we multiply it, we still get the same multiple of it as a result. This is because if you scale a vector by some amount, all you are doing is making it longer not changing it’s direction.
• Lastly, all the eigenvectors of a matrix are perpendicular. it means that you can express the data in terms of these perpendicular eigenvectors, instead of expressing them in terms of the x and y axes.
7http://chem-eng.utoronto.ca/~datamining/

Standardized Eigenvectors
• We like to find the eigenvectors whose length is exactly one.
• This is because, the length of a vector doesn’t affect whether it’s an eigenvector or not, whereas the direction does.
• So, in order to keep eigenvectors standard, whenever we find an eigenvector we usually scale it to make it have a length of 1, so that all eigenvectors have the same length.
8http://chem-eng.utoronto.ca/~datamining/

Standardized Eigenvectors
Eigenvector
Vector Length
Eigenvector with length of one
9http://chem-eng.utoronto.ca/~datamining/

Eigenvalues
• Eigenvalues is the amount by which the original vector was scaled after multiplication by the square matrix.
• 4 is the eigenvalue associated with that eigenvector in the example.
• No matter what multiple of the eigenvector we took before we multiplied it by the square matrix, we would always get 4 times the scaled vector.
• Eigenvectors and Eigenvalues always come in pairs.
10http://chem-eng.utoronto.ca/~datamining/

PCA
• PCA is a way of identifying patterns in data, and expressing the data in such a way as to highlight their similarities and differences.
• Since patterns in data can be hard to find in data of high dimension, where the luxury of graphical representation is not available, PCA is a powerful tool for analysing data.
• The other main advantage of PCA is that once you have found these patterns in the data, and you compress the data, ie. by reducing the number of dimensions, without much loss of information. This technique used in image compression.
11http://chem-eng.utoronto.ca/~datamining/

PCA – Original and Adjusted Data
Original Data Original Data - Average
12http://chem-eng.utoronto.ca/~datamining/

PCA – Original Data plot
13http://chem-eng.utoronto.ca/~datamining/

Calculate Covariance Matrix
14http://chem-eng.utoronto.ca/~datamining/

Calculate Eigenvectors and Eigenvalues from Covariance Matrix
15http://chem-eng.utoronto.ca/~datamining/

Eigenvectors Plot
16http://chem-eng.utoronto.ca/~datamining/

Choosing components and forming a Feature Vector
• The eigenvector with the highest eigenvalue is the principle component of the data set. It is the most significant relationship between the data dimensions.
• In general, once eigenvectors are found from the covariance matrix, the next step is to order them by eigenvalue, highest to lowest. This gives us the components in order of significance.
• Now, if we like, we can decide to ignore the components of lesser significance. We do lose some information, but if the eigenvalues are small, we don’t lose much.
• If we leave out some components, the final data set will have less dimensions than the original.
17http://chem-eng.utoronto.ca/~datamining/
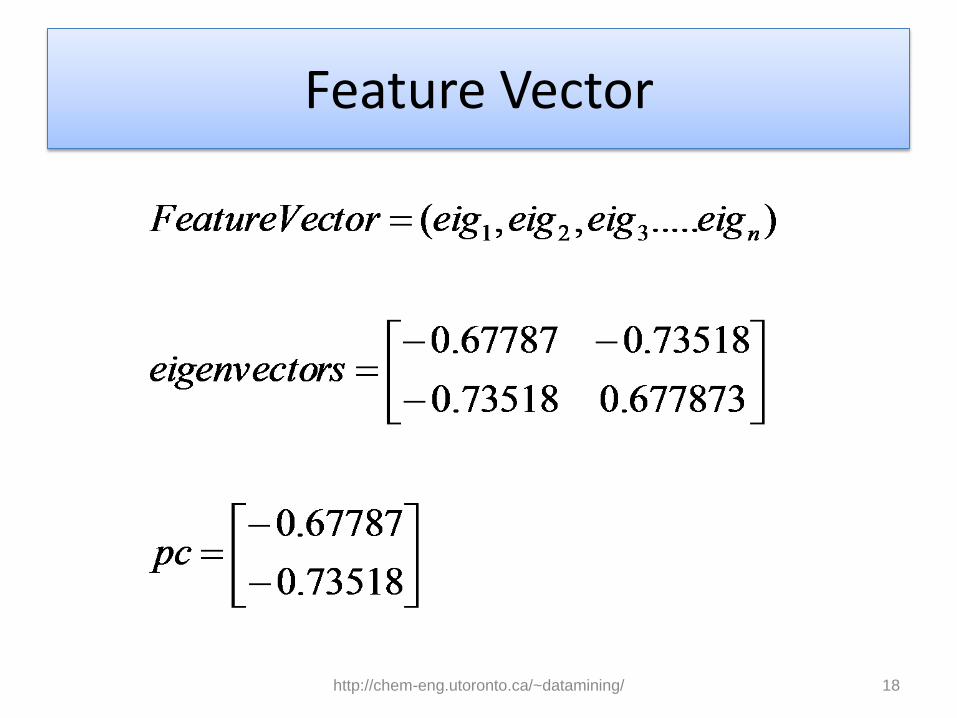
Feature Vector
18http://chem-eng.utoronto.ca/~datamining/
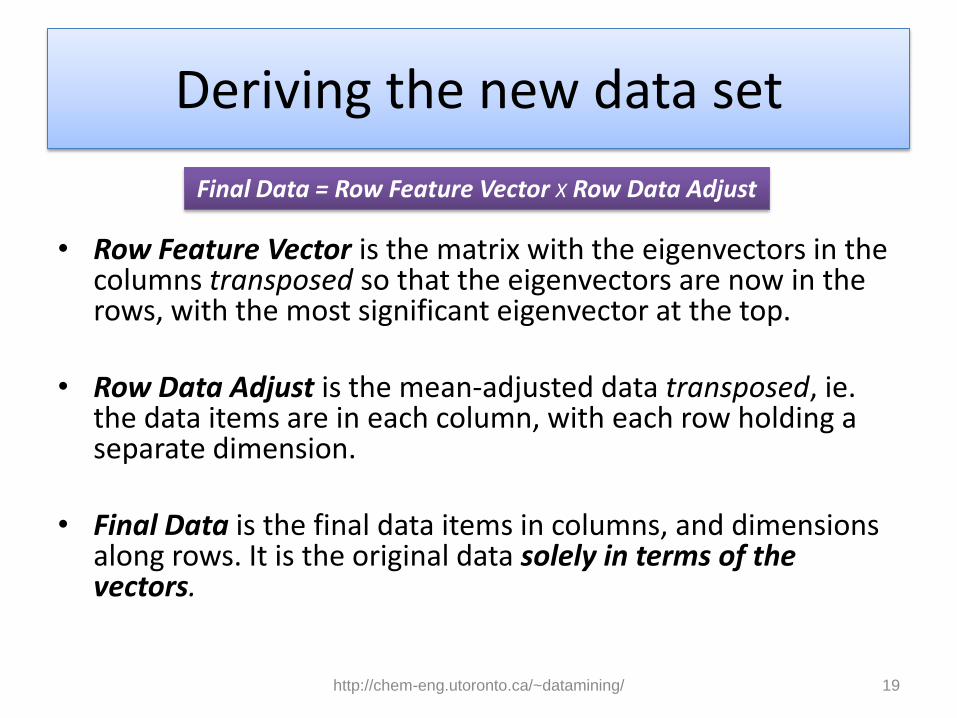
Deriving the new data set
• Row Feature Vector is the matrix with the eigenvectors in the columns transposed so that the eigenvectors are now in the rows, with the most significant eigenvector at the top.
• Row Data Adjust is the mean-adjusted data transposed, ie. the data items are in each column, with each row holding a separate dimension.
• Final Data is the final data items in columns, and dimensions along rows. It is the original data solely in terms of the vectors.
Final Data = Row Feature Vector X Row Data Adjust
19http://chem-eng.utoronto.ca/~datamining/

Deriving the new data set Two Eigenvectors
20http://chem-eng.utoronto.ca/~datamining/

Get the original data back
Row Data Adjust = Row Feature Vector T X Final Data
Row Original Data = (Row Feature Vector T X Final Data) + Original Mean
21http://chem-eng.utoronto.ca/~datamining/

Principal Component Regression
PCA + MLR
22http://chem-eng.utoronto.ca/~datamining/

PCR
• T is a matrix of SCORES• X is a DATA matrix• P is a matrix of LOADNIGS• Y is a dependent variable vector• B is the regression coefficients vector
http://chem-
eng.utoronto.ca/~datamining/23
YTT)T(B
ETBY
TPX
1-
PCR
• In PCR the X matrix is replaced by the T matrix which has less and orthogonal variables.
• There will be no issue with inversion of the T’T matrix (unlike MLR) because of orthogonal scores.
• PCR also resolves the issue of colinearity which could in return reduce the prediction error.
• There is no guarantee to have a PCR model that works better than an MLR model using the same dataset.
http://chem-
eng.utoronto.ca/~datamining/24
Reference
• www.cs.otago.ac.nz/cosc453/student_tutorials/principal_components.pdf
http://chem-eng.utoronto.ca/~datamining/ 25

Questions?
26http://chem-eng.utoronto.ca/~datamining/