data exploration - chemical...
TRANSCRIPT
Data Exploration
Dr. Saed SayadUniversity of Toronto
2010
1http://chem-eng.utoronto.ca/~datamining/
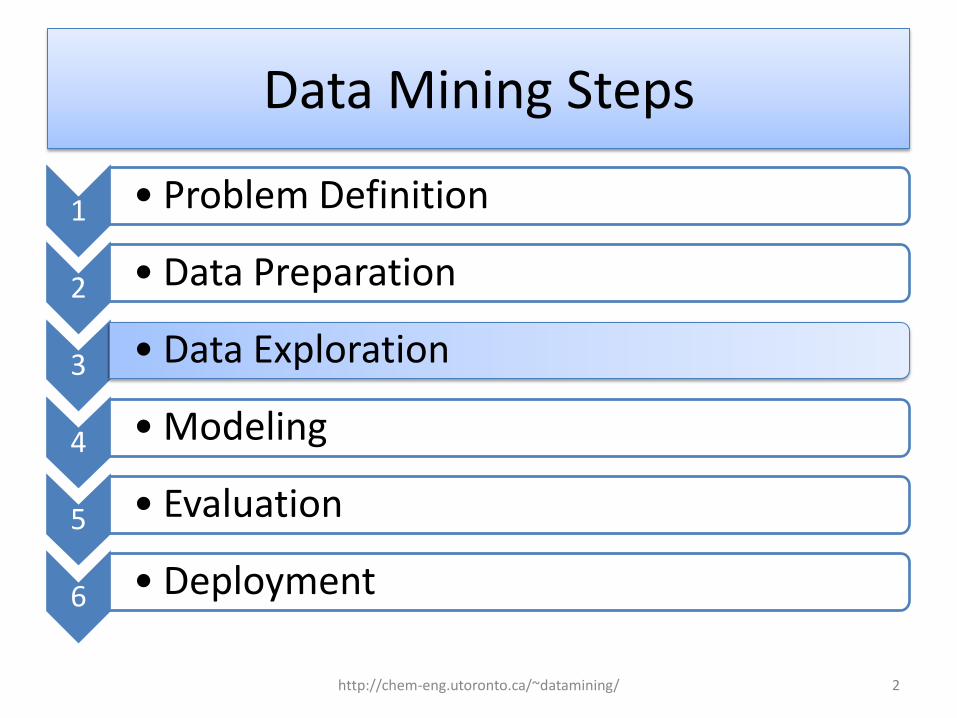
Data Mining Steps
1 • Problem Definition
2 • Data Preparation
3 • Data Exploration
4 • Modeling
5 • Evaluation
6 • Deployment
http://chem-eng.utoronto.ca/~datamining/ 2
1. Problem Definition
http://chem-eng.utoronto.ca/~datamining/ 3
Understanding the project objectives and requirements from a business perspective, converting this knowledge into a data mining problem definition, and a preliminary plan designed to achieve the objectives.
Source: http://www.crisp-dm.org/Process/index.htm
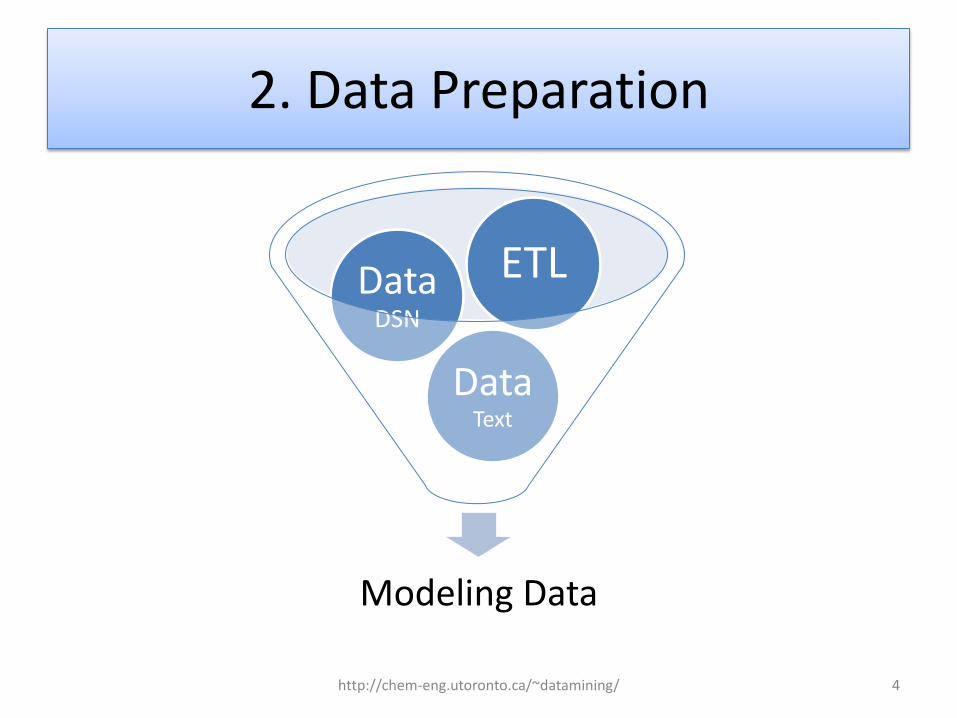
2. Data Preparation
Modeling Data
DataText
Data DSN
ETL
http://chem-eng.utoronto.ca/~datamining/ 4
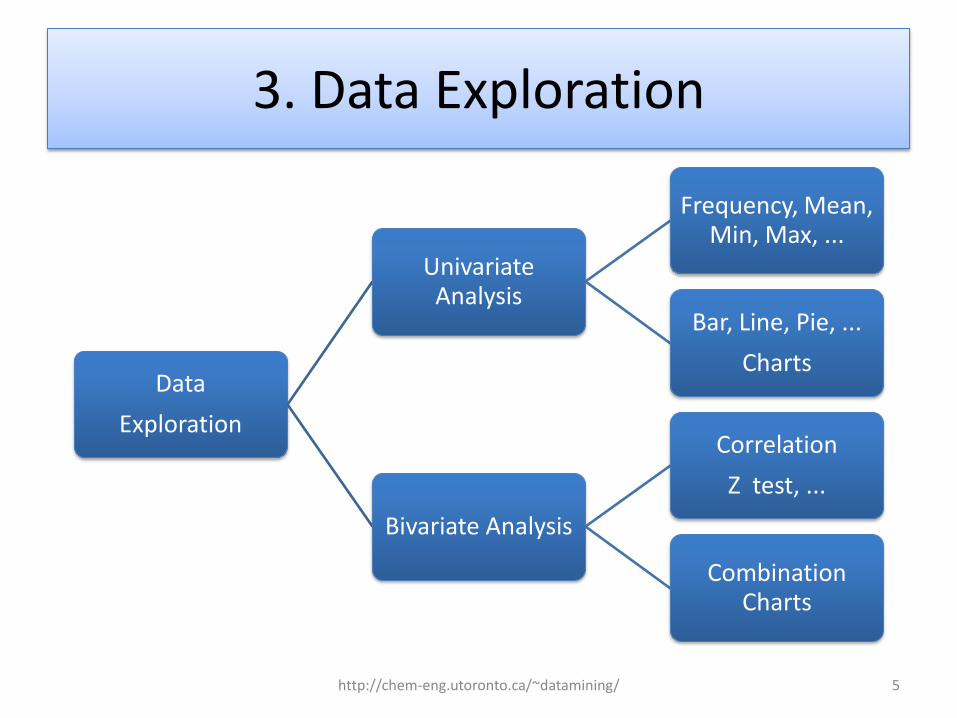
3. Data Exploration
http://chem-eng.utoronto.ca/~datamining/ 5
Data
Exploration
Univariate Analysis
Frequency, Mean, Min, Max, ...
Bar, Line, Pie, ...
Charts
Bivariate Analysis
Correlation
Z test, ...
Combination Charts
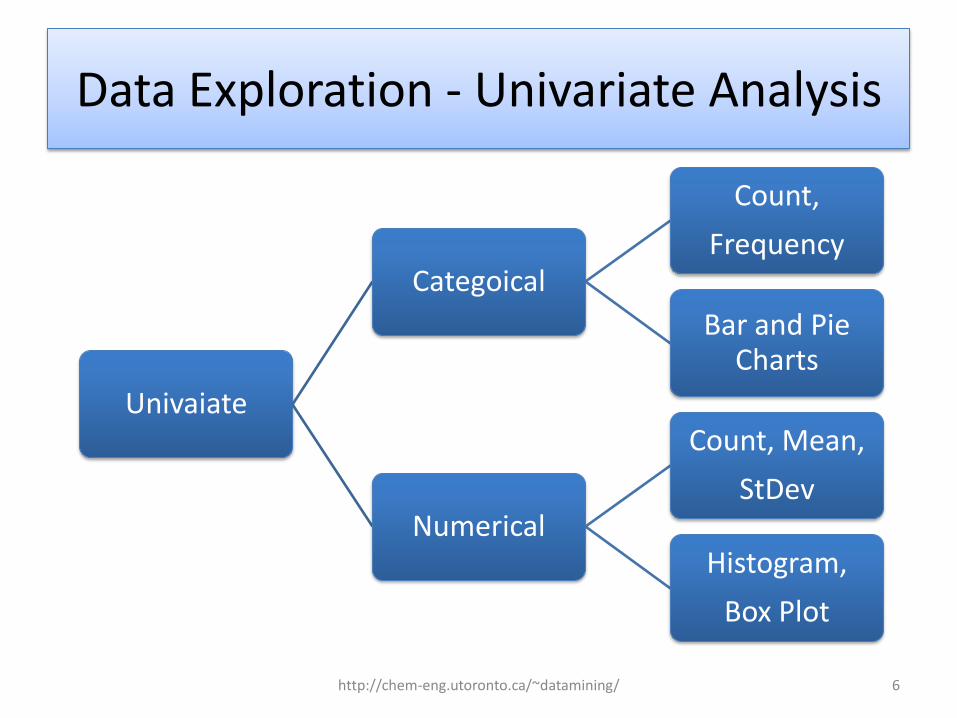
Data Exploration - Univariate Analysis
Univaiate
Categoical
Count,
Frequency
Bar and Pie Charts
Numerical
Count, Mean,
StDev
Histogram,
Box Plot
6http://chem-eng.utoronto.ca/~datamining/
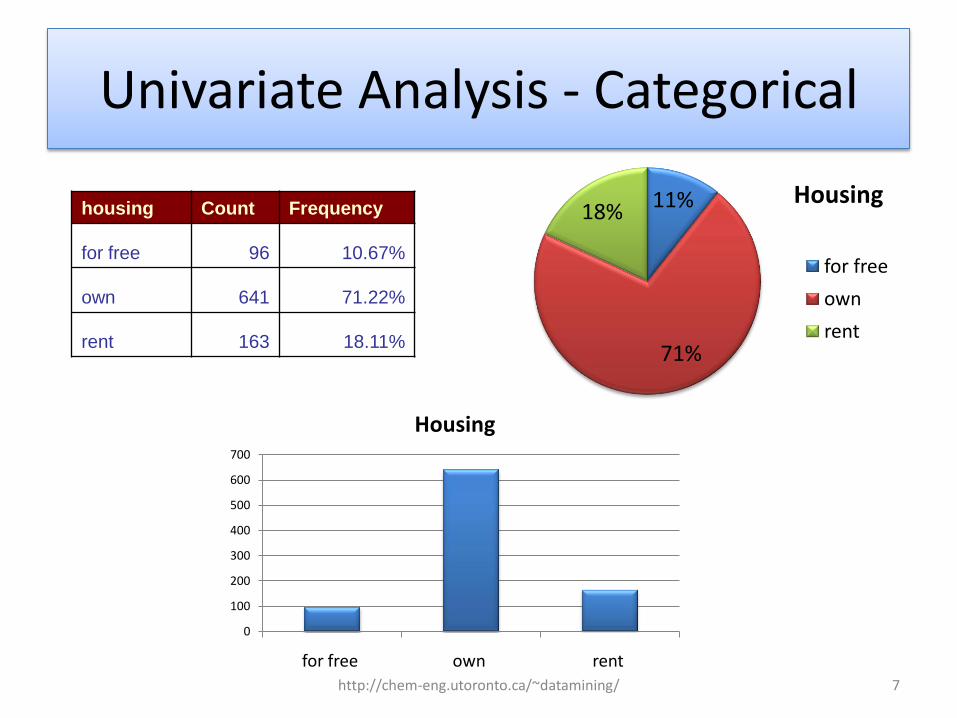
Univariate Analysis - Categorical
http://chem-eng.utoronto.ca/~datamining/ 7
11%
71%
18%Housing
for free
own
rent
housing Count Frequency
for free 96 10.67%
own 641 71.22%
rent 163 18.11%
0
100
200
300
400
500
600
700
for free own rent
Housing
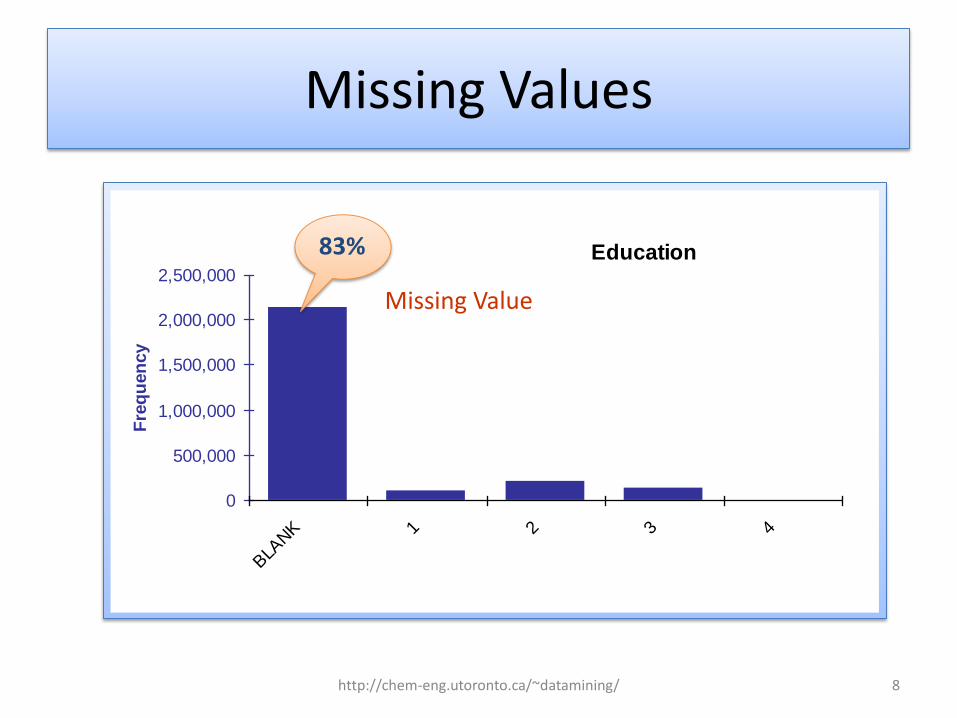
Missing Values
http://chem-eng.utoronto.ca/~datamining/ 8
Education
0
500,000
1,000,000
1,500,000
2,000,000
2,500,000
BLA
NK 1 2 3 4
Fre
qu
en
cy
83%
Missing Value
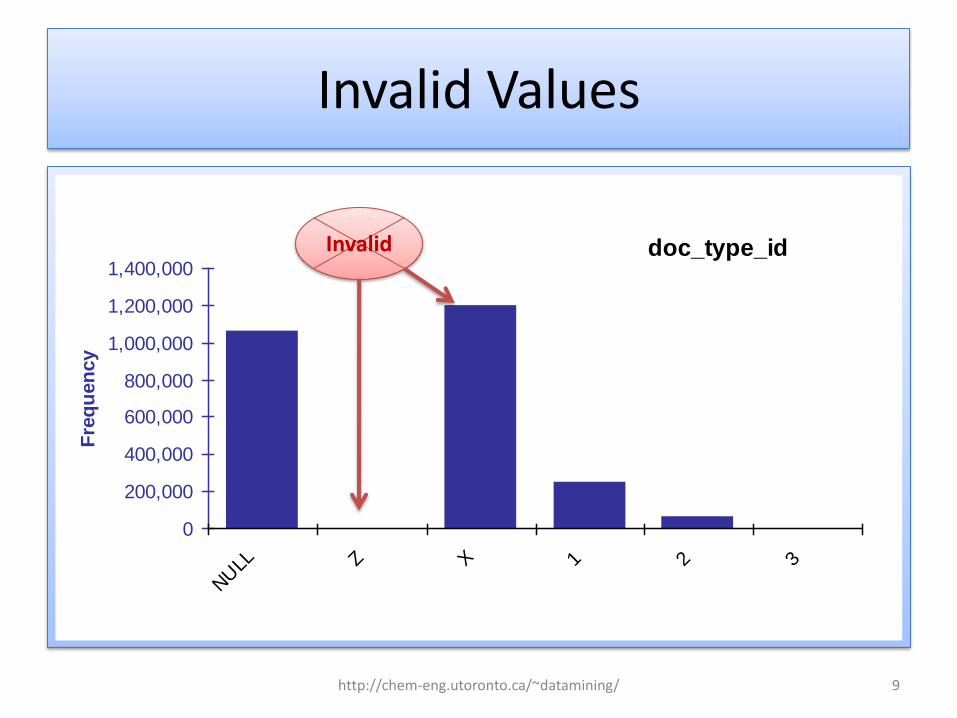
Invalid Values
http://chem-eng.utoronto.ca/~datamining/ 9
doc_type_id
0
200,000
400,000
600,000
800,000
1,000,000
1,200,000
1,400,000
NULL Z X 1 2 3
Fre
qu
en
cy
Invalid
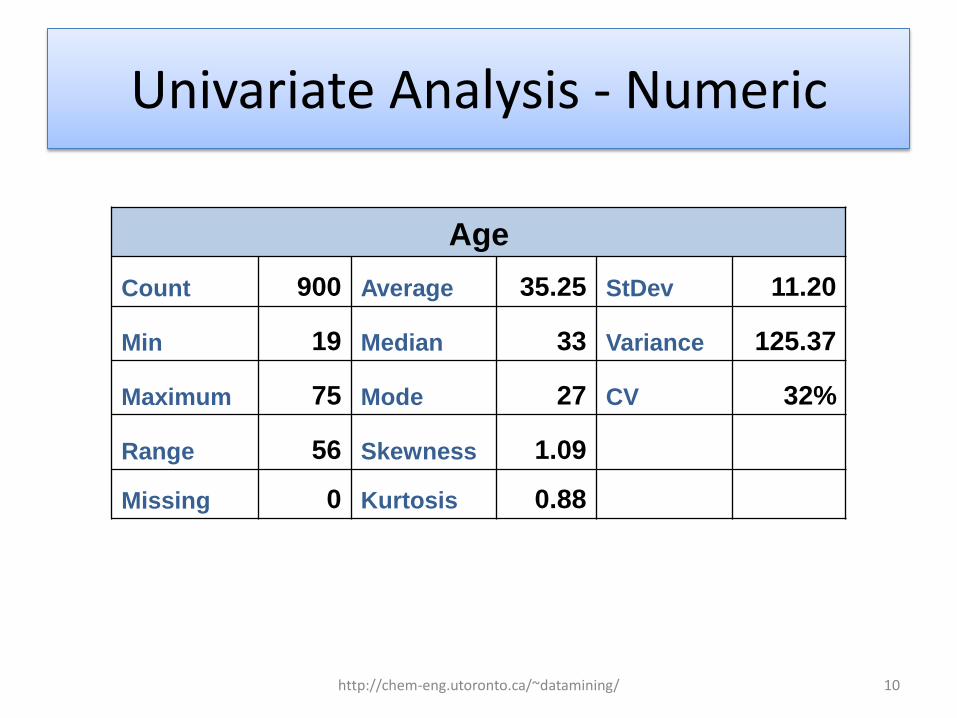
Univariate Analysis - Numeric
http://chem-eng.utoronto.ca/~datamining/ 10
Age
Count 900 Average 35.25 StDev 11.20
Min 19 Median 33 Variance 125.37
Maximum 75 Mode 27 CV 32%
Range 56 Skewness 1.09
Missing 0 Kurtosis 0.88
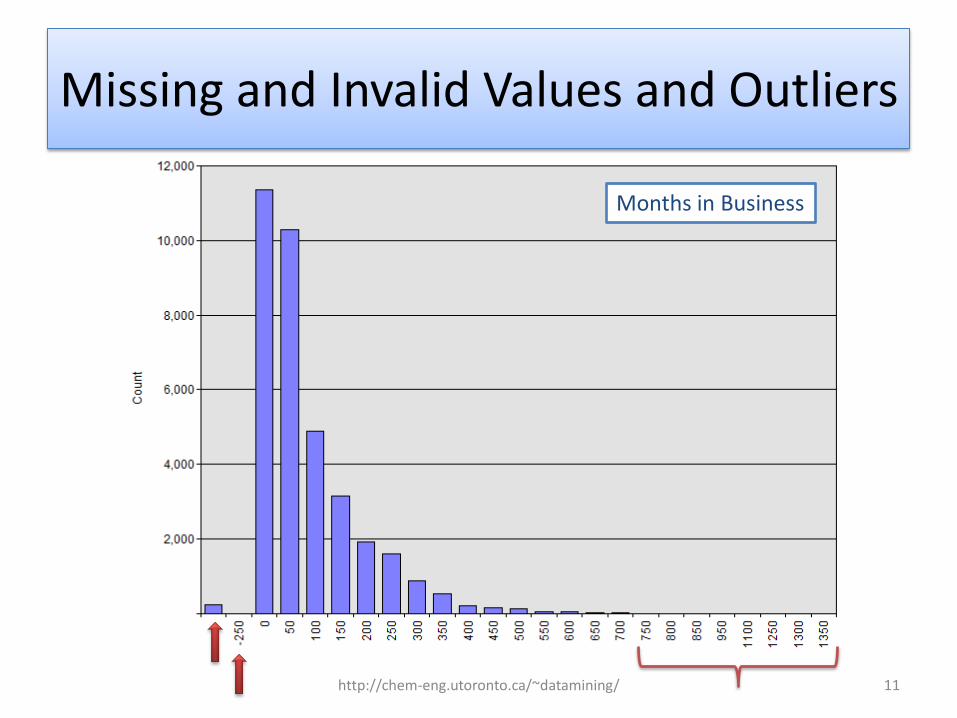
Missing and Invalid Values and Outliers
11http://chem-eng.utoronto.ca/~datamining/
Months in Business
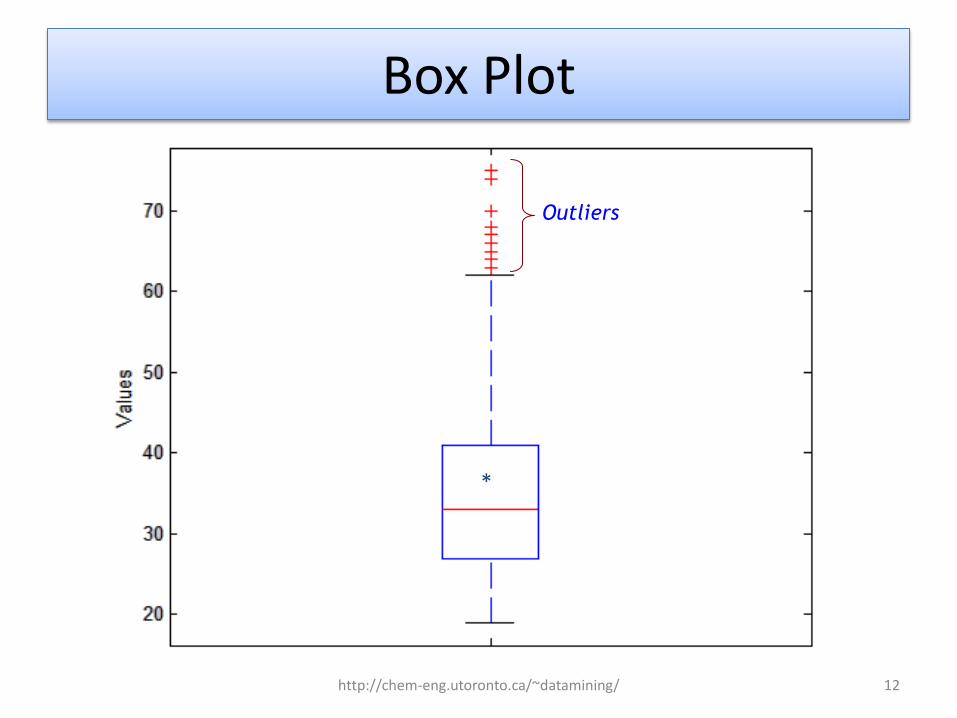
Box Plot
http://chem-eng.utoronto.ca/~datamining/ 12
Outliers
*
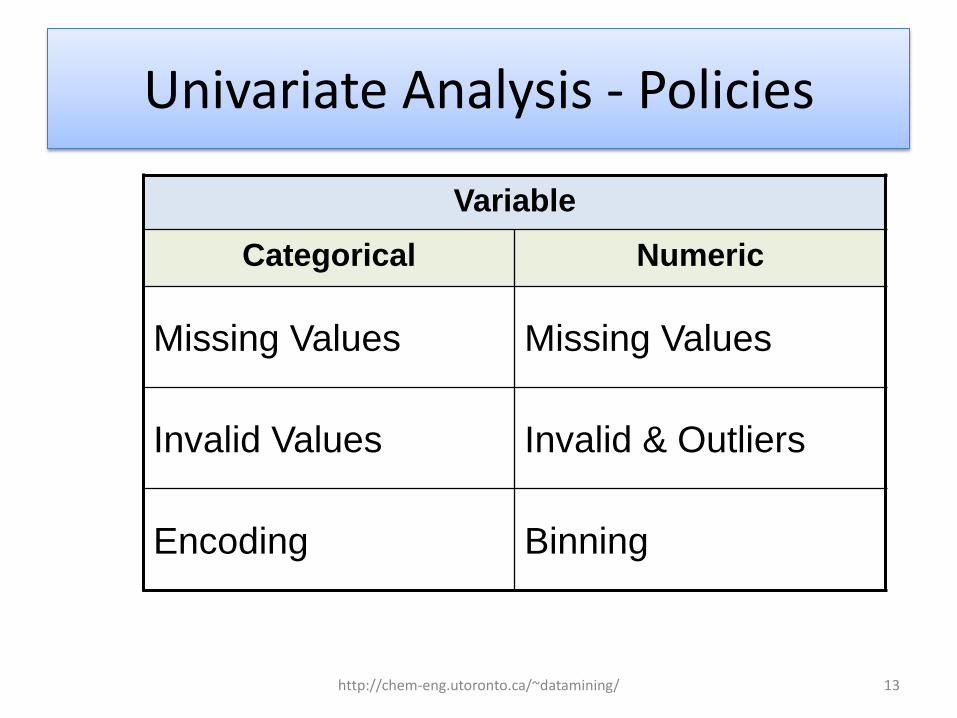
Univariate Analysis - Policies
http://chem-eng.utoronto.ca/~datamining/ 13
Variable
Categorical Numeric
Missing Values Missing Values
Invalid Values Invalid & Outliers
Encoding Binning
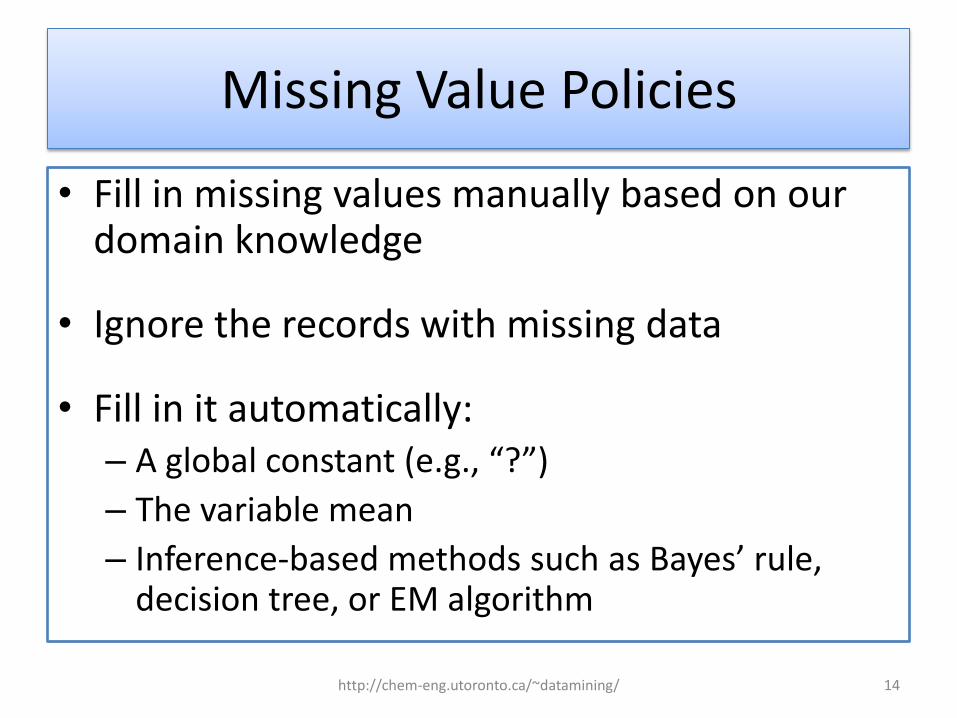
Missing Value Policies
• Fill in missing values manually based on our domain knowledge
• Ignore the records with missing data
• Fill in it automatically:– A global constant (e.g., “?”)
– The variable mean
– Inference-based methods such as Bayes’ rule, decision tree, or EM algorithm
http://chem-eng.utoronto.ca/~datamining/ 14
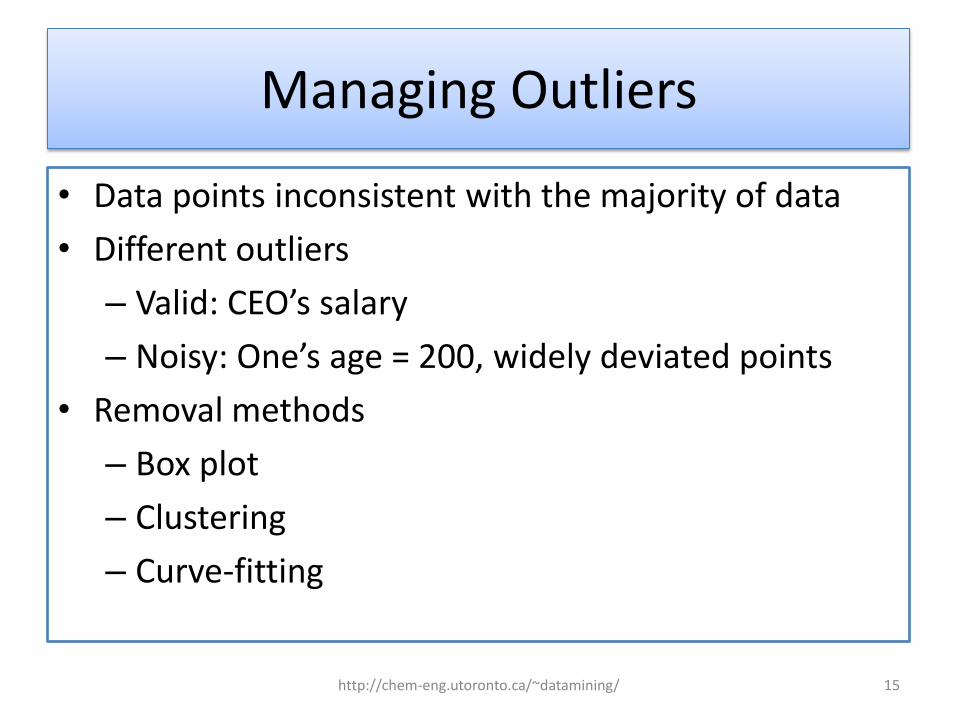
Managing Outliers
• Data points inconsistent with the majority of data
• Different outliers
– Valid: CEO’s salary
– Noisy: One’s age = 200, widely deviated points
• Removal methods
– Box plot
– Clustering
– Curve-fitting
http://chem-eng.utoronto.ca/~datamining/ 15
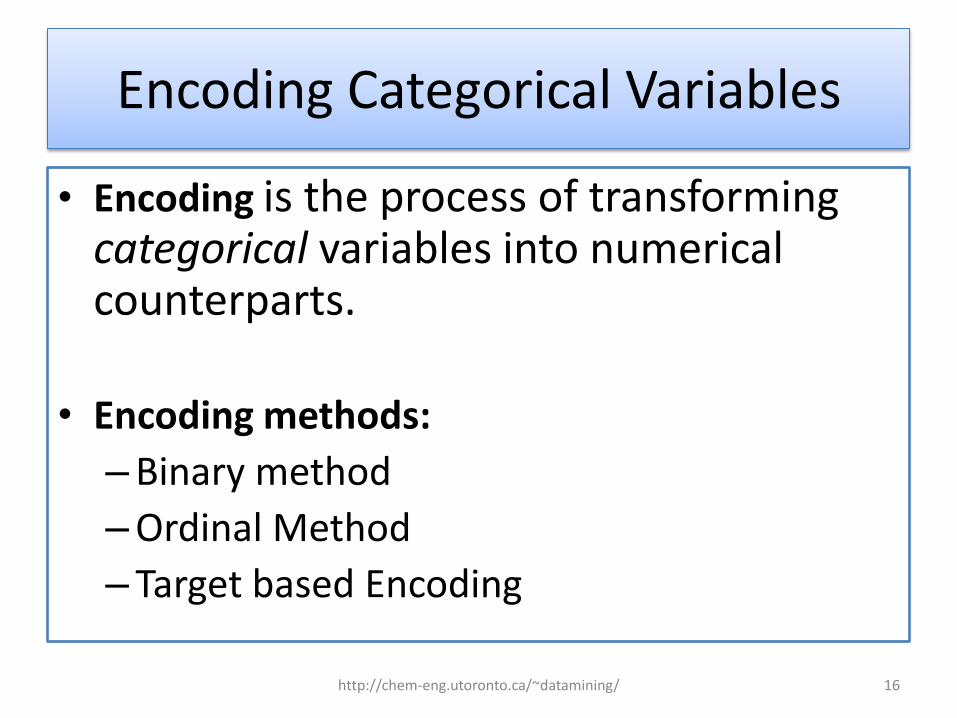
Encoding Categorical Variables
• Encoding is the process of transforming categorical variables into numerical counterparts.
• Encoding methods:
–Binary method
–Ordinal Method
– Target based Encoding
http://chem-eng.utoronto.ca/~datamining/ 16
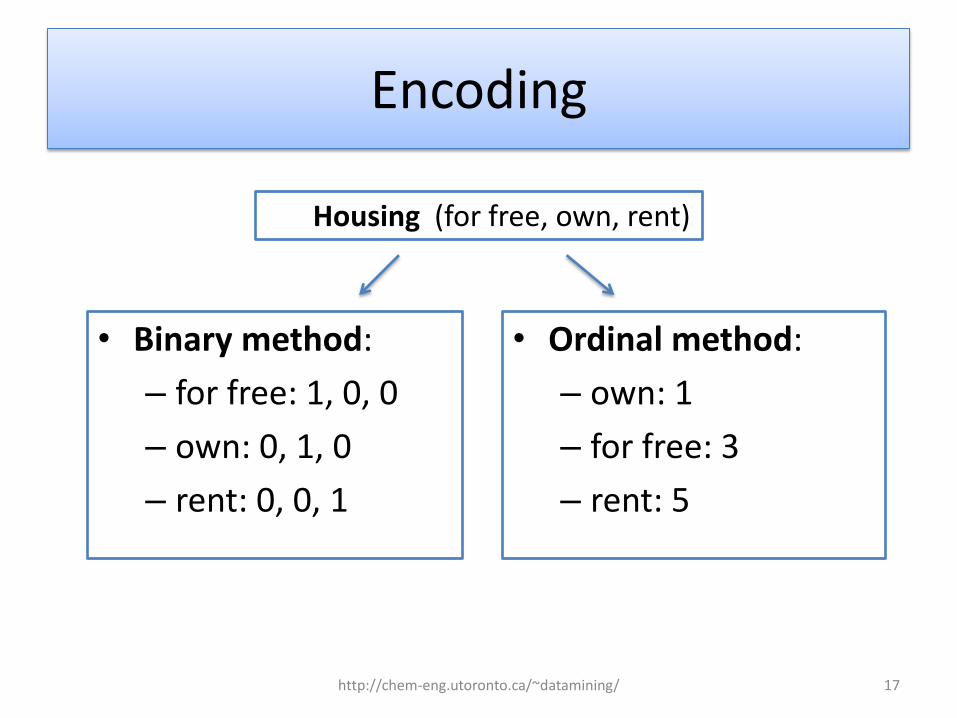
Encoding
• Binary method:
– for free: 1, 0, 0
– own: 0, 1, 0
– rent: 0, 0, 1
http://chem-eng.utoronto.ca/~datamining/ 17
• Ordinal method:
– own: 1
– for free: 3
– rent: 5
Housing (for free, own, rent)
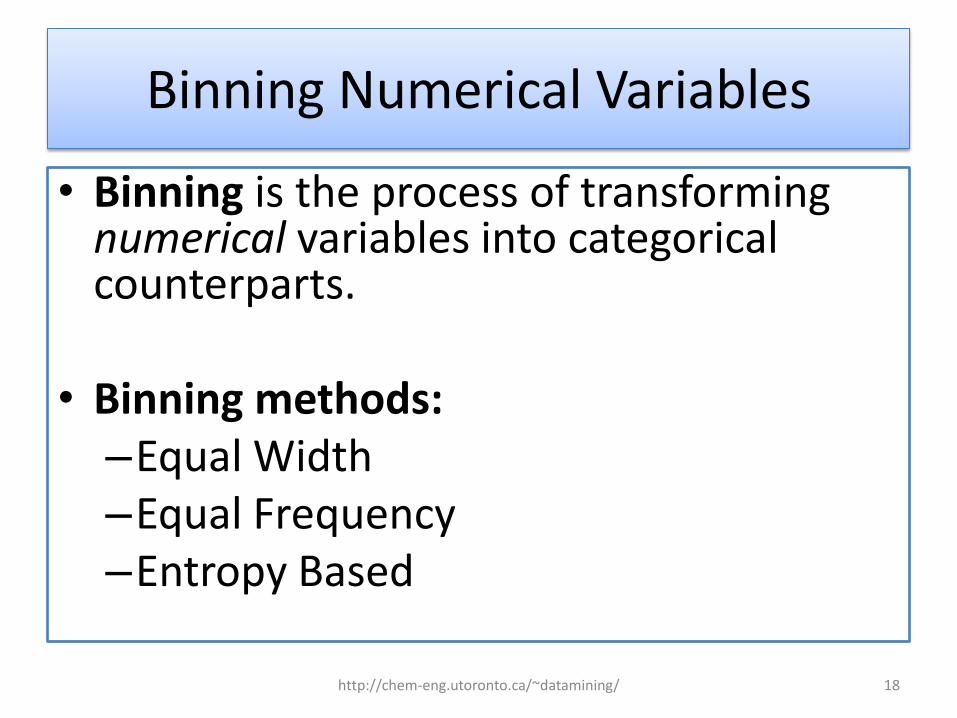
Binning Numerical Variables
• Binning is the process of transforming numerical variables into categorical counterparts.
• Binning methods:–Equal Width–Equal Frequency–Entropy Based
http://chem-eng.utoronto.ca/~datamining/ 18
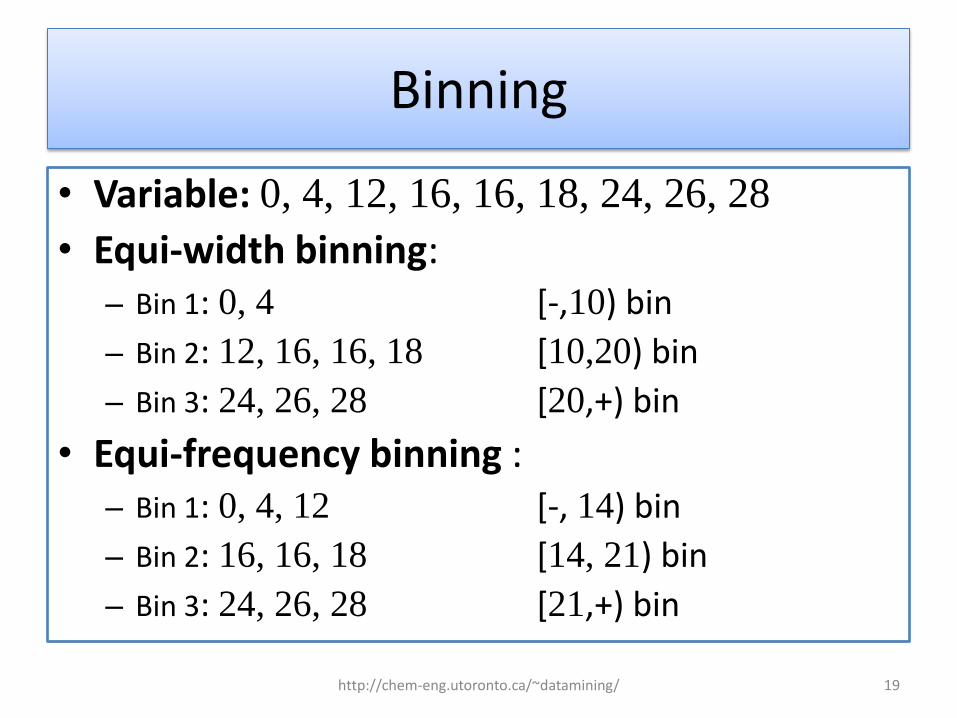
Binning
• Variable: 0, 4, 12, 16, 16, 18, 24, 26, 28
• Equi-width binning: – Bin 1: 0, 4 [-,10) bin
– Bin 2: 12, 16, 16, 18 [10,20) bin
– Bin 3: 24, 26, 28 [20,+) bin
• Equi-frequency binning :– Bin 1: 0, 4, 12 [-, 14) bin
– Bin 2: 16, 16, 18 [14, 21) bin
– Bin 3: 24, 26, 28 [21,+) bin
http://chem-eng.utoronto.ca/~datamining/ 19
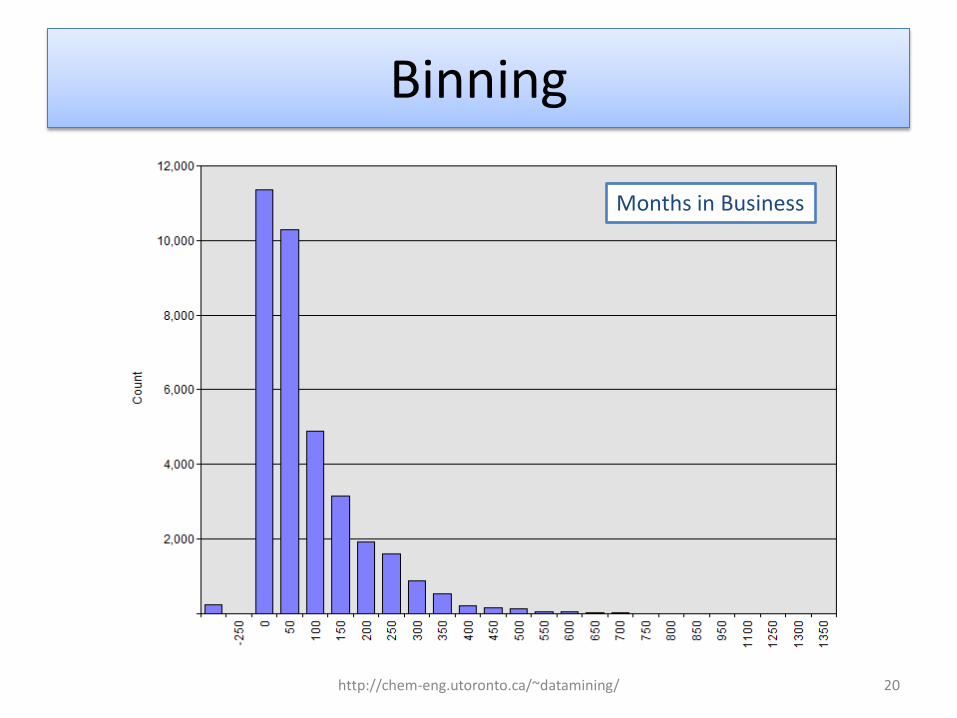
Binning
20http://chem-eng.utoronto.ca/~datamining/
Months in Business
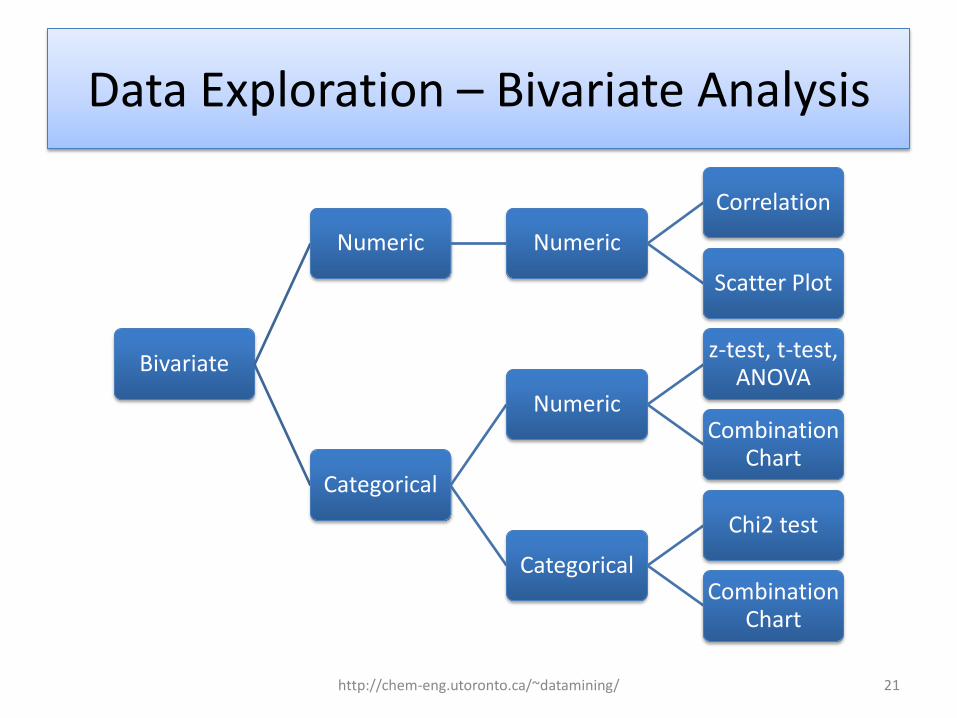
Data Exploration – Bivariate Analysis
http://chem-eng.utoronto.ca/~datamining/ 21
Bivariate
Numeric Numeric
Correlation
Scatter Plot
Categorical
Numeric
z-test, t-test, ANOVA
Combination Chart
Categorical
Chi2 test
Combination Chart
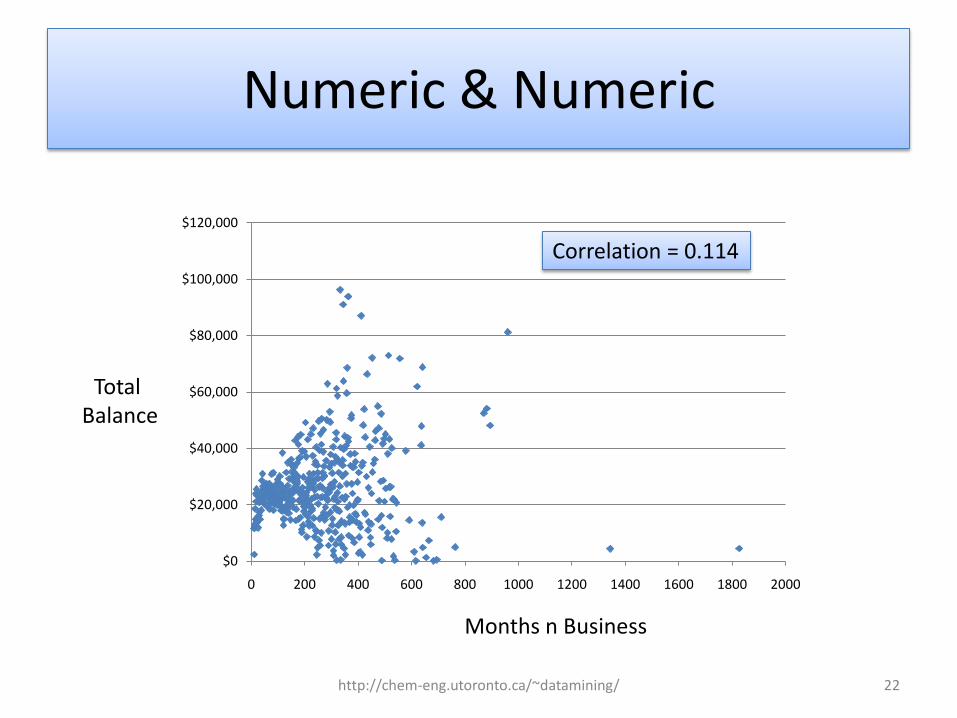
Numeric & Numeric
http://chem-eng.utoronto.ca/~datamining/ 22
$0
$20,000
$40,000
$60,000
$80,000
$100,000
$120,000
0 200 400 600 800 1000 1200 1400 1600 1800 2000
Months n Business
Total Balance
Correlation = 0.114
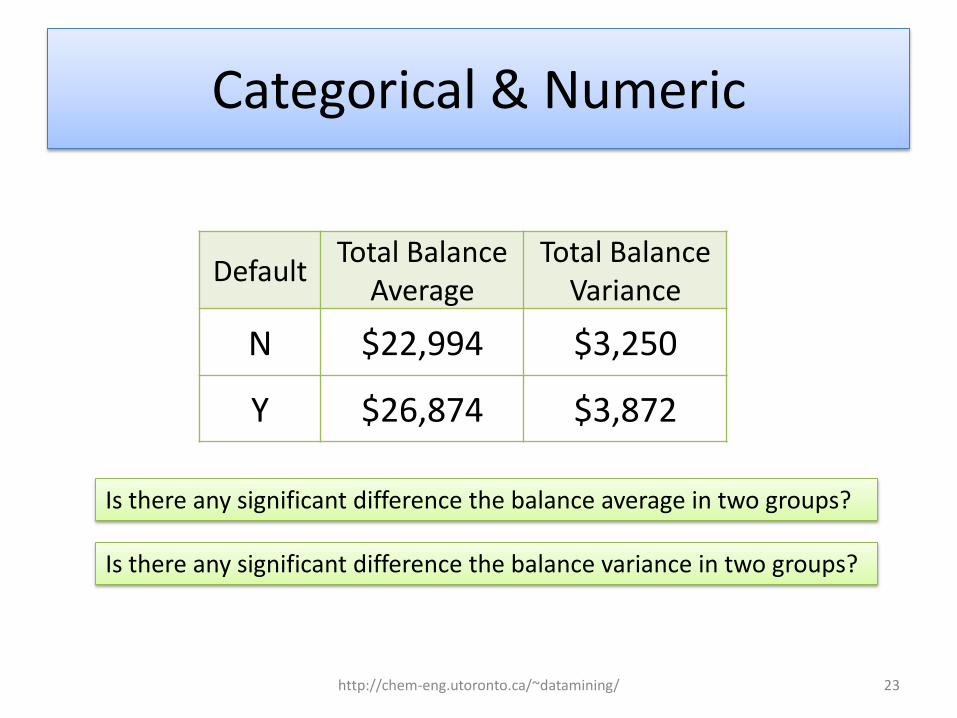
Categorical & Numeric
http://chem-eng.utoronto.ca/~datamining/ 23
DefaultTotal Balance
AverageTotal Balance
Variance
N $22,994 $3,250
Y $26,874 $3,872
Is there any significant difference the balance average in two groups?
Is there any significant difference the balance variance in two groups?
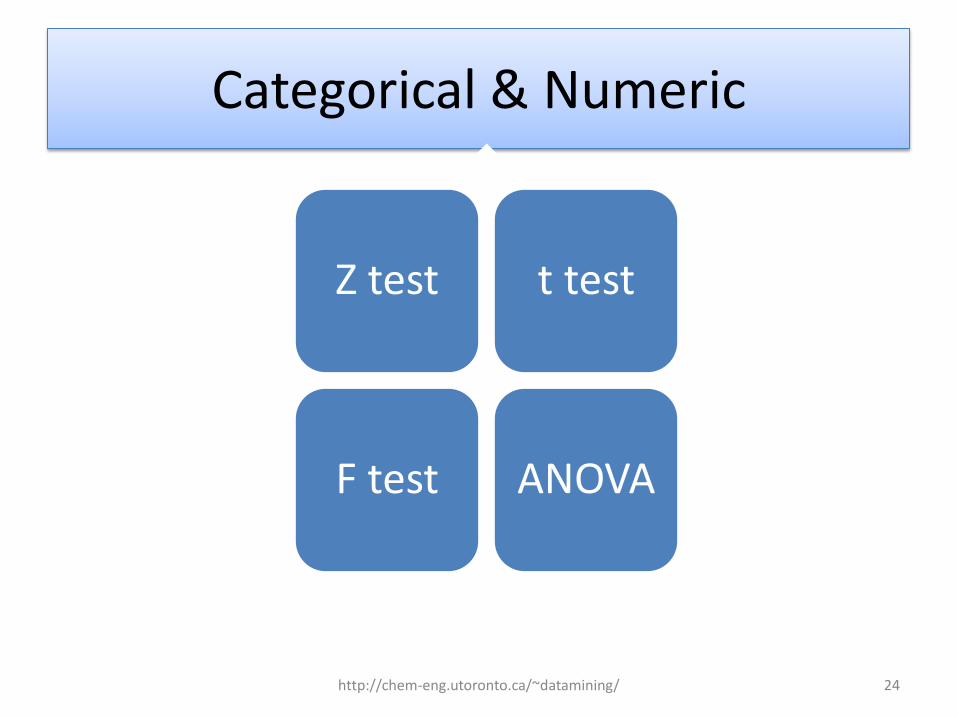
Categorical & Numeric
http://chem-eng.utoronto.ca/~datamining/ 24
Z test t test
F test ANOVA
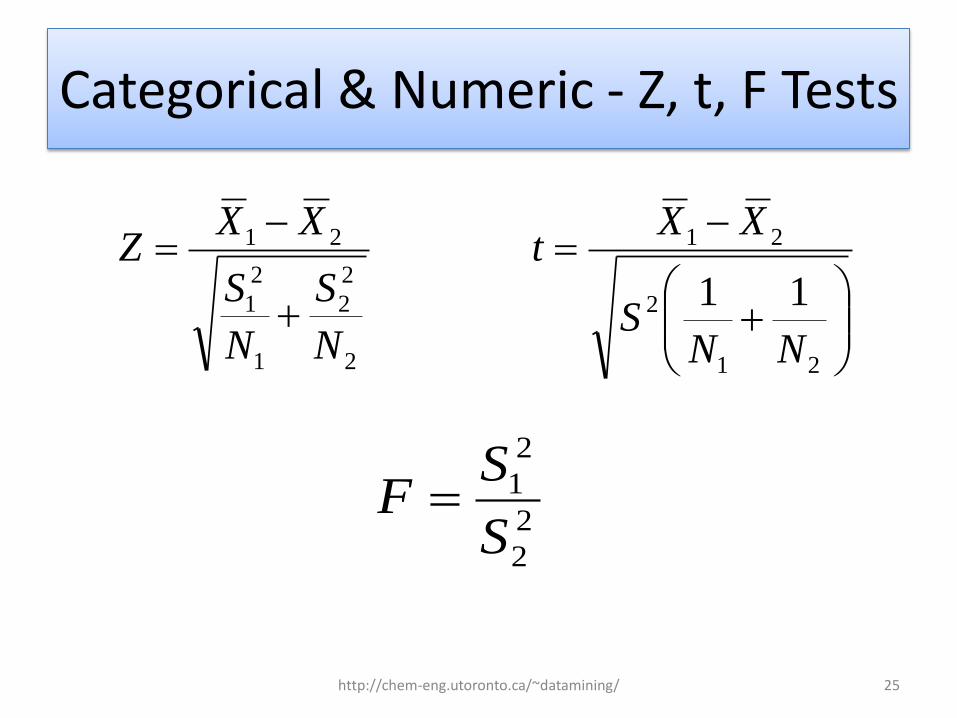
Categorical & Numeric - Z, t, F Tests
http://chem-eng.utoronto.ca/~datamining/ 25
2
2
2
1
2
1
21
N
S
N
S
XXZ
21
2
21
11
NNS
XXt
2
2
2
1
S
SF
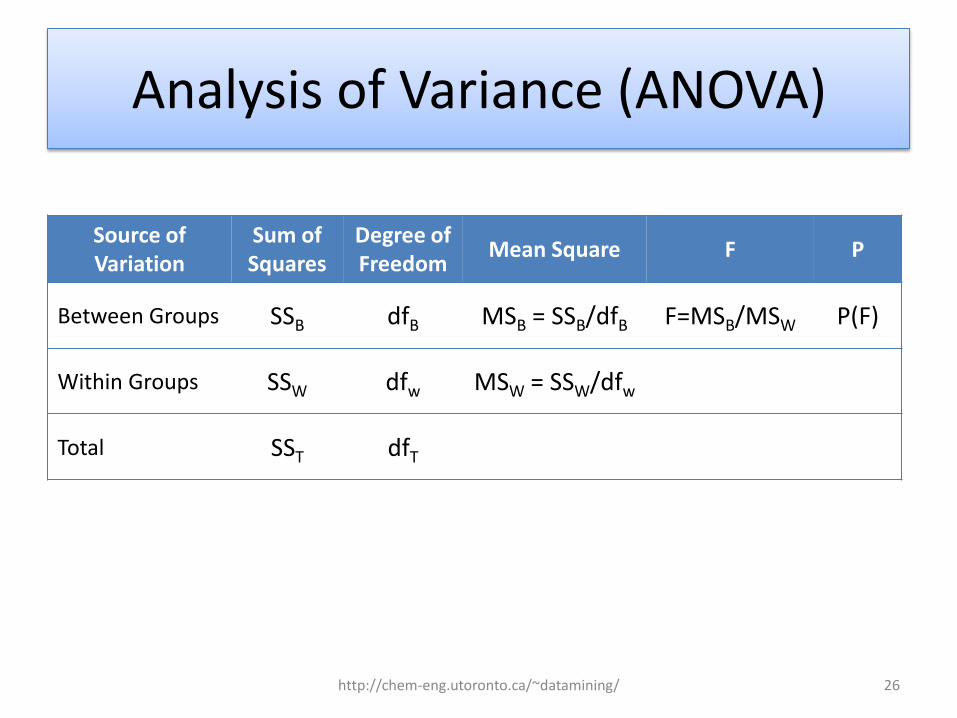
Analysis of Variance (ANOVA)
http://chem-eng.utoronto.ca/~datamining/ 26
Source of Variation
Sum of Squares
Degree of Freedom
Mean Square F P
Between Groups SSB dfB MSB = SSB/dfB F=MSB/MSW P(F)
Within Groups SSW dfw MSW = SSW/dfw
Total SST dfT
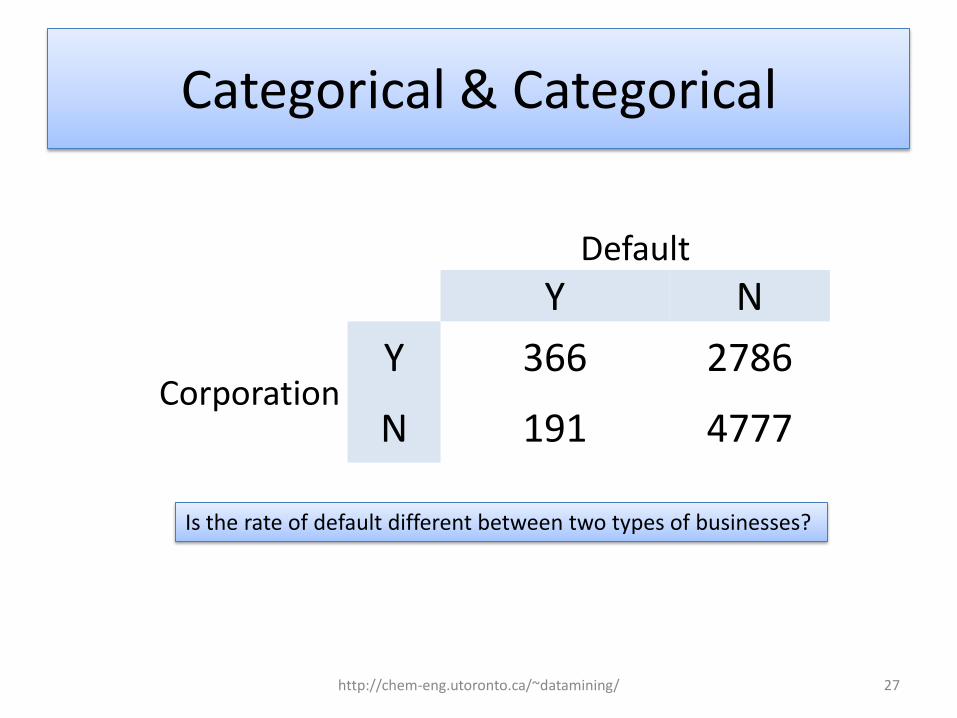
Categorical & Categorical
http://chem-eng.utoronto.ca/~datamining/ 27
Default
Y N
CorporationY 366 2786
N 191 4777
Is the rate of default different between two types of businesses?
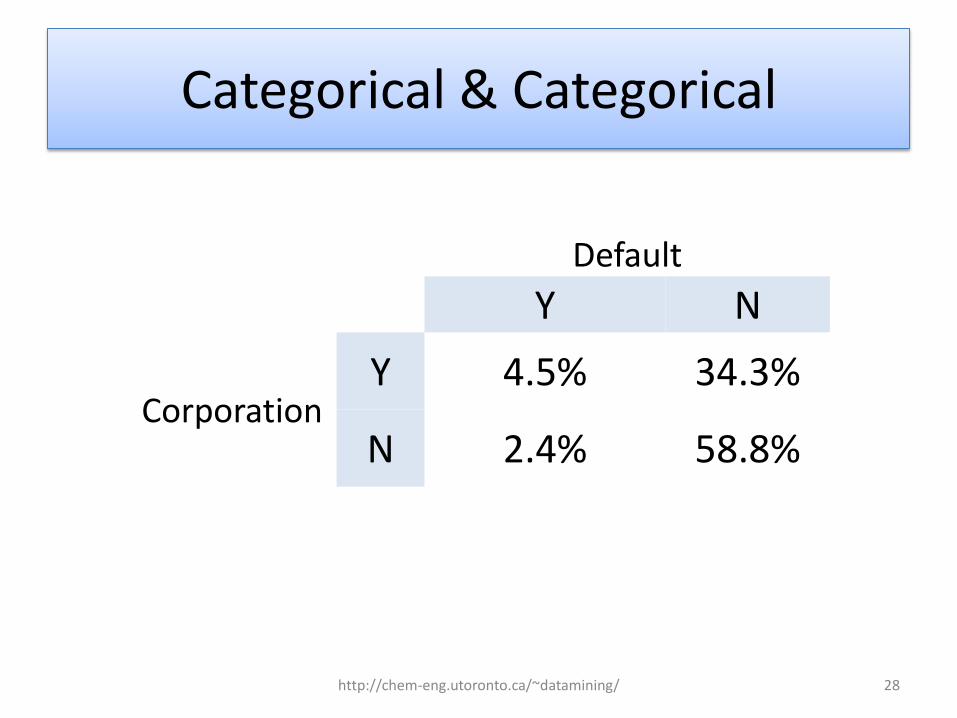
Categorical & Categorical
http://chem-eng.utoronto.ca/~datamining/ 28
Default
Y N
CorporationY 4.5% 34.3%
N 2.4% 58.8%
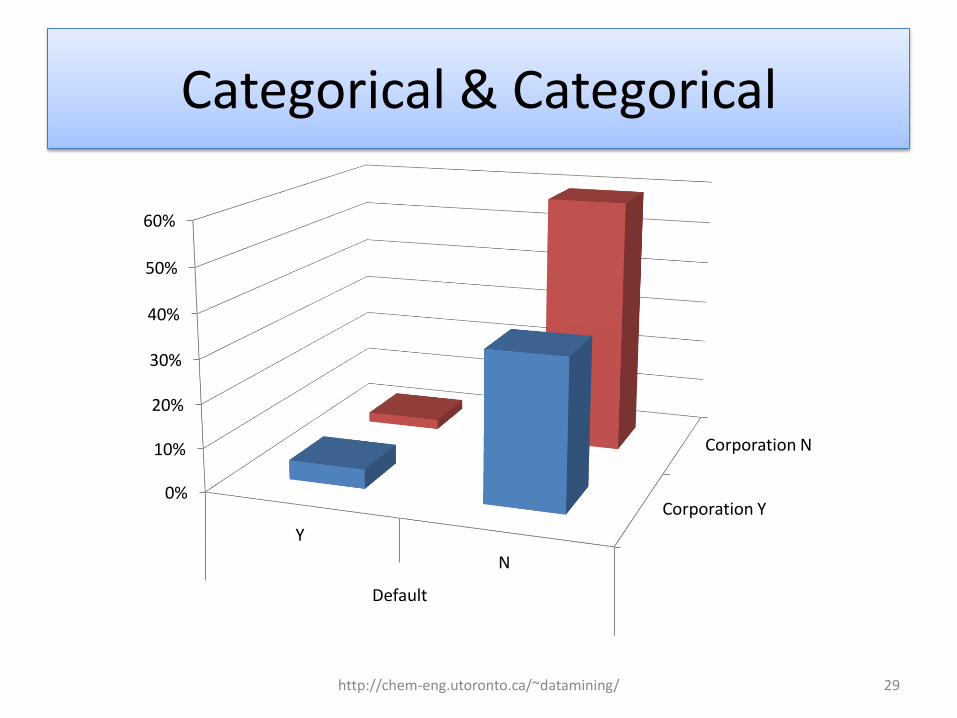
Categorical & Categorical
http://chem-eng.utoronto.ca/~datamining/ 29
Corporation Y
Corporation N
0%
10%
20%
30%
40%
50%
60%
Y
N
Default
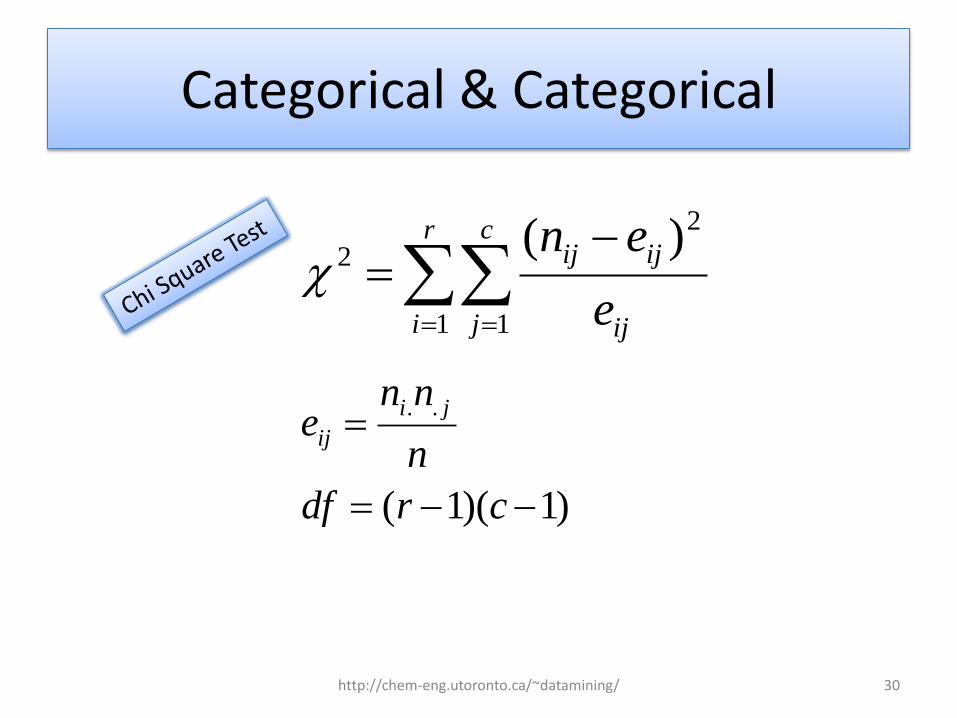
Categorical & Categorical
http://chem-eng.utoronto.ca/~datamining/ 30
r
i
c
j ij
ijij
e
en
1 1
2
2)(
)1)(1(
..
crdf
n
nne
ji
ij
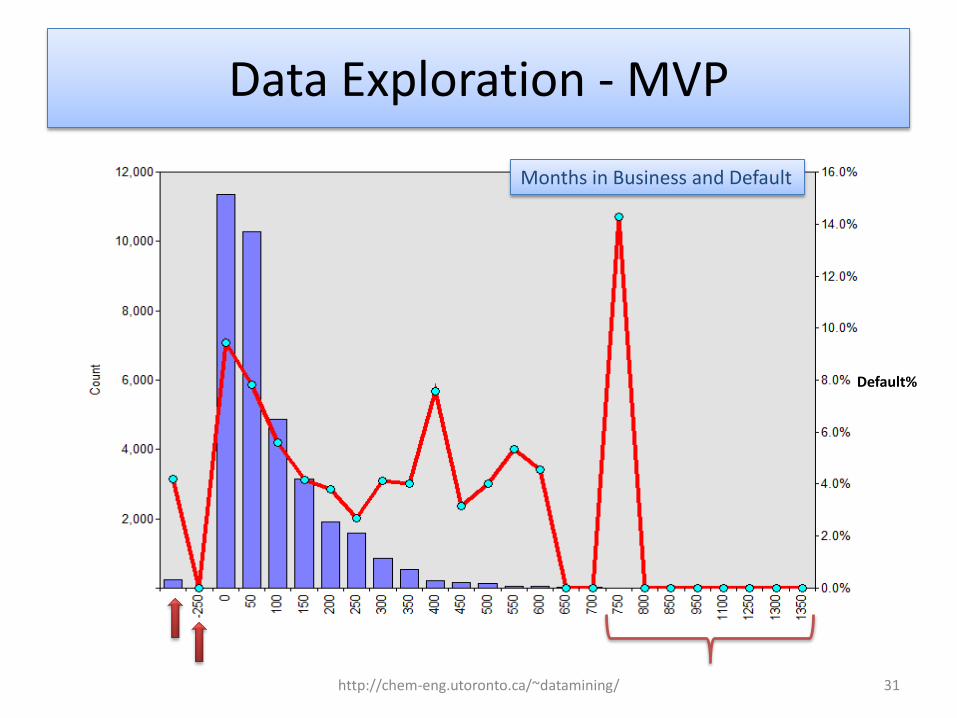
Data Exploration - MVP
http://chem-eng.utoronto.ca/~datamining/ 31
Default%
Months in Business and Default
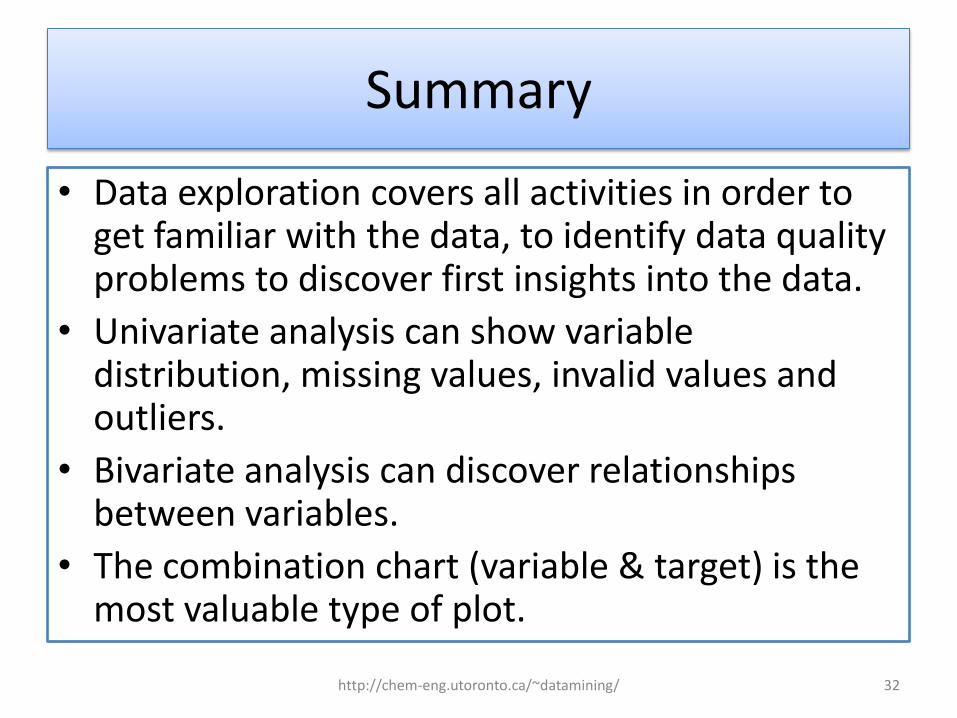
Summary
• Data exploration covers all activities in order to get familiar with the data, to identify data quality problems to discover first insights into the data.
• Univariate analysis can show variable distribution, missing values, invalid values and outliers.
• Bivariate analysis can discover relationships between variables.
• The combination chart (variable & target) is the most valuable type of plot.
http://chem-eng.utoronto.ca/~datamining/ 32

http://chem-eng.utoronto.ca/~datamining/ 33