payment improvements in the u.s. june 2015. should free market determination select the best...
TRANSCRIPT
Payment Improvements in the U.S.
Jun
e 20
15
2
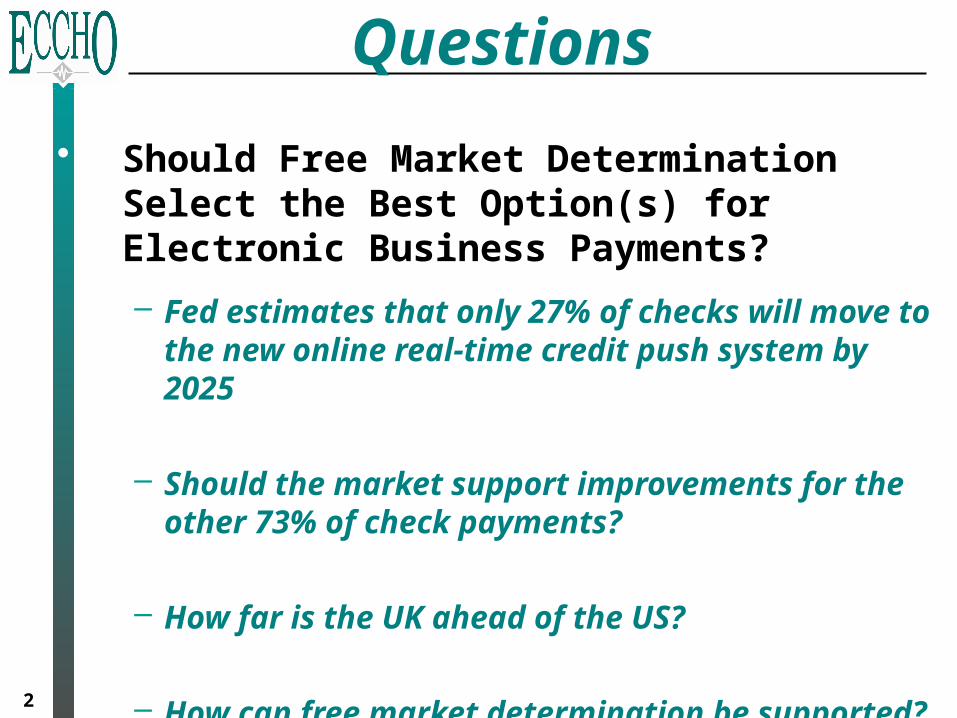
• Should Free Market Determination Select the Best Option(s) for Electronic Business Payments?
– Fed estimates that only 27% of checks will move to the new online real-time credit push system by 2025
– Should the market support improvements for the other 73% of check payments?
– How far is the UK ahead of the US?
– How can free market determination be supported?
Questions

3
• No Universally Acceptable Alternative to Checks for Business Payments
– Phoenix-Hecht (2014) reported 65% of business payments made by check (small businesses not included)• Credit push alternatives have been available for decades• Fed, private sector and NACHA have heavily supported moving
business payments to ACH credits
– Alternatives to paper checks are:• Today - Fedwire or ACH credit• Future – Online, realtime credit push payments
– Years and billions of dollars away– Fed estimate is that only 27% of all checks will make transition in 10 years– Is there sufficient difference in this credit push option to overcome business
inertia? – What about the other 73% of checks – why not improve them?
Business Payments
4
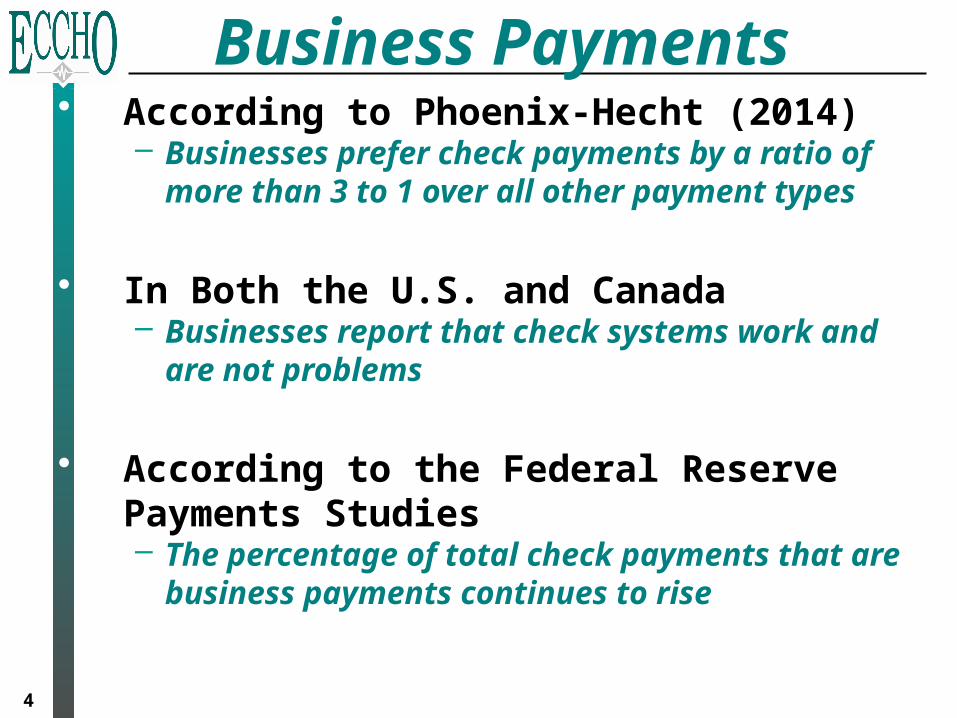
• According to Phoenix-Hecht (2014)– Businesses prefer check payments by a ratio of
more than 3 to 1 over all other payment types
• In Both the U.S. and Canada– Businesses report that check systems work and
are not problems
• According to the Federal Reserve Payments Studies– The percentage of total check payments that are
business payments continues to rise
Business Payments
5
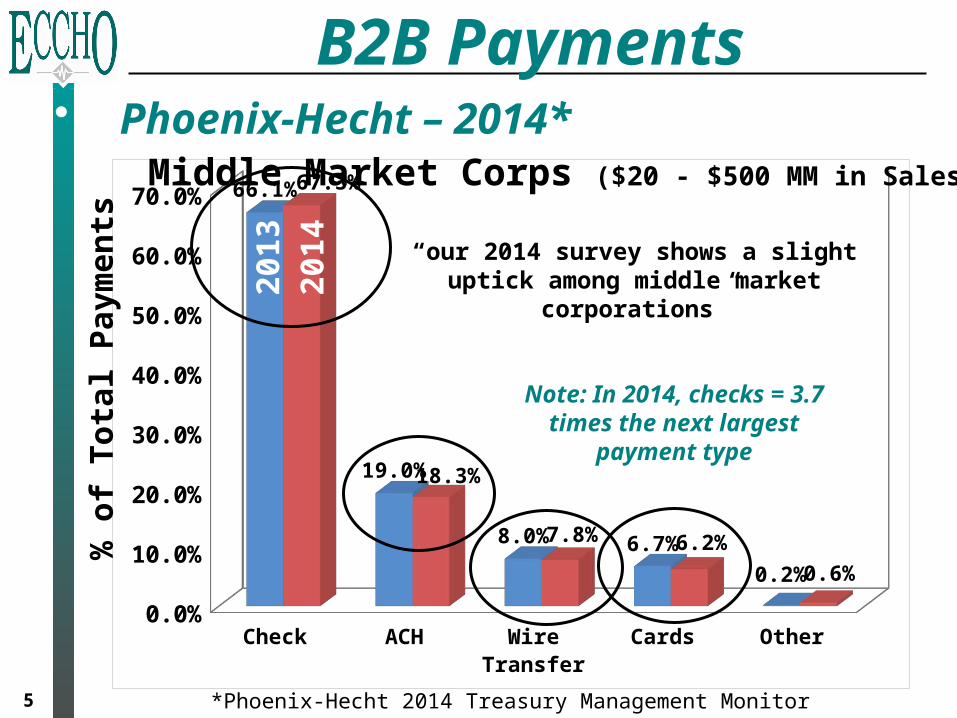
• Phoenix-Hecht – 2014*
B2B Payments
Check ACH Wire Transfer Cards Other0.0%
10.0%
20.0%
30.0%
40.0%
50.0%
60.0%
70.0% 66.1%
19.0%
8.0% 6.7%
0.2%
67.3%
18.3%
7.8% 6.2%
0.6%
2013
2014 “our 2014 survey shows a slight uptick
among middle market corporations”
Middle Market Corps ($20 - $500 MM in Sales)
Note: In 2014, checks = 3.7 times the next largest
payment type
% o
f To
tal
Pay
men
ts
*Phoenix-Hecht 2014 Treasury Management Monitor
6
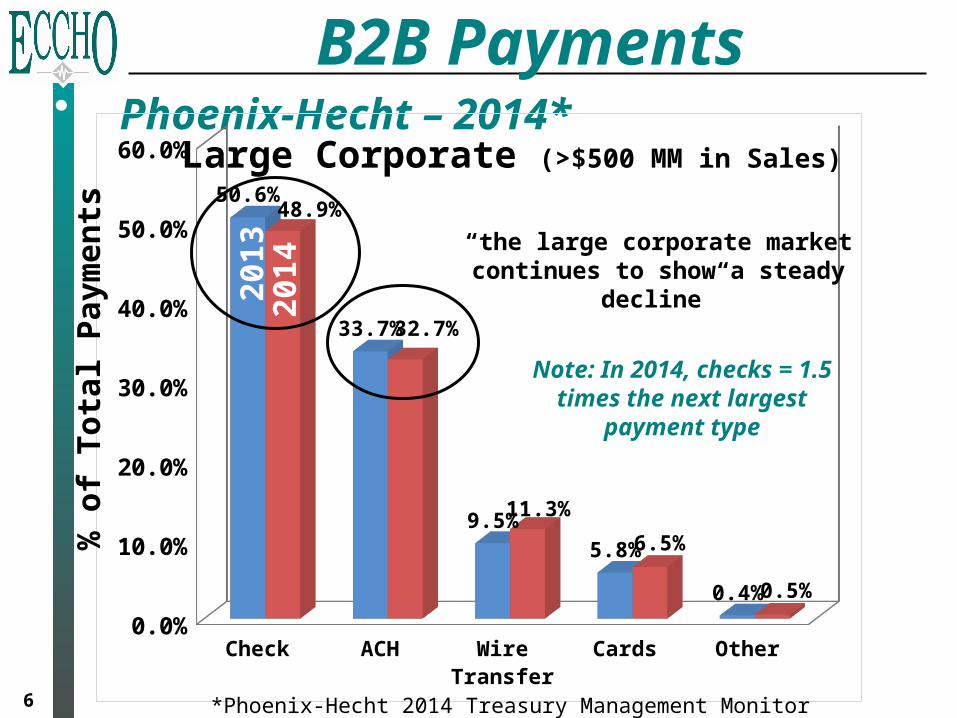
• Phoenix-Hecht – 2014* B2B Payments
2013
2014
Check ACH Wire Transfer Cards Other0.0%
10.0%
20.0%
30.0%
40.0%
50.0%
60.0%
50.6%
33.7%
9.5%5.8%
0.4%
48.9%
32.7%
11.3%
6.5%
0.5%
Large Corporate (>$500 MM in Sales)
2013
2014
“the large corporate market continues to show a steady decline”
Note: In 2014, checks = 1.5 times the next largest
payment type
% o
f To
tal
Pay
men
ts
*Phoenix-Hecht 2014 Treasury Management Monitor
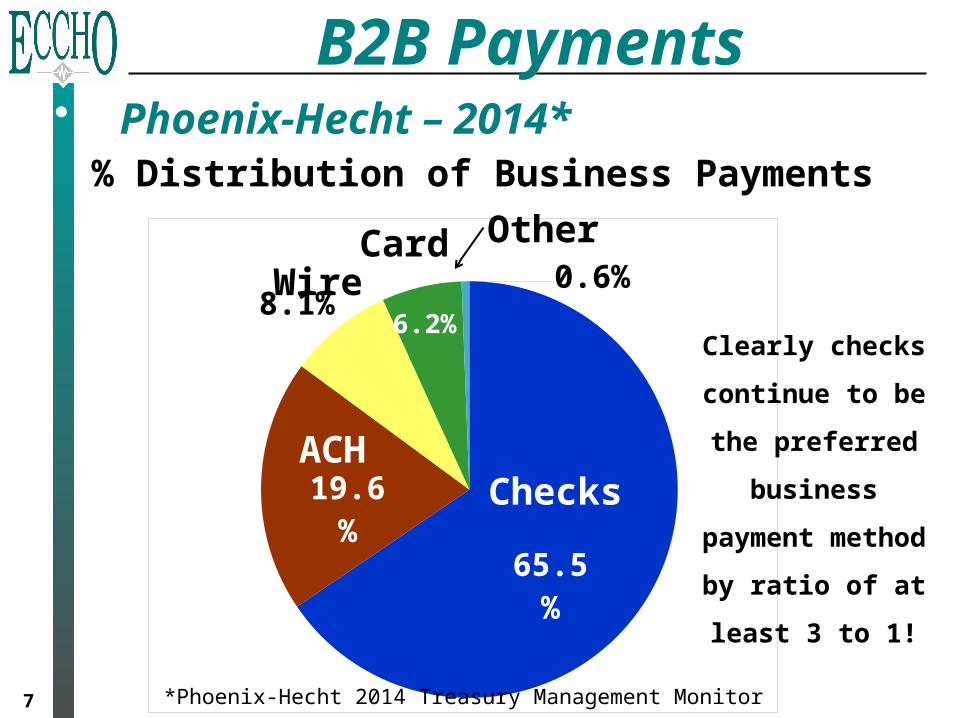
• Phoenix-Hecht – 2014*
B2B Payments
7
ChecksACH
65.5%
19.6%
8.1%6.2%
0.6%WireCard Other
% Distribution of Business Payments
Clearly checks
continue to be the
preferred
business payment
method by ratio of
at least 3 to 1!
ChecksACH
*Phoenix-Hecht 2014 Treasury Management Monitor

8
• Fed Payment Studies*
B2B Payments
B2B as Percentage of Checks Written
Clearly shows
the persistence
of business
checks
2001 2006 2009 20120%
5%
10%
15%
20%
25%
30%
35%
15%
25%27%
32%
*The 2013 Federal Reserve Payments Study
9
• Business Investment Options Are:– Spend money on administration/overhead or– Spend money where its make money
• On its goods and services
• To Spend on Administration/Overhead, Businesses Need:– To fix an existing or imminent problem that
prevents normal, ongoing business, or– An ROI that is greater than generated from their
normal business activities• Especially true for publically held corporations
• Payments are an Overhead Costs for Businesses
Investments in Payments
10
• Applying the UK Experience to U.S.– After 6 ½ years, single item, immediate Faster
Payments total 4% of total non-cash payments• Linearly extrapolated over 10 years yields 6.1%
– Between May 2008 and December 2014:• Non-cash payments in UK grew by 416 million payments
per month• Single item, immediate (SI) Faster Payments grew by 58
million per month– Market demand for non-cash payments grew 7.2 times
faster than demand for SI Faster Payments
– At same adoption rate, U.S. should continue to enhance all of its non-cash payment systems• Assumes 90% will not transition in first 10 years, and• 73% of checks will not transition in first 10 years
UK Experience
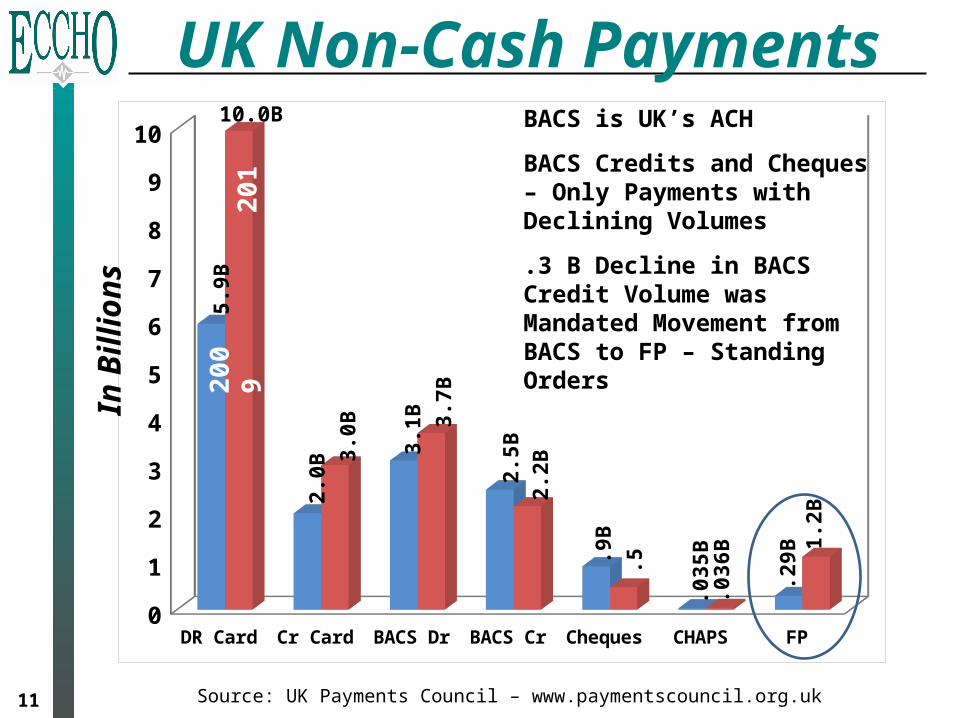
11 Source: UK Payments Council – www.paymentscouncil.org.uk
DR Card Cr Card BACS Dr BACS Cr Cheques CHAPS FP0
1
2
3
4
5
6
7
8
9
10In
Bil
lio
ns
200
92
014
BACS is UK’s ACH
BACS Credits and Cheques – Only Payments with Declining Volumes
.3 B Decline in BACS Credit Volume was Mandated Movement from BACS to FP – Standing Orders
UK Non-Cash Payments
5.9B
10.0B
2.0B
3.1B
2.5B
.9B
.035
B
.29B
3.0B
3.7B
2.2B
.5
.036
B 1.2B

12
May 2008 Dec 20140
200,000
400,000
600,000
800,000
1,000,000
1,200,000
1,400,000
1,600,000
1,05
6,57
6*
1,47
3,01
2*
All
Fas
ter
Pay
men
ts
Sin
gle
Ite
m I
mm
edia
te F
P
101,
885
58,5
04
Growth in Volumes 6.5 Years After FP Implementation:
Total Payments - 416.4 millionFaster Payments - 101.6 millionSI Payments - 58.2 million
Dec 2014 - SI Payments only 4.0% of Total Non-Cash Payments
Market demand for non-cash payments grew 7.2 times faster than demand for SI payments
*Source: UK Payments Council – www.paymentscouncil.org.uk
*Total Non-Cash Payments (w/o credit cards)
UK Faster Payments

Implementation Success
13
In T
ho
usa
nd
s /
Mo
nth
Volume Trends - 1st 80 Months
1 5 9 13 17 21 25 29 33 37 41 45 49 53 57 61 65 69 73 770
200,000
400,000
600,000
800,000
1,000,000
1,200,000
1,400,000
1,600,000
1 5 9 13 17 21 25 29 33 37 41 45 49 53 57 61 65 69 73 770
200,000
400,000
600,000
800,000
1,000,000
1,200,000
1,400,000
1,600,000
Months
Months
UK’s Faster Payments
U.S. Image Exchange
So
urc
es:
UK
Pay
men
ts C
ou
nci
l & C
hec
kIm
ageC
entr
al
1.3B
.1B

May 2008 Dec 20140
200,000
400,000
600,000
800,000
1,000,000
1,200,000
14
Growth in Volumes 6.5 Years After FP Implementation:
Total Debits - 361,096Total Credits - 45,922
Demand for debit pull payments grew 7.8X faster than demand for credit push payments since introduction of Faster Payments
*Sources: UK Payments Council & UK Cards Association
*Total Debits vs Total Credits (w debit cards)
UK Payments Trend#
of
Pay
men
ts /
Mo
nth
Deb
it P
ull
s
Cre
dit
Pu
sh
Deb
it P
ull
s
Cre
dit
Pu
sh

15
UK Payments Trend#
of
Pay
men
ts /
Mo
nth
May '0
8
Sept '08
Jan '09
May '0
9
Sept '09
Jan '10
May '1
0
Sept '10
Jan '11
May '1
1
Sept '11
Jan '12
May '1
2
Sept '12
Jan '13
May '1
3
Sept '13
Jan '14
May '1
4
Sept '14
0
200,000
400,000
600,000
800,000
1,000,000
1,200,000
1,400,000*Total Debits vs Total Credits (w debit cards)
Credit Push
Debit Pull
% Total Payments
May '08 Dec '14Debits 76.6% 97.5%Credits 33.4% 2.5%
*Sources: UK Payments Council & UK Cards Association
% Change/Yr:
Debits – 6.8%Credits – 2.8%

16
• Credit Push Options Have Been Available for >30 Years in the US– But all have failed the market adoption test
• Payment examples: ACH credits and Fedwire• Remittance standard: Electronic Data Interchange (EDI)
– Is there sufficient financial incentive in 2015 for businesses to invest in modified versions of credit push payments?
Credit Push in the US

17
• According to the Federal Reserve’s Summary of Its Electronic Payment Order (EPOs) Forum– “EPOs are a viable payment method for both small
and large businesses because of the speed in clearing and settling them, the finality of payment, their low cost, their ubiquity and their familiarity.”
• EPOs address many desired outcomes of the Payments Improvement initiative!
Is There a US Alternative?

• Minimal New Investment (+ROI image)• Minimal Changes in Processes• Reduced Expenses• Quick Implementation
EPO ScenarioC
HE
CK
WR
ITE
R
DE
PO
SIT
OR
CH
EC
K W
RIT
ER
PAYING BANK
INTERMEDIARY BANK
COLLECTING BANK (BOFD)
ImageImage Image
DepositRemittanceData
EPOStatement
Image
RDC
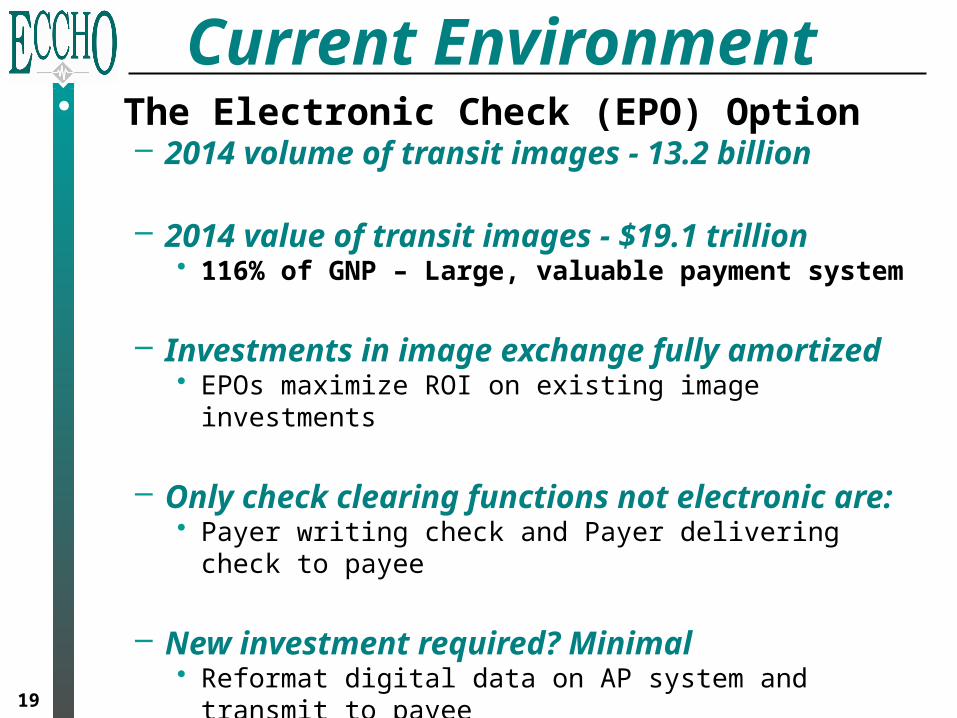
19
• The Electronic Check (EPO) Option– 2014 volume of transit images - 13.2 billion
– 2014 value of transit images - $19.1 trillion• 116% of GNP – Large, valuable payment system
– Investments in image exchange fully amortized• EPOs maximize ROI on existing image investments
– Only check clearing functions not electronic are:• Payer writing check and Payer delivering check to payee
– New investment required? Minimal• Reformat digital data on AP system and transmit to payee• Interface EPO with RDC application
Current Environment
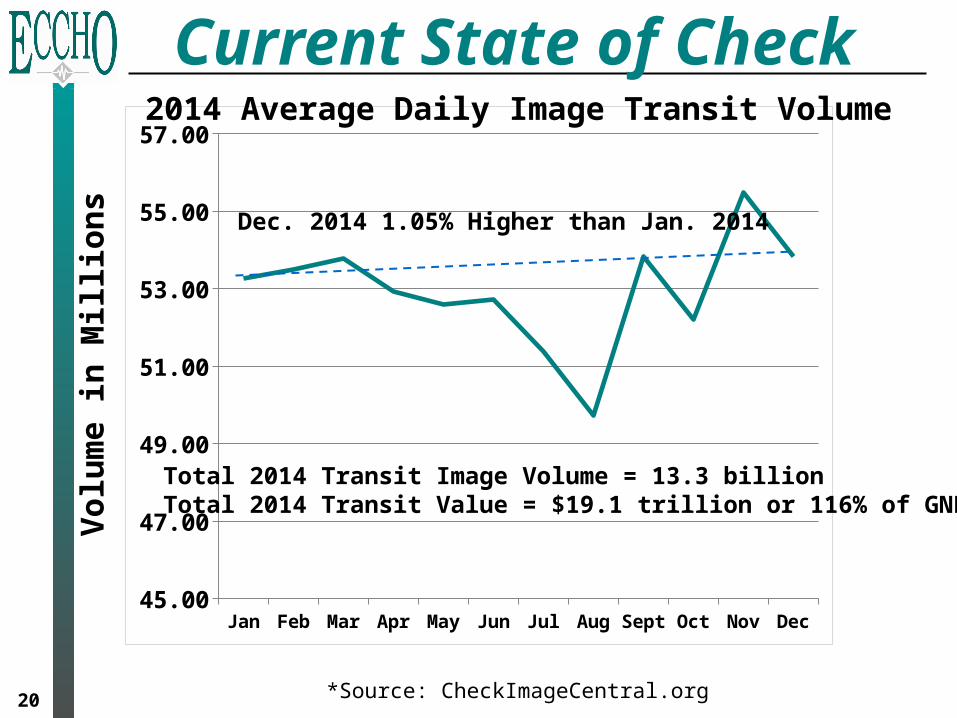
20
Jan Feb Mar Apr May Jun Jul Aug Sept Oct Nov Dec45.00
47.00
49.00
51.00
53.00
55.00
57.00
Current State of CheckV
olu
me
in M
illi
on
s
*Source: CheckImageCentral.org
2014 Average Daily Image Transit Volume
Dec. 2014 1.05% Higher than Jan. 2014
Total 2014 Transit Image Volume = 13.3 billionTotal 2014 Transit Value = $19.1 trillion or 116% of GNP

21
• EPO Societal Value?
– Cost savings similar to other electronic payments, but• Without significant new investment, and
– Enhanced value from short implementation
• EPOs Accelerate the Clearing of Checks
– With image, most checks clear same day as deposited• Some banks report more than 80% clear same day
– With EPOs, more checks can clear same day as written (originated)• Improves end user experience!
Value / Speed

22
• According the Federal Reserve
– The transaction and dollar amounts of fraud is less in check than in ACH or cards
– The rate of return of unpaid checks declined by 40% between 2009 and 2012
• According to the American Banker Association
– Check fraud down 37% from 2008 to 2012– Checks were ranked lowest among eleven
payment options in terms of future threats• Online Banking and ACH were ranked highest
Risks?

Unpaid Check Returns*V
olu
mes
in M
illio
n /
Yea
r
2003 2006 2009 20120
20
40
60
80
100
120
140
160
180
200 186.9
153
126.8
64
2003 2006 2009 20120.00%
0.05%
0.10%
0.15%
0.20%
0.25%
0.30%
0.35%
0.40%
0.45%
0.50%# Unpaid Cks Returned Return Rates
• Since 2003– Returns declined 66% (50% since 2009)
*Source: Federal Reserve’s 2013 Payments Study
.5%
.3%
23

Check Fraud Trend*
*Source: 2013 ABA Deposit Account Fraud Survey Report
1997 1999 2001 2003 2006 2008 2010 2012$0
$100
$200
$300
$400
$500
$600
$700
$800
$900
$1,000
$s in
Mill
ion
/ Y
ear 37% Decline
in 5 years
2012 – Lowest amount since 1997
$648
$1,024
24

• Check has Least Volume and Smallest $ Amount in Fraudulent Payments!
Distribution of Fraud*
*Source: Federal Reserve’s 2013 Payments Study
Number of Transactions Value of Transactions
Cards92%
Cards65%
ACH 5%
ACH 19%Check 3%
Check 16%
25
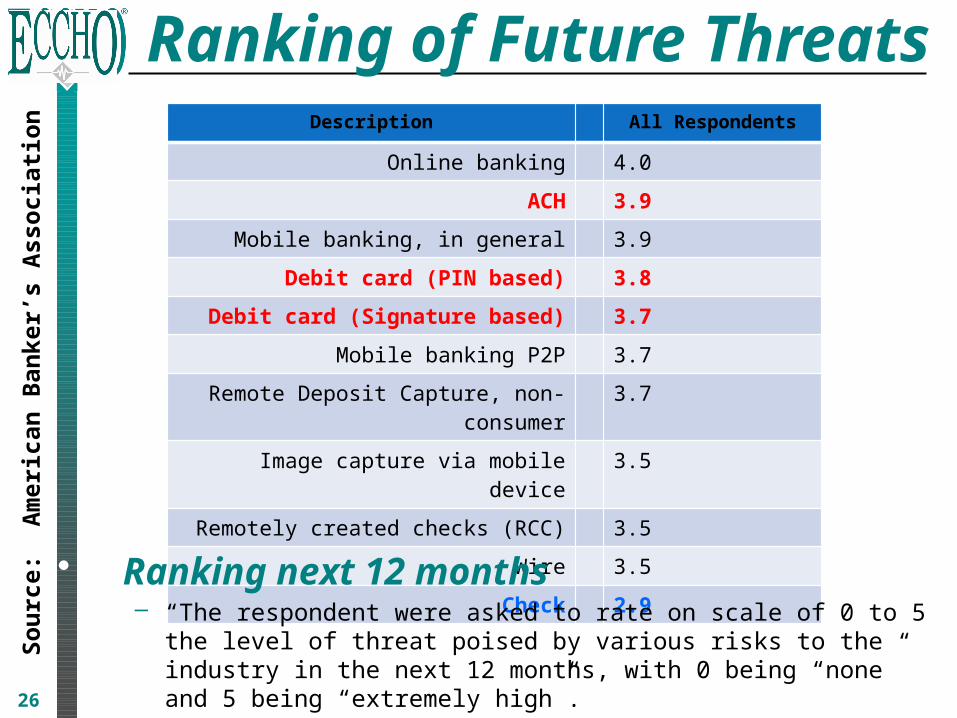
Ranking of Future Threats
26
Description All Respondents
Online banking 4.0
ACH 3.9
Mobile banking, in general 3.9
Debit card (PIN based) 3.8
Debit card (Signature based) 3.7
Mobile banking P2P 3.7
Remote Deposit Capture, non-consumer 3.7
Image capture via mobile device 3.5
Remotely created checks (RCC) 3.5
Wire 3.5
Check 2.9
• Ranking next 12 months– “The respondent were asked to rate on scale of 0 to 5 the level of threat
poised by various risks to the industry in the next 12 months, with 0 being “none” and 5 being “extremely high”.
So
urc
e: A
mer
ican
Ban
ker’
s A
sso
ciat
ion

27
• Enhance the Payment Type Preferred 3 to 1 by Businesses
– Maximize achievement of Payments Improvement initiative by building on most successful payment transition in history
• Achieve business savings associated with paper medium• Accelerate clearing to same day as written
– Maximize ROI on existing investments & minimize required new investments
– Minimize disruption to businesses and their payments and remittance processing• Avoids converting debit payments to credits
– Minimize uncertainty of business acceptance
Maximize Returns

28
• The Problem
– What was bad about paper checks was the medium
• Electronic images eliminated the physical medium for banks and the Fed
• Opportunity
– Eliminate the physical medium for businesses and create significant, new societal value
Problem Eliminated?
29
• Express Your Support
– If you support continued improvements to the check system contact ECCHO and let us know and contact your Federal Reserve Representative and let him/her know
– If you support letting the market determine the best option for business payments contact your Federal Reserve Representative and let him/her know
– If you support creating significant, new societal value for businesses through improvements in business payments, ECCHO and the Federal Reserve need to know
What to Do Now?

David Walker, [email protected]
214.273.3201
Thank You!
Electronic Check Clearing House Organizationwww.eccho.org