paying the price for spiritual enlightenment tax pressure ... · paying the price for spiritual...
TRANSCRIPT

This version: 27 March 2014 1
Economic History Society Conference, University of Warwick, 28-30 March 2013
Paying the Price for Spiritual Enlightenment Tax Pressure and Living Standards in Kofun and Asuka-Nara Japan (ca. 300-794 AD)
Jean-Pascal Bassinoa and Masanori Takashimab
Work in progress; not for quotation. Abstract Did the twin processes of political centralization and urbanization in ancient economies affect the wellbeing of commoners? We propose a cost-benefit analysis based on institutional and quantitative information on public revenues (poll tax, land tax, and corvée labour) and expenditures during the Kofun period (ca 300-538) and the Asuka-Nara period (538-794). Our findings indicate that the tax pressure increased sharply during the Asuka-Nara period, which corresponds to the introduction a new Chinese-style political system based on economic and religious institutions legitimized by Buddhism. It appears nevertheless that the new social order was well accepted. The willingness to accept a higher tax pressure could be explained by the role played by Buddhism as pacification device reducing the exposure of commoners to warfare-related risks, while improving social stability, property rights, and contract enforcement. In the meantime, the introduction of the new Chinese-style institutional framework resulted in a decline in the nutritional status of the rural population in the core Kinai region and in surrounding provinces. Keywords: political centralization, urbanisation, income tax, corvée labour, nutrition, Buddhism JEL classification: N35, N45, Z12 1. Introduction
Did the twin processes of political centralization and urbanization in ancient economies affect the wellbeing of rural commoners who accounted for the majority of the population? Political centralisation usually results in some kind of peaceful law and order enforcement, or at least in a decline in violence1, while urbanisation is generally conducive to the diffusion of market mechanisms. As this transformation occurred independently in various regions of the world over the course of the last three millennia BCE in the Middle East, China, Egypt, Greece, India, and Italy, it is tempting to postulate that a rise of living standards took place during that period, which is usually associated with the sophistication of institutions and arts, and in some cases of production techniques. However, the extent of cross-sectional differences in per capita income across medieval Europe and the relatively high level measured for Britain (Broadberry and Campbell 2009) indicates that there is no reason to expect a strong relationship between the institutional and technological sophistication of an economy and the standard of living of its population.
a Institute of East Asian Studies (IAO), Ecole Normale Supérieure de Lyon, 69007 Lyons, France (corresponding author); e-mail: [email protected] b Institute of Economic Research, Hitotsubashi University, Tokyo, Japan: mail: [email protected] 1 A high violent death rate is commonly observed in small-scale polities (Keeley 1996).

This version: 27 March 2014 2
A cost-benefit analysis of the political centralisation and urbanization requires some information on living standards and, more importantly, on taxation and on nutritional status and other aspects of biological wellbeing. Various attempts have been made to estimate per capita GDP in ancient economies, e.g. Goldsmith (1984), Maddison (2007), Scheidel and Friesen (2009) and Lo Cascio and Malanima (2009) for the Roman Empire, Amemiya (2007) for Greece, Folvdari and van Leeuwen (2012) for Mesopotamia, and Broadberry, Guan and Li (2012) for Song China. These studies provide snapshot views of income levels in ancient economies with figures for benchmark years2 that reveal only limited differences: most estimates are in a range between 600 and 800 international USD of 1990, while Song China was somehow more affluent than the other polities.3 Due to the scarcity of data, the procedure employed is usually based on a simplified version of the expenditure approach of national accounting reconstruction starting with a calculation of food consumption at subsistence level and adding other expenses related to consumption of the upper classes and the public sector (mostly civil infrastructure and military expenditures). This result allows assessing the share of total income collected as tax and to provide some information on regional and personal income distribution.
Evidence from the Roman Empire and other large-scale polities of the antiquity indicates that political centralization has been motivated to a large extent by the greediness of the social elite. This process eventually resulted in sizable transfers of revenues from the newly occupied regions, as a combination of plunder, taxation, semi-legal extraction by corrupt officials, and tribute payments. The capital of the Empire and the newly established cities in occupied regions were specialised in public administration, urban areas were the major recipients of these transfers of tax income, either in kind or in precious metal, to the capital city and the core region, resulting in a rise of regional and personal income inequality.
The reconstruction of national accounts of these polities at the regional level (or other measures of living standards) is therefore desirable. Cross-section estimates of provincial level living standards in the Roman Empire around year 13 AD presented by Maddison (2007) indicate a contrast between high average per capita income levels in the urbanized eastern part of the Empire and low levels in the more rural western provinces, but with the exception of Italy that has by far the highest per capita income and a very low level of taxation.4 Another major difficulty encountered in the estimation of national income in ancient economies is related to forced labour, in particular corvée5, that was involved in production functions explaining a sizable part of total output. Forced labour probably accounted to a large share of total public expenditures, with important implications for personal income distribution.
Numerous cases of resistance to the implementation of the new social order suggests that the price to pay for the shift to large-scale polities and urbanization was so high that the imperial power had usually to engage massive resources in terms of military manpower. It should be also noted that this transition was neither universal nor irreversible, as evidenced by the low urbanization ratios of early medieval Western Europe. The fact that a number of societies did not evolve towards the new model is well documented by historical records. In various regions of the world, for instance in mountainous areas of Southeast Asia, local agrarian societies deliberately remained apart and cultivated “the art of not being governed”
2 Folvdari and van Leeuwen (2012) also calculate series covering the period 400 to 50 BCE. 3 Per capita income calculated by Broadberry, Guan and Li (2012) is 1058 USD ca. 980 AD; but for a population of around 40 millions, while most estimates are closer to 50 millions, which would imply per capita income of around 850 USD. 4 Average per capital GDP for Italy in 13 AD (857 USD of 1990 for a population of 7 millions: average for the Empire of 570 for a population of 44 millions). 5 Slavery is usually taken into account by estimating a shadow price of slave labour (e.g. Maddison 2007).

This version: 27 March 2014 3
(Scott 2010). By “keeping the State at distance” they avoided slavery, conscription, taxes, and corvée labour, and reduced the risk of exposure to epidemics and large-scale warfare. But in some regions of the world, it took only a few decades for mostly agrarian protohistoric societies ruled by chieftains to swiftly evolve into polities managed by bureaucratic elites located in urban areas. Such was the case in Japan during the comparatively rapid transition from protohistoric polities of the Kofun period6, ca. 300-538) to the unified Chinese-style polity legitimized by Buddhism (Asuka-Nara period7 538-794).
The reminder of the paper is organized as follows: section 2 documents the process of political centralisation in Kofun and Asuka-Nara periods; section 3 discusses methodological issues related to income and leisure taxation, and some measures of tax pressure in Kofun and Asuka-Nara Japan; section 4 estimates public expenditures for the construction of large-scale tumuli and Buddhist temples in Kofun period and Asuka-Nara Japan, respectively; section 5 concludes by considering how political centralisation and urbanization affected the nutritional status of rural commoners in Nara Japan. 2. The process of political centralisation and urbanisation in the Kofun and Asuka-Nara periods
This section documents the process of political centralisation that started during the Kofun period in the Kinai region8 and the urbanisation resulting from the establishment, in the Asuka-Nara period, of capital cities modelled after the Chinese capital of the Tang dynasty.
The introduction of Buddhism in Japan in 538 marks the start of the epoch making Asuka period characterized by massive importation of institutional arrangements and technologies from China and Korea. 9 In particular, craftsmen who came from Korea introduced new techniques in architecture, mostly for Buddhist temples, as well as new production technique for high quality textiles and ceramics used by the social elite. The adoption of Tang China Confucian institutions and Buddhist beliefs allowed Yamato rulers to build a centralized polity. They took direct control of the major part of the Japanese archipelago, and established a new administrative framework centred on the core Kinai region.
In political terms, however, there is clear continuity between the Kofun and Asuka periods. 10 In the mid-3rd and 4th century, the rulers of Yamatai (or Yamato), the area corresponding to the Kinai region consolidated their dominance over other polities or chieftains of western Japan. From the 5th century, the realm of Yamato extended to most parts of western and central Japan, but peripheral regions probably retained semi-autonomy until at
6 This period is named after the Japanese term kofun that designates burial mounds (literally, old mound). In the rest of the paper, we will use the term tumuli for describing these burial mounds. 7 The Japanese historiography formally distinguishes Asuka period (538-710), and Nara period (710-794). The end of the Asuka period is identified as the year in which the capital was transferred to Heijokyo (Nara). In terms of administrative institutions, technologies, and urbanization, the Nara period is clearly in the continuity of Asuka period. 8 An area including present-day cities of Kyoto, Nara, and Osaka that is composed of five provinces: Settsu, Izumi, Kawachi, Yamato, Yamashiro (on the map in appendix 1, provinces 33, 34, 35, 37, and 38, respectively) 9 An alternative date for the start of Asuka period is 592, which is related to political event in the imperial court. This periodization, and the name of the period, was initially adopted by early 20th century Japanese art historians in relation to differences in styles and techniques in architecture and fine arts. 10 The Japanese historiography usually describes Asuka period as part of the Yamato period that includes both Kofun and Asuka sub periods and ends with the transfer of the political capital to Heijokyo (Nara) in 710. The capital moved again in 784 to Nagaokakyo (also in the Kinai region) and finally, in 794, to Heiankyo (present day Kyoto) that remain the seat of the imperial power until 1868.

This version: 27 March 2014 4
least the 6th century.11 The administrative map of provinces of the 6th century (appendix 1) remains almost unaltered until the mid-19th century, with a strong sense of local identity for both the social elite and the commoners; this suggests that these provinces corresponded to former local polities of the Kofun period.
The process of political centralization was accompanied by a rise in the share of the Kinai region in total Japanese population. According to estimates by Kito (1996), the Kinai region accounted for 5% of Japanese total population ca. 1 AD and 10% in 725 (Japanese total population increased from around 590,000 ca. 1 AD to around 5,500,000 in 725). This increase could be largely due to the large area suitable for paddy-rice cultivation; the Kinai is the largest plain of western Japan (Figure 1). In the meantime, the share of the surrounding provinces remained stable at around 11% (see province level population estimates in appendix 2). The compound population growth rate of the Kinai was close to 0.4% per year between 1 AD and 725, and only slightly lower in 725-800. In the meantime, the compound rate was around 0.2% for both sub periods in surrounding provinces, as well as for Japan as a whole. Japan had already one of the highest population densities in the world, around 50% highest than the Italian average in the 8th and 9th century. The calculation at the province level presented of figure 2 reveals that the level was particularly high already the Kinai region, in some case above 50 inhabitants per square km ca. 725 or 800 (Figure 2).
Figure 1: The plain of the Kinai region and surrounding areas Source: http://figal-sensei.org/hist157/Text/map6.html Note: the area around lake Biwa is not part of the Kinai but played an important role in the provisioning of the political capitals (Nara and later Kyoto) that were by far the largest urban areas.
11 The identification of the period of unification remains a debated issue. It took place in early Kofun period unification (4th century) according to Imamura (1996), in mid-Kofun (5th century) for Karoku (1990) and Barnes (2007), while Okauchi (1986) and Wada (1996) claim that it did occur only in late Kofun (6th century). Emishi populations of the northeast of Honshu island (present-day Tohoku region), who combined hunting and gathering with slash and burn agriculture, managed to stay out of control of the Nara authorities.

This version: 27 March 2014 5
Figure 2: Population density ca. 725 and 800 Sources: population data from Kito (1996).

This version: 27 March 2014 6
Although drastic institutional changes took place in the mid-6th century, the transition from Kofun to Asuka period was a also very gradual one in terms of most advanced technologies used in agriculture (including irrigated rice) and metallurgy. A similar remark applies to the familiarity with Chinese writing that is documented from at least the 5th century with inscriptions in Chinese characters on prestige goods.12 This suggests that the knowledge of Chinese script already existed Japan in the late 5th century or earlier (Saito (1979). Farris (1996) also highlights that the military institutions and techniques remained largely unchanged from the 6th to the late 8th century, with a military elite relying on large numbers of lightly equipped peasants to achieve superiority on the battlefield. Universal military conscription was abandoned only towards the end of the Nara period, in 782.
The kingdom of Yamatai appears comparable to other protohistoric polities characterized by high degree of social stratification with rulers combining economic, military, and ideological sources of power (Earle 1997). As in other protohistoric polities in which economic power and the hereditary transmission of wealth was critical to define legitimacy, for instance in Hawai, “the emergence of stratification has been documented archeologically by a growing differentiation in the amount of labour invested in burial monuments” (Ibid. 44). The largest share of labour inputs involved in the building of tumuli was concentrated on large-scale ones.13 These projects can be regarded as public works commissioned by the rulers of Yamoto or other political entities (including local chieftains and other members of the social elite for mi-size kofun). In Kofun period Japan, large-scale tumuli were geographically concentrated in the Kinai region. Other large-scale tumuli can be identified in surrounding provinces including Harima, Tajima, Tanba, Kii, and Omi.14
The construction of large-scale tumuli almost entirely ended during the Asuka period, in conjunction with the diffusion of Buddhism among the social elite. New types of public expenditures appeared, mostly for the construction of Buddhist temples and, albeit to a lesser extent, for the construction of the palaces. This major shift in public expenditures justifies distinguishing Kofun period on the one hand, and Asuka-Nara period, on the other hand. In terms of urbanization trends too, Asuka marks the start of a new era with a political and administrative capital. In the late Asuka period, Fujiwarakyo established in 690-704 with a master plan based on the grid system of Chang’an, the capital of Tang Emperors. The population of Asuka period was estimated on a range between 10,000 and 60,000.15 The transfer of the capital to Heijokyo (Nara) was associated to a further increase in the size, the population reaching around 74,000 in the mid 8th century.16
12 Chinese characters of the zodiac were found, for instance, on an iron sword found at the Inariyama site located in the plain of the Kanto (precisely in Saitama prefecture allowing identifying the year of production of the sword as 471. Although comparatively highly populated, the plain of the Kanto was a periphery of the Yamatai realm. Archaeological evidence tends therefore to contradict information reported in Nihonshoki (an official Japanese chronicle written in classical Chinese whose compilation was completed in 720) implying that such knowledge of Chinese calendar was introduced only in the mid6th century (the chronicle states that, in 553, Emperor Kinmei asked the Korean kingdom of Paekche to dispatch an expert of Chinese calendar who came to Japan the following year, implying that this knowledge was introduced at that date). 13 The building of smaller ones did not required more than a few working days and was therefore achievable by the kinship network of the deceased person. 14 See map 1, province 27, 28, 32, 36, and 40 15 Kishi (1984), Kito (1994), Kinoshita (2003). 16 The population of Kyoto, the imperial capital from 794 and by far the largest Japanese city of the time, did not exceeded 200,000 inhabitants before the mid-16th century (Takao, Hayashiya and Matsuura 1968). Apart from Nara, the two large cities were Naniwa (present-day Osaka), the imperial capital between 745 and 754, and Daizaifu (close to present-day Fukuoka, in the northern part of Kyushu island). The population of these two cities is estimated to about 35,000 and 15,000, respectively, in the mid-8th century (Farris 2009).

This version: 27 March 2014 7
3. Income and leisure taxation
In this section, we discuss methodological issues related to the importance in ancient economies of tax on leisure, in addition to income tax; we also use qualitative and quantitative information to assess tax pressure in Kofun and Nara Japan.
One of the most striking features of ancient economies is their difficulty, and in some case inability, to use market mechanism for implementing large-scale public works. The standard response was to rely on forced labour, either slavery or corvée labour, or a combination of both. The estimates of per capita GDP for ancient economies usually assessed the value of slave labour on the basis of the price of unskilled labour, regarded as a proxy for its shadow price. However, economic historians usually overlook the value of corvée labour.17
This is surprising since leisure time and time budgets have been the object of considerable interest during the last decades from the part of economic theorists, in particular following Becker (1965), as well in applied economic studies using contemporary data. This stream of literature includes considerations on home production and leisure (Gronau 1977, 1980) and on optimal taxation (Kleven 2004) that appear relevant for the study of living standards and institutions in ancient economies, even if standard procedures based on the strict application of SNA manuals should lead us to exclude these economic activities.
Ancient economies relied, at least in an initial stage of development, on a combination of income and leisure tax to finance public expenditure. A major motivation for using corvée labour was the high cost of shipment and storage of goods collected as tax in kind, in particular grains. The reduction in transportation cost and the monetization of the economy eventually resulted in a decline in the share of corvée in the total tax burden. The tax on leisure was particularly important in ancient East Asia. In Tang China, which had been the model for the Asuka-Nara political institutions, corvée accounted for 20 days per year for male adults; but it declined sharply during the following Song dynasty (Xie 2005).
As mentioned earlier, military strength in Kofun and Asuka-Nara Japan (and in other polities) critically relied on contributions by peasants, either as lightly armed soldiers or as porters, explicitly described in official archives of Nara Japan as military corvée. In a similar pattern as for slave labour, the shadow price of corvée can be regarded as equivalent to the wage paid to free workers, either skilled or unskilled, depending on the type of activity. In the case of military corvée, the presence of a risk premium justifies considering the value as above the wage of unskilled workers. Since peasants subject to military service were usually entitled to own their weapons and to keep them in peacetime, a source of prestige and power in local community, military corvée can be regarded as a tax on the ownership of weapons.18
Within the historical national accounting framework, military and non-military corvée labour can be easily introduced on the basis of estimates of number of days with a unit-price equivalent to daily wages paid to free workers (when this information is available, which is the case for Nara Japan). Corvée would therefore appear in an expenditure approach and public expenditure, in a production approach as public services, and in an income approach as public revenues. The advantage would be to avoid a spurious rise (decline) in per capita GDP that would otherwise result, for instance, from the shift from military corvée to a permanent army of professionals warriors or mercenaries (or the other way round), as it occurred for 17 This may be due to the lack information on the actual number of days of corvée labour, along with a reluctance to incorporate a leisure tax in a national accounting framework. The UN SNA manuals do not seem to take forced labour into account, although it accounted for a large share of the labour force in some major 20th centuries polities such as Stalinist URSS or Maoist China, and remains non-negligible nowadays in many countries 18 Interestingly, this is consistent with the optimal tax theoretical framework proposed by Kleven (2004) which implies that the market goods requiring the more household time (this is the case for weapons since training is a time consuming activity) should carry the highest tax rate.

This version: 27 March 2014 8
instance for Rome at the end of the Republican period, and in Japan at the end of the 8th century (end of universal military conscription in 792).
Another advantage of the inclusion of corvée in GDP estimates is to avoid misrepresenting the economic structure of communities that cultivated the art of not being governed. In order to keep the State at bay, they had to dedicate resources aimed at building a credible military force. Private expenditures were therefore required for the production or purchase of weapons as well as in the form of household time used for military drills. Since the average size of such communities was small, military expenditures accounted for a large share of total expenditure. Therefore, the claim that these communities avoided military conscription and taxation (Scott 2010) is overoptimistic. The price to pay for avoiding taxation by the State was to relinquish leisure time and to accept the risk of injury or death faced by warriors, which has been commonly described in various human societies as blood tax.
From the viewpoint of risk-adverse or untrained non-professional warriors, non-military corvée or a tax on income can be regarded as an attractive proposition in comparison with military corvée. Building massive tumuli, as in the Kinai region during the Kofun period, required enormous amount of manpower, which can be interpreted as a signal sent by the rulers to competitors or challengers demonstrating their ability to mobilize comparable amount of labour in military corvée. The large quantities of labour inputs required for building massive tumuli in the Kinai region during the Kofun period are consistent with high population density that made labour abundant. In the meantime, population density favoured the division of labour and allowed the Yamato rulers to select only the best warriors during wartime operations, while military corvée was converted into income tax for the rest of the population, and still maintain a numerical superiority over both their local challengers and the semi-autonomous polities of other regions.
There is unfortunately no clear information on the number of days of labour corvée in Kofun Japan. However, Chinese chronicle Wei Zhi indicates that sophisticated institutional arrangements were used by the kingdom of Yamatai for collecting public revenues in kind in the late-Kofun period, which implied maintaining public granaries, and probably also levies on domestic and foreign trade. The chronicle describes the tax system of Yamatai in the following manner: “people pay their tax to Yamatai. There are storehouse and markets in the country. Yamatai is trading with other countries, and the country officials control their trade.”19
Large-scale tumuli were the major form of public capital formation in Kofun Japan. Other public work projects were related to land reclamation that was less demanding in a context of low population growth rate. The institutional arrangements for mobilizing large numbers of workers involved in the building of tumuli are unknown. It could have been corvée labour applying to most commoners, conscription (i.e. a certain number of workers conscripted by village), or somehow voluntary paid work with payment in kind (rice or other quasi-money), or a combination of several or all of these practices.
In any event, any of these arrangements can be regarded as a form of taxation, and would imply allocating public revenues. The Chinese records do not specify how these public revenues were used but the presence of granaries suggests that tumuli were build by workers paid in grains. Among the different grains that were cultivated in the Kinai region in Kofun period (rice, barley, wheat, millet, buckwheat, along with azuki and other beans) rice is the easiest to store (un-husked rice can be stored several years without spoiling). Our conjecture is that tax payment was made in rice (as in later periods) that was redistributed to commoners working as unskilled workers during periods of crop failure, which rendered the building of 19 Ishihara (1985, 48). It is unclear whether “other countries” refers to other polities in Japan or to Korea kingdoms.

This version: 27 March 2014 9
tumuli for chieftains and rulers socially acceptable and even attractive if, as it is likely, this was associated with distribution of rice wine during festivals (as in later periods).
Our documentation is much more accurate for the Nara period and explicitly mentions corvée labour, along with other forms of taxation. Sawada (1927) estimated the average households income and tax levels for each taxation item ca. 75020. The result is presented in Table 1. Table 1: Tax payment by a “representative” household in the Kinai ca. 750
Items In rice equivalent % of total (1) Land tax from Kubunden: paddy field (so) 34.2 soku 12.6 (2) Land tax from Chishiden: paddy field 30.1 soku 11.1 (3) Land tax from dry land 6.6 soku 2.4 (4) Poll tax (cho) 32.7 soku 12.0 (5) Poll tax (yo) 16.2 soku 6.0 (6) Poll tax: local product (Chunan Sakumotsu) 1.8 soku 0.7 (7) Poll tax: labour service (zoyo) 76.0 soku 28.1 (8) Reserved grain (giso) 0.8 soku 0.3 (9) Compulsory state loans (suiko) 72.6 soku 26.8 (10) Military service (eji, sakimori) unspecified Total 270.70 soku 100
Source: Sawada (1944). Notes: a) Land tax: Kubunden is allotted paddy field given to each farmer under the Ritsuryo system. Joden designate other paddy field. Land tax (so租) was legally 3% of output (2 soku 2 wa of rice ear per 1 tan of paddy field). Land productivity of rice is estimated 314.3 soku per cho. For non-rice grain, productivity is 52% of rice (Takashima 2013). b) Poll taxes: The rate of poll tax (yo庸 and cho調) was based on the age of the taxpayer. Poll tax was paid by a variety of goods, typically 8 shaku 5 sun (2.6 m) of silk cloth as cho and 2 jo 6 shaku (7.9m) of hemp cloth as yo. Poll tax (yo) was usually paid in hemp cloth instead of corvée labor in Nara. However, there were many times of capital relocations and building temples throughout Nara period, in which case yo was usually actual labour service in the capital city, male farmers being forced to leave their home to work in Nara. Other estimates by Takigawa (1944) give for the poll tax approximately 40 soku of rice ear per adult, on the supposition that the value of silk cloth as cho was equal to hemp cloth as yo (and that its value was equivalent for 20 soku of rice ear)21.
According to Sawada’s estimates, average total income of a “representative” household was 1046.9 soku. Hence, tax accounted for 25.9% of rural household income (with land tax and poll tax accounting for 26.2% and 18.6% of the total, respectively). Although lower than in Tokugawa period (in a range between 40 and 60%, depending on the region for agricultural producers in the 18th and early 19th century), tax pressure in Nara period represented a heavy burdens that fall mostly on farmers. Existing GDP estimates for Nara period suggest that average income was around 525 USD of 1990 (unadjusted for corvée) (Bassino et al. 2012). Even if we take into account the fact that corvée (zoyo) accounted for around a third of the total tax pressure, this level of taxation relative to GDP implies an extraction ratio of around 72%. This result remains plausible since Milanovic, Lindert and Williamson (2011) fund levels close to 100% for Moghul India and 19th century China.
It is also worth taking into account that the sources quoted by Sawada (1927) indicates that the rate of the labour service component of the poll tax (zoyo) and of the compulsory state loans (suiko) were drastically reduced in 757, which resulted in a fall of the share of rural household income paid as tax to 19.5% (with almost no corvée). Such a drastic change 20 Sawada (1927, 642-651). 21 Takigawa (1944, 267-268).

This version: 27 March 2014 10
suggests that exceptional expenditures occurred in the first half of the 8th century. The most likely candidate is the program of establishment of Buddhist temples across Japan, including the construction of one the largest of temples built in a Buddhist country in the 8th century. 4. Estimating public expenditures in large-scale tumuli and Buddhist temples
This section attempts to assess changes in tax pressure in the late-Kofun period and the Asuka-Nara period using information on expenditures required for the building of religious complexes. We need a yardstick in order to gauge the magnitude of these expenditures. For that purpose, we first estimate the value of public expenditures in large-scale tumuli of late Kofun period. The comparison with Nara period is made possible by adopting as common numéraire the number of days worked (unskilled labourers equivalent). The calculation of religious public expenditures will also allow us to assess to what extent the massive program of religious capital formation of the mid-8th century is consistent with the drop in estimates of tax pressures after 757 estimated by Sawada (1927).
The rationale for focusing on this particular type of capital formation is that available evidence suggests that other type of expenditures related to public works remained rather stable, and that the political centralization resulted in a decline in military expenditures (including corvée) between the 5th and the 8th century. Yamato rulers had at least an indirect control over other regions and they did not face any external threat. The pacification expended to the major part of the archipelago in the Asuka-nara period. The construction of large cities such as Nara (710) also implied massive investments but these were to a large extent private expenditures of the social political elite that used to be scattered all over the country and became concentrated in one particular site as a result of the centralisation of political power.
We first use information on the number and size of the major large-scale tumuli, and on benchmark information on labour inputs required for building Nintoku kofun, one of the biggest tumuli, located in present-day Osaka prefecture.22 Kofun period polities were still regional entities rules by chieftains, with a high degree of social stratification in the Kinai region, rather than a State with direct control of the entire archipelago. It is therefore relevant to generate estimates of expenditures at the province level measured as number of working days of unskilled workers relative to the total population of each area (the calculation of labour inputs is presented in appendix 3).
Assuming that able body male adults accounted for one fourth of total population, the average burden in the Kinai region would have been between around 5 days per year in early, mid and late Kofun periods, respectively. 23 At 240 working days per year and with an income per day worked identical throughout the year, the tax equivalent would have been around 2% of income from labour. The implied tax pressure calculated in the same way for the provinces surrounding the Kinai region is below 1% and even lower for the rest of the country. This is not surprising if we consider that military corvée necessarily accounted for a large share of the tax pressure in small-scale polities located in the periphery of the Kinai.
22 For want of accurate information, we exclude from the calculation artefacts buried in tumuli other than terracotta statues known as haniwa (see for instance: Miki and Miller 1960). In addition to these locally produced terracotta, prestige goods such as swords, mirrors, accessories, either locally produced or imported, have been commonly found in the best preserved tumuli, along with copper and gold ingots. 23 This calculation does not take into account adult female labour force but is also overlooks the fact that other artefacts than Haniwa were buried in tumuli. It can be considered that these two shortcomings offset each other to some extent.

This version: 27 March 2014 11
We use now benchmark information on building techniques in the Asuka-Nara period to calculate total public expenditures related to the construction of Buddhist temples in the first half of the 8th century, and to estimates tax pressure implied by theses public works. By contrast with Kofun period tumuli that required mostly unskilled work, capital formation in Buddhist temples was extremely skill intensive. Asuka-Nara period architecture also employed large volumes of timber and metal. For these two reasons, total expenditures are first calculated in copper coins and then converted into number of working days of unskilled workers.
The two best-documented projects are the Naniwanomiya complex (Obayashi Gumi 1989), a palace located in present-day Osaka prefecture during the Asuka period (see appendix 5), and the Todaiji complex built in the capital during the Nara period (Tsutsui 1944). A comprehensive estimation of the total cost of public capital formation in Buddhist temples and their fiscal implications is possible for the period of construction of the Todaiji complex in Nara, between 743 and 751. This project included a monumental building harbouring a massive 15 m high statue of Buddha made in bronze and weighting around 450 tons, which was at that time the biggest statue of Buddha in the world. In addition to material resources, more than 2 millions working days were spent for the building of the temple and the great statue of Buddha (1,665,071 for woodwork and 514,902 for metalwork).24 Material resources used included large amounts of copper, tin, mercury, and charcoal (Table 2). Labour inputs and material are converted in copper coins using available information on prices and assuming that most of the workers were skilled craftsmen receiving an average of 50 mon (copper coins) per day.25 The total cost is around 534 million copper coins (109 for labour inputs, and 425 for charcoal and metal, including gold).
Table 2. Metal and charcoal used in the construction of the Todaiji Buddhist complex (in kg)
Copper Tin Gold Mercury Charcoal
Statue of Buddha* 443,736 7,571 392 2198 999,360 Tower acroterium 45,301 246 57 Temple bell 31,608 1,380
Source: Tsutsui (1944). Notes: calculated with the following conversion rate in metric: 1 kin = 16 ryo = 160 monme = 600g (1斤=16両=160匁=600g) ; 1 monme = 10 bu = 3.75 g (1匁=10歩=3.75g); weight of charcoal calculated assuming 60 kg per koku in the Nara period.
The construction of the Todaiji required large financial resources that, according to
contemporary sources, were founded in part by private contributions for the purchase of material: 372,075 donators were recorded for gold and 51,590 for lumber.26 Since the 449 kg of gold were used for this project (392 for the statue and 57 for the tower acroterium), the average contribution per donator was around 1.2 gram. On the basis of a figure for unskilled daily wage of 10 copper coins of around 4 grams, this average contribution would account for the equivalent of unskilled workers’ labour reward for around 30 days).27 The very large
24 Tsutsui (1944), 33-38. 25 The nominal wages of unskilled and skilled workers remain fairly stable from Nara period to the 15th century at 10 mon for unskilled workers, and 50 and 100 for skilled workers (2 skill levels identified). The first copper coins and silver coins (weighting approximately 4 and 5 grams) minted in Japan are dated 708 (Fujii1996). 26 Chishiki means a donator/donation of money and goods for the purpose of accumulating good deeds for Buddha. In some cases, it includes donators’ physical work. Considering the cost of shipment of lumber, and the fact that the Kinai region probably still had primary forests, most of the procurement was local. The newly introduced architectural techniques required large dimension high quality hardwood lumber. 27 With a tentative exchange rate of 100 copper coins for one silver coin, and 10 g of silver for 1 g of gold.
This version: 27 March 2014 12
number of donators clearly indicates that contributions were obtained from provinces outside the Kinai region. Assuming an average of 5 persons per household and one donator per household, the total number of donators implies that around 40% of Japanese households contributed (total Japanese population was around 5,5 million in 725 according to Kiro’s estimates). Buddhism was not yet widespread among commoners; even in the Kinai region, it remained until the 9th century the religion of the social elite. These “donations” were in fact compulsory and should be therefore regarded as an exceptional tax, which is consistent with the information reported by Sawada (1927) regarding “compulsory state loans” (suiko) accounting for 26.8% of total tax pressure that was entirely phased out after 757 (Table 1).
Since the construction of Todaiji lasted for eight years (743-751), the average expenditure per year was around 67 million copper coins.28 This cost can be compared to some guesstimate of the monetary value in copper coins of a subsistence level GDP of Yamato province (where the Todaiji was located), the Kinai region, and Japan as a whole. With a daily wages received by unskilled workers of around 10 mon per day or around 2 sho rice (around 3 kg, equivalent to around 6kg of barley), and assuming 240 days worker per year, the yearly purchasing power was sufficient to support 2 adults and 3 children. With self-consumption of other foodstuff taken into account, the 10 mon daily wage rate can be regarded as slightly above subsistence level (480 mon per capita per year). The implied subsistence level total GDP in 725 can be calculated on the basis of population figures reported in table 1: the result is therefore 439 million mon per year for Yamato province, 960 for the Kinai, and 4332 for Japan as a whole.
The average yearly expenditures for the construction of the Todaiji complex were equivalent to 54% the GDP of Yamato province, 20 % of the GDP of the Kinai, but only 2% of Japanese GDP. The result of this calculation confirms that the financing of large-scale projects such as the Todaiji was manageable only if relying on tax revenues collected from all over Japan including corvée labour of skilled workers.29 Due to high transportation costs, the shipment of grains from outside the Kinai region or surrounding provinces was uneconomical. Tax payments of provinces were made in bronze, iron, or gold, or relatively expensive items (fish, paper, textile product, etc.).
The measurement of the tax burden should also take into account public expenditures related to the construction of other local Buddhist temples during the same period. The promotion of Buddhism as religion of the State resulted in 743 in an institutionalization of local regional representatives under the authority of the Buddhist hierarchy based in Nara. In parallel to their contribution to the construction of the Todaiji project, local authorities were required to building a major monastery in each province (Ishida 1975). The local provincial branch of the countrywide Buddhist system was identified as Kokubunji. In addition, each province also had a major nunnery temple that was identified as Kokubun-niji. The cost of building Kokunbunji, Kokubun-niji and other temples is estimated by extrapolating on the basis of the cost per square meter of Todaiji. Information on average size of Kokubunji and Kokubun-niji can be derived from detailed information available for several provinces (see appendix 5). These additional expenditures accounted for 88% of the value of Nara’s Todaiji. For Kokubunji and Kokubun-niji, it is assumed that their construction
28 This figure does not include the cost of lumber for which no information is available. Lumber is described as obtained from “donators”. 29 Hida province, located in a mountainous areas of central Japan, was obliged to send 10 conscripted carpenters from Hida (Hida no takumi) to the capital from every 50 houses in exchange from tax exemption; the province had little grain surplus but the locals were renowned for their skill in woodcraft. The carpenters posted in the capital received from local authorities a daily allowance of 2 sho rice (around 3 kg) for their current expenses (which was above the daily income of unskilled workers). They rotated every year. Around 100 Hida carpenters were present in Nara at any given time and the same practice persisted in Heian period (with posting in Kyoto).

This version: 27 March 2014 13
occurred during the entire Nara period between 710 and 794 (95 years). The same time span is also used for other temples, implying an average of 6.44 temples per year. When converting these expenditures into number of working days of unskilled workers (at 10 copper coins per day), we can measure an average tax pressure related to the construction of the Todaiji per male worker. Since the burden was spread across Japan, the figure is around 6 days per year during the period of construction (743 to 751). But it this level of expenditures lasted only during a period of 8 years and expenditures related to religious capital formation drastically declined thereafter.
Adding other local temples, and assuming that these local religious complexes were funded only by local (province level) fiscal resources would add at most 2 days per male worker per year. Exceptions are Yamato and Kawachi provinces, at around 7 days, but in these two cases, it is likely that additional resources used for building tumuli originated from neighbouring provinces; the average for the Kinai is around 5 days per year. For the core region, the tax pressure related to religious capital formation remained therefore rather stable. But the tax burden related to Buddhist religious projects was much higher than for the building of tumuli in late Kofun period in the rest of the country (Figure 2).
Although we do not have information on public expenditures other than the building of tumuli in late-Kofun period, there is little doubt that total formal tax pressure was lower in the 6th century than the figures implied by data collected by Sawada (1944) for the early 8th century. In addition, since religious capital formation accounted only for a small share of public expenditures, including during the construction of the Todaiji in the period 743-751, the high level of taxation in Nara period that inferred in the previous section from data collected by Sawada (1944), 25.9% of rural household income (and 19.5% after 757), was largely caused by the development of an administration modelled after Tang China. The major part of the tax pressure after 757 can be regarded as equivalent to the cost of the bureaucracy that was mainly located in the capital city (i.e. in Nara after 710). Nevertheless, it appears that the new social order of the Asuka-Nara period was well accepted. Our conjecture is that the willingness to accept a high tax pressure could be explained by the role played by Buddhism as pacification device reducing the exposure of commoners to warfare-related risks, while improving social stability, property rights, and contract enforcement.30
30 Buddhist temples became rapidly major owners of land and other physical assets.

This version: 27 March 2014 14
Figure 5: Estimates of public expenditures in the construction of major religious complexes Sources: labour inputs: see text; population data from Kito (1996).

This version: 27 March 2014 15
5. Conclusion
We proposed in this paper a cost-benefit analysis of political centralization and urbanisation based on institutional and quantitative information on public revenues and expenditures. Our findings emphasize the importance of changes in the tax system (in particular the decline in military corvée), the cost of the Chinese-style bureaucratic system, and the role of Buddhism as pacification device. But it is also worth considering available information on the biological standard of living of rural commoners evolved during the Asuka-Nara period. One may wonder, in particular, if it is possible to reconcile a picture of rising tax pressure, from less than 4 or 5% of income in early 6th century, even in the core Kinai region31, to above 15% in the 8th century, and estimates of per capita GDP only 20% higher than subsistence level for Nara Japan? A possible explanation could lie in changing food consumption pattern, particularly if lower income households shifted away from relatively expensive foodstuffs during the Asuka-Nara period and substituted for less expensive staple grains (barley, wheat, and buckwheat).
Meat consumption drastically declined in Japan in the 7th and 8th century. The received wisdom is that this change occurred as a result of the proclamation in 675 by Emperor Tenmu of a ban on meat diet32. Archeological evidence shows that swine animal husbandry was common in Japan during the Kofun period, and that pork (not only the flesh of wild boars but also that of domestic swine), was part of the standard diet (Crawford, Takamiya, 1990; Anezaki 2007). The Wei Zhi Chinese chronicle indicates that Japanese people of the 3rd century were meat eaters and that it was customary in Yamatai to abstain from meat and stay idle during ten days of mourning, confirming that meat was regarded as part of the standard diet.33
However, meat consumption remained common in the western and northern peripheries (in particular pork in Kyushu and wild boar and bear in Northern Honshu) and the ban never really applied to game consumed by residents of mountainous areas and by part of the social elite. Wild boar, bear, and deer remained hunted and consumed during the entire period of official prohibition of meat consumption, that is until the start of Meiji era in the late 19th century, and the skin of these animal was employed in handicraft. For instance, Engi-shiki, a compilation of laws published in 967, mentions skins sent to Kyoto as a tax product.34
It is likely that the prohibition of meat consumption that was ostensibly associated with Buddhism35, was in fact motivated by difficulties in provisioning the political capital. The social elite, and more generally the urbanites, relied on products from maritime fisheries (herring in particular) for animal protein intake and on rice, a prestige food, as staple and for the processing of sake. The size of Nara, around 74,000 residents, resulted in a demand of around 10,000 tons of rice; a volume that can be estimated to around half of the rice output of Yamato province, in which Nara was located. High transportation costs rendered the shipment of rice from outside the Kinai region or the closest surrounding provinces uneconomical.
In practice, the prohibition of meat consumption probably took the form of restrictions on animal husbandry in the Kinai region and therefore of the use of non-rice staples (in 31 Assuming that the building of tumuli accounted for around half of public expenditures (including military expenditures mostly based on corvée). 32 Ujitani (1988, 268). 33 Ishihara (1985, 46). 34 Kuroita (1974, 586-587). 35 More precisely, ban on consumption of meat of terrestrial mammals. A ban on meat consumption applying to the entire population seems specific to Japanese Buddhism. It was not directly related to Buddhism, as demonstrated by the consumption of meat products in the same period among Chinese, Koreans, Mongols and Tibetans converted to Buddhism.

This version: 27 March 2014 16
particular barley, millet, and buckwheat) as feed for swine and even to some extent poultry although the ban officially only applied to terrestrial mammals. The relative shortage of staple grains is also evidenced by measures restricting horse breeding in the Kinai region.36 A ban on pork consumption and a decline in horse breeding made non-rice staple available for human consumption.37 The consequence was that extracting a larger share of rice total output as tax was feasible, if socially acceptable.
If this interpretation is correct, the impact of the new institutions was not homogenous across Japan. Rural commoners of the Kinai region were probably the major losers while the remote regions were less affected because existing grain surplus in was not exportable due to excessive transportation cost and the ban on animal husbandry was not strictly enforced. It is therefore probable that the living standards of rural commoners remained stable in the periphery, while they benefited from the positive consequences of the spread of Buddhism.
36 The authorities promoted cultivation of wheat and barley as a solution to food shortage. But aristocrats were customary to purchase green wheat of barley as feed for horses. The response was periodically repeated prohibition of the sale of wheat or barley as feedstuff for livestock and the ban of the purchase by residents of the Kinai of horses originating from breeding districts in other regions (Ikata 1972, 240-261). 37 The unit price per kg of non-rice staples was lower than rice price, but their caloric and protein contents were comparable.

This version: 27 March 2014 17
Appendices Appendix 1:
Figure A1. Ancient Japanese provinces Source: http://mapsof.net/map/ancient-japan-provinces-map-japanese

This version: 27 March 2014 18
Appendix 2. Population estimates for Nara Japan Table A1. Population estimates for Japanese provinces (kuni) of the Kinai region and surrounding areas in around 1, 725, and 800 AD (in 1000 inhabitants)
1AD 725AD 800AD Yamashiro na 85.7 219.6
Yamato na 171.7 130.3 Kawachi na 87.9 94.2
Izumi na 26.4 26.7 Settsu na 85.7 112.8
Kinai total 30.2 457.3 583.6 Omi na 102.1 141.9 Iga na 19.8 37.3 Ise na 103.2 108.8
Shima na 15.4 6.5 Kii na 61.5 55.2
Awaji na 18.7 13.6 Harima na 107.6 145.7 Tanba na 74.7 87.4
Around Kinai 70.3 503.0 596.3 Japan as a whole 594.9 4512.2 5506.2
Source: Kito (1996).
This version: 27 March 2014 19
Appendix 3. Calculation of labour inputs required for building tumuli
We use information for the number and size of tumuli for each district corresponding to Asuka-period provinces that were presumably territorial units already in the Kofun period. The total number of large-scale tumuli (i.e. length above 15 meters38) was particularly large in the Kinai (Table 2), especially in the core Yamato province, as well as in the smaller provinces of Yamashiro (an area covering part of present-day Kyoto prefecture), and in Kawachi and Izumi (both covering part of present-day Osaka prefecture).39
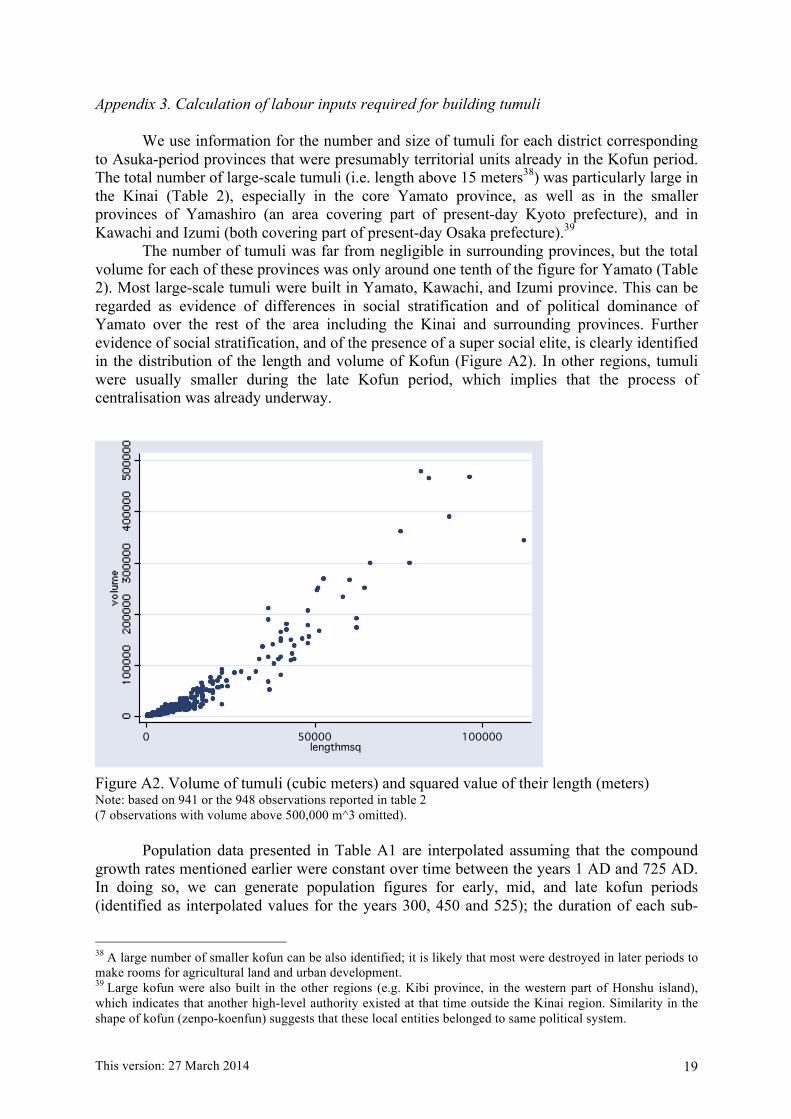
The number of tumuli was far from negligible in surrounding provinces, but the total volume for each of these provinces was only around one tenth of the figure for Yamato (Table 2). Most large-scale tumuli were built in Yamato, Kawachi, and Izumi province. This can be regarded as evidence of differences in social stratification and of political dominance of Yamato over the rest of the area including the Kinai and surrounding provinces. Further evidence of social stratification, and of the presence of a super social elite, is clearly identified in the distribution of the length and volume of Kofun (Figure A2). In other regions, tumuli were usually smaller during the late Kofun period, which implies that the process of centralisation was already underway.
Figure A2. Volume of tumuli (cubic meters) and squared value of their length (meters) Note: based on 941 or the 948 observations reported in table 2 (7 observations with volume above 500,000 m^3 omitted).
Population data presented in Table A1 are interpolated assuming that the compound
growth rates mentioned earlier were constant over time between the years 1 AD and 725 AD. In doing so, we can generate population figures for early, mid, and late kofun periods (identified as interpolated values for the years 300, 450 and 525); the duration of each sub-
38 A large number of smaller kofun can be also identified; it is likely that most were destroyed in later periods to make rooms for agricultural land and urban development. 39 Large kofun were also built in the other regions (e.g. Kibi province, in the western part of Honshu island), which indicates that another high-level authority existed at that time outside the Kinai region. Similarity in the shape of kofun (zenpo-koenfun) suggests that these local entities belonged to same political system.
0 50000 100000lengthmsq

This version: 27 March 2014 20
period is 200, 100 and 40 years, respectively (200 to 400 AD, 400 to 500 AD, and 500 to 540 AD, respectively). On average for the entire Kinai region, the figure is fairly constant over time, between 3.2 and 3.9 per resident.
Table A2. Number of large-scale tumuli in the Kinai region and surrounding provinces
Province
Early period (3rd and 4th century)
Middle period (5th century)
Late period (6th century)
Yamashiro 18 28 37 Yamato 62 75 135 Kawachi 46 31 26
Izumi 6 46 13 Settsu 20 35 19 Omi 12 42 34 Kii 2 20 34
Harima 35 22 25 Tanba 12 51 52 Tajima 0 6 4 Total 213 356 379
Source: Ishikawa (1989), pp. 155-181. Table A3. Total volume of large-scale tumuli in the Kinai region and surrounding provinces (in cubic meters)
Province
Early period (3rd and 4th century)
Middle period (5th century)
Late period (6th century)
Total
Yamashiro 228,568 266,258 102,708 597,534 Yamato 3,367,825 2,276,432 1,205,987 6,850,244 Kawachi 556,497 3,152,310 625,219 4,334,026
Izumi 280,907 3,266,620 17,969 3,565,496 Settsu 361,891 693,027 140,606 1,195,524 Omi 167,672 187,393 56,225 411,290 Kii 1,291 35,622 87,473 124,386
Harima 266,868 173,748 16,748 457,364 Tanba 412,469 206,176 44,058 662,703 Tajima
63,159 8,346 71,505
Total 5,643,988 10,320,745 2,305,339 18,270,072 Source: same as table 1.
Estimation of labor input based on the study by Obayashi Gumi (1985) indicates that the building of this kofun, which has a volume of 1,405,866 cubic meters, required 6,807,000 working days (mostly unskilled workers) using techniques of the kofun period.40 The average is therefore 4.84 cubic meter per worker per day. The actual project duration reported is 15 years and 8 months; assuming 20 working days per month (apart from festivals, work had to be suspended during periods of heavy rain) the work force employed would have been of 1,810 people per day on average.
40 Including the production of Haniwa (15,000 pieces) that is described as the sole activity requiring skill work. Obayashi Gumi also estimated the cost of building and concluded that total expenditures using Kofun period techniques would have been 40 times more expensive in 1985 (at current Japanese factor prices) than with recent techniques. Since Japanese per capita GDP in 1985 was 15331 international constant USD of 1990, a naïve back of the envelope calculation yield 385 USD per capita in Kofun Japan that is close to substance level.

This version: 27 March 2014 21
Appendix 4. Estimation of labour inputs required for the construction of Naniwanomya palace (ca. 652) Labour inputs were calculated by type of occupation by researchers of Obayashi Gumi, a company specialized in construction and public works.41 They also compared labour inputs required using Asuka-Nara period techniques and using present-day techniques. The result indicates that labour productivity gains have been very limited (in some cases, the technique remained exactly the same. Most workers involved in the construction of Buddhist temples were highly skilled craftsmen. The Naniwanomya complex was composed of four major groups of buildings.42 Since the skill composition was comparable for the different parts of the complex, we can compare labour inputs per square meter of intercolumniation area: for the elements of the Naniwanomya complex, the figure is in a range between 40 and 112 working days per square meter, with an average for the entire complex of around 65. The total number of working days for the entire complex at 1,447,490, i.e. around 6,000 working years at 240 days per year, or 600 working per year over a decade.
A first impression is that the overall number of workers could be compatible with public revenues available at the level of Izumi province in which the Naniwanomya complex is located. However, since the skill premium in Nara period was around 5 (or 10 if highly skilled workers are taken into account), payment of salaries to skilled workers required financial resources equivalent to yearly income of 3000 to 6000 unskilled workers. This is much higher than the 1,800 mostly unskilled workers involved in the building of Nintoku Kofun, one of the largest tumuli of the Kofun period, and therefore suggests that the funding relied on public revenues from other provinces, including outside the Kinai region.
41 These craftworks are carpenter, roofer, plasterer, cabinet carpenter, painter, metal workers, mason, and tiler. In addition, total number of labour input for soil preparation and supervision are also available. 42 Suzakumon, Daigokuden, Chodoin, and Dairidensha. The Daigokuden itself consisted in four buildings for which detailed information is also available (these four building are Daigokuden, Daigokuden Koden, Dairi, and Dairi Zenden).

This version: 27 March 2014 22
Appendix 5. Estimates of expenditures for the construction of Kokubunji and Kokubuniji, (provincial temples) in Nara period
The typical area of Kokubunji is 4 square cho43 (2 cho east to west by 2 cho north to south).44 Some Kokubunji were larger or smaller than typical Kokubunji.45 For example: Kawachi: 5 square cho (2 cho east to west by 2.5 cho north to south); Kazusa: 13.5 square cho (3 cho east to west by 4.5 cho north to south); Musashi: 44 square cho (8 cho east to west by 5.5 cho north to south).
According to Todaiji Sankai Shihizu 東大寺山堺四至図 (the map of Todaiji and mountains) made in 756, the original size of Todaiji in Nara period was approximately 64 square cho (8 cho east to west by 8 cho north to south)46. Thus, the typical size of Kokubunji is 6.3% of Todaiji. But, this is a comparison of the total site area.
The typical size of kondo金堂 (mail hall) of a Kokubunji is 4 ken long by 7 ken wide47. With an intercolumniation or 11.5 shaku48, kondo of Kokubunji was approximately 340.0 m2. Ancient building records on Todaiji show that its original size of kondo was 17 jo long by 29 jo wide (51.5 m by 87.9 m 4526.9 m2)49. Therefore, the size of Kokubunji is 7.5% of Todaiji, by calculating in mail facility.
The scale of Kokubun-niji was unclear, but it is thought that Kokubun-niji would to be smaller than Kokubunji in some degree. The clue to find the size of nunnery temple is to compare the facility of between Kokubunji and Kokubun-niji. Typical size of kondo in Kokubun-niji was 4 ken long by 5 ken wide, and 4 ken long by 7 ken wide in Kokubunji50. If we use the scale of kondo as a proxy of the site area, and thinking each interval is same length, the typical size of Kokubun-niji is 71.4% of Kokubunji.
On average, the size of a representative kokubunji can be regarded as equivalent to 7.5% of that of Nara’s Todaiji, and 3.6% for kokubun-niji (see appendix A for details). Other relatively smaller temples were built in the provinces during the Nara period; their total number is estimated at 309 established during the period 710-794, of which 115 were located in the Kinai region (Tanaka 1978, Yoshida 1986). According to Ishida (1975), a representative local temple covered an area of 1-9 square cho51 (1-3 cho east to west by 1-3 cho north to south), with most of local temples of an area of around 1 square cho.52
43 1 cho = 360 shaku = approximately 109.09 m (1町=約 109.9m). 44 Tsunoda (1938, 190-191). In this sentence, cho町 is not a unit of area but a length, 1 cho = approximately 109.09 m (Abe 2006, 108-109). 45 Tsuboi (1985,162). 46 Ishida (1959, 31). This area includes two small mountains (Wakakusayama若草山 and Kasugayama春日山). 47 Ishida (1959, 69-74). Ken間 is not a unit of length but a proportion for intervals between the pillars of traditional Japanese buildings. So, each length of intervals is not always same in one facility (Abe 2006, p.51). 48 1 shaku 尺 = 10/33 m (Abe 2006, p.51). Computing from the list of the known intercolumniation of architectural remains in Kokubuni (Ishida 1959, pp.71-71), mode is 11-12 shaku. 49 Tsutsui ed. (1944, 34-35). 1 jo丈 is 100/33 m (Abe 2006, p.81). 50 Tsunoda (1938, 190-191). 51 Nara period units are converted into metrics as follow: 1 square cho = around 119.9 square meters. 52 Other large structures were Dazaifu大宰府 (in Chikuzen province, northern Kyushu) built in the late 7th century, and Tagajo 多賀城 (in Mutsu province, in northern Honshu) built in early 8th century). Both had the function of provincial government office and military stations. From Asuka to Heian period, a network of castles (saku 柵) was built in Mutsu and Dewa province, in the north of Honshu island, to protect settlers from the local Emishi population of hunters and gatherers in frontier areas.

This version: 27 March 2014 23
References Abe, T. 阿部猛 (2006). Doryoko no Jiten [Encyclopedia of weights and measures] 度量衡の事典, Tokyo: Doseisha.
Amakasu, K. (1977). The Significance of the Formation and Distribution of Kofun. Acta Asiatica. 31, 24-50.
Amemiya, T. (2007), Economy and Economics of Ancient Greece, Routledge, London. Anezaki, T. (2007). Pig exploitation in the southern Kanto region, Japan. International
Journal of Osteoarchaeology, 17(3), 299-308. Barnes, G. L. (1995). An introduction to Buddhist Archeology. World Archaeology, 27, 2,
Buddhist Archaeology, 165-182 Barnes, G. L. (2007). State Formation in Japan: Emergence of a Fourth-century Ruling Elite.
London, Routledge. Barnes, G. L., Nishida, S., and Okita, M. (2005). Geoarchaeological studies in Nara, Japan:
The integrated findings. Geoarcheology, 20, 8, 837-860. Bassino, J-P., Broadberry, S., Fukao, K., Gupta, B., and Takashima, M. (2012). Japan and the
Great Divergence, 700-1870, paper presented at Economic History Society Annual Conference, Oxford University, St Catherine’s College, March 30-April 1st, 2012.
Becker , G. (1965), A Theory of the Allocation of Time, Economic Journal, 125, 493–517. Broadberry, S., and Campbell, B. (2009) GDP per capita in Europe, 1300-1850. Paper
presented in the 15th World Economic History Congress, Utrecht, 3-7 August. Broadberry, S., Guan, H. Li, D.G. (2012). China, Europe, and the Great Divergence: a study
in historical national accounting. Paper presented at the 2012 Asian Historical Economics Conference, Tokyo, 13-15 September.
Crawford, C.W., Takamiya, H. (1990). The origins an implications of late prehistorical plant husbandry in northern Japan. Antiquity, 64 (245), 889.
Earle, T. ed. (1991). Chiefdoms: power, economy, and ideology. Cambridge, Cambridge University Press.
Farris, W. W. (1995). Population, disease, and land in early Japan 645-900. Cambridge (Mass.), Harvard University Press.
Farris, W. W. (1996) Heavenly Warriors: The Evolution of Japan's Military: 500–1300. Harvard: Harvard University Press.
Farris, William W. (2006). Japan’s medieval Population; Famine, Fertility, and Warfare in a Transformation Age. Honolulu: Hawai’i University Press.
Farris, W. W. (2009). Daily Life and Demographics in Ancient Japan, Ann Arbor, Michigan: Center for Japanese Studies, University of Michigan.
Folvdari, P., van Leeuwen, B. (2012). Comparing per capita income in the Hellenistic world: the case of Mesopotamia. Review of Income and Wealth, 58(3), 550-568.
Fujii, N. (1996). The first coins in Japan, Monetary and Economic Studies, Bank of Japan, 14(1). http://www.imes.boj.or.jp/cm/english_htmls/feature_gra1-1.htm
Goldsmith, R. W. (1984), An Estimate of the Size and Structure of the National Product of the Early Roman Empire, Review of Income and Wealth, 30, 263–88, 1984.
Gronau, R., 1977. Leisure, home production and work—the theory of the allocation of time revisited. Journal of Political Economy 85, 1099–1123
Gronau, R. 1980. Home production – A forgotten industry. Review of Economics and Statistics, 62 (3), 408-416.
Guzman, R.A., Weisdorf, J. (2011). The Neolithic Revolution from a Price-Theoretic Perspective', Journal of Development Economics, 96(2), 209-219.
Hedetoshi, T. ed. 筒井英俊編, (1944), Todaiji yoroku 東大寺要録, Osaka: Zenkoku shobo.

This version: 27 March 2014 24
Ikata, S.鋳方貞亮, (1972), Nihon kodai kokumotsushi no kenkyu日本古代穀物史の研究 (Research on cereals in ancient Japan). Tokyo: Yoshikawa kobunkan
Inoue, M., (1993). The century of reform, in Brown, D. M., ed., The Cambridge History of Japan, volume 1: Ancient Japan. Cambridge: Cambridge University Press, 163-220.
Ishida, M.石田茂作, (1959), Todaiji to Kokubunji [Todaiji and Kokubunji] 東大寺と国分寺, Tokyo: Shibundo.
Ishida, M. 石田茂作 ed. (1975). Shinban Bukkyo Kokogaku Koza, dai 2 kan, Jiin [The Lecture of the Buddhist Archaeology, New Edition, vol.2, Temples] 新版仏教考古学講座 第 2巻 寺院, Tokyo: Yuzankaku.
Ishikawa, N. 石川昇 (1989). Zenpokoenfun no Kenkyu [The Study of Zenpokoenfun]前方後円墳築造の研究, Tokyo: Rokko Shuppan.
Ishihara, M. 石原道博 ed. (1985). Gishi-Wajinden, Gokanjo-Toiden, Sosho-Wakokuden and Zuisho-Wakokuden [The Record of Wa in Wei Chih, Houhan Shu, Sung Shu and Sui Shu: new edition] 新版 魏志倭人伝・後漢書東夷伝・宋書倭国伝・隋書倭国伝, Tokyo: Iwanami shoten.
Iyanaga, T. 彌永貞三, (1980), Nihon kodai shakai keizaishi kenkyu 日本古代社会経済史研究, Tokyo: Iwanami shoten.
Karaman, K.K., Pamuk, S. (2010). Ottoman State Finance in Historical perspective, 1500-1914. Journal of Economic History, 70(3), 593-629.
Keeley, L.H. (1996). War before civilization; the myth of the peaceful savage. Oxford University Press.
Kidder, Edward J. (2007). Himiko and Japan’s Elusive Chiefdom of Yamatai: Archaeology, History, and Mythology. Honolulu, University of Hawai‘i Press.
Kinoshita, M. 木下正史 (2003). Fujiwarakyo [The Fujiwara palace] 藤原京 . Tokyo: Chuokoron shinsha.
Kishi T. 岸俊男 (1984). Kodai Kyuto no Tankyu [The Search for the Ancient Palace] 古代宮都の探究. Tokyo: Azekura Shobo.
Kito, K. (1994). Kodai no Seikatsu [Life in the Ancient Period] 古代の生活. Kito, K and Imaizumi, Y. 鬼頭清明・今泉淑夫 eds. Seikatsushi I [The History of Life, vol.1] 生活史 I. Tokyo: Yamakawa Shuppansha.
Kito, H. 鬼頭宏 (2000). Jinko kara yomu Nihon no rekishi [Japanese history from a demographic viewpoint] 人口から読む日本の歴史. Tokyo: Kodansha.
Kleven, H.J. (2004). Optimal taxation and allocation of time. Journal of Public Economics 88, 545–557.
Kuroita, K. 黒板勝美 ed. (1974a). Kokanshiki, Koninsiki and Engishiki zenpen [The Kokan, Konin and Engi codes, vol.1] 交替式・弘仁式・延喜式前編. Tokyo: Yoshikawa kobunkan.
Kutoita, K. 黒板勝美 ed. (1974b). Engishiki: chuhen [The Enge code, vol.2] 延喜式 中編. Tokyo: Yoshikawa kobunkan.
Lo Cascio, E., Malanima P. (2009), “GDP in Pre-Modern Agrarian Economies (1–1820 AD). A Revision of the Estimates,” Rivista di Storia Economica, XXV, 387–415,
Maddison, A. (2007). Contours of the World Economy, 1-2030: Essay in Macro-Economic History. Oxford: Oxford University Press.
Milanovic, B. (2006). An estimate of Average Income and Inequality in Byzantium around Year 1000 Review of Income and Wealth, 52(3), 449-470.
Milanovic, B, Lindert, P.H., and Williamson, J.G. (2007). Measuring Ancient Inequality. NBER Working Paper 13500, National Bureau of Economic Research, Inc.

This version: 27 March 2014 25
Milanovic, B, Lindert, P.H., and Williamson, J.G. (2011). Pre-industrial inequality Economic Journal, 121(551), 255-272.
Miki, F and Miller R.A. (1960). Haniwa: the clay sculpture of protohistoric Japan. Tokyo, Tuttle.
Miura, H. and Takigawa, M. eds., 三浦周行・瀧川政次郎編, Teihon reishuge shakugi 定本令集解釈義, Tokyo: Naigai shoseki.
Mizoguchi, Koji (2009). Nodes and edges: A network approach to hierarchisation and state formation in Japan. Journal of Anthropological Archaeology, 28, 1, 14-26.
Miura, H. and Takigawa, M. 三浦周行・瀧川政次郎 eds. (1931). Teihon reishuge shakugi [Gathering information of Rei and Ritsu] 定本令集解釈義. Tokyo: Naigai shoseki.
Mizoguchi, K. (2009). Nodes and edges: A network approach to hierarchisation and state formation in Japan. Journal of Anthropological Archaeology, 28, 1, 14-26.
Obayashigumi大林組 ed. (1985). Oryo [Tomb of a King] 王陵. Tokyo: Obayashigumi. Obayashigumi大林組 ed. (1989). Naniwa no Miya [The Naniwa Palace] 難波宮. Tokyo:
Obayashigumi. Rhee, S., C. M. Aikens, S. Choi, and H. Ro. 2007. Korean Contributions to Agriculture,
Technology, and State Formation in Japan: Archaeology and History of an Epochal Thousand Years, 400 B.C.-A.D. 600. Asian Perspectives 46 (2), 404-59.
Sawada, G. 澤田吾一 (1927). Naracho jidai minsei keizai no suteki kenkyu [Quantitative studies on civil administration and economy in Nara dynasty] 奈良朝時代民政経済の数的研究. Tokyo: Tozanbo.
Saito, T. 斎藤忠, (1979). Inariyama Kofun [The Inariyama ruins] 稲荷山古墳, Kokushi Daijiten Hensan Iinkai 国史大辞典編纂委員会 ed. Kokushi daijiten dai 1 kan [Comprehensive Dictionary of the Japanese History; vol.1] 国史大辞典 第 1巻. Tokyo: Yoshikawa kobunkan. pp.742.
Scheidel, Walter ed. 2009. Rome and China: Comparative Perspectives on Ancient World Empires. Oxford University Press.
Scheidel, W. and Friesen, S. J. (2009). The Size of the Economy and the Distribution of Income in the Roman Empire. The Journal of Roman Studies, 99, 61-91.
Scott, J. C. (2010). The Art of Not Being Governed: An Anarchist History of Upland Southeast Asia. New Haven : Yale University Press.
Takao, K., Hayashiya, T. and Matsuura, R. 高尾一彦・林屋辰三郎・松浦玲 eds. (1968). Kyoto no rekishi 3 [History of Kyoto, vol.3] 京都の歴史 3. Tokyo: Gakugei shoin.
Takashima, M. (2013), Estimates of Agricultural Production in Ancient Japan, 725-1150, paper presented the International Workshop on World Economic History, Special Session: Government Policies and Trajectory of Japanese Economic Development from the 8th Century to the 20th Century, 8 November 2013, Kyoto University, Japan.
Takigawa, M. 瀧川政次郎 (1944). Ritsuryo Jidai no Nomin Seikatsu [Life in the Ritsuryo period] 律令時代の農民生活. Tokyo: Toe Shoin.
Tanaka, S. 田中重久, (1978). Naracho Izen Jiinato no Kenkyu [The Study of the Remains of Temples before Nara Period] 奈良朝以前寺院址の研究. Kyoto: Shirakawa Shoin.
Tsunoda, B. 角田文衛, (1938). Kokubunji no Kenkyu, Jo-kan [Study of Kokubunji, vol.1] 国分寺の研究 上巻. Kyoto: Kokogaku Kenkyukai.
Tsutsui, E. 筒井英俊 ed. (1944). Todaiji Yoroku [Records on Todaiji] 東大寺要録. Osaka: Zenkoku Shobo.
Tuboi, K. 坪井清足. (1985). Asuka no Tera to Kokubunji [Temples in Asuka and Kokubunji] 飛鳥の寺と国分寺. Tokyo: Iwanami Shoten.

This version: 27 March 2014 26
Ujitani, T. 宇治谷孟 ed. (1988). Zen Gendaigo Yaku Nihon Shoki; ge [Nihon Shoki; modern translation version, vol.2] 全現代語訳 日本書紀 下. Tokyo: Kodansha.
Xie Yuanlu 2005. Changes of Society and Economic System in the Tang-Song Dynasties, Research in Chinese Economic History, 2, 47-57.
Yoshida, Y. 吉田靖男 (1986). Gyoki to Ritsuryo Kokka [Gyoki and the Ritsuryo Government] 行基と律令国家. Tokyo: Yoshikawa Kobunkan.