pattern discovery - part i
TRANSCRIPT

Discovering Patterns Perfectly
Matching the Data
Cristian Vava, PhD*
•CEO of Innovatorium Technologies Corporation, Your Special Analytics Department
Scope
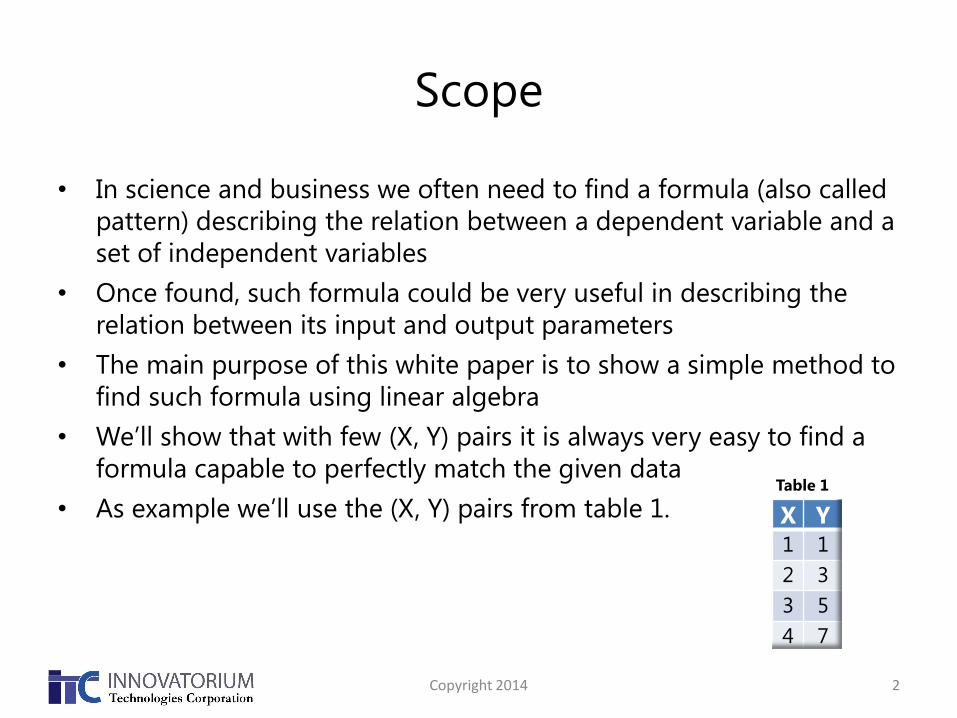
• In science and business we often need to find a formula (also called
pattern) describing the relation between a dependent variable and a
set of independent variables
• Once found, such formula could be very useful in describing the
relation between its input and output parameters
• The main purpose of this white paper is to show a simple method to
find such formula using linear algebra
• We’ll show that with few (X, Y) pairs it is always very easy to find a
formula capable to perfectly match the given data
• As example we’ll use the (X, Y) pairs from table 1.
Copyright 2014 2
X Y
1 1
2 3
3 5
4 7
Table 1
Formalizing the Pattern Design
When trying to find a mathematical pattern what we look for is a
function F which generates the values of Y from the values of X in such
a way as to match the given combinations (X1,Y1; X2,Y2; X3,Y3; X4,Y4).
Mathematically the relation can be written as:
Y1 = F(X1); Y2 = F(X2); Y3 = F(X3); Y4 = F(X4)
There are numerous ways to design the function F however, in general
for few pairs of data points the easiest and safest way is to use linear
algebra.
Copyright 2014 3

PATTERN DESIGN ALGORITHM
Copyright 2014 4
Generating Matrix
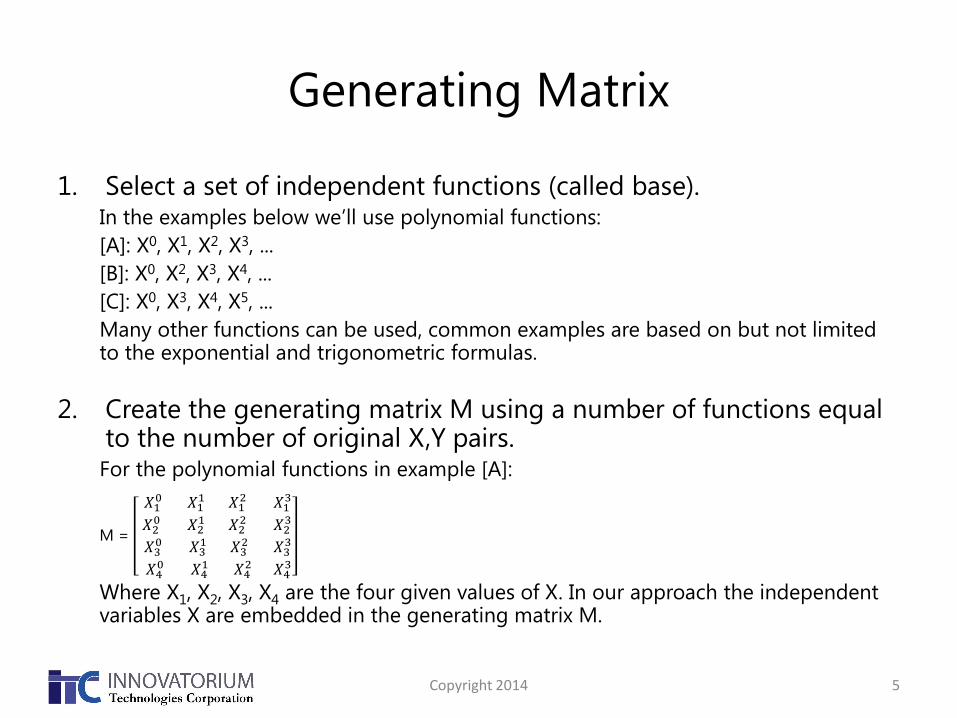
1. Select a set of independent functions (called base). In the examples below we’ll use polynomial functions:
[A]: X0, X1, X2, X3, ...
[B]: X0, X2, X3, X4, ...
[C]: X0, X3, X4, X5, ...
Many other functions can be used, common examples are based on but not limited to the exponential and trigonometric formulas.
2. Create the generating matrix M using a number of functions equal to the number of original X,Y pairs.
For the polynomial functions in example [A]:
M =
𝑋10 𝑋1
1 𝑋12 𝑋1
3
𝑋20 𝑋2
1 𝑋22 𝑋2
3
𝑋30 𝑋3
1 𝑋32 𝑋3
3
𝑋40 𝑋4
1 𝑋42 𝑋4
3
Where X1, X2, X3, X4 are the four given values of X. In our approach the independent variables X are embedded in the generating matrix M.
Copyright 2014 5

A Little Algebra
3. Create the output vector as:
4. Compute the coefficients [C]:
Here [ ]-1 represents the inverse of the
generating matrix M. In our algorithm M is
a square matrix so to be invertible its
determinant must be different from zero.
5. The pattern generating formula
becomes:
Where M is recreated for any set of X and
from now on C is a constant vector.
Copyright 2014 6
𝑌1
𝑌2
𝑌3
𝑌4
𝐶1
𝐶2
𝐶3
𝐶4
=
𝑋10 𝑋1
1 𝑋12 𝑋1
3
𝑋20 𝑋2
1 𝑋22 𝑋2
3
𝑋30 𝑋3
1 𝑋32 𝑋3
3
𝑋40 𝑋4
1 𝑋42 𝑋4
3
−1
*
𝑌1
𝑌2
𝑌3
𝑌4
Y = M * C

EXAMPLES
Copyright 2014 7
Example: Excel implementation [example A]
Copyright 2014 8
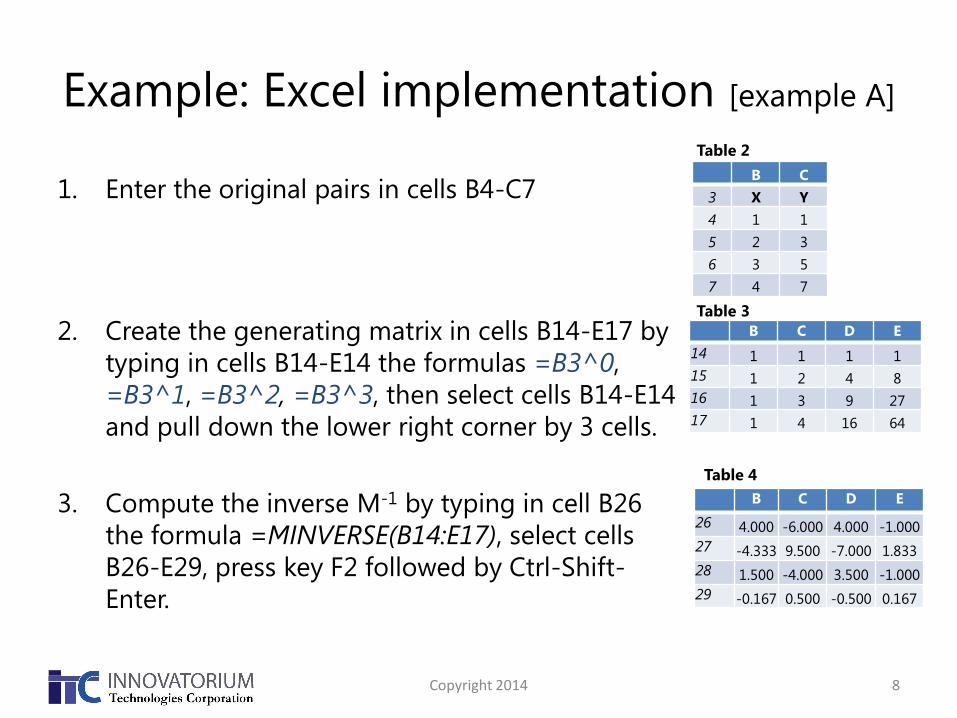
1. Enter the original pairs in cells B4-C7
2. Create the generating matrix in cells B14-E17 by
typing in cells B14-E14 the formulas =B3^0,
=B3^1, =B3^2, =B3^3, then select cells B14-E14
and pull down the lower right corner by 3 cells.
3. Compute the inverse M-1 by typing in cell B26
the formula =MINVERSE(B14:E17), select cells
B26-E29, press key F2 followed by Ctrl-Shift-
Enter.
B C
3 X Y
4 1 1
5 2 3
6 3 5
7 4 7
B C D E
14 1 1 1 1
15 1 2 4 8
16 1 3 9 27
17 1 4 16 64
B C D E
26 4.000 -6.000 4.000 -1.000
27 -4.333 9.500 -7.000 1.833
28 1.500 -4.000 3.500 -1.000
29 -0.167 0.500 -0.500 0.167
Table 2
Table 3
Table 4
Example: Excel implementation [A] - cont
Copyright 2014 9
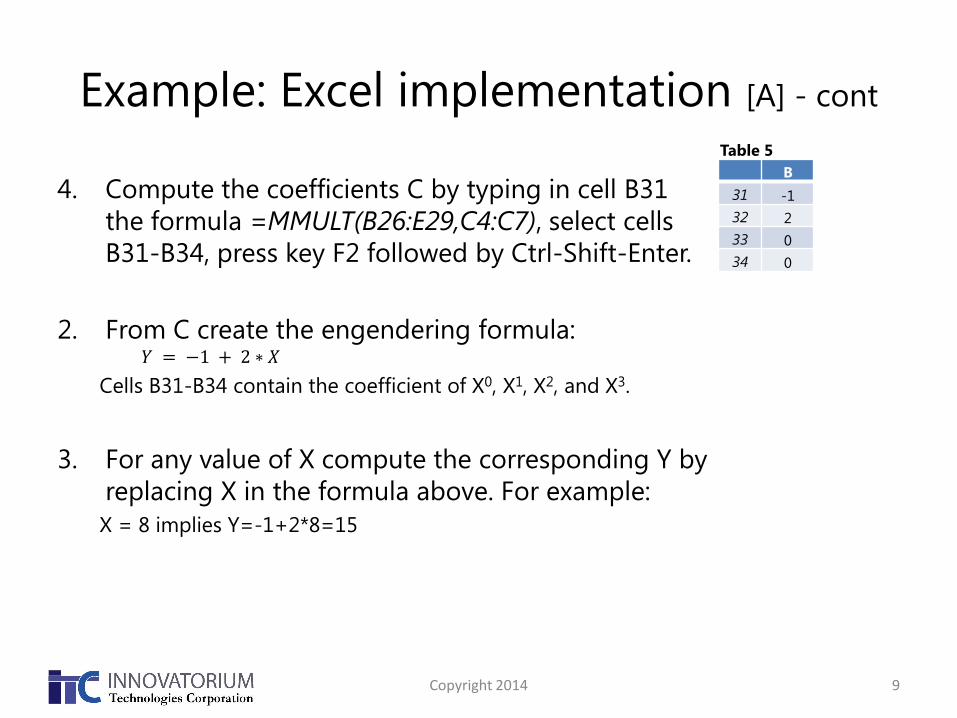
4. Compute the coefficients C by typing in cell B31
the formula =MMULT(B26:E29,C4:C7), select cells
B31-B34, press key F2 followed by Ctrl-Shift-Enter.
2. From C create the engendering formula: 𝑌 = −1 + 2 ∗ 𝑋
Cells B31-B34 contain the coefficient of X0, X1, X2, and X3.
3. For any value of X compute the corresponding Y by
replacing X in the formula above. For example:
X = 8 implies Y=-1+2*8=15
B
31 -1
32 2
33 0
34 0
Table 5
Examples of patterns
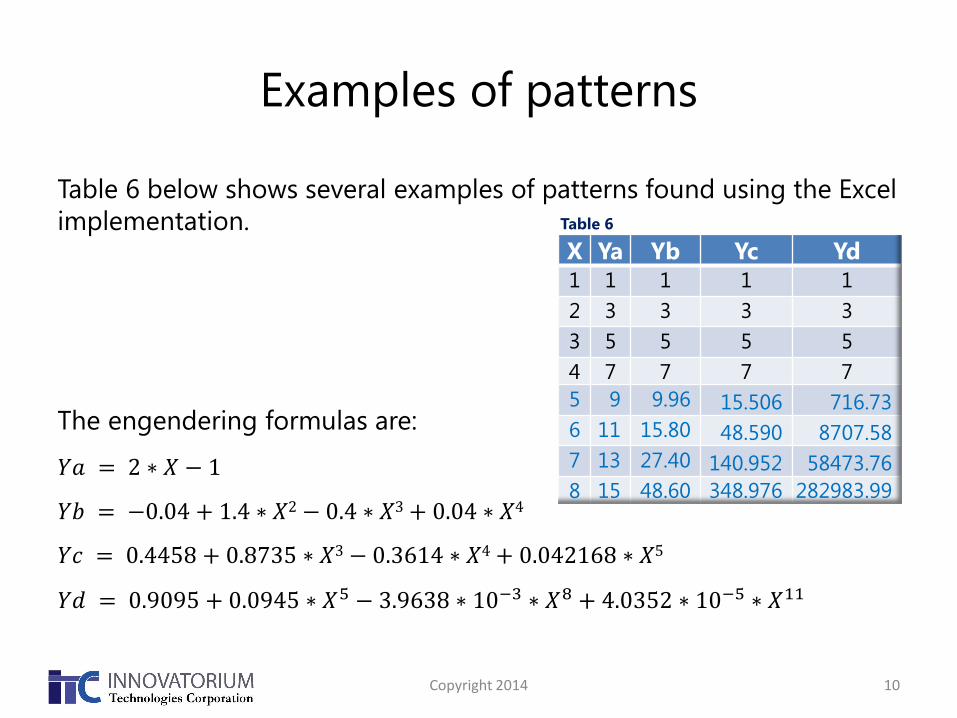
Table 6 below shows several examples of patterns found using the Excel
implementation.
The engendering formulas are:
𝑌𝑎 = 2 ∗ 𝑋 − 1
𝑌𝑏 = −0.04 + 1.4 ∗ 𝑋2 − 0.4 ∗ 𝑋3 + 0.04 ∗ 𝑋4
𝑌𝑐 = 0.4458 + 0.8735 ∗ 𝑋3 − 0.3614 ∗ 𝑋4 + 0.042168 ∗ 𝑋5
𝑌𝑑 = 0.9095 + 0.0945 ∗ 𝑋5 − 3.9638 ∗ 10−3 ∗ 𝑋8 + 4.0352 ∗ 10−5 ∗ 𝑋11
Copyright 2014 10
X Ya Yb Yc Yd
1 1 1 1 1
2 3 3 3 3
3 5 5 5 5
4 7 7 7 7
5 9 9.96 15.506 716.73
6 11 15.80 48.590 8707.58
7 13 27.40 140.952 58473.76
8 15 48.60 348.976 282983.99
Table 6
Example: R implementation [A]
Copyright 2014 11
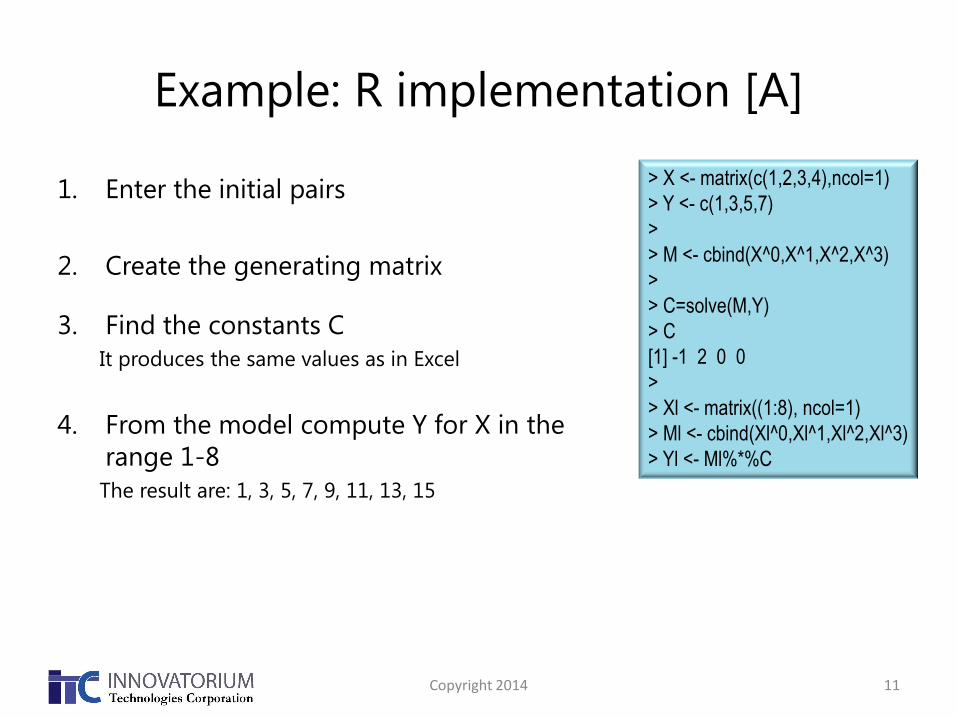
1. Enter the initial pairs
2. Create the generating matrix
3. Find the constants C
It produces the same values as in Excel
4. From the model compute Y for X in the
range 1-8
The result are: 1, 3, 5, 7, 9, 11, 13, 15
> X <- matrix(c(1,2,3,4),ncol=1)
> Y <- c(1,3,5,7)
>
> M <- cbind(X^0,X^1,X^2,X^3)
>
> C=solve(M,Y)
> C
[1] -1 2 0 0
>
> Xl <- matrix((1:8), ncol=1)
> Ml <- cbind(Xl^0,Xl^1,Xl^2,Xl^3)
> Yl <- Ml%*%C
Example: R implementation (cont.)
Copyright 2014 12
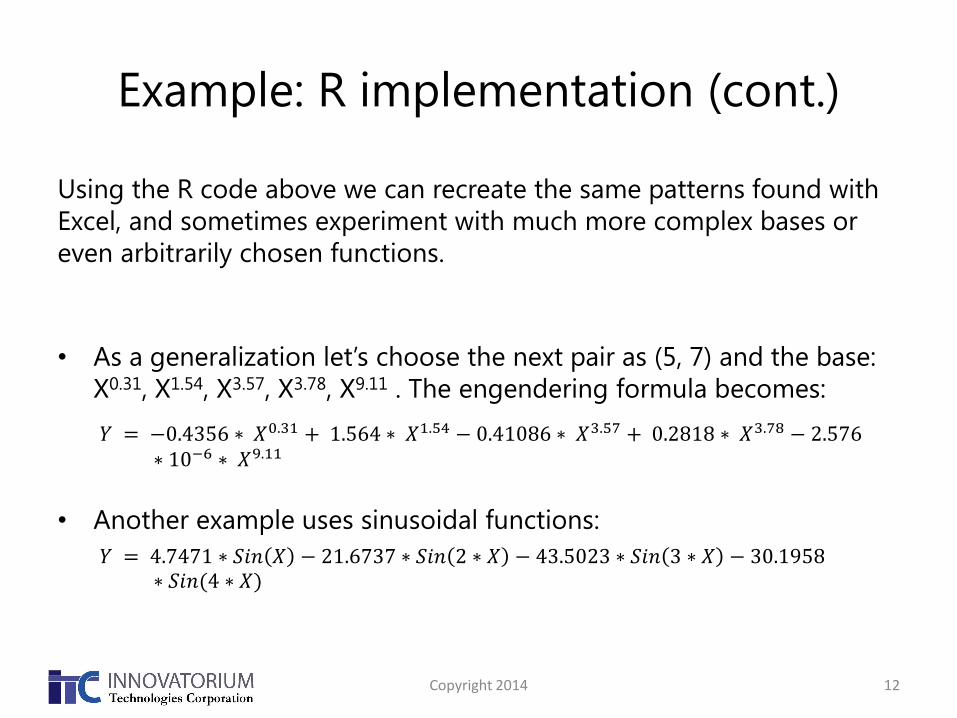
Using the R code above we can recreate the same patterns found with
Excel, and sometimes experiment with much more complex bases or
even arbitrarily chosen functions.
• As a generalization let’s choose the next pair as (5, 7) and the base:
X0.31, X1.54, X3.57, X3.78, X9.11 . The engendering formula becomes:
𝑌 = −0.4356 ∗ 𝑋0.31 + 1.564 ∗ 𝑋1.54 − 0.41086 ∗ 𝑋3.57 + 0.2818 ∗ 𝑋3.78 − 2.576∗ 10−6 ∗ 𝑋9.11
• Another example uses sinusoidal functions:
𝑌 = 4.7471 ∗ 𝑆𝑖𝑛 𝑋 − 21.6737 ∗ 𝑆𝑖𝑛 2 ∗ 𝑋 − 43.5023 ∗ 𝑆𝑖𝑛 3 ∗ 𝑋 − 30.1958∗ 𝑆𝑖𝑛(4 ∗ 𝑋)

CONCLUSIONS
Copyright 2014 13
Mathematical Perspective
• It is possible and generally easy to find a formula describing the
relation between the values of data pairs using simple algebra.
• The discovered pattern is not unique and in most cases it is possible
to find a matching formula using almost any type of base and even
almost any type of function, not only polynomial.
• Almost any value could be assigned to the next pair of data.
• The algorithm can be expanded for several independent variables.
• If the number of pairs becomes very large this method involves
tedious matrix manipulations and the result is too complex to have much practical value.
Copyright 2014 14
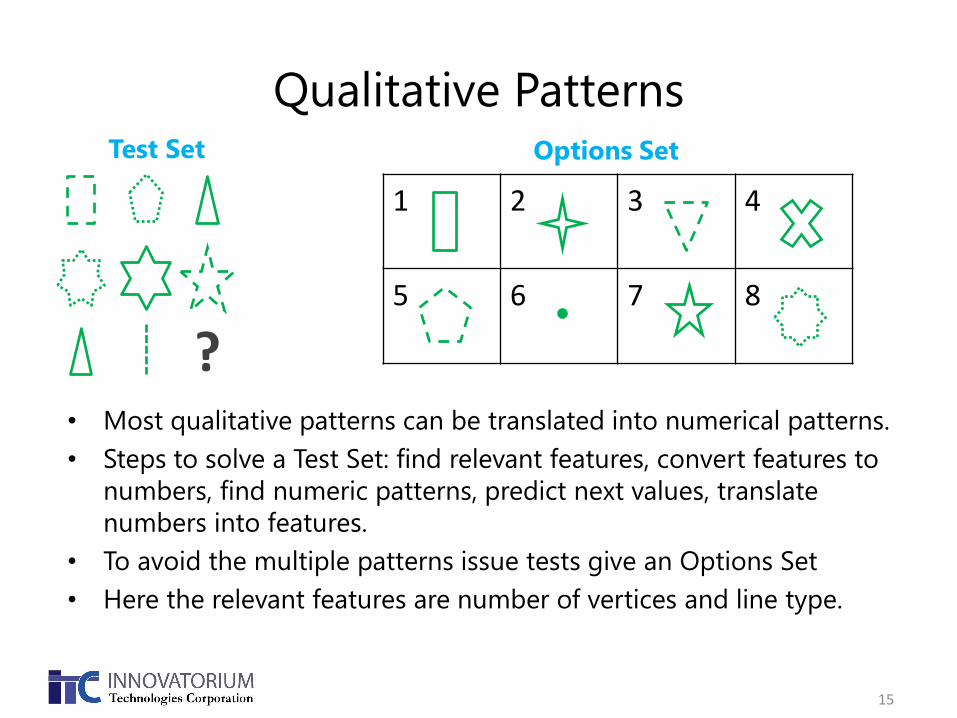
Qualitative Patterns
15
• Most qualitative patterns can be translated into numerical patterns.
• Steps to solve a Test Set: find relevant features, convert features to
numbers, find numeric patterns, predict next values, translate
numbers into features.
• To avoid the multiple patterns issue tests give an Options Set
• Here the relevant features are number of vertices and line type.
C
?
1 2 3 4
5 6 7 8
C
Test Set Options Set

Alternate Reality?
• Since values predicted by each model are so different inside and
outside the original range of X it is evident that, at best, a single
model is correct although several models can be acceptable
approximations.
• This Alternate Reality issue is well known in other fields:
– Immanuel Kant suggested a division between the natural world called Noumena
(our X,Y pairs) and the human vision of it called Phenomena (model M).
– Klaus Conrad suggested the term Apophenia to describe a “specific experience of
an abnormal meaningfulness” or our tendency to see patterns in random data.
• To dispel any doubts, the pairs used in this example are totally
independent being created by a quasi-random number generator
from R (see code snippet)
Copyright 2014 16
> set.seed(8555)
> C <- floor(t(runif(10))*10)
> Y <- C[1:4]

Final Word
• The power and beauty of mathematics could work for or
against us depending on how we handle its intricacies.
• Are you sure you are not gambling the future of your
company with the latest analytic fad?
• Contact us today to learn how we can help you validate
your analytic processes.
Copyright 2014 17

Copyright 2014 18
Legal Disclaimer
Under no circumstances but not limited to negligence, shall Innovatorium
Technologies Corporation be liable for any direct, indirect, special, incidental
or consequential damages whatsoever that result from the use of
information presented in this white paper, unless that information is
subsequently confirmed in writing as part of a legally binding contract.
The information presented in this white paper cannot and do not address
the unique facts and circumstances of your specific situation and should not
be relied on for your particular applications. Therefore, you should not use
this information without first contacting Innovatorium Technologies
Corporation.
Contact Information
Web: www.innovatt.com; www.heuristicanalytics.com
Email: bd @ innovatt.com
Phone: +1-267- 342-2815