patrick gavin overview state public charter school authority
TRANSCRIPT
STATE PUBLIC CHARTER SCHOOL AUTHORITY 2016 – 2017 Agency Overview
The First Four Years
Charter Authority: Statutory Base
Transfer SBE/NDE Authority and Schools (2011 session) Purpose (NRS 386.509) Authorize high-quality charter schools; Provide oversight, ensure schools maintain high standards, preserve
autonomy, and protect public interests; and Serve as a model of best practices
Required to align policies with national best practice
October 2011 office established, January 2012 Seven Member Appointed Board Seated 2 Gubernatorial appointees 2 Speaker of Assembly appointees 2 Senate Majority Leader appointees 1 Charter School Association of Nevada appointee
Deemed a Local Education Agency 2013 (NRS 386.5135) State-sponsored charters were previously ineligible for federal funds Schools still do not receive allocated special ed monies that go to districts

2004-14 NDE/SPCSA Enrollment
NDE Authority
SPCSA Portfolio is Nevada’s Third Largest Public School System
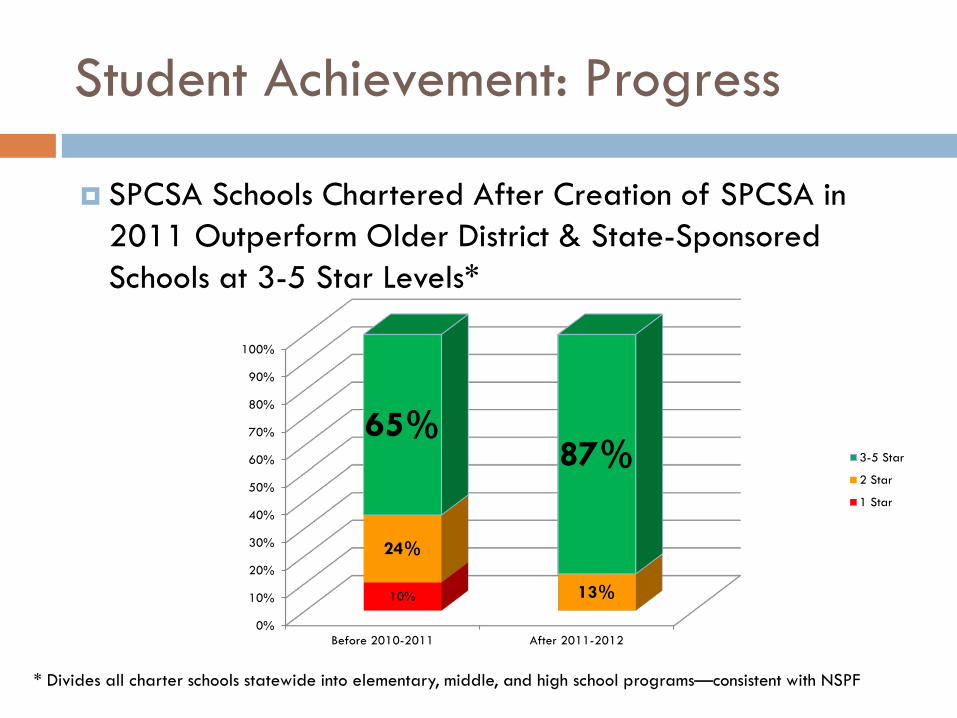
Student Achievement: Progress
SPCSA Schools Chartered After Creation of SPCSA in 2011 Outperform Older District & State-Sponsored Schools at 3-5 Star Levels*
* Divides all charter schools statewide into elementary, middle, and high school programs—consistent with NSPF
0%
10%
20%
30%
40%
50%
60%
70%
80%
90%
100%
Before 2010-2011 After 2011-2012
10%
24%
13%
65% 87% 3-5 Star
2 Star
1 Star
0%
10%
20%
30%
40%
50%
60%
70%
80%
90%
100%
Before 2010-2011 After 2011-2012
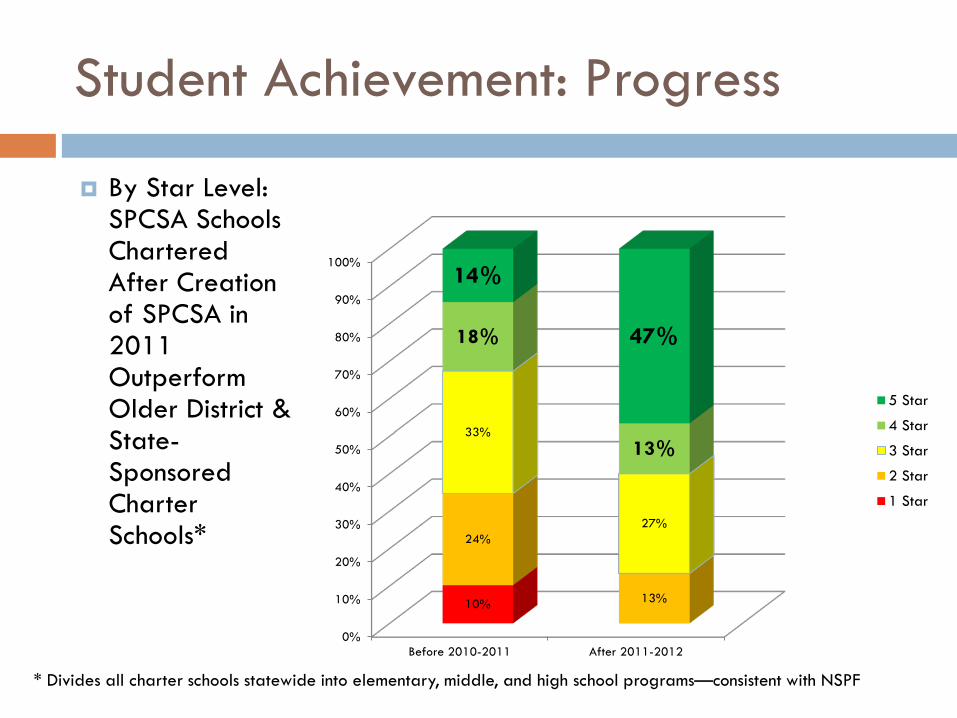
10%
24%
13%
33%
27%
18%
13%
14%
47%
5 Star
4 Star
3 Star
2 Star
1 Star
Student Achievement: Progress
By Star Level: SPCSA Schools Chartered After Creation of SPCSA in 2011 Outperform Older District & State-Sponsored Charter Schools*
* Divides all charter schools statewide into elementary, middle, and high school programs—consistent with NSPF
0%
10%
20%
30%
40%
50%
60%
70%
80%
90%
100%
2011-12 2012-13 2013-14
14% 7% 3%
24% 27%
20%
19% 30%
29%
10%
30%
14%
33% 7%
34%
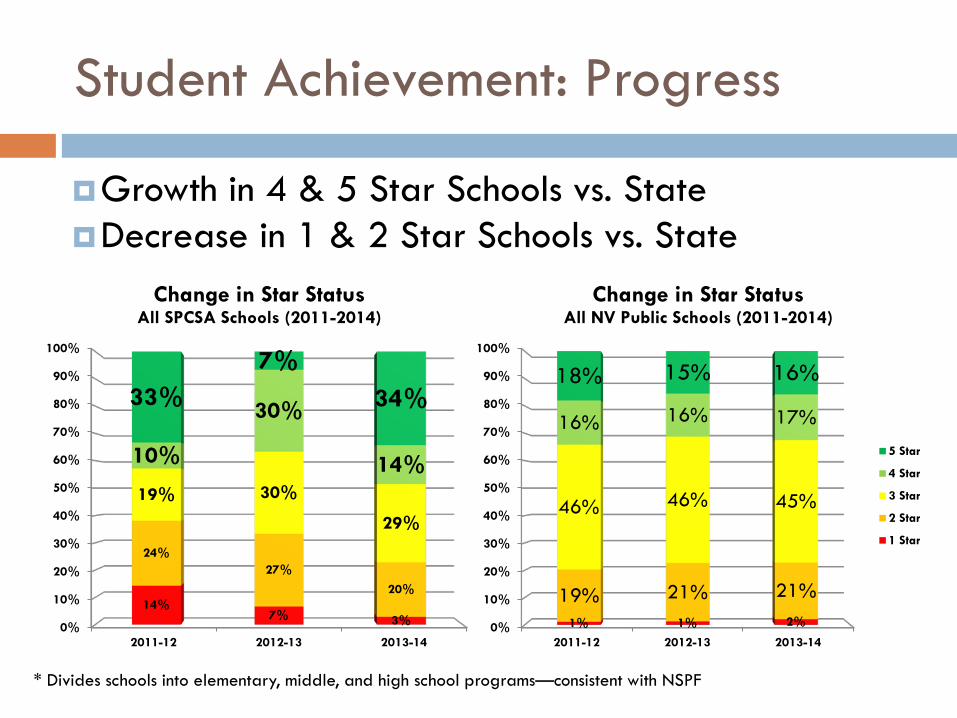
Change in Star Status All SPCSA Schools (2011-2014)
Student Achievement: Progress
Growth in 4 & 5 Star Schools vs. State Decrease in 1 & 2 Star Schools vs. State
* Divides schools into elementary, middle, and high school programs—consistent with NSPF
0%
10%
20%
30%
40%
50%
60%
70%
80%
90%
100%
2011-12 2012-13 2013-14
1% 1% 2%
19% 21% 21%
46% 46% 45%
16% 16% 17%
18% 15% 16%
Change in Star Status All NV Public Schools (2011-2014)
5 Star
4 Star
3 Star
2 Star
1 Star

Statewide Context
Percentage of students served by schools at each star level has remained relatively flat across all public schools
1% 1% 2%
19% 21% 21%
46% 46% 45%
16% 16% 17%
18% 15% 16%
2011-12 2012-13 2013-14
Growth in Students Served at Each Star Rating--All NV Public Schools
5 Star
4 Star
3 Star
2 Star
1 Star

Growth in Quality Seats: All Charters
Number of
students served by 4 & 5 star charter schools statewide grew 147% from 2011-2014 2,227 2,265 1,779
7,335 8,320 7,441
3120
5,610 5672 715
4,025 3,048 3,199
1,134 6,621
2011-12 2012-13 2013-14
Growth in Students Served at Each Star Rating--All Charters
54321
418 1,452 1,682
3,275
2,510 2,858
1,933
3,016 2,216 363
276 1,486
706
848
463
2011-12 2012-13 2013-14
Growth in Students Served at Each Star Rating--District Charters
5
4
3
2
1
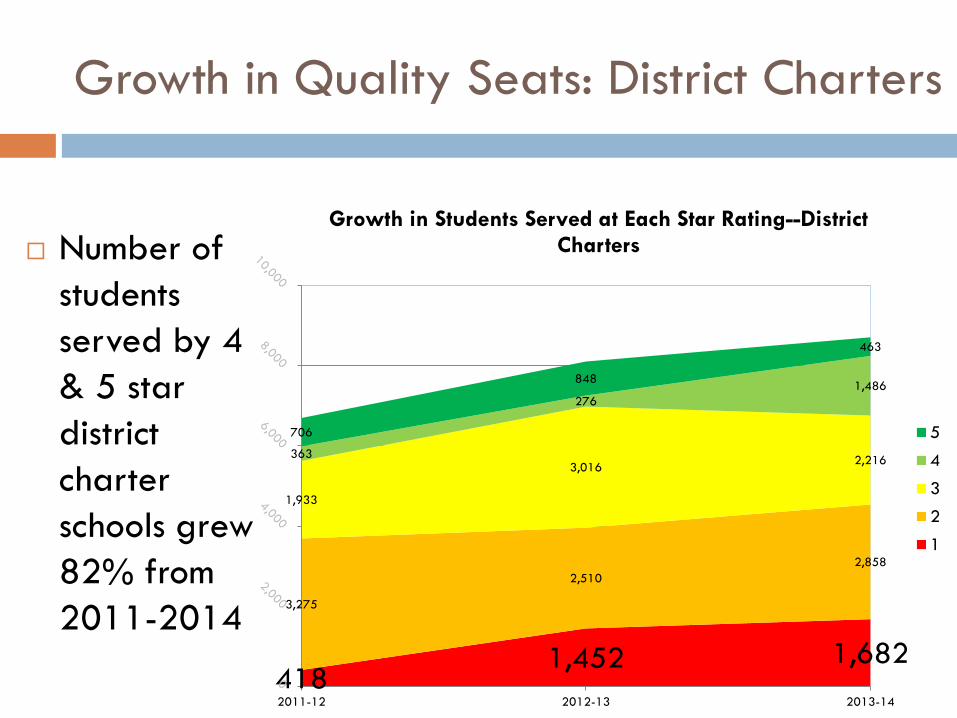
Growth in Quality Seats: District Charters
Number of students served by 4 & 5 star district charter schools grew 82% from 2011-2014
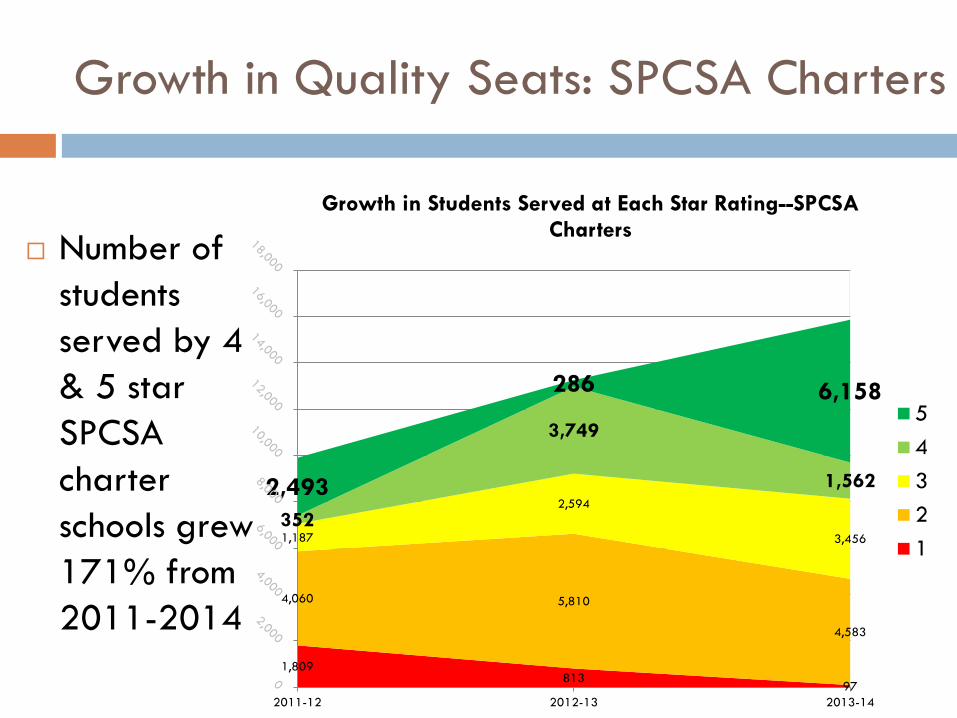
Growth in Quality Seats: SPCSA Charters
Number of students served by 4 & 5 star SPCSA charter schools grew 171% from 2011-2014 1,809
813 97
4,060 5,810
4,583
1,187
2,594
3,456 352
3,749
1,562 2,493
286 6,158
2011-12 2012-13 2013-14
Growth in Students Served at Each Star Rating--SPCSA Charters
54321

Increased Graduation Rates
SPCSA charter graduation rates have increased 26 points vs. 7 points for district charters* & 8 points statewide
62% 63%
70% 70%
43%
31%
50%
28%
46%
54%
25%
35%
45%
55%
65%
75%
2010-11 2011-12 2012-13 2013-14
SPCSA
District Charters
State
2010-11 2011-12 2012-13 2013-14 SPCSA 28% 35% 46% 54%
District Charters 43% 31% 48% 50% State 62% 63% 70% 70% * Preliminary district charter data
48%
35%
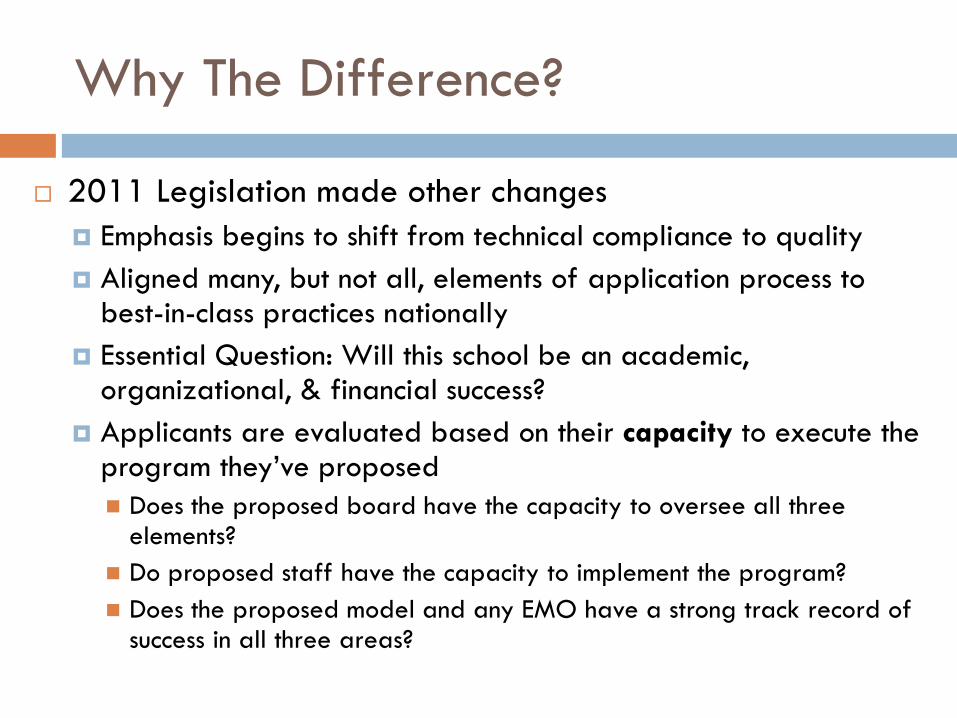
Why The Difference?
2011 Legislation made other changes Emphasis begins to shift from technical compliance to quality Aligned many, but not all, elements of application process to
best-in-class practices nationally Essential Question: Will this school be an academic,
organizational, & financial success? Applicants are evaluated based on their capacity to execute the
program they’ve proposed Does the proposed board have the capacity to oversee all three
elements? Do proposed staff have the capacity to implement the program? Does the proposed model and any EMO have a strong track record of
success in all three areas?
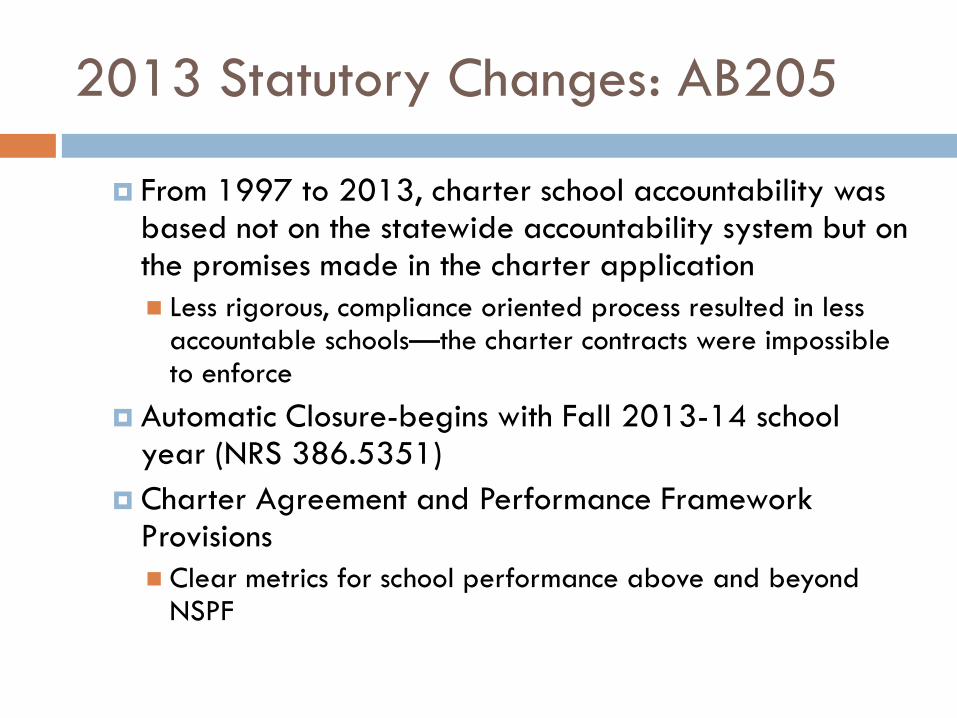
2013 Statutory Changes : AB205
From 1997 to 2013, charter school accountability was based not on the statewide accountability system but on the promises made in the charter application Less rigorous, compliance oriented process resulted in less
accountable schools—the charter contracts were impossible to enforce
Automatic Closure-begins with Fall 2013-14 school year (NRS 386.5351)
Charter Agreement and Performance Framework Provisions Clear metrics for school performance above and beyond
NSPF

Automatic Closure
Adopted in 2013 via AB205--requires automatic closure in the case of 3 consecutive years of lowest possible rating on statewide system of accountability (Star system)
Sets a minimum floor for performance statewide First year measured: 2013-14 Challenges
2014-15 is likely to be a “pause” in statewide accountability due to new testing program
While some legacy schools have embraced accountability, others struggle to change and need more support (e.g. governance training)

Performance Framework: Elements
Academic
• Is the academic program a success?
Financial
• Is the school financially viable?
Organizational
• Is the organization effective and well-run?
Statute replaced old, less accountable written charter with new charter contract incorporating performance framework for all new and renewal schools
Answers Essential Questions in Three Domains
Builds on NDE sources and publicly available data Used to inform replication, expansion, renewal, and closure decisions Embedded in all new and renewal contracts since ’13 (currently 11/22 schools) Three tiers of intervention: Notices of Concern->Breach->Closure

Performance Framework: Results
Two schools are currently in breach due to academic performance based on data reported since the end of the 2013 legislative session Schools must take corrective actions and improve
performance to avoid Notice of Closure
Two schools are in breach due to organizational performance based on data reported since the 2013 legislative session Schools must take comply with Authority interventions
and investigation, take corrective actions, and improve performance to avoid Notice of Closure
The SPCSA Today

One Agency: Multiple Roles
Authorizer
Local Education Agency
Traditional State
Agency
Portfolio Manager: Public Education Venture Capital Invest public
funds and entrust NV children to education entrepreneurs
3rd Largest “District” Provide all
NDE/USDOE-mandated support and oversight to schools

Who We Are
10 FTE Staff (Estimated Allocation) 4 Special Education, Federal Programs, and Assessment
Management Staff & 1 Technology Support Position (90% LEA—Core School Support Functions/10% Authorizing)
1 ASO II (80% Agency--Finance/Purchasing/10% LEA/10% Authorizing)
2 Management Analysts (40% Fiscal/40% LEA/20% Authorizing)
1 Admin Assistant (60% Agency/20% LEA /20% Agency Functions)
1 Director (60% Authorizing/20% LEA/20% Agency Functions)

The Next Four Years
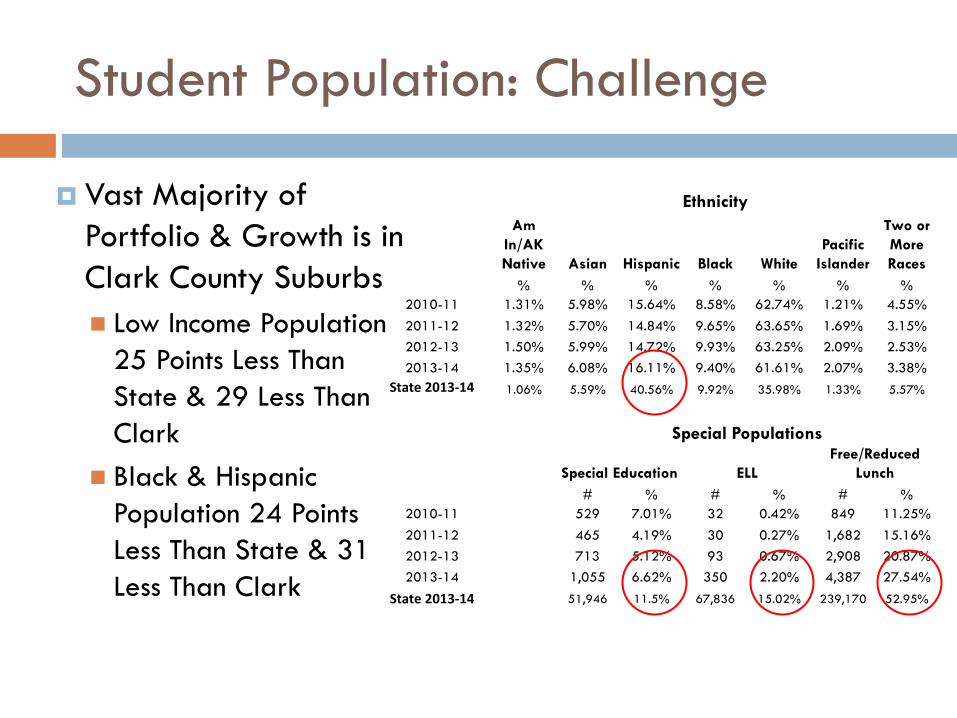
Student Population: Challenge
Vast Majority of Portfolio & Growth is in Clark County Suburbs Low Income Population
25 Points Less Than State & 29 Less Than Clark
Black & Hispanic Population 24 Points Less Than State & 31 Less Than Clark
Ethnicity Am
In/AK Native Asian Hispanic Black White
Pacific Islander
Two or More Races
% % % % % % % 2010-11 1.31% 5.98% 15.64% 8.58% 62.74% 1.21% 4.55% 2011-12 1.32% 5.70% 14.84% 9.65% 63.65% 1.69% 3.15% 2012-13 1.50% 5.99% 14.72% 9.93% 63.25% 2.09% 2.53% 2013-14 1.35% 6.08% 16.11% 9.40% 61.61% 2.07% 3.38%
State 2013-14 1.06% 5.59% 40.56% 9.92% 35.98% 1.33% 5.57%
Special Populations
Special Education ELL Free/Reduced
Lunch # % # % # %
2010-11 529 7.01% 32 0.42% 849 11.25% 2011-12 465 4.19% 30 0.27% 1,682 15.16% 2012-13 713 5.12% 93 0.67% 2,908 20.87% 2013-14 1,055 6.62% 350 2.20% 4,387 27.54%
State 2013-14 51,946 11.5% 67,836 15.02% 239,170 52.95%
Opportunity: Increase Equity & Outcomes
Overcrowding and Underperformance Are Both Challenges: We Are Addressing Overcrowding But We Are Falling Short on Equity
Incentivize Best in Class Charter Management Organizations Serving Low Income and High Need Students to Come to Nevada View Recruitment of Top Flight Operators as a Long-Term Economic
Development Engine Remove Barriers to Entry and Make Adjustments to Education Ecosystem
That Support Excellence Demonstrate the Demographics Are Not Destiny: Proof Points Grow Our Best Local Operators
Continue Organic Growth of Suburban and Rural Movement While Making Strategic Investments in Urban Core
Fast-Track Closure of Long-Term Underperformers and Allow Best-in-Class CMOs to Take Over Low-Performers in High Need Areas Increase Likelihood of Federal Dollars

How to Meet the Needs of High Quality CMOs
Human Capital
Startup Support
Facilities
Political Environment
Fiscal Parity
Need Strategy Strong teaching and
school leadership talent
Equitable and timely access to long-term facilities
Political cover &stability for multi-site growth & direct operation
Funding sufficient to implement their programs
Guaranteed startup capital
Drive expansion of Alternate Pathways, teaching/principal residencies, etc.
State match to rally local and national funders around capital needs
Inventory district buildings, revise replacement strategy, lower renovation costs; ASD
Gain political support/cover for entry at multiple scales statewide
Access to all state/local dollars (capital and operating) not currently going to charters; funding for high-need populations

Reflections
Accomplished a great deal in the past 4 years Recognize there is still a great deal of work to do We are likely to continue to grow at 30%+ per year
Governor’s budget request positions us to grow even faster
Our infrastructure lags our portfolio & revenue growth Tension: dynamic, fast moving portfolio vs. traditional
state agency We pride ourselves on flexibility and teamwork Capacity to respond to or proactively address school
needs & challenges is a persistent concern

Questions?