patient safety indicators™ v5.0 benchmark data · pdf filetable 3. psi #2 - death rate...
TRANSCRIPT

AHRQ Quality IndicatorsTM
PATIENT SAFETY INDICATORS™ v5.0 BENCHMARK DATA TABLES
Prepared for: Agency for Healthcare Research and Quality U.S. Department of Health and Human Services 540 Gaither Road Rockville, MD 20850 http://www.qualityindicators.ahrq.gov
Contract No. HHSA290201200001C
Prepared by:
Truven Health Analytics 5425 Hollister Ave, Suite 140 Santa Barbara, CA 93111
March 2015

AHRQ Quality Indicators™ Version 5.0 Benchmark Data Tables
Version 5.0 Page i March 2015
Contents
Introduction ................................................................................................................................... 1Table 1. Patient Safety Provider-Level Indicators for Overall Population ......................... 2Table 2. Patient Safety Area-Level Indicators for Overall Population ............................... 3Table 3. PSI #2 - Death Rate in Low-Mortality Diagnosis Related Groups (DRGs) ......... 4Table 4. PSI #3 – Pressure Ulcer Rate ................................................................................ 4Table 5. PSI #4 – Death Rate among Surgical Inpatients with Serious Treatable Complications ..................................................................................................................... 4Table 6. PSI #4A – Death Rate among Surgical Inpatients with Serious Treatable Complications – Stratum A ................................................................................................. 5Table 7. PSI #4B – Death Rate among Surgical Inpatients with Serious Treatable Complications – Stratum B ................................................................................................. 5Table 8. PSI #4C – Death Rate among Surgical Inpatients with Serious Treatable Complications – Stratum C ................................................................................................. 5Table 9. PSI #4D – Death Rate among Surgical Inpatients with Serious Treatable Complications – Stratum D ................................................................................................. 6Table 10. PSI #4E – Death Rate among Surgical Inpatients with Serious Treatable Complications – Stratum E ................................................................................................. 6Table 11. PSI #5 – Retained Surgical Item or Unretrieved Device Fragment Count ......... 6Table 12. PSI #6 – Latrogenic Pneumothorax Rate ............................................................ 7Table 13. PSI #7 – Central Venous Catheter-Related Blood Stream Infection Rate .......... 7Table 14. PSI #8 – Postoperative Hip Fracture Rate .......................................................... 7Table 15. PSI #9 – Perioperative Hemorrhage or Hematoma Rate .................................... 8Table 16. PSI #10 – Postoperative Physiologic and Metabolic Derangement Rate ........... 8Table 17. PSI #11 – Postoperative Respiratory Failure Rate.............................................. 8Table 18. PSI #12 – Perioperative Pulmonary Embolism or Deep Vein Thrombosis Rate 9Table 19. PSI #13 – Postoperative Sepsis Rate .................................................................. 9Table 20. PSI #14 – Postoperative Wound Dehiscence Rate ............................................. 9Table 21. PSI #15 – Accidental Puncture or Laceration Rate .......................................... 10Table 22. PSI #16 – Transfusion Reaction Count............................................................. 10Table 23. PSI #18 – Obstetric Trauma Rate – Vaginal Delivery With Instrument .......... 10Table 24. PSI #19 – Obstetric Trauma Rate – Vaginal Delivery Without Instrument ..... 11Table 25. PSI #22 – Latrogenic Pneumothorax Rate ........................................................ 11

AHRQ Quality Indicators™ Version 5.0 Benchmark Data Tables
Version 5.0 Page ii March 2015
Table 26. PSI #23 – Central Venous Catheter-Related Blood Stream Infection Rate ...... 11Table 27. PSI #24 – Postoperative Wound Dehiscence Rate ........................................... 11Table 28. PSI #25 – Accidental Puncture or Laceration Rate .......................................... 12Table 29. PSI #26 – Transfusion Reaction Rate ............................................................... 12Table 30. PSI #27 – Perioperative Hemorrhage or Hematoma Rate ................................ 12

AHRQ Quality Indicators™ Version 5.0 Benchmark Data Tables
Version 5.0 Page 1 November 2014
Introduction The data presented in this document are nationwide comparative rates for the Agency for Healthcare Research and Quality (AHRQ) Quality Indicators™ QIs. The rates are based on analysis of 45 States from the 2012 AHRQ Healthcare Cost and Utilization Project (HCUP) State Inpatient Databases (SID)1. HCUP is a family of health care databases and related software tools and products developed through a Federal-State-industry partnership2. HCUP includes the largest collection of longitudinal hospital care data in the United States, with all-payer, encounter-level information beginning in 1988. The SID contains all-payer, encounter-level information on inpatient discharges, including clinical and resource information typically found on a billing record, such as patient demographics, up to 30 International Classification of Diseases, Ninth Revision, Clinical Modification diagnoses and procedures, length of stay, expected payer, admission and discharge dates, and discharge disposition. In 2012, the HCUP databases represented more than 95 percent of all annual discharges in the United States. The dataset analyzed to generate the tables in this document consists of the same hospital discharge records that comprise the reference population for Version the 5.0 Version of the AHRQ QI software.
1 The states included in the analysis are Alaska, Arkansas, Arizona, California, Colorado, Connecticut, Florida, Georgia, Hawaii, Iowa, Illinois, Indiana, Kansas, Kentucky, Louisiana, Massachusetts, Maryland, Maine, Michigan, Minnesota, Missouri, Montana, North Carolina, Nebraska, New Jersey, New Mexico, Nevada, New York, Ohio, Oklahoma, Oregon, Pennsylvania, Rhode Island, South Carolina, South Dakota, Tennessee, Texas, Utah, Virginia, Vermont, Washington, Wisconsin, West Virginia, and Wyoming. 2 The AHRQ QI program would like to acknowledge the HCUP Partner organizations that participated in the HCUP SID: Alaska State Hospital and Nursing Home Association, Arizona Department of Health Services, Arkansas Department of Health, California Office of Statewide Health Planning and Development, Colorado Hospital Association, Connecticut Hospital Association, Florida Agency for Health Care Administration, Georgia Hospital Association, Hawaii Health Information Corporation, Illinois Department of Public Health, Indiana Hospital Association, Iowa Hospital Association, Kansas Hospital Association, Kentucky Cabinet for Health and Family Services, Louisiana Department of Health and Hospitals, Maine Health Data Organization, Maryland Health Services Cost Review Commission, Massachusetts Center for Health Information and Analysis, Michigan Health & Hospital Association, Minnesota Hospital Association (provides data for Minnesota and North Dakota), Mississippi Department of Health, Missouri Hospital Industry Data Institute, Montana MHA - An Association of Montana Health Care Providers, Nebraska Hospital Association, Nevada Department of Health and Human Services, New Hampshire Department of Health & Human Services, New Jersey Department of Health, New Mexico Department of Health, New York State Department of Health, North Carolina Department of Health and Human Services, North Dakota (data provided by the Minnesota Hospital Association), Ohio Hospital Association, Oklahoma State Department of Health, Oregon Association of Hospitals and Health Systems, Oregon Health Policy and Research, Pennsylvania Health Care Cost Containment Council, Rhode Island Department of Health, South Carolina Budget & Control Board, South Dakota Association of Healthcare Organizations, Tennessee Hospital Association, Texas Department of State Health Services, Utah Department of Health, Vermont Association of Hospitals and Health Systems, Virginia Health Information, Washington State Department of Health, West Virginia Health Care Authority, Wisconsin Department of Health Services, Wyoming Hospital Associatio
With Version 5.0 of the software, the indicators are no longer calculated using a software option that models the effect of missing present on admission data. The QI observed rates for provider-level indicators are scaled to the rate per 1,000 persons at risk and the area-level indicators are per 100,000. Volume and count indicator results are listed as simple counts with no scaling at all. Rates for any cells with 1 to 10 cases are not presented.
The tables below are calculated for the overall reference population.

AHRQ Quality Indicators™ Version 5.0 Benchmark Data Tables
Version 5.0 Page 2 March 2015
Table 1. Patient Safety Provider-Level Indicators for Overall Population
INDICATOR LABEL NUMERATOR DENOMINATOR OBSERVED RATE PER 1,000 (=OBSERVED RATEx1,000)
PROVIDER -LEVEL INDICATORS PSI #2 Death Rate in Low-Mortality Diagnosis Related Groups (DRGs) 1,822 5,636,599 0.32 PSI #3 Pressure Ulcer Rate 2,804 5,606,091 0.5 PSI #4 Death Rate among Surgical Inpatients with Serious Treatable
Complications 22,014 185,587 118.62
PSI #4A Death Rate among Surgical Inpatients with Serious Treatable Complications - Stratum A
1,258 26,659 47.19
PSI #4B Death Rate among Surgical Inpatients with Serious Treatable Complications - Stratum B
6,151 81,902 75.1
PSI #4C Death Rate among Surgical Inpatients with Serious Treatable Complications - Stratum C
5,622 28,088 200.16
PSI #4D Death Rate among Surgical Inpatients with Serious Treatable Complications - Stratum D
7,706 22,388 344.2
PSI #4E Death Rate among Surgical Inpatients with Serious Treatable Complications - Stratum E
1,277 26,550 48.1
PSI #5 Retained Surgical Item or Unretrieved Device Fragment Count 973 . . PSI #6 Iatrogenic Pneumothorax Rate 6,418 19,129,500 0.34 PSI #7 Central Venous Catheter-Related Blood Stream Infection Rate 3,215 15,569,713 0.21 PSI #8 Postoperative Hip Fracture Rate 153 3,421,646 0.04 PSI #9 Perioperative Hemorrhage or Hematoma Rate 27,155 5,317,074 5.11 PSI #10 Postoperative Physiologic and Metabolic Derangement Rate 1,829 2,655,114 0.69 PSI #11 Postoperative Respiratory Failure Rate 22,402 2,228,418 10.05 PSI #12 Perioperative Pulmonary Embolism or Deep Vein Thrombosis Rate 28,370 5,689,423 4.99 PSI #13 Postoperative Sepsis Rate 4,822 501,689 9.61 PSI #14 Postoperative Wound Dehiscence Rate 1,559 836,248 1.86 PSI #15 Accidental Puncture or Laceration Rate 37,494 19,879,692 1.89 PSI #16 Transfusion Reaction Count 38 . . PSI #18 Obstetric Trauma Rate – Vaginal Delivery With Instrument 18,246 136,989 133.19 PSI #19 Obstetric Trauma Rate – Vaginal Delivery Without Instrument 39,324 1,875,164 20.97

AHRQ Quality Indicators™ Version 5.0 Benchmark Data Tables
Version 5.0 Page 3 March 2015
Table 2. Patient Safety Area-Level Indicators for Overall Population
INDICATOR LABEL NUMERATOR DENOMINATOR OBSERVED RATE PER 100,000 (=OBSERVED RATEx100,000)
AREA-LEVEL INDICATORS PSI #21 Retained Surgical Item or Unretrieved Device Fragment Rate 2,166 201,198,735 1.08 PSI #22 Iatrogenic Pneumothorax Rate 11,410 201,198,776 5.67 PSI #23 Central Venous Catheter-Related Blood Stream Infection Rate 10,615 201,198,758 5.28 PSI #24 Postoperative Wound Dehiscence Rate 2,972 201,198,741 1.48 PSI #25 Accidental Puncture or Laceration Rate 48,481 201,198,932 24.1 PSI #26 Transfusion Reaction Rate 133 201,198,731 0.07 PSI #27 Perioperative Hemorrhage or Hematoma Rate 61,560 201,198,953 30.6

AHRQ Quality Indicators™ Version 5.0 Benchmark Data Tables
Version 5.0 Page 4
Table 3. PSI #2 - Death Rate in Low-Mortality Diagnosis Related Groups (DRGs)
INDICATOR NUMERATOR DENOMINATOR OBSERVED RATE PER 1,000 (=OBSERVED RATEx1,000)
Overall 1,822 5,636,599 0.32 Females 1,069 4,686,099 0.23 Males 753 950,500 0.79 0 to 17 years ***** 79,051 ***** 18 to 39 years 239 - 248 3,742,951 0.06 - 0.07 40 to 64 years 329 1,159,902 0.28 65 to 74 years 223 284,354 0.78 75+ years 1,025 370,341 2.77 Private 273 2,291,898 0.12 Medicare 1,161 914,275 1.27 Medicaid 265 1,923,567 0.14 Other 62 225,474 0.27 Uninsured (self-pay/no charge) 61 281,385 0.22
Table 4. PSI #3 – Pressure Ulcer Rate
INDICATOR NUMERATOR DENOMINATOR OBSERVED RATE PER 1,000 (=OBSERVED RATEx1,000)
Overall 2,804 5,606,091 0.5 Females 1,217 2,966,101 0.41 Males 1,587 2,639,990 0.6 0 to 17 years . . . 18 to 39 years 167 613,124 0.27 40 to 64 years 897 2,014,888 0.45 65 to 74 years 621 1,107,649 0.56 75+ years 1,119 1,870,430 0.6 Private 409 1,125,253 0.36 Medicare 1,824 3,329,882 0.55 Medicaid 383 676,120 0.57 Other 84 184,490 0.46 Uninsured (self-pay/no charge) 104 290,346 0.36
Table 5. PSI #4 – Death Rate among Surgical Inpatients with Serious Treatable Complications
INDICATOR NUMERATOR DENOMINATOR OBSERVED RATE PER 1,000 (=OBSERVED RATEx1,000)
Overall 22,014 185,587 118.62 Females 9,484 89,815 105.59 Males 12,530 95,772 130.83 0 to 17 years ***** 65 ***** 18 to 39 years 1,004 - 1,013 16,173 62.08 - 62.64 40 to 64 years 7,030 68,454 102.7 65 to 74 years 5,486 45,932 119.44 75+ years 8,491 54,963 154.49 Private 4,058 46,612 87.06 Medicare 14,239 106,084 134.22 Medicaid 2,009 18,803 106.84 Other 625 6,090 102.63 Uninsured (self-pay/no charge) 1,083 7,998 135.41
AHRQ Quality Indicators™ Version 5.0 Benchmark Data Tables
Version 5.0 Page 5
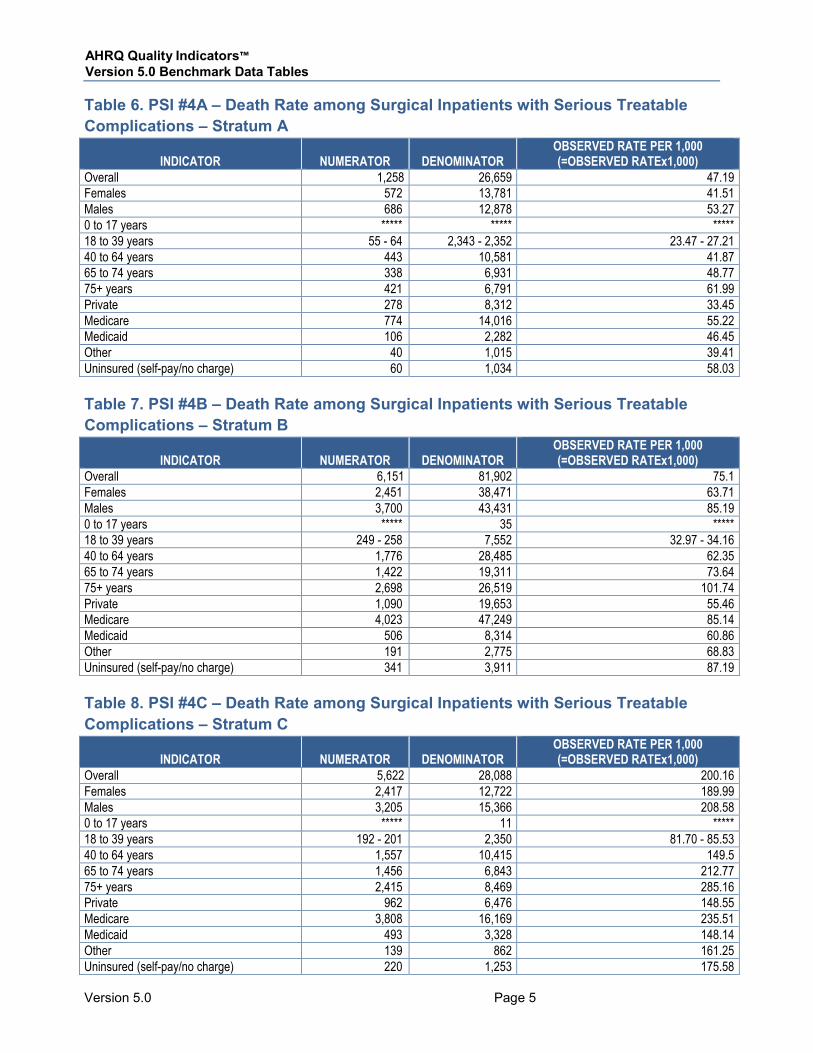
Table 6. PSI #4A – Death Rate among Surgical Inpatients with Serious Treatable Complications – Stratum A
INDICATOR NUMERATOR DENOMINATOR OBSERVED RATE PER 1,000 (=OBSERVED RATEx1,000)
Overall 1,258 26,659 47.19 Females 572 13,781 41.51 Males 686 12,878 53.27 0 to 17 years ***** ***** ***** 18 to 39 years 55 - 64 2,343 - 2,352 23.47 - 27.21 40 to 64 years 443 10,581 41.87 65 to 74 years 338 6,931 48.77 75+ years 421 6,791 61.99 Private 278 8,312 33.45 Medicare 774 14,016 55.22 Medicaid 106 2,282 46.45 Other 40 1,015 39.41 Uninsured (self-pay/no charge) 60 1,034 58.03
Table 7. PSI #4B – Death Rate among Surgical Inpatients with Serious Treatable Complications – Stratum B
INDICATOR NUMERATOR DENOMINATOR OBSERVED RATE PER 1,000 (=OBSERVED RATEx1,000)
Overall 6,151 81,902 75.1 Females 2,451 38,471 63.71 Males 3,700 43,431 85.19 0 to 17 years ***** 35 ***** 18 to 39 years 249 - 258 7,552 32.97 - 34.16 40 to 64 years 1,776 28,485 62.35 65 to 74 years 1,422 19,311 73.64 75+ years 2,698 26,519 101.74 Private 1,090 19,653 55.46 Medicare 4,023 47,249 85.14 Medicaid 506 8,314 60.86 Other 191 2,775 68.83 Uninsured (self-pay/no charge) 341 3,911 87.19
Table 8. PSI #4C – Death Rate among Surgical Inpatients with Serious Treatable Complications – Stratum C
INDICATOR NUMERATOR DENOMINATOR OBSERVED RATE PER 1,000 (=OBSERVED RATEx1,000)
Overall 5,622 28,088 200.16 Females 2,417 12,722 189.99 Males 3,205 15,366 208.58 0 to 17 years ***** 11 ***** 18 to 39 years 192 - 201 2,350 81.70 - 85.53 40 to 64 years 1,557 10,415 149.5 65 to 74 years 1,456 6,843 212.77 75+ years 2,415 8,469 285.16 Private 962 6,476 148.55 Medicare 3,808 16,169 235.51 Medicaid 493 3,328 148.14 Other 139 862 161.25 Uninsured (self-pay/no charge) 220 1,253 175.58

AHRQ Quality Indicators™ Version 5.0 Benchmark Data Tables
Version 5.0 Page 6
Table 9. PSI #4D – Death Rate among Surgical Inpatients with Serious Treatable Complications – Stratum D
INDICATOR NUMERATOR DENOMINATOR OBSERVED RATE PER 1,000 (=OBSERVED RATEx1,000)
Overall 7,706 22,388 344.2 Females 3,500 11,804 296.51 Males 4,206 10,584 397.39 0 to 17 years ***** 12 ***** 18 to 39 years 457 - 466 2,490 183.53 - 187.15 40 to 64 years 2,786 8,614 323.43 65 to 74 years 1,949 5,441 358.21 75+ years 2,508 5,831 430.11 Private 1,518 5,573 272.38 Medicare 4,796 12,634 379.61 Medicaid 793 2,653 298.91 Other 216 630 342.86 Uninsured (self-pay/no charge) 383 898 426.5
Table 10. PSI #4E – Death Rate among Surgical Inpatients with Serious Treatable Complications – Stratum E
INDICATOR NUMERATOR DENOMINATOR OBSERVED RATE PER 1,000 (=OBSERVED RATEx1,000)
Overall 1,277 26,550 48.1 Females 544 13,037 41.73 Males 733 13,513 54.24 0 to 17 years ***** ***** ***** 18 to 39 years 33 - 42 1,428 - 1,437 23.11 - 29.23 40 to 64 years 468 10,359 45.18 65 to 74 years 321 7,406 43.34 75+ years 449 7,353 61.06 Private 210 6,598 31.83 Medicare 838 16,016 52.32 Medicaid 111 2,226 49.87 Other 39 808 48.27 Uninsured (self-pay/no charge) 79 902 87.58
Table 11. PSI #5 – Retained Surgical Item or Unretrieved Device Fragment Count
INDICATOR NUMERATOR DENOMINATOR OBSERVED RATE PER 1,000 (=OBSERVED RATEx1,000)
Overall 973 . . Females 543 . . Males 430 . . 0 to 17 years ***** . . 18 to 39 years 188 - 197 . . 40 to 64 years 412 . . 65 to 74 years 200 . . 75+ years 167 . . Private 355 . . Medicare 394 . . Medicaid 133 . . Other 45 . . Uninsured (self-pay/no charge) 46 . .

AHRQ Quality Indicators™ Version 5.0 Benchmark Data Tables
Version 5.0 Page 7
Table 12. PSI #6 – Latrogenic Pneumothorax Rate
INDICATOR NUMERATOR DENOMINATOR OBSERVED RATE PER 1,000 (=OBSERVED RATEx1,000)
Overall 6,418 19,129,500 0.34 Females 3,695 10,259,192 0.36 Males 2,723 8,870,308 0.31 0 to 17 years . . . 18 to 39 years 552 2,611,117 0.21 40 to 64 years 1,970 7,458,084 0.26 65 to 74 years 1,377 3,584,896 0.38 75+ years 2,519 5,475,403 0.46 Private 1,184 4,754,304 0.25 Medicare 4,145 10,154,984 0.41 Medicaid 687 2,261,267 0.3 Other 154 724,309 0.21 Uninsured (self-pay/no charge) 248 1,234,636 0.2
Table 13. PSI #7 – Central Venous Catheter-Related Blood Stream Infection Rate
INDICATOR NUMERATOR DENOMINATOR OBSERVED RATE PER 1,000 (=OBSERVED RATEx1,000)
Overall 3,215 15,569,713 0.21 Females 1,526 9,813,751 0.16 Males 1,689 5,755,962 0.29 0 to 17 years ***** 71,017 ***** 18 to 39 years 592 - 601 4,580,030 0.13 - 0.13 40 to 64 years 1,406 5,020,712 0.28 65 to 74 years 590 2,240,531 0.26 75+ years 626 3,657,423 0.17 Private 650 4,530,727 0.14 Medicare 1,638 6,612,012 0.25 Medicaid 643 2,876,033 0.22 Other 103 600,313 0.17 Uninsured (self-pay/no charge) 181 950,628 0.19
Table 14. PSI #8 – Postoperative Hip Fracture Rate
INDICATOR NUMERATOR DENOMINATOR OBSERVED RATE PER 1,000 (=OBSERVED RATEx1,000)
Overall 153 3,421,646 0.04 Females 79 1,785,127 0.04 Males 74 1,636,519 0.05 0 to 17 years . . . 18 to 39 years ***** 498,819 ***** 40 to 64 years 34 - 43 1,562,010 0.02 - 0.03 65 to 74 years 34 712,352 0.05 75+ years 81 648,465 0.12 Private 16 1,252,483 0.01 Medicare 122 1,494,515 0.08 Medicaid ***** 339,417 ***** Other ***** 126,335 ***** Uninsured (self-pay/no charge) ***** 208,896 *****

AHRQ Quality Indicators™ Version 5.0 Benchmark Data Tables
Version 5.0 Page 8
Table 15. PSI #9 – Perioperative Hemorrhage or Hematoma Rate
INDICATOR NUMERATOR DENOMINATOR OBSERVED RATE PER 1,000 (=OBSERVED RATEx1,000)
Overall 27,155 5,317,074 5.11 Females 13,453 2,871,520 4.68 Males 13,702 2,445,554 5.6 0 to 17 years . . . 18 to 39 years 2,891 663,595 4.36 40 to 64 years 11,750 2,365,649 4.97 65 to 74 years 6,420 1,186,620 5.41 75+ years 6,094 1,101,210 5.53 Private 8,917 1,925,451 4.63 Medicare 13,669 2,434,735 5.61 Medicaid 2,577 448,588 5.74 Other 993 242,509 4.09 Uninsured (self-pay/no charge) 999 265,791 3.76
Table 16. PSI #10 – Postoperative Physiologic and Metabolic Derangement Rate
INDICATOR NUMERATOR DENOMINATOR OBSERVED RATE PER 1,000 (=OBSERVED RATEx1,000)
Overall 1,829 2,655,114 0.69 Females 713 1,517,865 0.47 Males 1,116 1,137,249 0.98 0 to 17 years . . . 18 to 39 years 47 243,554 0.19 40 to 64 years 606 1,250,065 0.48 65 to 74 years 590 684,988 0.86 75+ years 586 476,507 1.23 Private 440 1,093,949 0.4 Medicare 1,227 1,224,732 1 Medicaid 97 165,700 0.59 Other 41 111,058 0.37 Uninsured (self-pay/no charge) 24 59,675 0.4
Table 17. PSI #11 – Postoperative Respiratory Failure Rate
INDICATOR NUMERATOR DENOMINATOR OBSERVED RATE PER 1,000 (=OBSERVED RATEx1,000)
Overall 22,402 2,228,418 10.05 Females 12,013 1,353,280 8.88 Males 10,389 875,138 11.87 0 to 17 years . . . 18 to 39 years 1,150 227,618 5.05 40 to 64 years 9,180 1,095,360 8.38 65 to 74 years 6,565 550,503 11.93 75+ years 5,507 354,937 15.52 Private 5,988 973,335 6.15 Medicare 13,638 960,333 14.2 Medicaid 1,640 142,918 11.48 Other 738 101,245 7.29 Uninsured (self-pay/no charge) 398 50,587 7.87

AHRQ Quality Indicators™ Version 5.0 Benchmark Data Tables
Version 5.0 Page 9
Table 18. PSI #12 – Perioperative Pulmonary Embolism or Deep Vein Thrombosis Rate
INDICATOR NUMERATOR DENOMINATOR OBSERVED RATE PER 1,000 (=OBSERVED RATEx1,000)
Overall 28,370 5,689,423 4.99 Females 13,936 3,033,488 4.59 Males 14,434 2,655,935 5.43 0 to 17 years . . . 18 to 39 years 2,126 705,407 3.01 40 to 64 years 10,818 2,504,605 4.32 65 to 74 years 7,327 1,271,903 5.76 75+ years 8,099 1,207,508 6.71 Private 7,970 2,024,378 3.94 Medicare 15,620 2,638,264 5.92 Medicaid 2,609 482,286 5.41 Other 1,143 257,662 4.44 Uninsured (self-pay/no charge) 1,028 286,833 3.58
Table 19. PSI #13 – Postoperative Sepsis Rate
INDICATOR NUMERATOR DENOMINATOR OBSERVED RATE PER 1,000 (=OBSERVED RATEx1,000)
Overall 4,822 501,689 9.61 Females 2,321 275,892 8.41 Males 2,501 225,797 11.08 0 to 17 years . . . 18 to 39 years 322 38,898 8.28 40 to 64 years 1,831 218,326 8.39 65 to 74 years 1,320 135,156 9.77 75+ years 1,349 109,309 12.34 Private 1,198 173,145 6.92 Medicare 2,967 259,651 11.43 Medicaid 403 36,030 11.19 Other 143 20,463 6.99 Uninsured (self-pay/no charge) 111 12,400 8.95
Table 20. PSI #14 – Postoperative Wound Dehiscence Rate
INDICATOR NUMERATOR DENOMINATOR OBSERVED RATE PER 1,000 (=OBSERVED RATEx1,000)
Overall 1,559 836,248 1.86 Females 541 511,297 1.06 Males 1,018 324,951 3.13 0 to 17 years . . . 18 to 39 years 112 121,201 0.92 40 to 64 years 675 413,168 1.63 65 to 74 years 377 159,936 2.36 75+ years 395 141,943 2.78 Private 403 353,740 1.14 Medicare 845 316,946 2.67 Medicaid 187 84,638 2.21 Other 53 33,587 1.58 Uninsured (self-pay/no charge) 71 47,337 1.5

AHRQ Quality Indicators™ Version 5.0 Benchmark Data Tables
Version 5.0 Page 10
Table 21. PSI #15 – Accidental Puncture or Laceration Rate
INDICATOR NUMERATOR DENOMINATOR OBSERVED RATE PER 1,000 (=OBSERVED RATEx1,000)
Overall 37,494 19,879,692 1.89 Females 23,894 10,577,178 2.26 Males 13,600 9,302,514 1.46 0 to 17 years . . . 18 to 39 years 3,858 2,676,404 1.44 40 to 64 years 17,023 7,662,360 2.22 65 to 74 years 8,187 3,755,500 2.18 75+ years 8,426 5,785,428 1.46 Private 13,435 4,894,449 2.74 Medicare 17,639 10,629,925 1.66 Medicaid 3,519 2,335,732 1.51 Other 1,313 729,917 1.8 Uninsured (self-pay/no charge) 1,588 1,289,669 1.23
Table 22. PSI #16 – Transfusion Reaction Count
INDICATOR NUMERATOR DENOMINATOR OBSERVED RATE PER 1,000 (=OBSERVED RATEx1,000)
Overall 38 . . Females 18 . . Males 20 . . 0 to 17 years . . . 18 to 39 years ***** . . 40 to 64 years 20 . . 65 to 74 years ***** . . 75+ years ***** . . Private 19 . . Medicare 14 . . Medicaid ***** . . Other ***** . . Uninsured (self-pay/no charge) . . .
Table 23. PSI #18 – Obstetric Trauma Rate – Vaginal Delivery With Instrument
INDICATOR NUMERATOR DENOMINATOR OBSERVED RATE PER 1,000 (=OBSERVED RATEx1,000)
Overall 18,246 136,989 133.19 Females 18,246 136,989 133.19 Males . . . 0 to 17 years 615 5,076 121.16 18 to 39 years 17,290 128,533 134.52 40 to 64 years 341 3,380 100.89 65 to 74 years . . . 75+ years . . . Private 11,855 72,933 162.55 Medicare 82 874 93.82 Medicaid 5,323 55,415 96.06 Other 603 4,434 135.99 Uninsured (self-pay/no charge) 383 3,333 114.91

AHRQ Quality Indicators™ Version 5.0 Benchmark Data Tables
Version 5.0 Page 11
Table 24. PSI #19 – Obstetric Trauma Rate – Vaginal Delivery Without Instrument
INDICATOR NUMERATOR DENOMINATOR OBSERVED RATE PER 1,000 (=OBSERVED RATEx1,000)
Overall 39,324 1,875,164 20.97 Females 39,324 1,875,164 20.97 Males . . . 0 to 17 years 1,277 51,432 24.83 18 to 39 years 37,424 1,780,864 21.01 40 to 64 years 623 42,868 14.53 65 to 74 years . . . 75+ years . . . Private 25,236 895,505 28.18 Medicare 188 12,805 14.68 Medicaid 11,817 860,143 13.74 Other 1,264 60,349 20.94 Uninsured (self-pay/no charge) 819 46,362 17.67
Table 25. PSI #22 – Latrogenic Pneumothorax Rate
INDICATOR NUMERATOR DENOMINATOR OBSERVED RATE PER 100,000 (=OBSERVED RATEx100,000)
Overall 11,410 201,198,776 5.67 Females 6,512 103,365,042 6.3 Males 4,898 97,833,734 5.01 18 to 39 years 883 76,709,774 1.15 40 to 64 years 3,700 88,042,799 4.2 65 to 74 years 2,742 20,256,413 13.54 75+ years 4,085 16,189,790 25.23
Table 26. PSI #23 – Central Venous Catheter-Related Blood Stream Infection Rate
INDICATOR NUMERATOR DENOMINATOR OBSERVED RATE PER 100,000 (=OBSERVED RATEx100,000)
Overall 10,615 201,198,758 5.28 Females 5,757 103,365,019 5.57 Males 4,858 97,833,739 4.97 18 to 39 years 2,579 76,709,775 3.36 40 to 64 years 4,736 88,042,805 5.38 65 to 74 years 1,690 20,256,408 8.34 75+ years 1,609 16,189,769 9.94
Table 27. PSI #24 – Postoperative Wound Dehiscence Rate
INDICATOR NUMERATOR DENOMINATOR OBSERVED RATE PER 100,000 (=OBSERVED RATEx100,000)
Overall 2,972 201,198,741 1.48 Females 1,218 103,365,014 1.18 Males 1,754 97,833,727 1.79 18 to 39 years 245 76,709,775 0.32 40 to 64 years 1,374 88,042,797 1.56 65 to 74 years 711 20,256,405 3.51 75+ years 642 16,189,764 3.97

AHRQ Quality Indicators™ Version 5.0 Benchmark Data Tables
Version 5.0 Page 12
Table 28. PSI #25 – Accidental Puncture or Laceration Rate
INDICATOR NUMERATOR DENOMINATOR OBSERVED RATE PER 100,000 (=OBSERVED RATEx100,000)
Overall 48,481 201,198,932 24.1 Females 30,989 103,365,126 29.98 Males 17,492 97,833,806 17.88 18 to 39 years 4,944 76,709,776 6.45 40 to 64 years 21,800 88,042,822 24.76 65 to 74 years 10,828 20,256,451 53.45 75+ years 10,909 16,189,883 67.38
Table 29. PSI #26 – Transfusion Reaction Rate
INDICATOR NUMERATOR DENOMINATOR OBSERVED RATE PER 100,000 (=OBSERVED RATEx100,000)
Overall 133 201,198,731 0.07 Females 91 103,365,012 0.09 Males 42 97,833,719 0.04 18 to 39 years 59 76,709,774 0.08 40 to 64 years 44 88,042,795 0.05 65 to 74 years 15 20,256,402 0.07 75+ years 14 16,189,759 0.09
Table 30. PSI #27 – Perioperative Hemorrhage or Hematoma Rate
INDICATOR NUMERATOR DENOMINATOR OBSERVED RATE PER 100,000 (=OBSERVED RATEx100,000)
Overall 61,560 201,198,953 30.6 Females 29,852 103,365,115 28.88 Males 31,708 97,833,838 32.41 18 to 39 years 6,729 76,709,777 8.77 40 to 64 years 25,649 88,042,826 29.13 65 to 74 years 14,465 20,256,458 71.41 75+ years 14,717 16,189,892 90.9