pathways to scientific teaching ii: active learning & assessment diane ebert-may department of...
TRANSCRIPT

Pathways to Scientific
Teaching II:Active Learning& Assessment
Diane Ebert-MayDepartment of Plant Biology
Michigan State University
[email protected]://first2.org

QuickTime™ and aGraphics decompressorare needed to see this picture.

Implement a learning cycle instructional design
Organize and use cooperative groups
Create an inquiry-based, student-centered classroom
Develop goals/assessments
Use concept maps - maybe
Analyze data to improve instruction
Develop rubrics for assessment
Figure out if the rewards are worth “it”
Objectives: you will be able to.....

Engage
Explore
Explain
Assess
Learning Cycle

Where on the continuum is the ideal classroom ?
Question 7

Where on the continuum is your classroom?
Question 8
What is inquiry?How does this occur in my classroom?
What is active learning?

What’s up with Termites?
1. On a sheet of paper, draw two circles near each other on the center of the page.
2. Release termites onto paper.3. Keep creatures safe. I shall collect them
in their original habitat.4. What do you observe about termite
behavior?5. Develop a question your group could
explore if you had more time.(15 minutes - select a timekeeper)

1. Develop 3 possible goals/ objectives for this ‘inquiry’
Team Written response. Overhead.Reporter - Recorder - Timekeeper - (10 minutes)Checker -
2. Develop an assessment appropriate for one of the goals/objectives.

Identify desired
outcomes
Determine acceptable evidence
Design learning experiences
and instruction
Wiggins and McTighe 1998

What is assessment?
Data collection with the purpose of answering questions about…
students’ understanding
students’ attitudes
students’ skills
instructional design and implementation
curricular reform (at multiple grainsizes)

Why do assessment?
Improve student learning and development.Provide students and faculty
substantive feedback about student understanding.
Challenge to use disciplinary research strategies to assess learning.

Guidelines for thinking about research...
What did students learn? (assessment data)
Why did students respond a particular way? (research)
What are the working hypotheses or questions?
What has already been done? Literature says...
How and why to select methods? Conduct study...
How to analyze and interpret data?
What do the results mean?
Are findings valid and generalizable?

Assessment GradientAssessment Gradient
High
Ease of
Assessment
Low
Multiple Choice, T/F
Diagrams, Conceptmaps, Quantitative
response
Short answer
Essay, Researchpapers/ reports
Oral Interview
Low
Potential for
Assessment of
Learning
High

Objective (outcome):
Students will demonstrate understanding of evolution by natural selection.
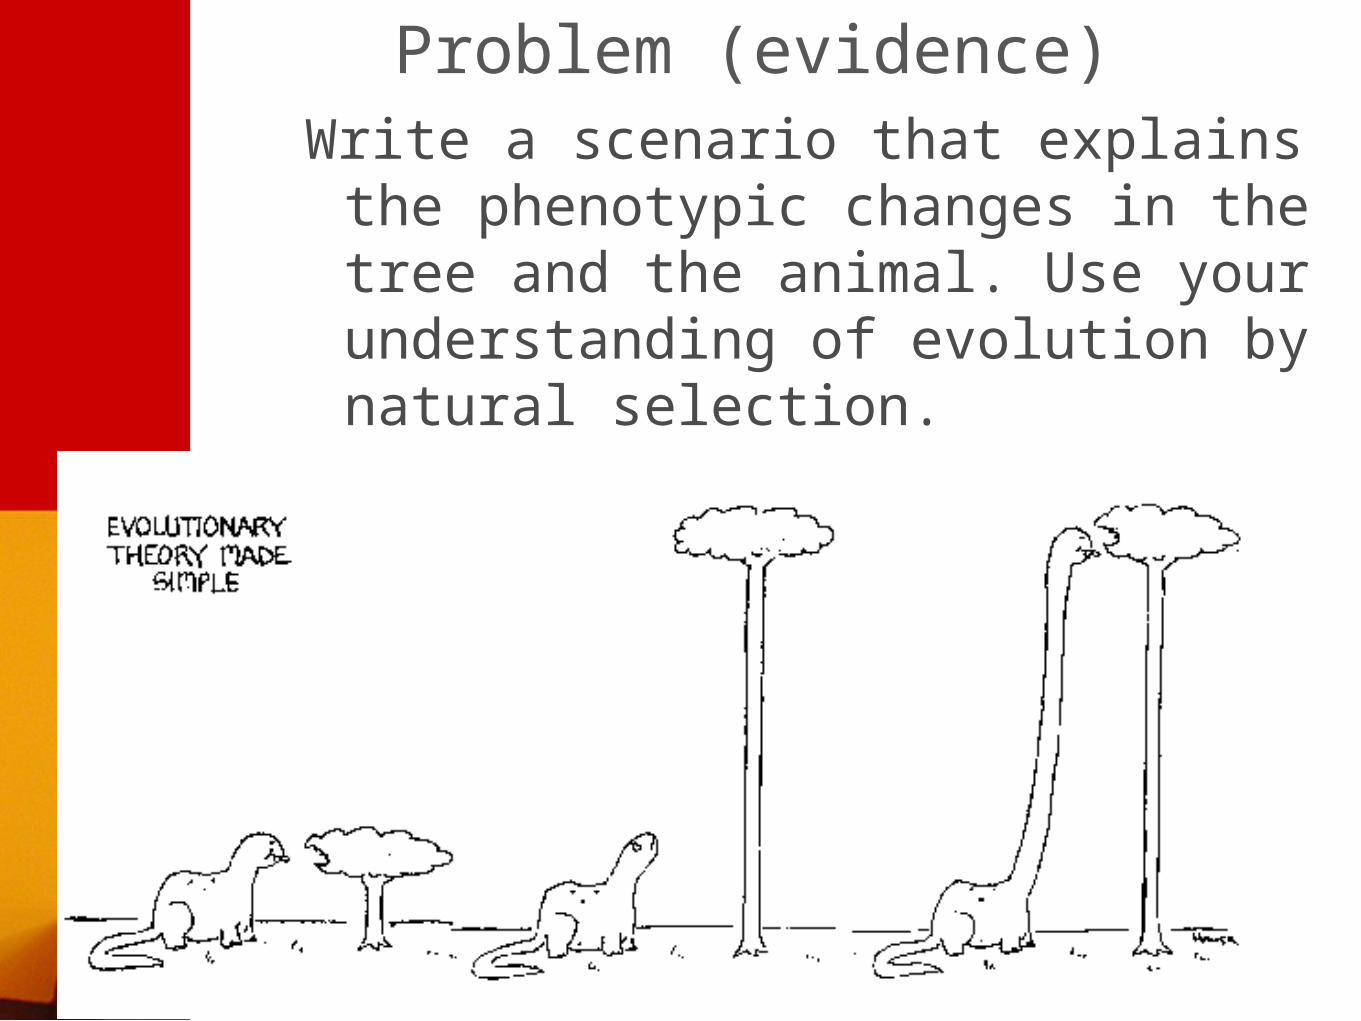
Problem (evidence)Write a scenario that explains the
phenotypic changes in the tree and the animal. Use your understanding of evolution by natural selection.
Text

How do we develop rubrics?
Describe the goal/objective for the activity, problem, task...Select the assessment tasks aligned with goalsDevelop performance standardsDifferentiate levels of responses based on clearly described criteriaRate (assign value) the categories
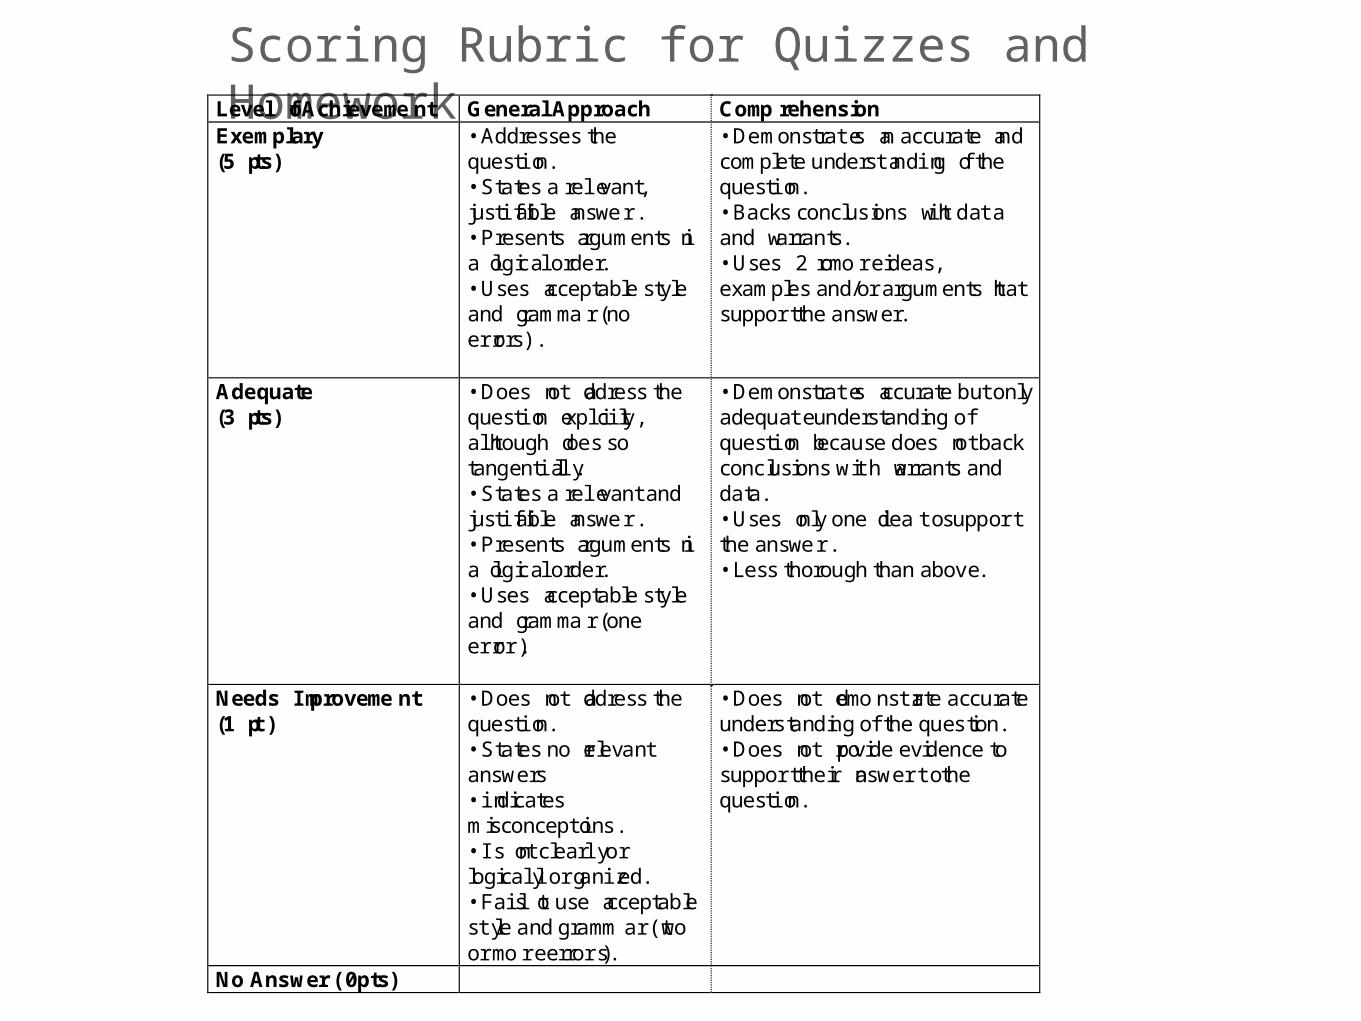
Scoring Rubric for Quizzes and HomeworkLevel of Achievement General Approach ComprehensionExemplary(5 pts)
• Addresses thequestion.• States a relevant,justifiable answer.• Presents arguments ina logical order.• Uses acceptable styleand grammar (noerrors).
• Demonstrates an accurate andcomplete understanding of thequestion.• Backs conclusions with dataand warrants.• Uses 2 or more ideas,examples and/or arguments thatsupport the answer.
Adequate(3 pts)
• Does not address thequestion explicitly,although does sotangentially.• States a relevant andjustifiable answer.• Presents arguments ina logical order.• Uses acceptable styleand grammar (oneerror).
• Demonstrates accurate but onlyadequate understanding ofquestion because does not backconclusions with warrants anddata.• Uses only one idea to supportthe answer.• Less thorough than above.
Needs Improvement(1 pt)
• Does not address thequestion.• States no relevantanswers• indicatesmisconceptions.• Is not clearly orlogically organized.• Fails to use acceptablestyle and grammar (twoor more errors).
• Does not demonstrate accurateunderstanding of the question.• Does not provide evidence tosupport their answer to thequestion.
No Answer (0 pts)

Advantages of Scoring Rubrics
Improve the reliability of scoring written assignments and oral presentationsConvey goals and performance expectations of students in an unambiguous wayConvey “grading standards” or “point values” and relate them to performance goalsEngage students in critical evaluation of their own performance Save time but spend it well
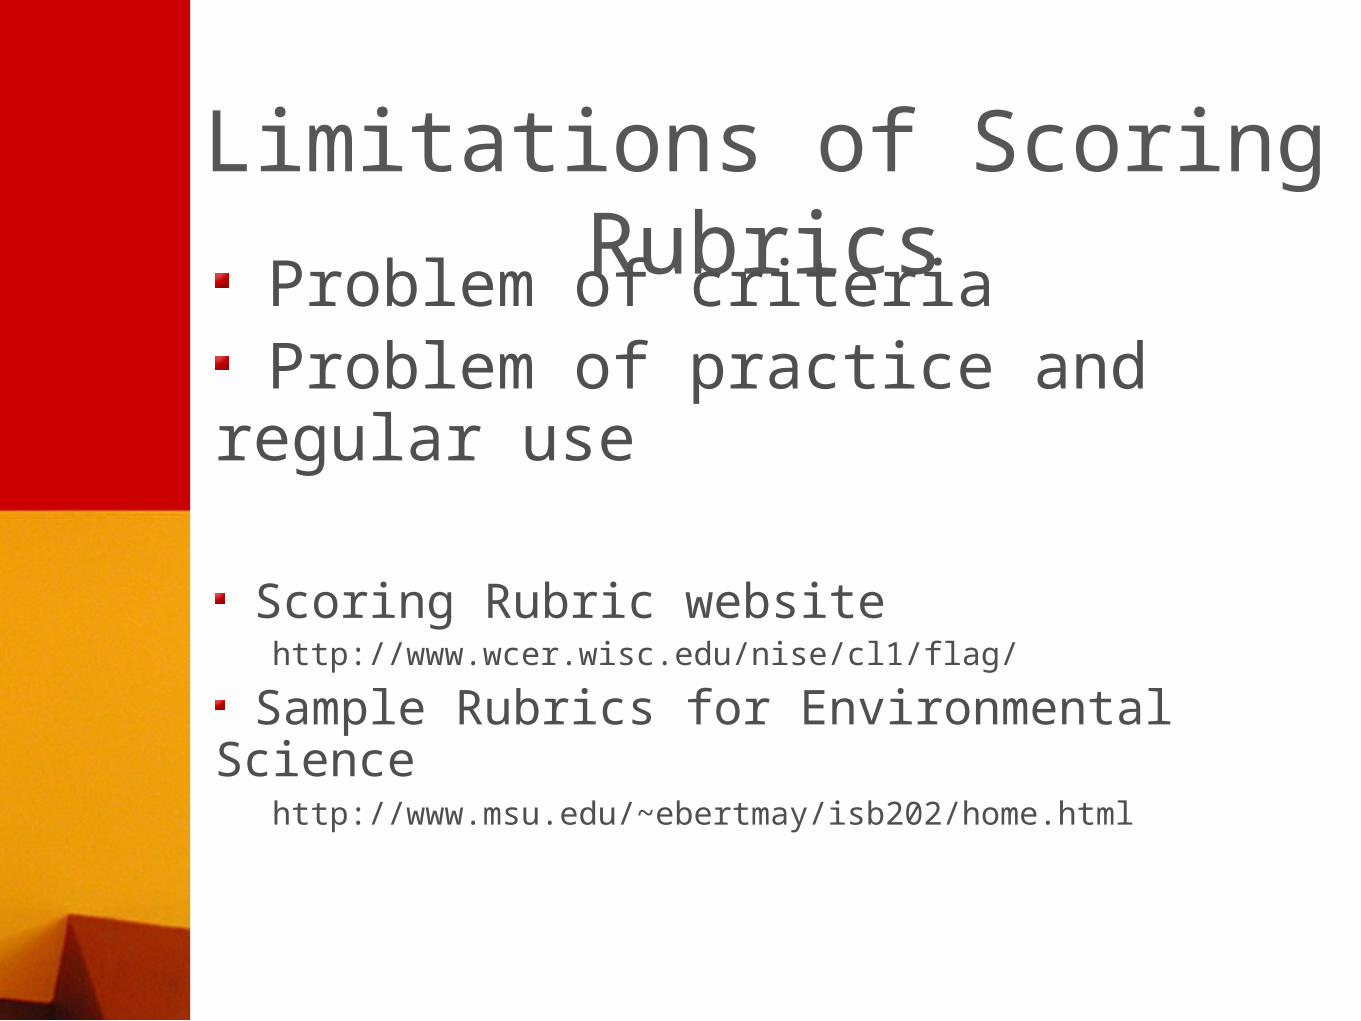
Limitations of Scoring Rubrics Problem of criteria
Problem of practice and regular use
Scoring Rubric website http://www.wcer.wisc.edu/nise/cl1/flag/
Sample Rubrics for Environmental Science http://www.msu.edu/~ebertmay/isb202/home.html
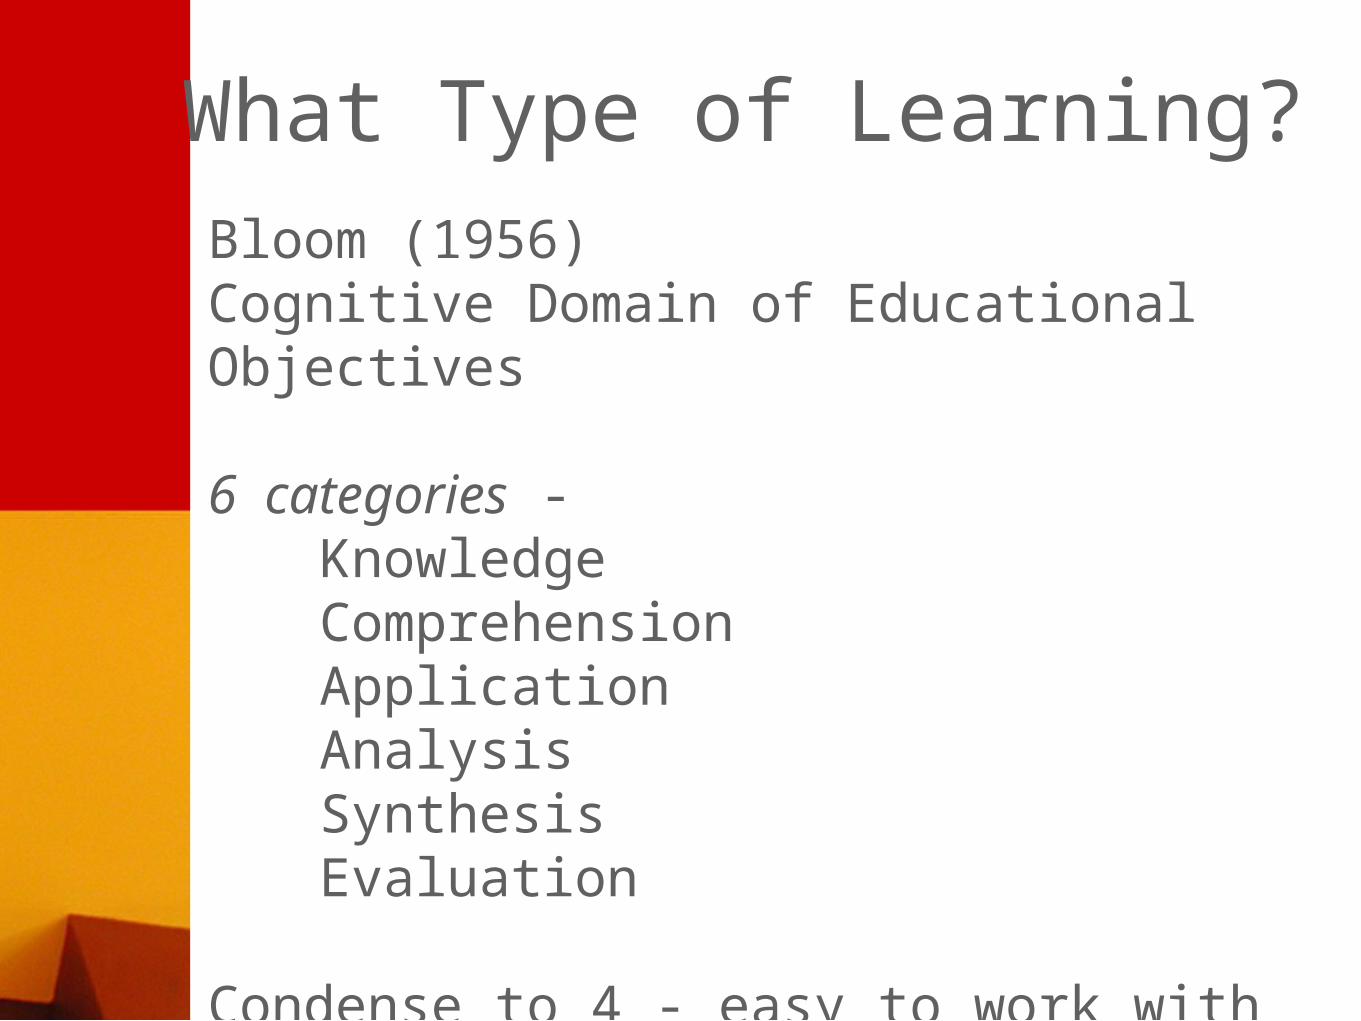
What Type of Learning?Bloom (1956) Cognitive Domain of Educational Objectives
6 categories - KnowledgeComprehensionApplicationAnalysisSynthesisEvaluation
Condense to 4 - easy to work with
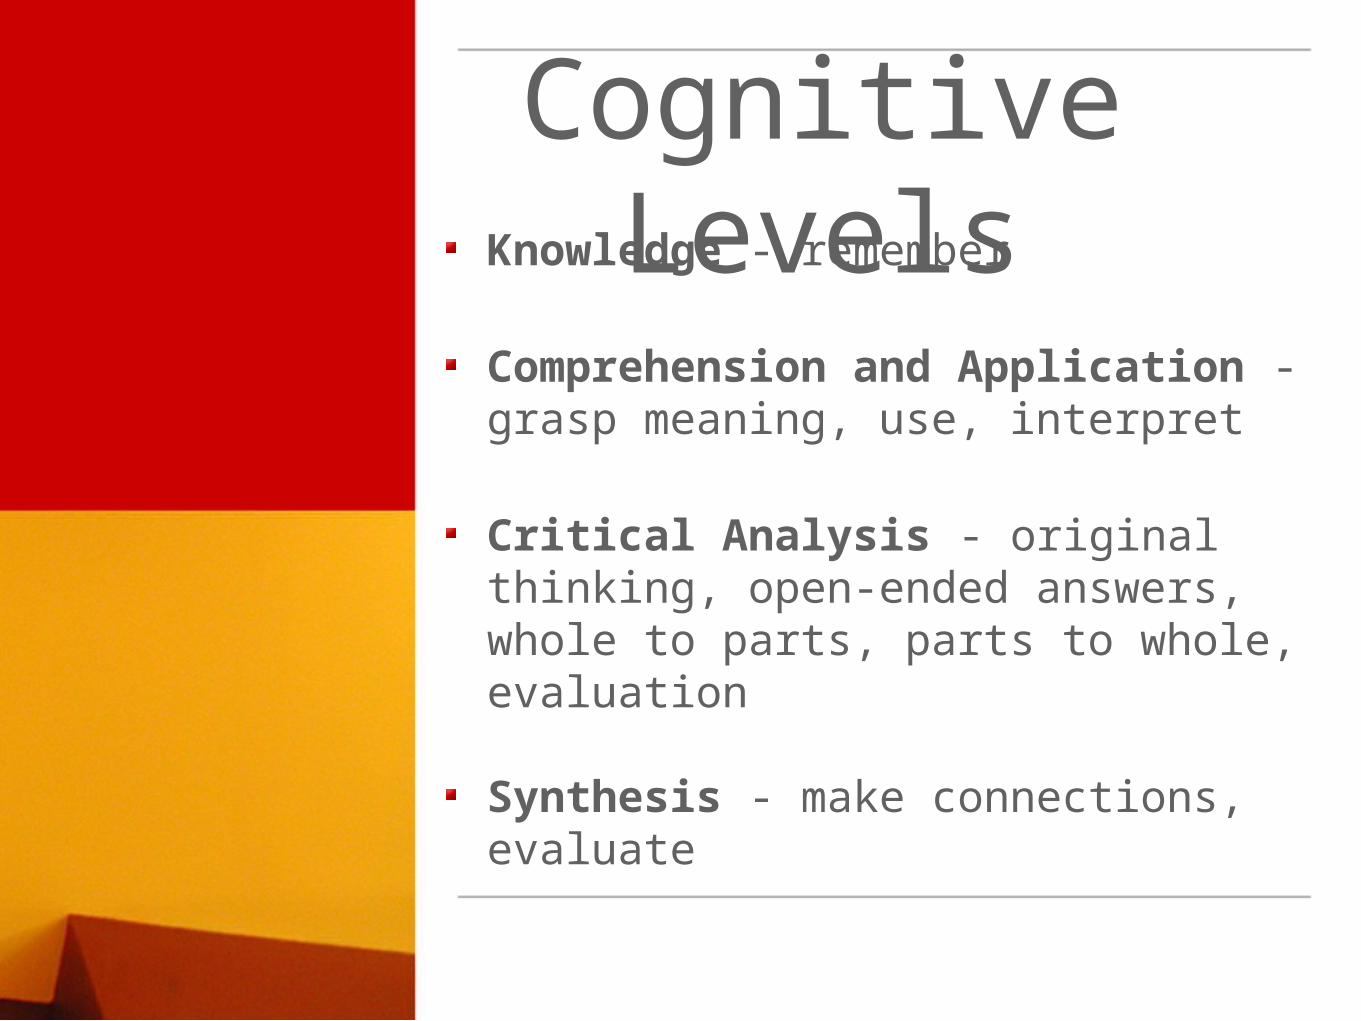
Cognitive LevelsKnowledge - remember
Comprehension and Application - grasp meaning, use, interpret
Critical Analysis - original thinking, open-ended answers, whole to parts, parts to whole, evaluation
Synthesis - make connections, evaluate

Model for Learning - System

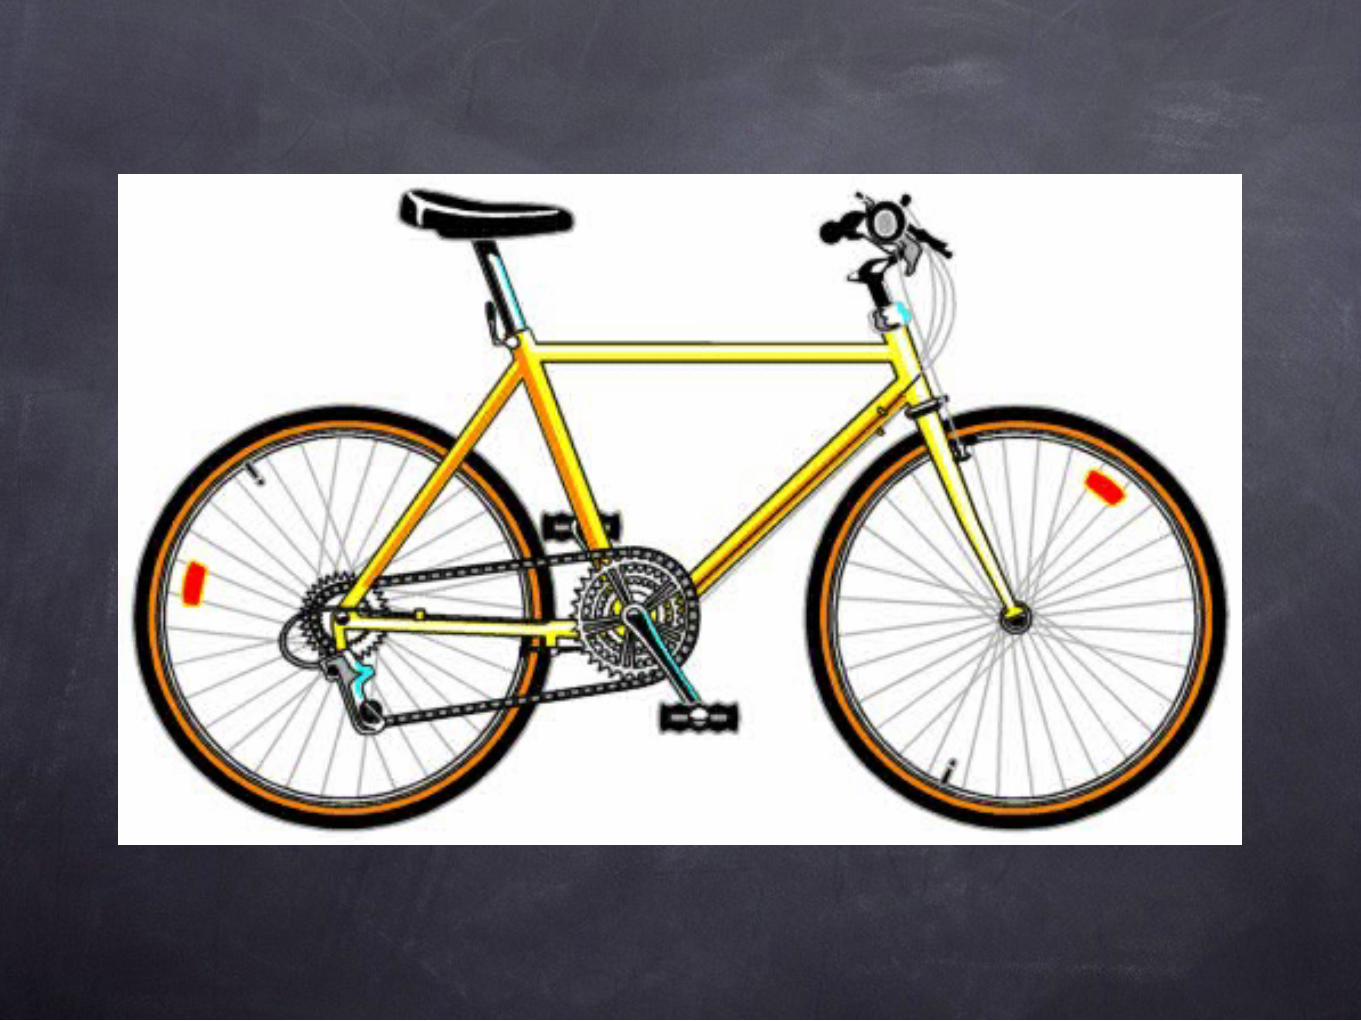
So what is a concept?1.Take a piece of paper -- one of the ‘dino-
tree’ responses will work--
2.Fold it in half.
3.On the top half, draw a bicycle.
4.On the bottom half, describe bicycle in writing.
5.Which is a better representation of the concept ‘bicycle’?
6.Would a concept map be “best”?

Concepts are...Pr
otot
ypica
lKnowledge-based
Lexical

Hierarchy
has
Structure
has
Concept Maps
Visual DiagramsOr Models
are represent
Knowledge or Understanding
Concepts
display
connectedwith
Linking Words
Used for
Assessment Organization
Reflection &Learning
promotes
Context
is constructedwith
NewInformation
PriorKnowledge
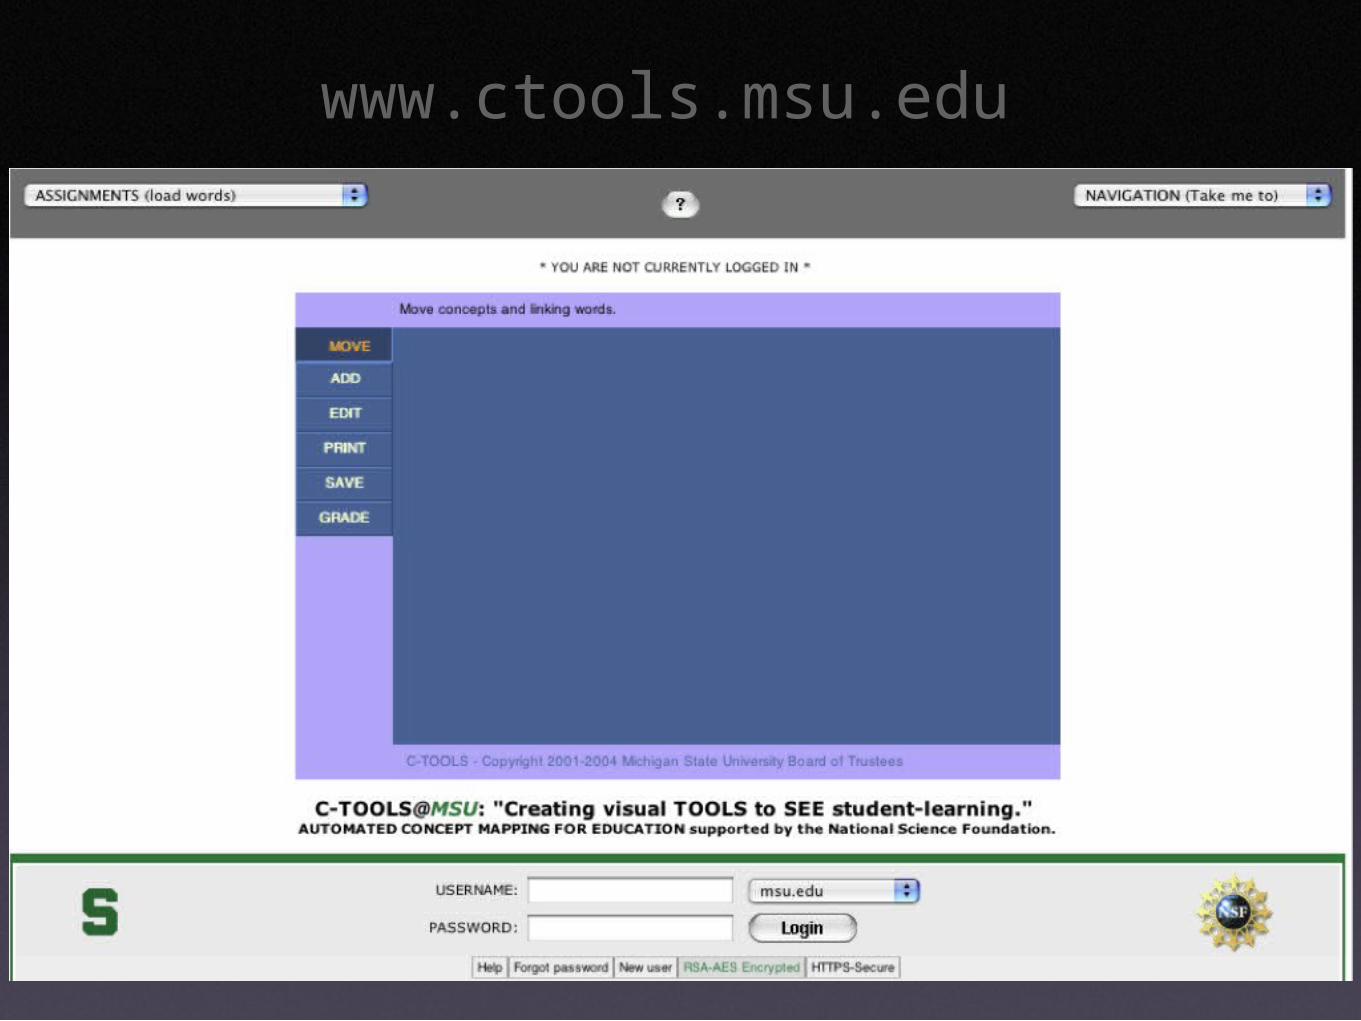
www.ctools.msu.edu

Robo Grader in Action

TextStudent’s Concept Map

1. Select a concept that is critical for your students to understand.
2. Identify 4 or 5 subconcepts that are important to understanding that concept
e.g., DNA - Gene- Chromosome - Enzyme
For a course you teach .....
3. Arrange them by rank order - top most general, bottom most specific
4. Add linking lines to make connections between two concepts
5. Add linking words that describe the relationship between two concepts

How do analogous assessment questions help us determine students’ prior understanding and progressive thinking about the carbon cycle?
Question

Concept 1: Matter disappears during decomposition of organisms in the soil.
Concept 2: Photosynthesis as Energy: Photosynthesis provides energy for uptake of nutrients through roots which builds biomass. No biomass built through photosynthesis alone.
Concept 3: Thin Air: CO2 and O2 are gases therefore, do not
have mass and therefore, can not add or take away mass from an organism.
Concept 4: Plant Altruism: CO2 is converted to O2 in plant
leaves so that all organisms can ‘breathe’.
Concept 5: All Green: Plants have chloroplasts instead of mitochondria so they can not respire.
Some Common Misconceptions about Photosynthesis & Respiration
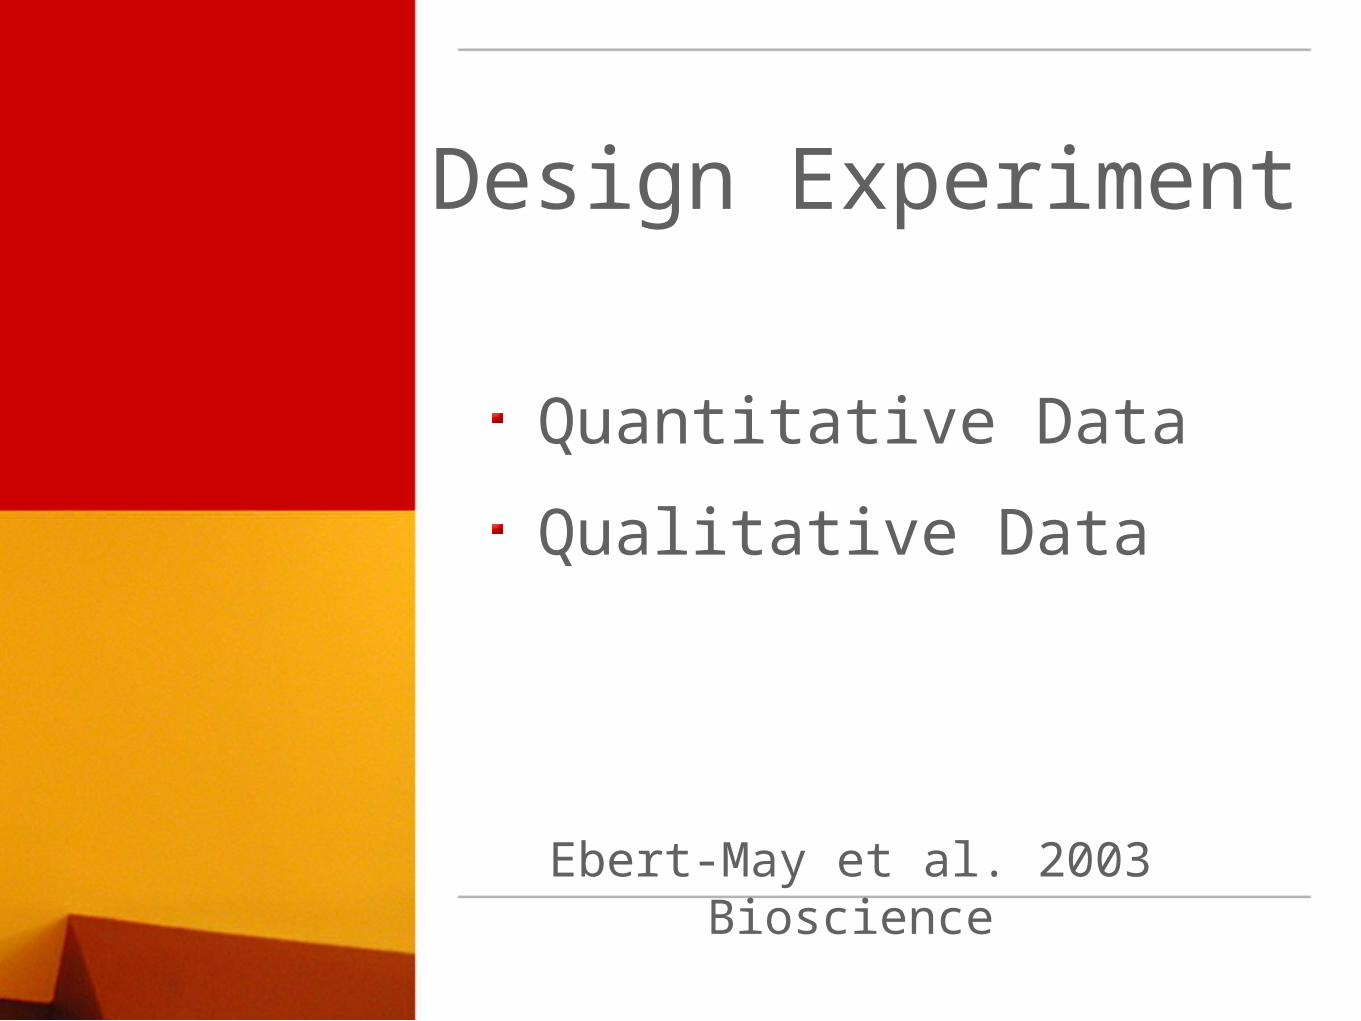
Quantitative Data
Qualitative Data
Design Experiment
Ebert-May et al. 2003 Bioscience

Instructional Design
Two class meetings on carbon cycle (160 minutes)Active, inquiry-based learning
Cooperative groupsQuestions, group processing, large lecture sections, small discussion sections, multi-week laboratory investigationHomework problems including web-based modules
Different faculty for each courseOne graduate/8-10 undergraduate TAs per course

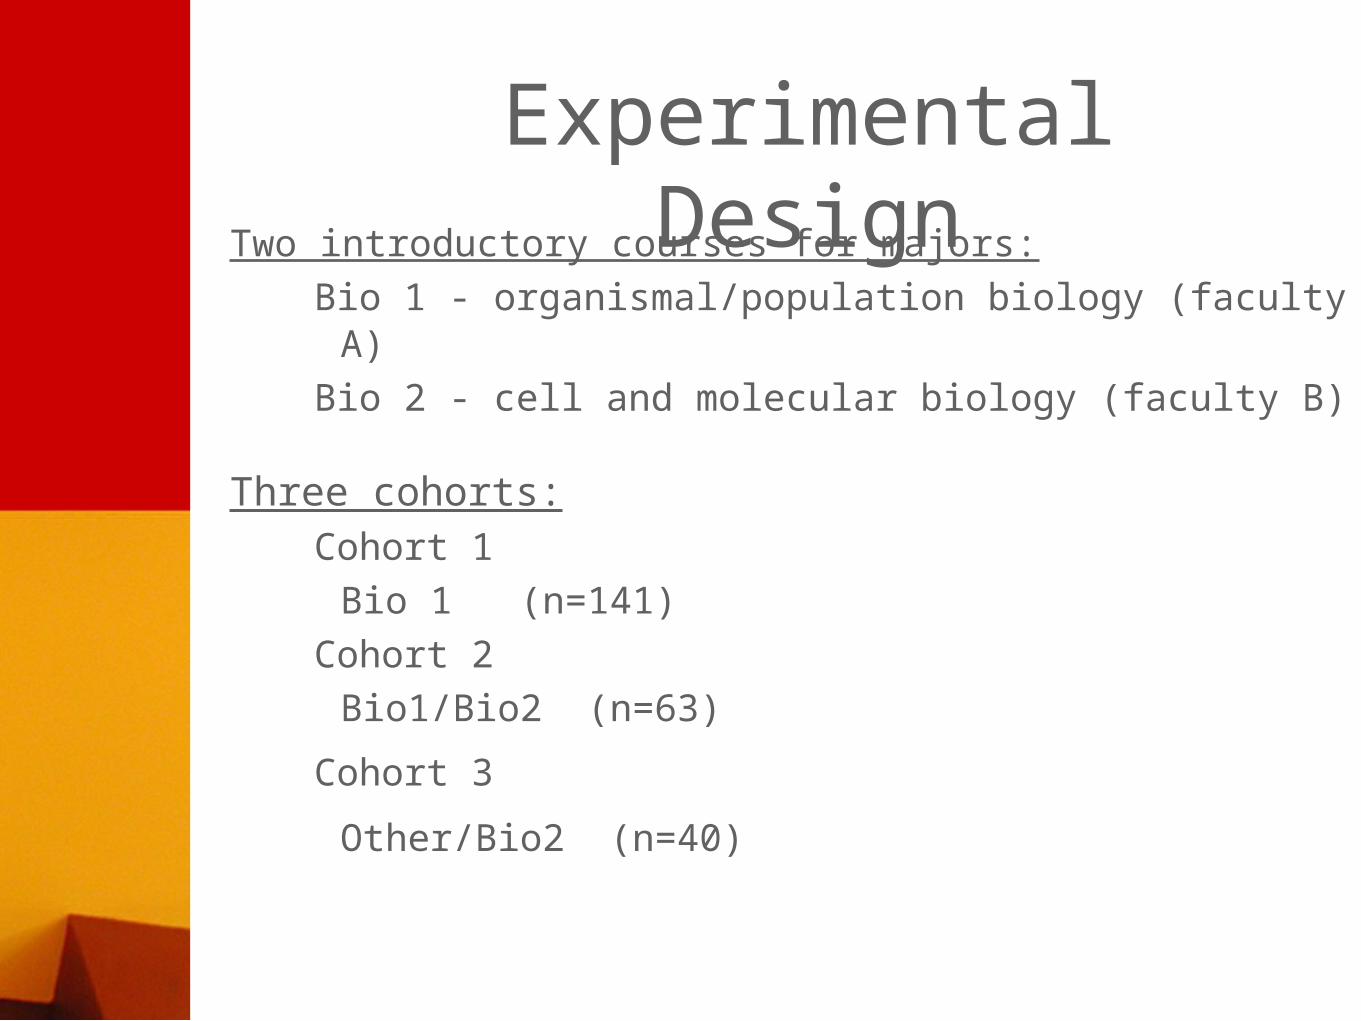
Experimental DesignTwo introductory courses for majors:
Bio 1 - organismal/population biology (faculty A)Bio 2 - cell and molecular biology (faculty B)
Three cohorts:Cohort 1
Bio 1 (n=141)Cohort 2
Bio1/Bio2 (n=63)
Cohort 3
Other/Bio2 (n=40)

Assessment DesignMultiple iterations/versions of the carbon cycle problem Pretest, midterm, final with additional formative assessments during classAdministered during instructionSemester 1 - pretest, midterm, final exam
Semester 2 - final exam

Problem
Experimental setup:Weighed out 3 batches of radish seeds
each weighing 1.5 g.
Experimental treatments:1. Seeds placed on moistened paper
towels in LIGHT2. Seeds placed on moistened paper
towels in DARK3. Seeds not moistened (left DRY)
placed in light

Problem (2)
After 1 week, all plant material was dried in an oven overnight (no water left) and plant biomass was measured in grams. Predict the biomass of the plant material in the various treatments.
Water, lightWater, dark
No water, light
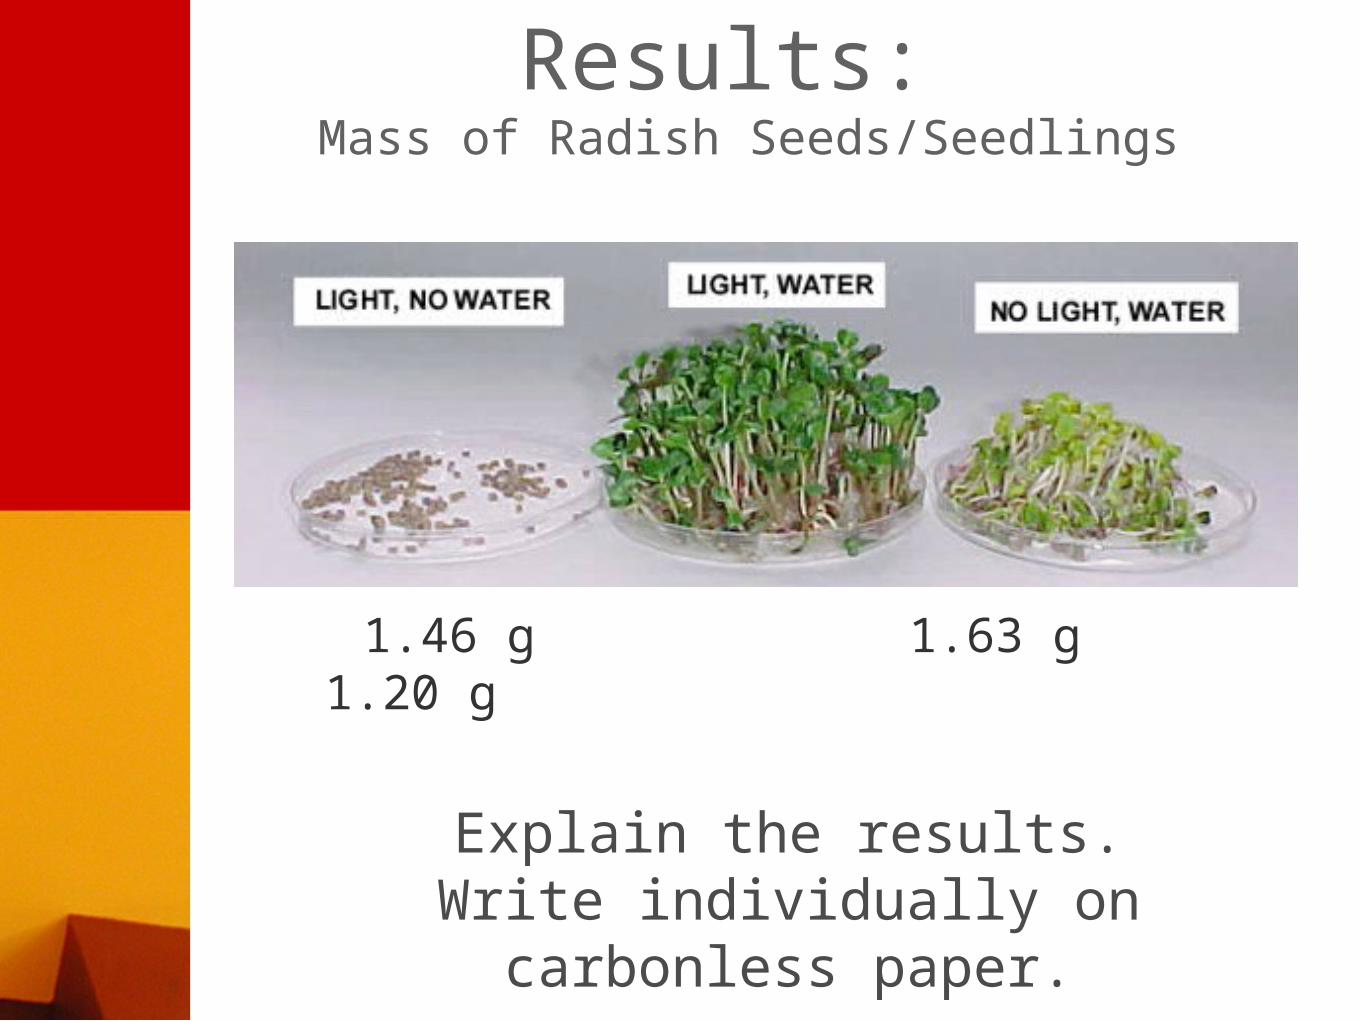
Results: Mass of Radish Seeds/Seedlings
1.46 g 1.63 g 1.20 g
Write an explanation about the results.
Explain the results.Write individually on carbonless
paper.

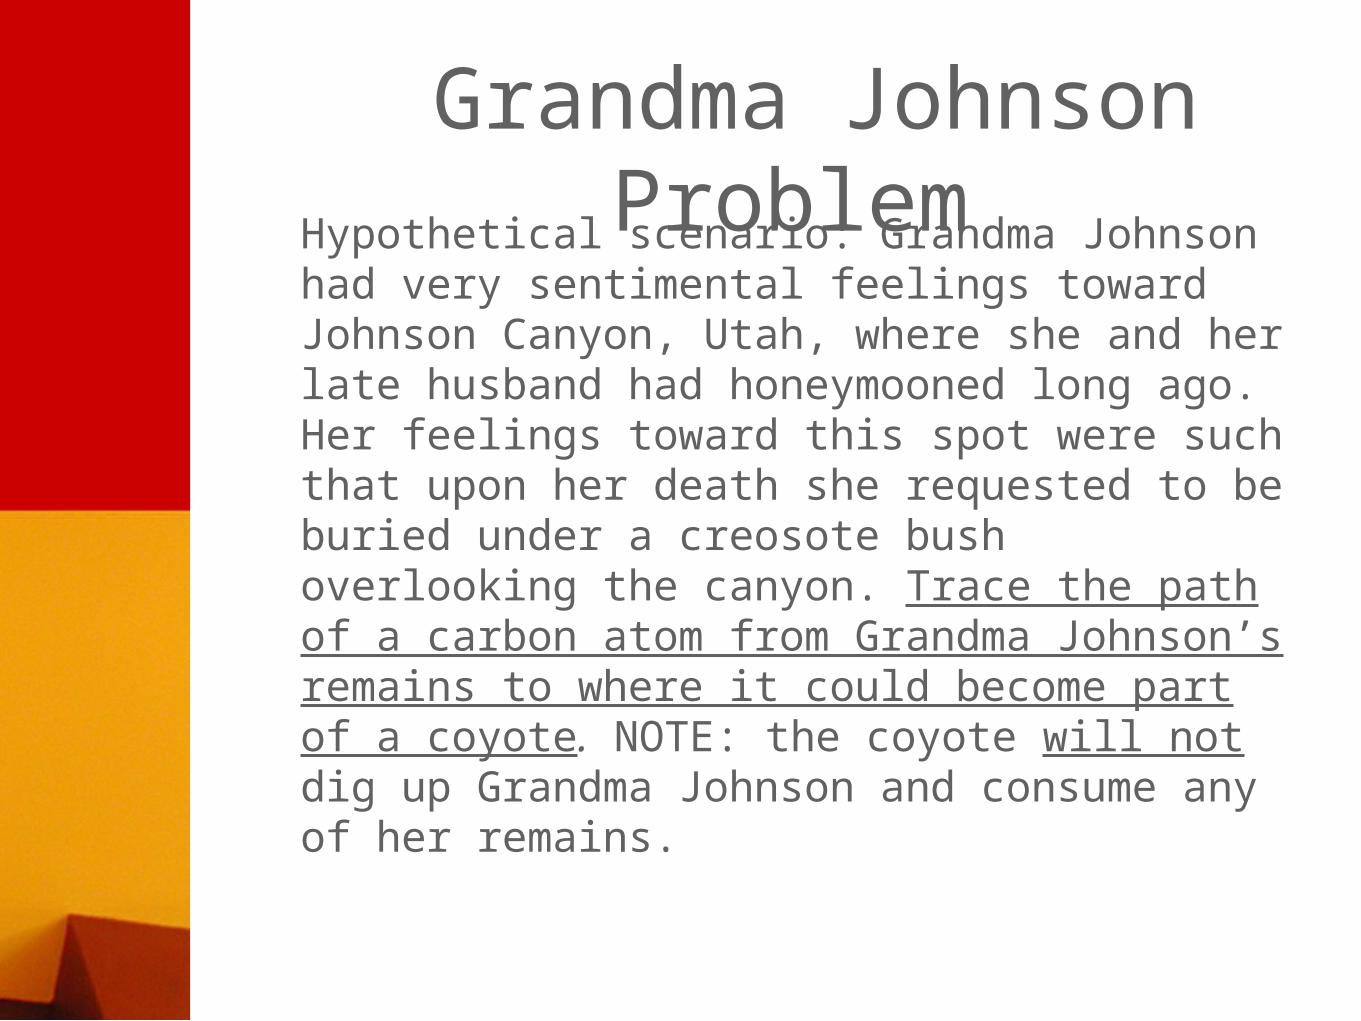
Grandma Johnson Problem Hypothetical scenario: Grandma Johnson
had very sentimental feelings toward Johnson Canyon, Utah, where she and her late husband had honeymooned long ago. Her feelings toward this spot were such that upon her death she requested to be buried under a creosote bush overlooking the canyon. Trace the path of a carbon atom from Grandma Johnson’s remains to where it could become part of a coyote. NOTE: the coyote will not dig up Grandma Johnson and consume any of her remains.

Analysis of Responses
Used same scoring rubric (coding scheme) for all three problems - calibrated by adding additional criteria when necessary, rescoring:
Examined two major concepts: Concept 1: Decomposers respire CO2
Concept 2: Plants uptake of CO2
Explanations categorized into two groups:Organisms (trophic levels)Processes (metabolic)

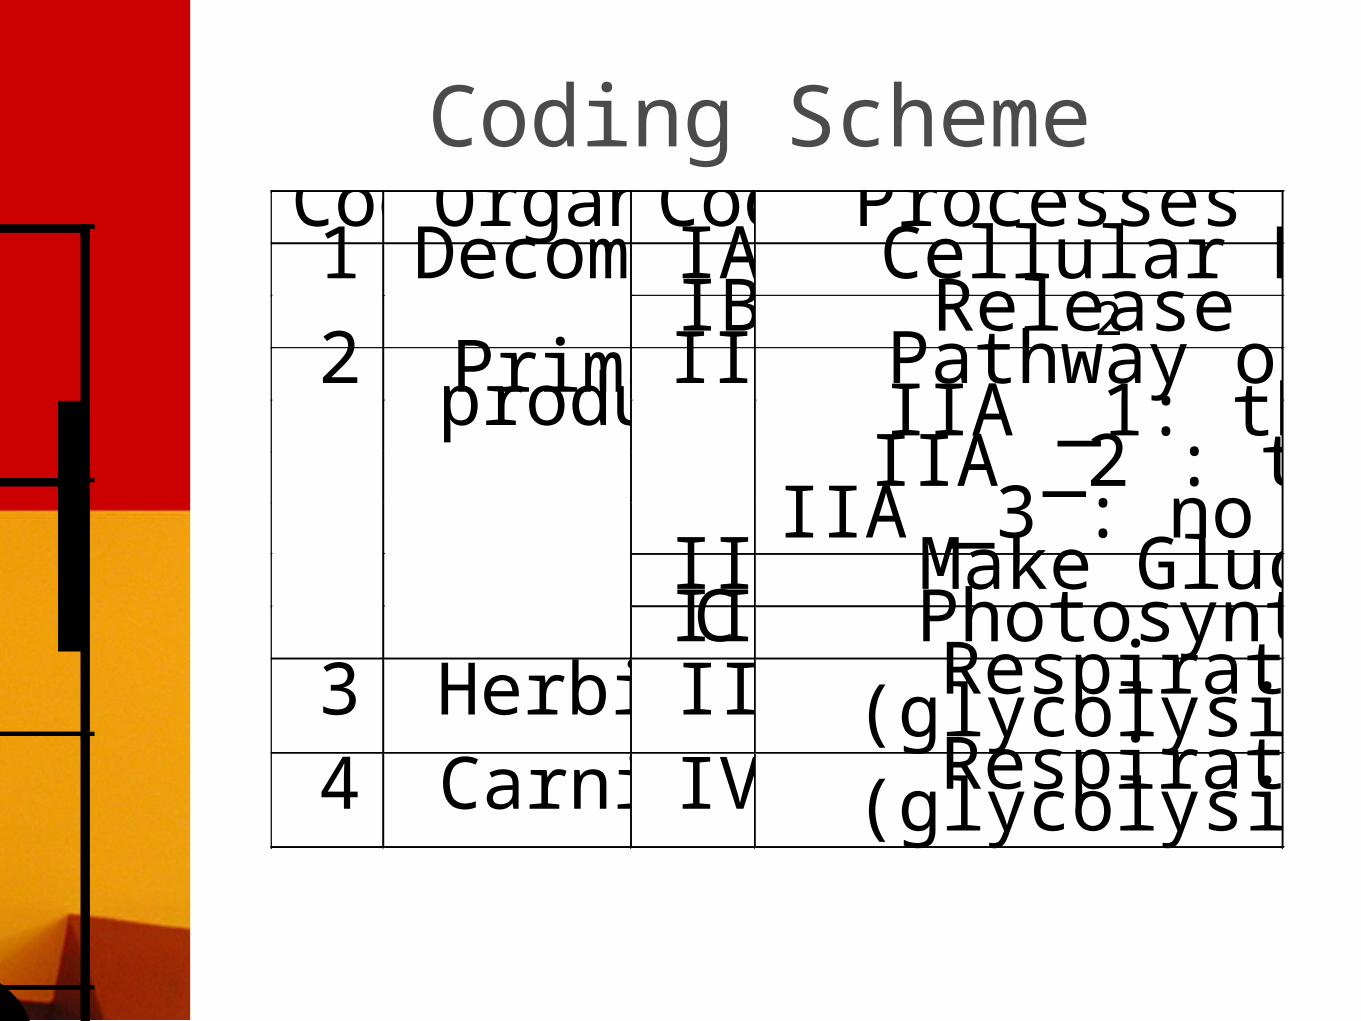
Code Organisms Code Processes and pathways 1 Decomposers IA Cellular Respiration IB Release CO2 2 IIA Pathway of Carbon
Primary producers IIA _1: through Air IIA _2 : through Root IIA _3 : no mention about pathway IIB Make Glucose IIC Photosynthesis 3 Herbivore III Respiration
(glycolysis, Kreb cycle) 4 Carnivore IV Respiration
(glycolysis, Kreb cycle)
Coding Scheme
Code Organisms Code Processes and pathways 1 Decomposers IA Cellular Respiration IB Release CO2 2 IIA Pathway of Carbon
Primary producers IIA _1: through Air IIA _2 : through Root IIA _3 : no mention about pathway IIB Make Glucose IIC Photosynthesis 3 Herbivore III Respiration
(glycolysis, Kreb cycle) 4 Carnivore IV Respiration
(glycolysis, Kreb cycle)

Corr
ect
Stu
den
t R
esp
on
ses
(%)
Cellular Respiration by Decomposers
Bio1/Bio2 Other/Bio2
Friedmans, p<0.01

Pathway of Carbon in Photosynthesis
Bio1/Bio2
Corr
ect
Stu
dent
Resp
on
ses
(%)
Other/Bio2
Friedmans, p<0.05

Does active, inquiry-based instructional design influence students’ understanding of evolution and natural selection?
Pre-Posttest Analysis

Changes in a population occur through a gradual change in individual members of a population.
New traits in species are developed in response to need.
All members of a population are genetically equivalent, variation and fitness are not considered.
Traits acquired during an individual’s lifetime will be inherited by offspring.
Alternative Conceptions: Natural Selection
(AAAS 1999)
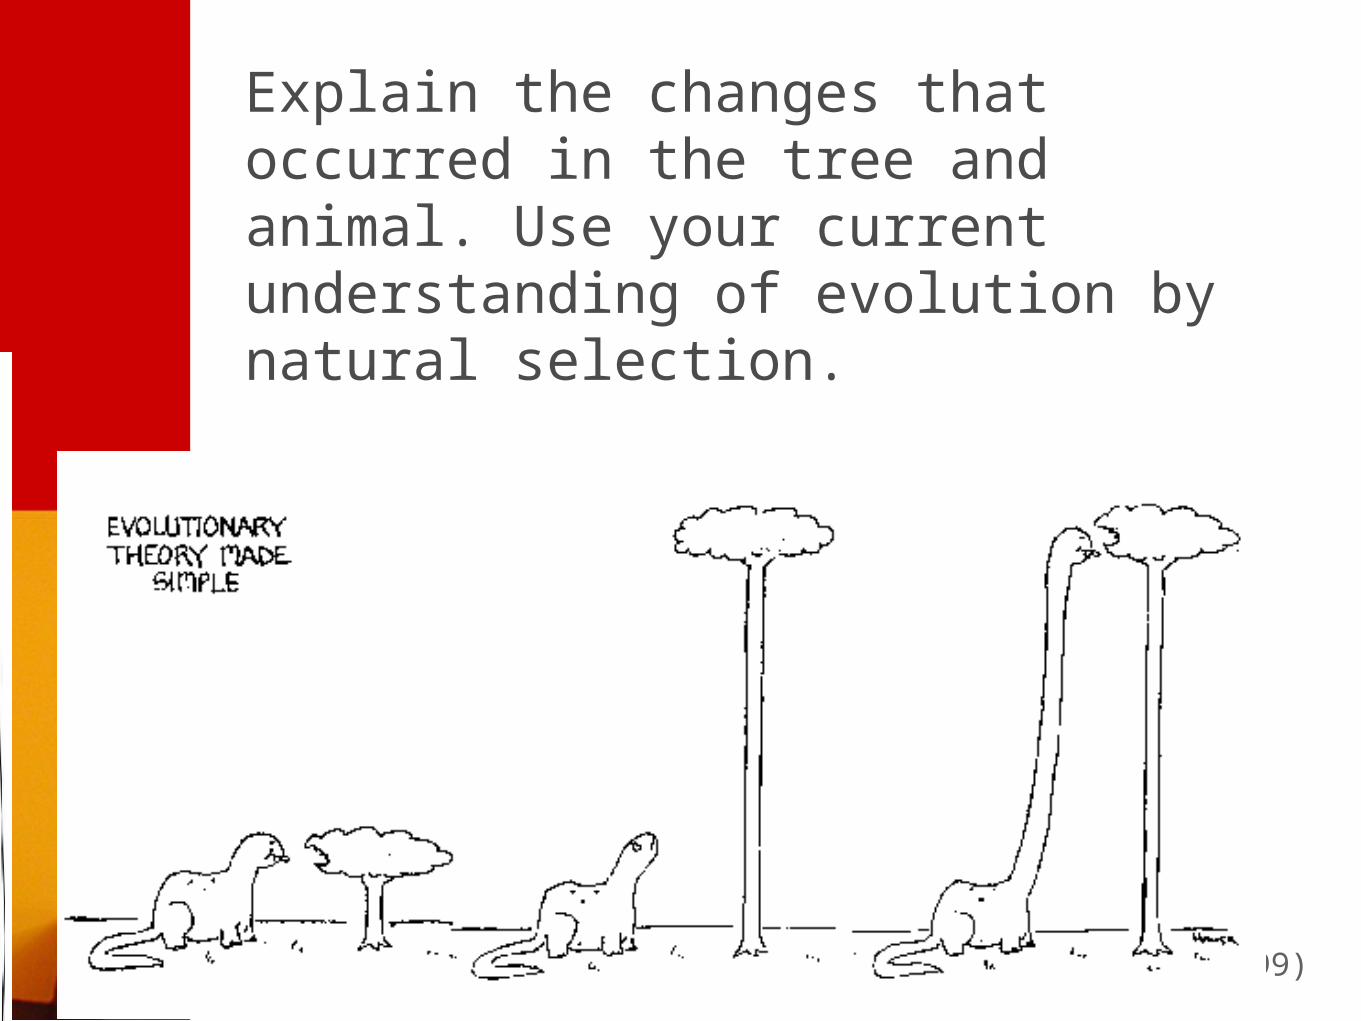
Explain the changes that occurred in the tree and animal. Use your current understanding of evolution by natural selection.
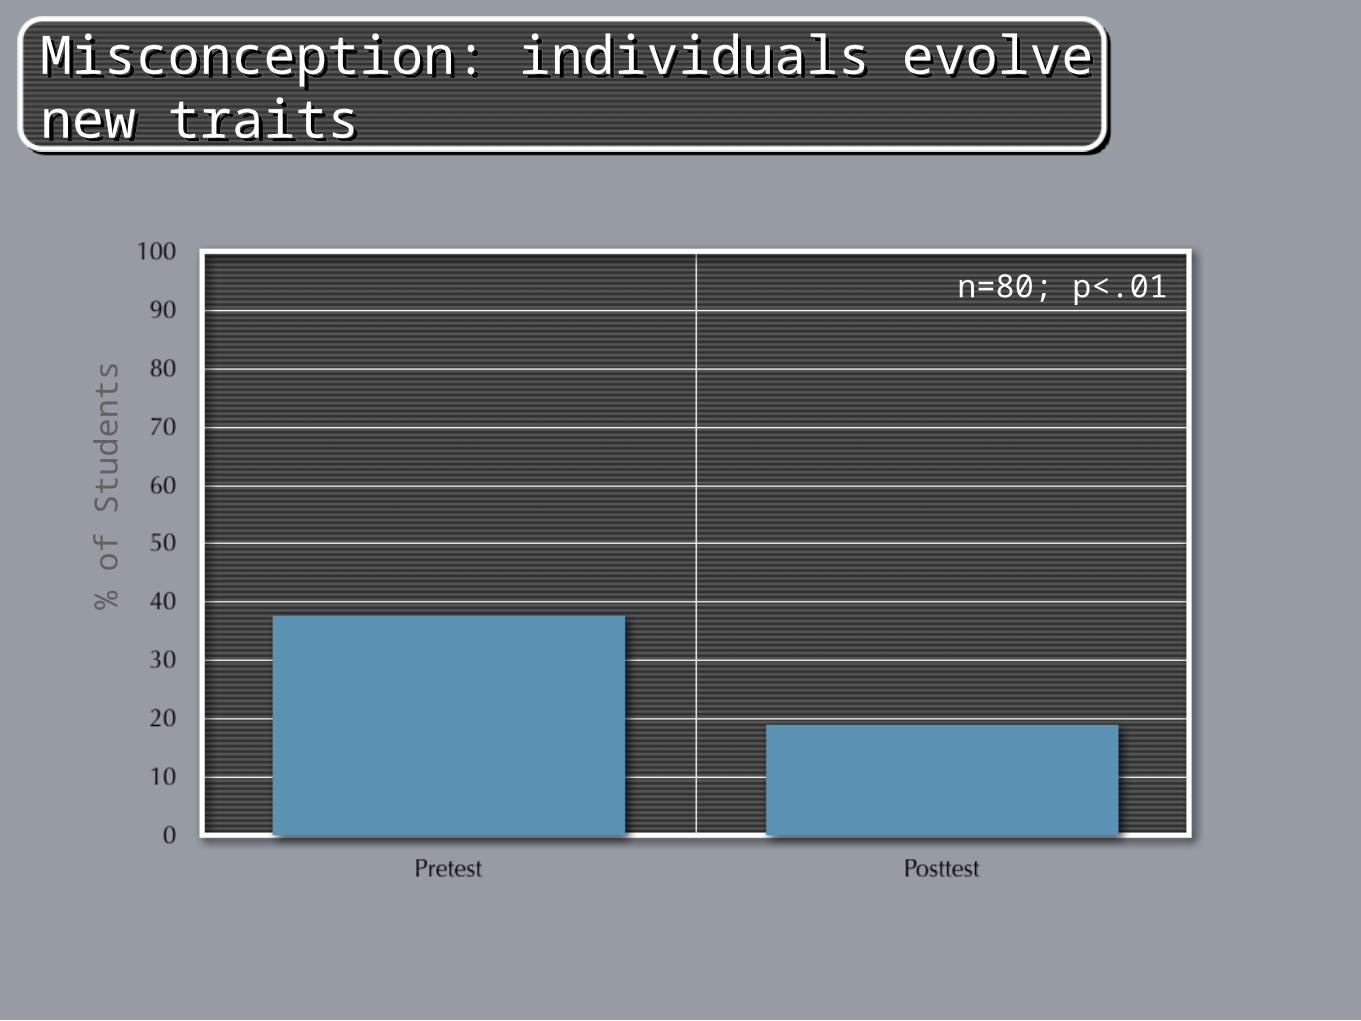
Misconception: individuals evolve new traitsMisconception: individuals evolve new traits
% o
f S
tud
ents
n=80; p<.01
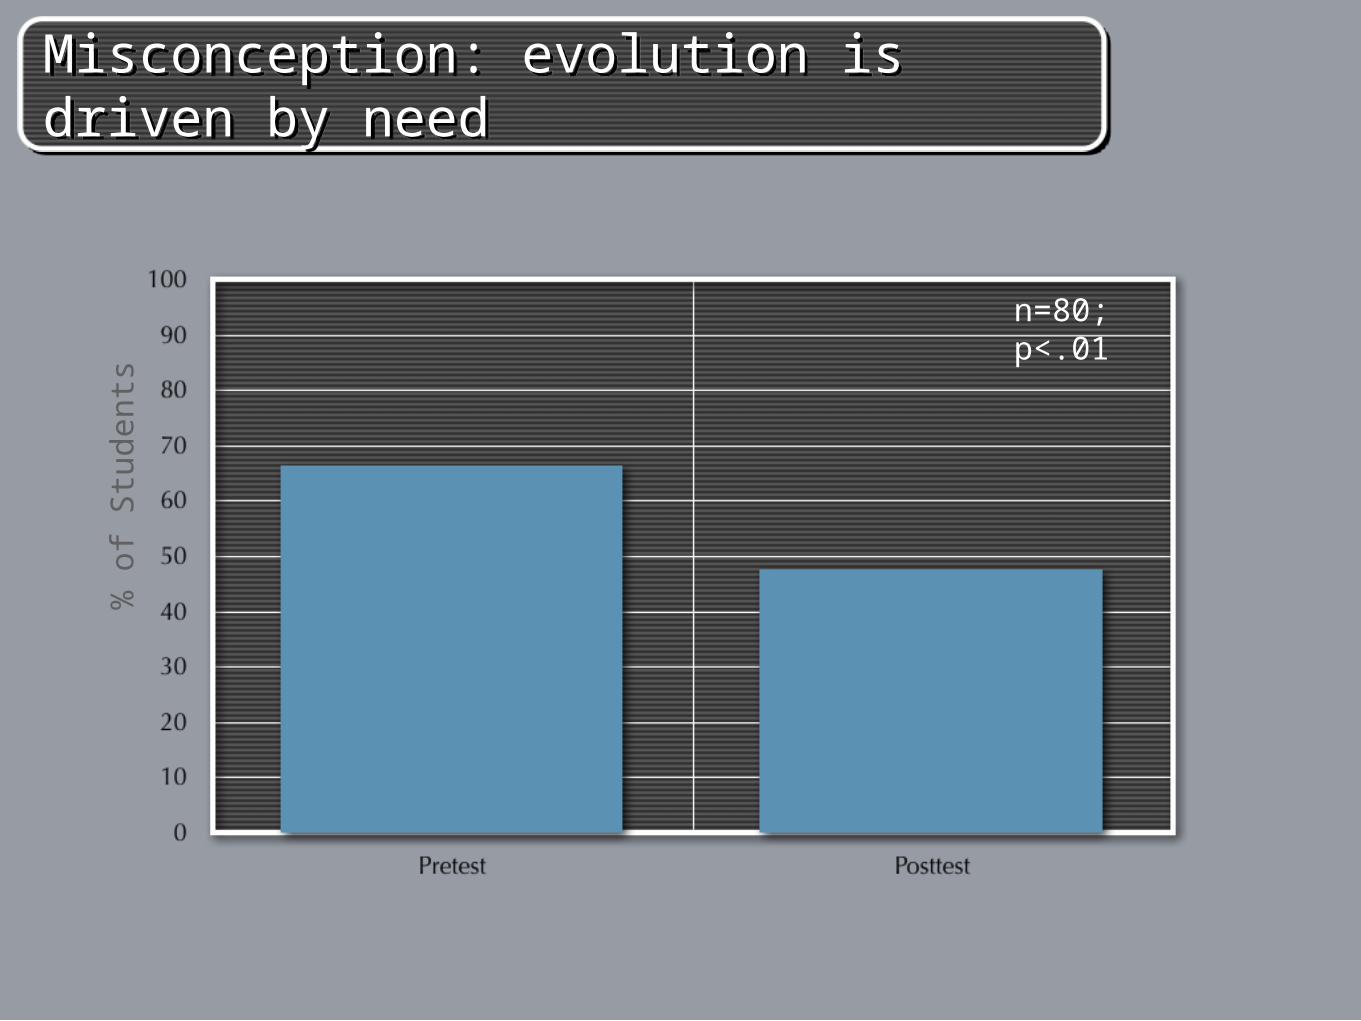
Misconception: evolution is driven by needMisconception: evolution is driven by need
% o
f S
tud
ents
n=80; p<.01
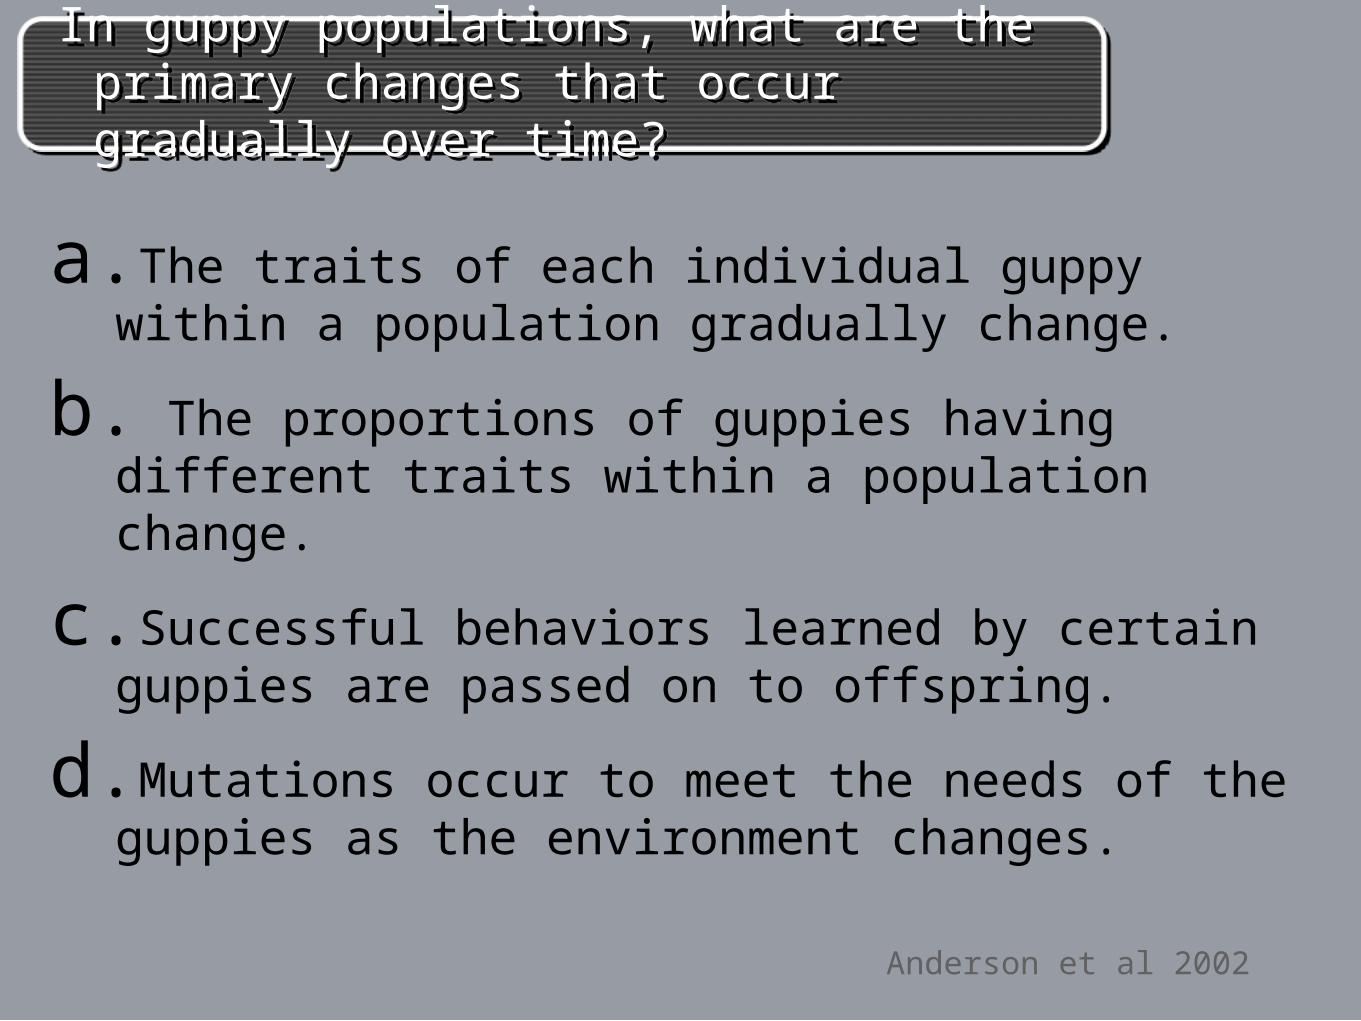
In guppy populations, what are the primary changes that occur gradually over time?
In guppy populations, what are the primary changes that occur gradually over time?
a.The traits of each individual guppy within a population gradually change.
b. The proportions of guppies having different traits within a population change.
c.Successful behaviors learned by certain guppies are passed on to offspring.
d.Mutations occur to meet the needs of the guppies as the environment changes.
Anderson et al 2002

Posttest: Student responses to mcPosttest: Student responses to mc
% o
f S
tud
ents
n=171
*
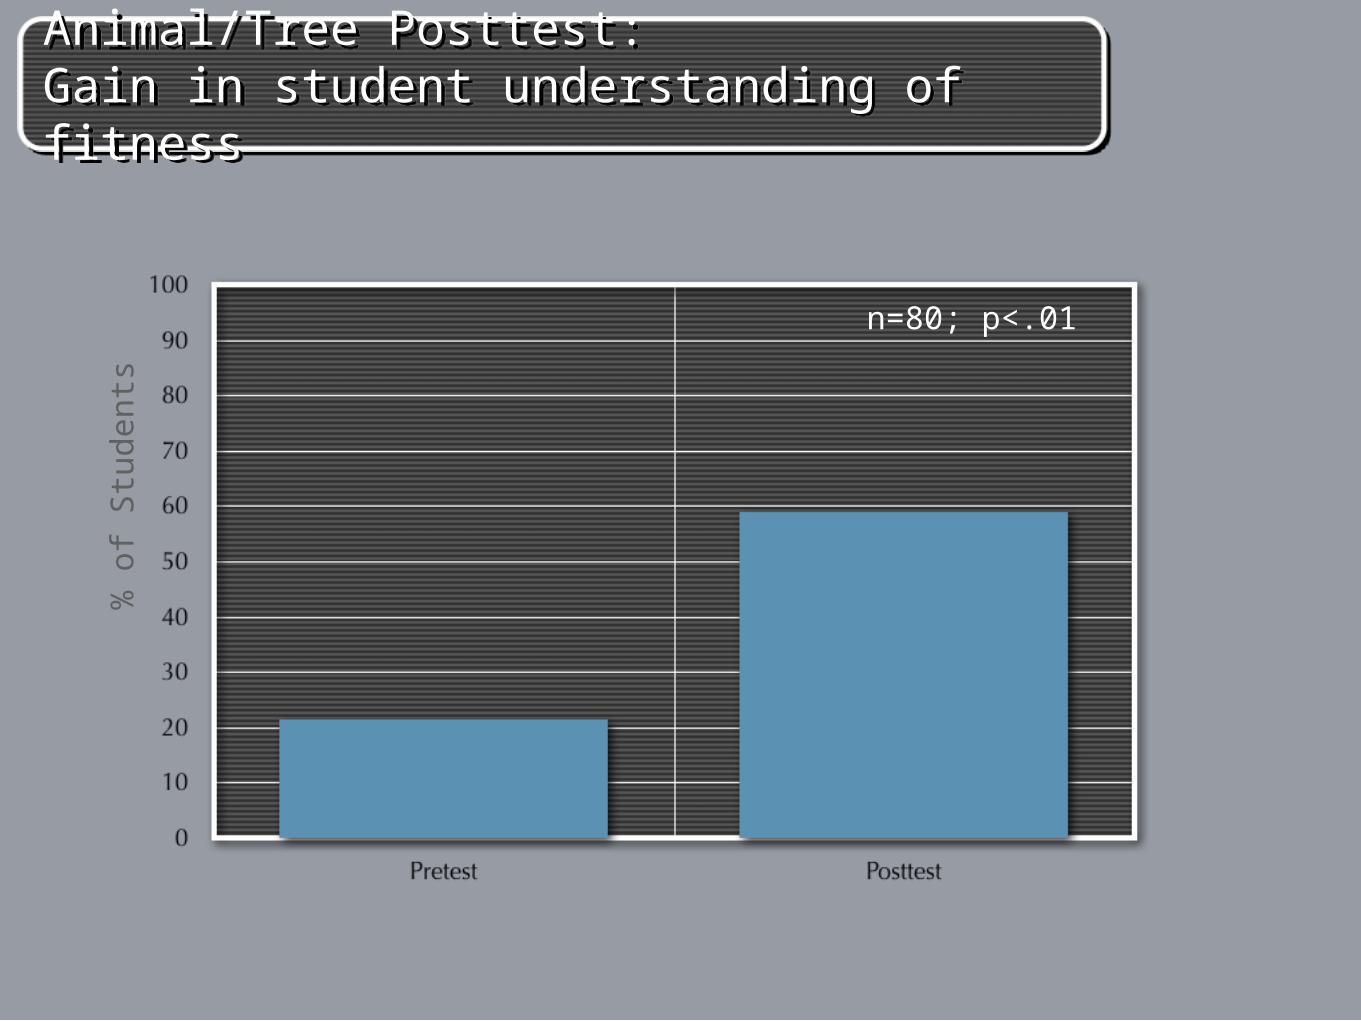
Animal/Tree Posttest: Gain in student understanding of fitnessAnimal/Tree Posttest: Gain in student understanding of fitness
% o
f S
tud
ents
n=80; p<.01

Quantitative Data
Qualitative Data
Design Experiment
Ebert-May et al. 2003 Bioscience
How do assessment questions help us determine students’ prior understanding and progressive thinking about the carbon cycle.
Question

Instructional Design
Two class meetings on carbon cycle (160 minutes)Active, inquiry-based learning•Cooperative groups•Questions, group processing, large lecture
sections, small discussion sections, multi-week laboratory investigation
•Homework problems including web-based modules
Different faculty for each course•One graduate/8-10 undergraduate TAs per
course
Experimental DesignTwo introductory courses for majors:
Bio 1 - organismal/population biology (faculty A)Bio 2 - cell and molecular biology (faculty B)
Three cohorts:Cohort 1
Bio 1 (n=141)Cohort 2
Bio1/Bio2 (n=63)
Cohort 3
Other/Bio2 (n=40)

Assessment DesignMultiple iterations/versions of the carbon cycle problem Pretest, midterm, final with additional formative assessments during classAdministered during instruction Semester 1 - pretest, midterm, final exam Semester 2 - final exam
Grandma Johnson Problem Hypothetical scenario: Grandma Johnson
had very sentimental feelings toward Johnson Canyon, Utah, where she and her late husband had honeymooned long ago. Her feelings toward this spot were such that upon her death she requested to be buried under a creosote bush overlooking the canyon. Trace the path of a carbon atom from Grandma Johnson’s remains to where it could become part of a coyote. NOTE: the coyote will not dig up Grandma Johnson and consume any of her remains.

Analysis of Responses
Used same scoring rubric (coding scheme) for all three problems - calibrated by adding additional criteria when necessary, rescoring:
Examined two major concepts: Concept 1: Decomposers respire CO2
Concept 2: Plants uptake of CO2
Explanations categorized into two groups:Organisms (trophic levels)Processes (metabolic)
Code Organisms Code Processes and pathways 1 Decomposers IA Cellular Respiration IB Release CO2 2 IIA Pathway of Carbon
Primary producers IIA _1: through Air IIA _2 : through Root IIA _3 : no mention about pathway IIB Make Glucose IIC Photosynthesis 3 Herbivore III Respiration
(glycolysis, Kreb cycle) 4 Carnivore IV Respiration
(glycolysis, Kreb cycle)
Coding Scheme
Code Organisms Code Processes and pathways 1 Decomposers IA Cellular Respiration IB Release CO2 2 IIA Pathway of Carbon
Primary producers IIA _1: through Air IIA _2 : through Root IIA _3 : no mention about pathway IIB Make Glucose IIC Photosynthesis 3 Herbivore III Respiration
(glycolysis, Kreb cycle) 4 Carnivore IV Respiration
(glycolysis, Kreb cycle)

Corr
ect
Stu
den
t R
esp
on
ses
(%)
Cellular Respiration by Decomposers
Bio1/Bio2 Other/Bio2
Friedmans, p<0.01

Pathway of Carbon in Photosynthesis
Bio1/Bio2
Corr
ect
Stu
dent
Resp
on
ses
(%)
Other/Bio2
Friedmans, p<0.05
Question 9
True or False?
Assessing student learning in science parallels what scientists do as researchers.
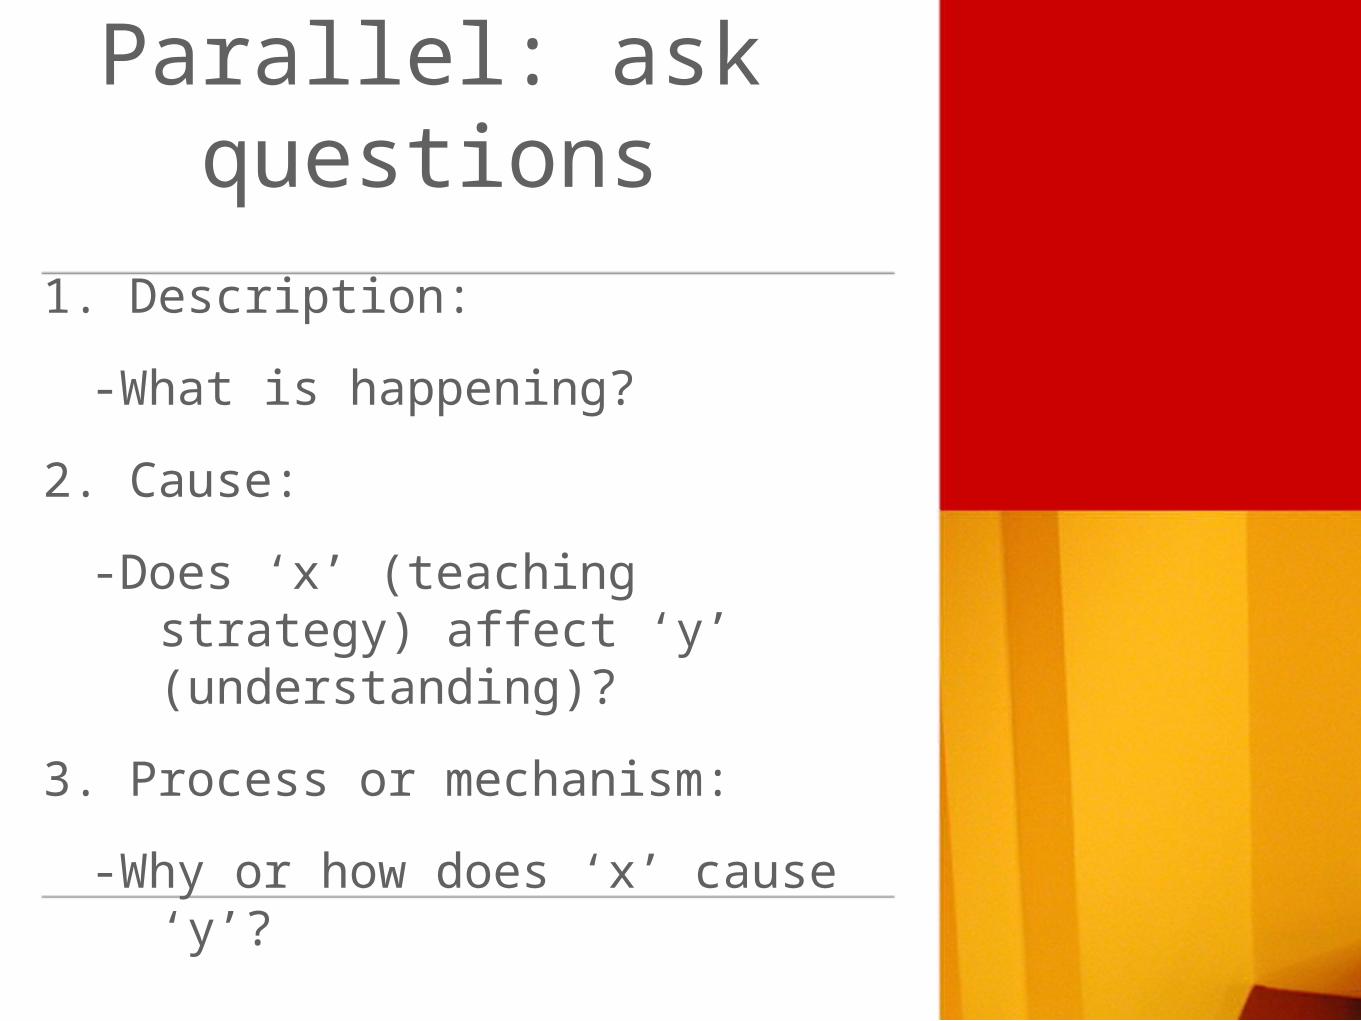
1. Description:
-What is happening?
2. Cause:
-Does ‘x’ (teaching strategy) affect ‘y’ (understanding)?
3. Process or mechanism:
-Why or how does ‘x’ cause ‘y’?
Parallel: ask questions
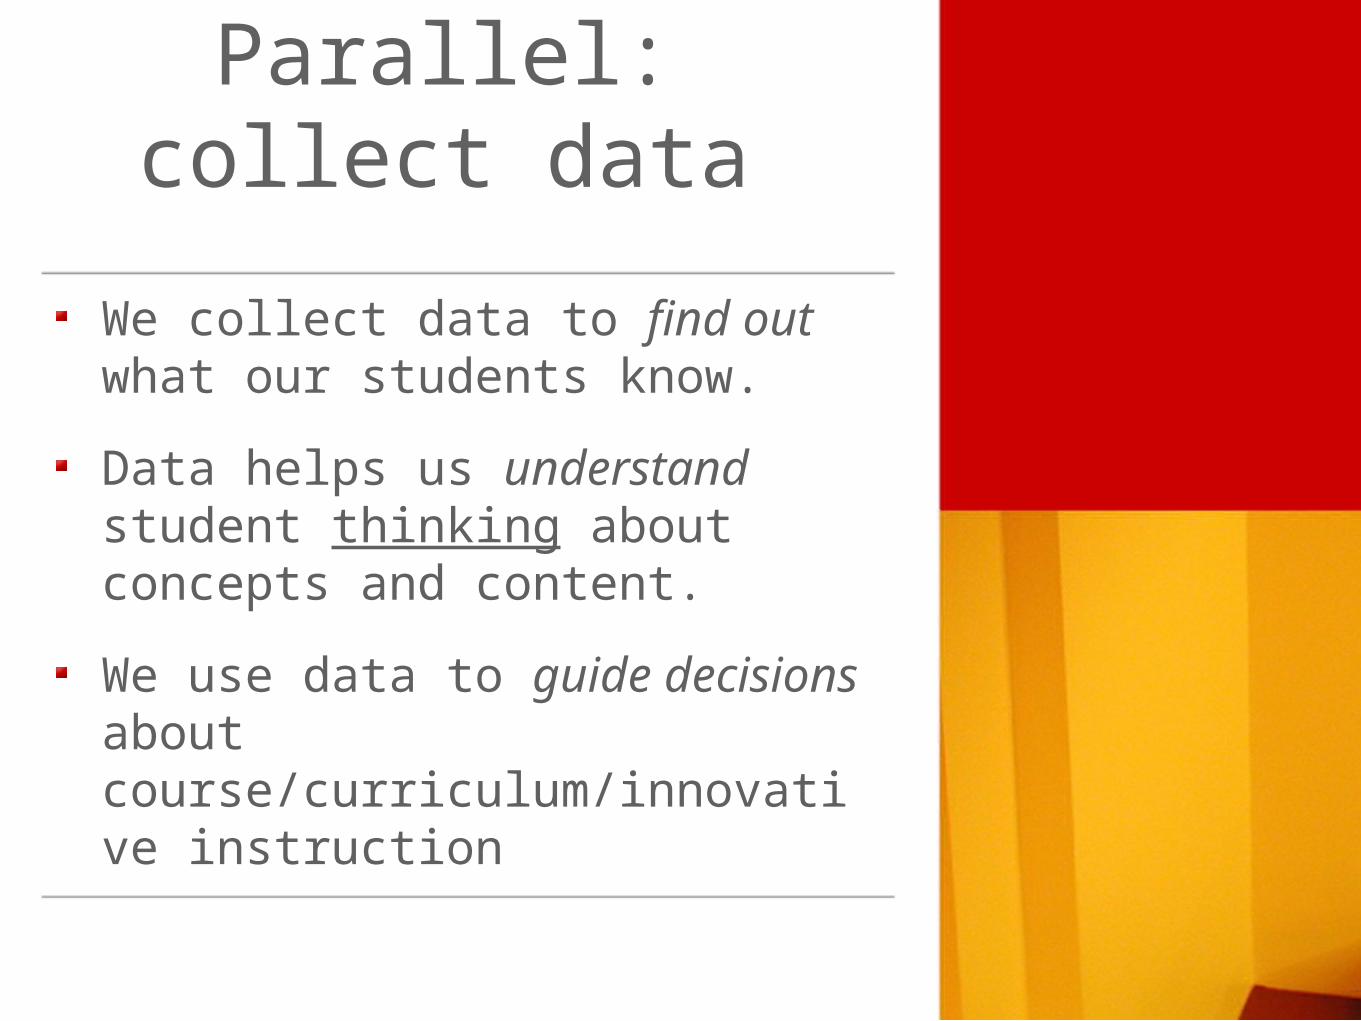
We collect data to find out what our students know.
Data helps us understand student thinking about concepts and content.
We use data to guide decisions about course/curriculum/innovative instruction
Parallel: collect data

Quantitative data - statistical analysis
Qualitative data
break into manageable units and define coding categories
search for patterns, quantify
interpret and synthesize
Valid and repeatable measures
Parallel: analyze data

Ideas and results are peer reviewed - formally and/or informally.
Parallel: peer review

Examples to View
Assessment of Workshop
Minute Paper
Q1 What was helpful to you? Why?
Q2 What would have been helpful to you ? Why?
Q3 What should we focus on in future workshops?
IRD Team at MSU
Janet Batzli - Plant Biology [U of Wisconsin]Doug Luckie - PhysiologyScott Harrison - Microbiology (grad student)Tammy Long - Plant BiologyDeb Linton - Plant Biology (postdoc)Rett Weber - Plant BiologyHeejun Lim - Chemistry EducationDuncan Sibley - GeologyRob Pennock - PhilosophyCharles Ofria - EngineeringRich Lenski - Microbiolgy*National Science Foundation