passive phosphorus removal systems · pdf filepassive phosphorus removal systems chad penn,...
TRANSCRIPT
Passive Phosphorus
Removal Systems
Chad Penn, Josh Payne, Jeff Vitale:
Oklahoma State University
Josh McGrath: University of Maryland
Delia Haak: Illinois River Watershed
Partnership

P FILTER BACKGROUND AND
BENEFITS

Target: Dissolved P
• Soils built up with “legacy” P will continue to release dissolved P for many years
– Conventional best management practices do little for DP
• Objective: construct P removal structures to trap dissolved P in runoff and tile drainage

Need for P filters
• High soil P concentrations contribute to long-term, slow P leak
• This is referred to as a “legacy” P issue
Me
hlic
h-3
Ph
osp
ho
rus (
mg
kg
-1)
Coale, F.J. and R. Kratochvil 2011: Unpublished data

Justification of cost for construction
Current BMPs only
slightly
effective for DP
losses
DP: 100%
biologically
available
DP: sustained
transport
for several
years
$$
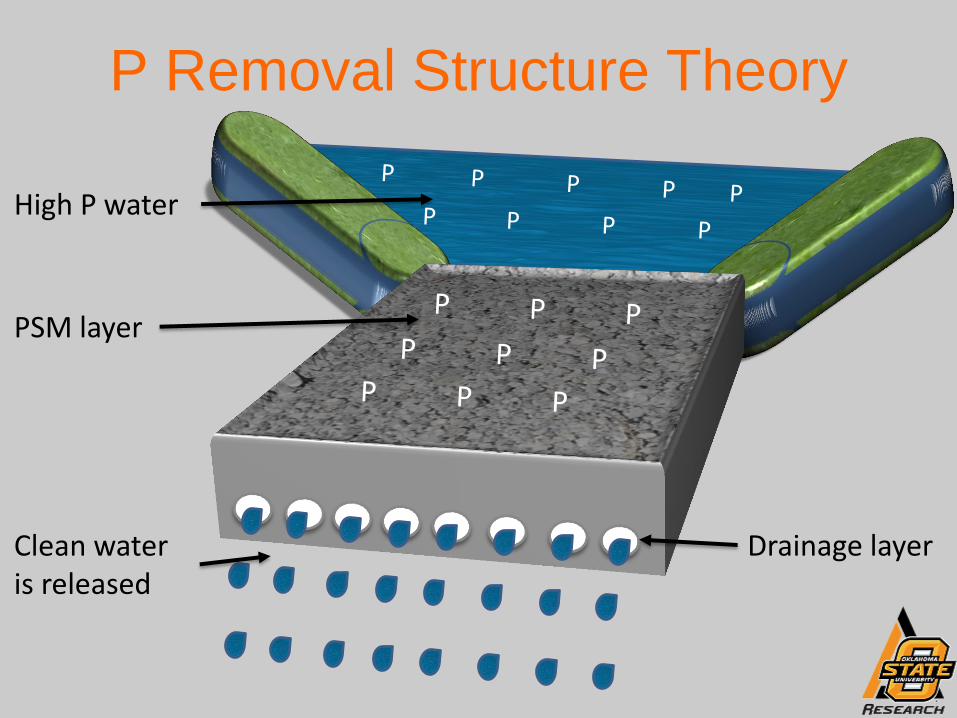
P Removal Structure Theory
High P water
PSM layer
Drainage layer Clean water is released

3 Necessary Components
• Effective PSM in
sufficient quantity
• P-rich water must
flow through PSM
• Ability to retain
and replace PSM

Example by-product PSM’s
Acid mine
drainage
treatment
residuals
Bauxite
mining and
production
waste (red
mud)
Steel slag
waste
Drinking
water
treatment
residuals
Fly ash
Waste
recycled
gypsum
Foundry Sand

Selection Process for PSMs
Material Availability
Cost & Transportation
Potential contaminants
Sodium
Soluble salts
Total, acid soluble,
and water soluble heavy metals Sorption characteristics
Physical Properties
Particle size distribution
and bulk density
Hydraulic conductivity

Cartridge Filter?
Portable, easy to
install
Does not work!
Limited amount
of PSM

Confined Bed
• Good for large filter
• Ideal for drainage swales that require high peak flow and non restricted drainage
– Achieved through shallow PSM with large surface area
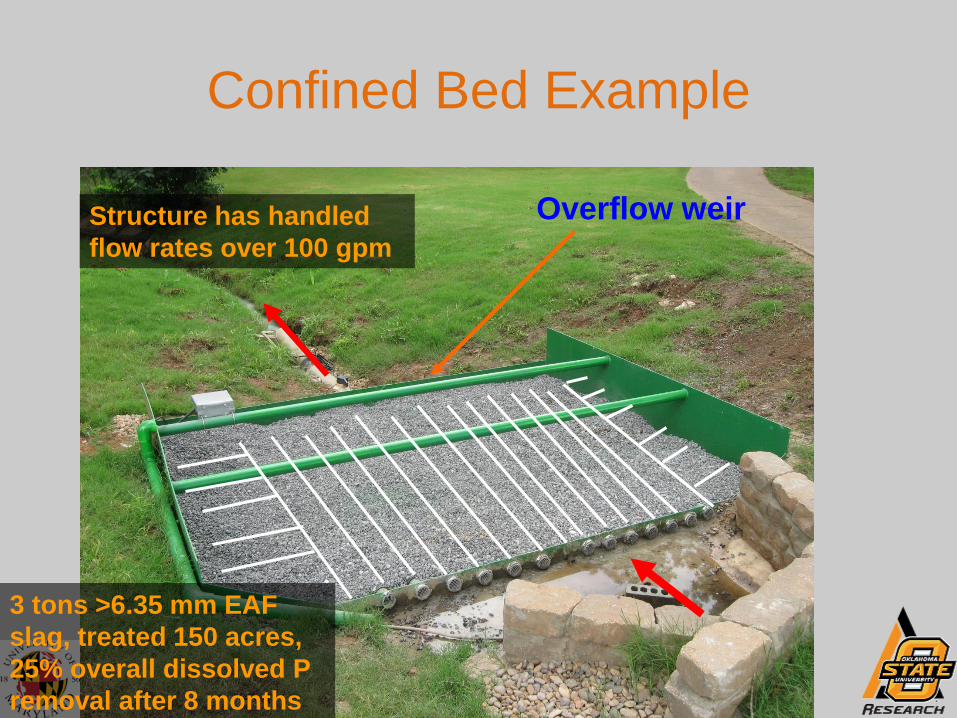
Confined Bed Example
Overflow weir
3 tons >6.35 mm EAF
slag, treated 150 acres,
25% overall dissolved P
removal after 8 months
Structure has handled
flow rates over 100 gpm

Confined Bed Example
Overflow weir • Structure re-loaded
with >0.5 mm slag
• 33% overall removal
after 18 months
• Still handles high
flow rate

Tile Drain • Similar to bed, but
without confinement
• Allows large amount of material to be used
• Use flow control to build head
• Low cost
• Probably best option for ditches

Box Filter • Easily switch out
material
• Modular design – integrates with flow control
– Agri-Drain
• Small ditches or pond overflow
• Drawback: Small amount of material

Storm Drain Filter

Performance and Lifetime
• It depends:
– Site conditions
– PSM
– Design
0.5
0
5
10
15
20
25
30
0.5 1 510
15
Retention time (min)
P r
em
ov
ed
(g
kg
-1)
P concentration (mg L-1)
10

DESIGN GUIDANCE
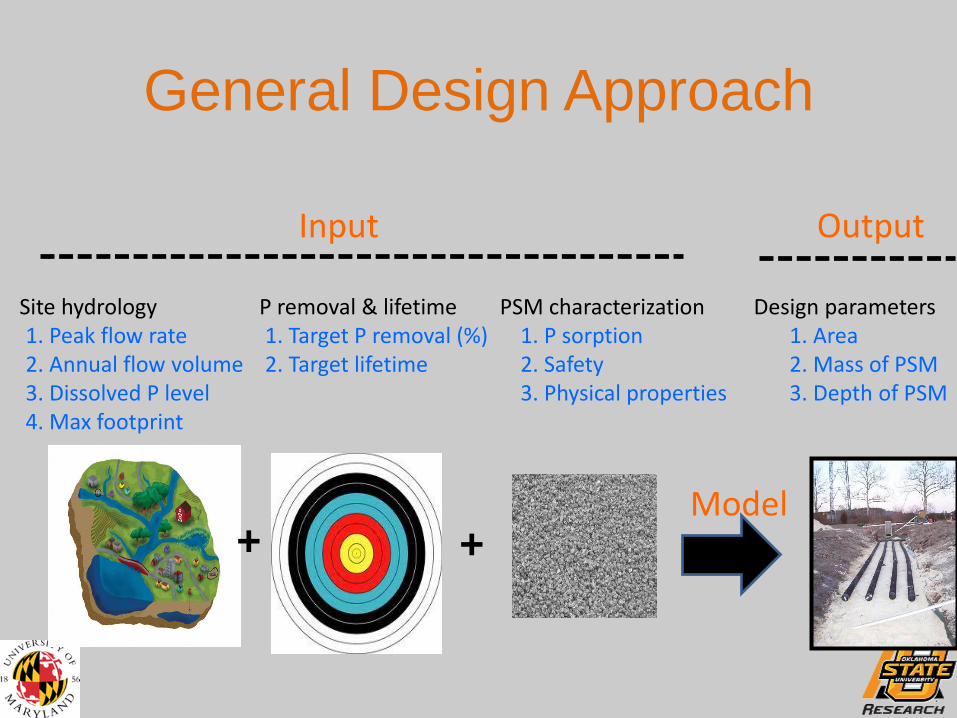
General Design Approach
Site hydrology 1. Peak flow rate 2. Annual flow volume 3. Dissolved P level 4. Max footprint
P removal & lifetime 1. Target P removal (%) 2. Target lifetime
+ Model
+
PSM characterization 1. P sorption 2. Safety 3. Physical properties
Design parameters 1. Area 2. Mass of PSM 3. Depth of PSM
Input Output

Model Verification
• Ability to predict design curve is key
– Accuracy of inputs
• Golf course structure
• UMD structures on Eastern Shore
• Pilot scale structure
• Laboratory flow-through experiments
conducted on new materials

Pilot Scale Filter

Example Pond Filter Data
0
10
20
30
40
50
60
70
0 50 100 150 200
Cum
ula
tive
P r
emoved
(m
g k
g-1
)
P added (mg kg-1)
Measured
Predicted

Example Golf Course Structure
P added (mg kg-1)
P r
em
ov
ed
(m
g k
g-1
)

EXAMPLE DESIGN

Design: Poultry farm in OK
Green Creek
flow direction
poultry houses
proposed structure location

Design: Poultry farm in OK

Site Conditions
• Drainage area: 9 acres
– Slope: 6%
• Curve #: 78
– Peak flow rate, 2yr-24hr storm: 16 cfs
– Annual flow volume: 9 acre-ft
• Typical dissolved P: 1 to 2 mg L-1
– Annual dissolved P load: 49 lbs (22 kg)
• Assumed 2 mg P L-1
• Goal: remove 45% of annual P load
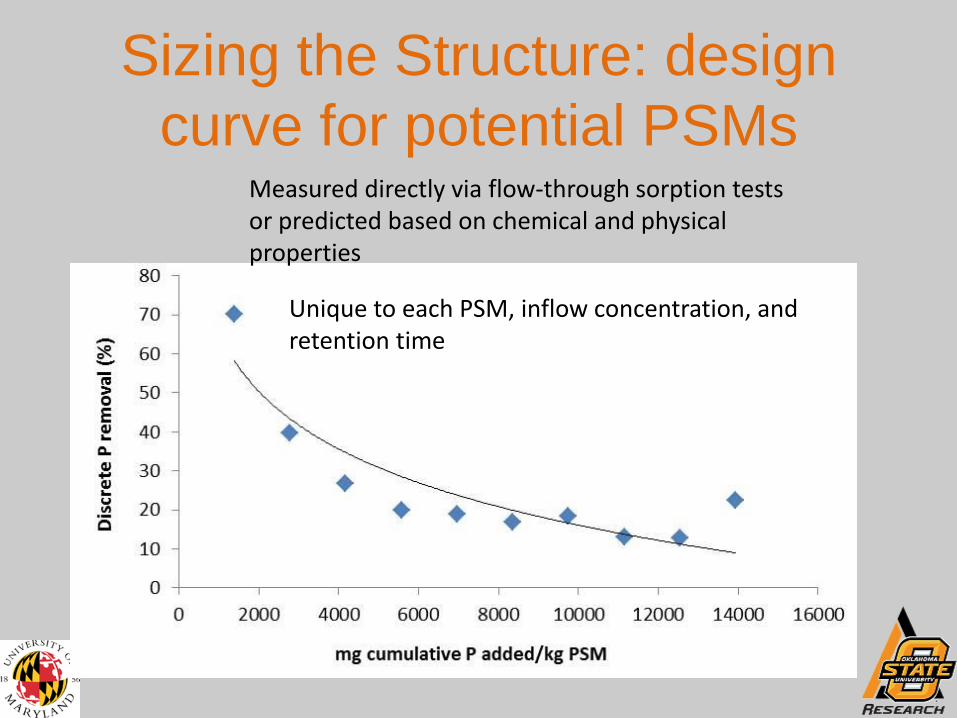
Sizing the Structure: design
curve for potential PSMs Measured directly via flow-through sorption tests or predicted based on chemical and physical properties
Unique to each PSM, inflow concentration, and retention time

Structure design: impact of PSM
characteristics
• Need to handle peak flow rate • Need to handle P load

Structure design: impact of PSM
characteristics
• Need to handle peak flow rate • Need to handle P load

PSM Mass (Mg)
Cumulative
year 1
removal (%)
Lifetime
(yrs)
Hydraulic
conductivity
(cm s-1)
Area
(m2)
PSM depth
(cm)
WTR* 7 37 21 0.01 286 2.3
AMDR† 4 50 7 0.009 225 2.2
Fly ash‡ 3 (plus
95% sand) 50 3.6
0.03 (mixed
with 95% sand) 406 13
>6.35 cm slag§ 171 21 1.4 1.0 190 50
Treated > 6.35
cm slag** 36 45 3.5 1.0 40 50
Potential design options to meet
given P removal and 16 cfs flow
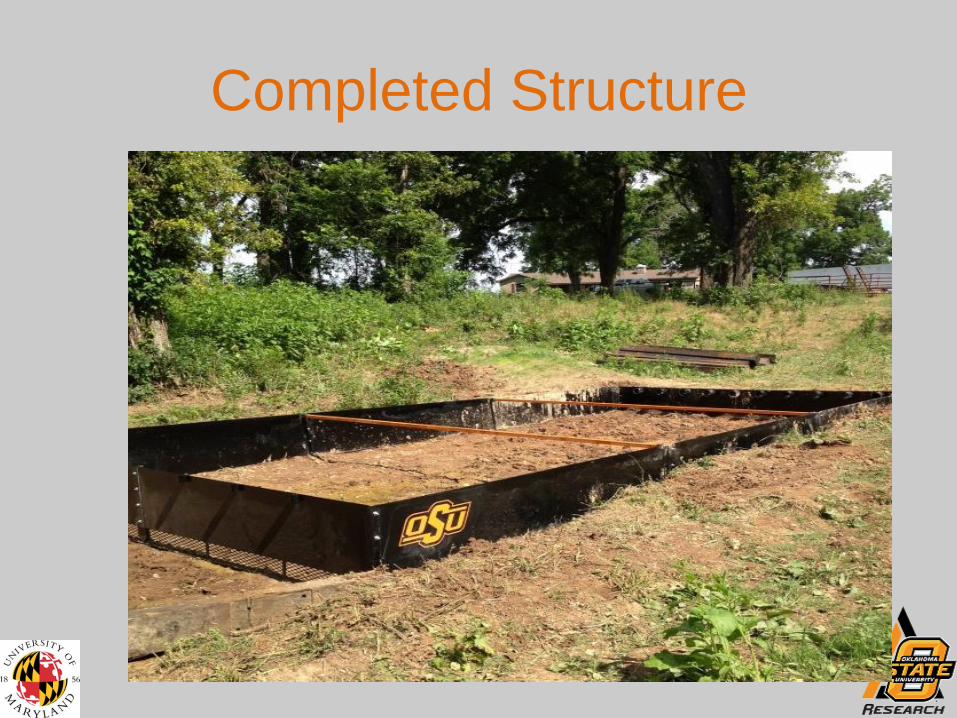
Completed Structure
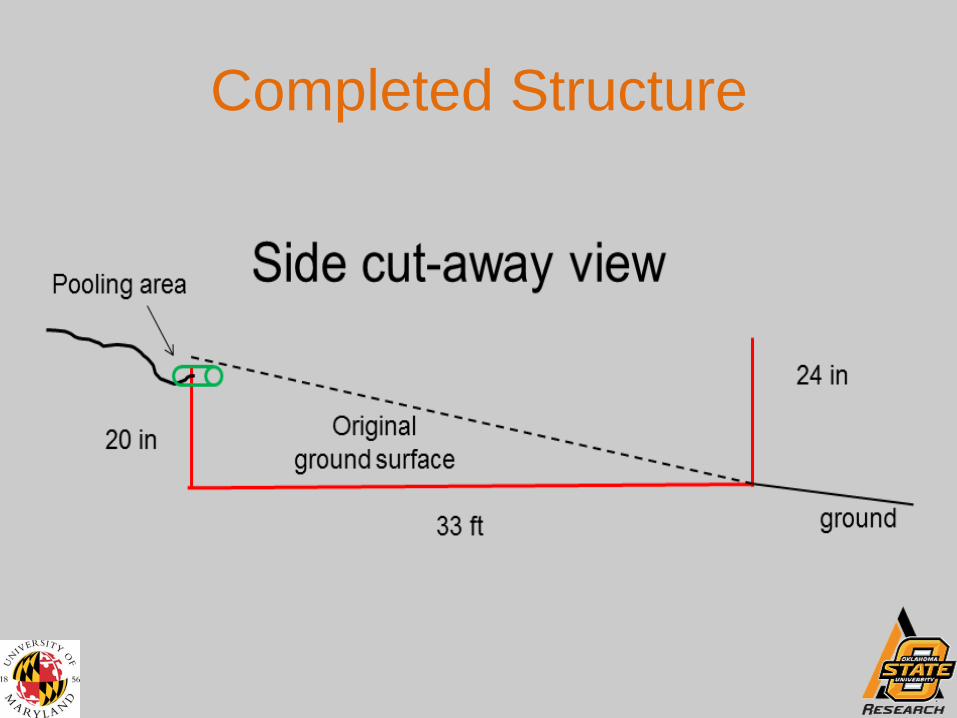
Completed Structure

Completed Structure


• 40 acre tiled drained field to bio-reactor
– Peak flow rate: 80 gpm
– Typical P concentration: 0.2 to 0.5 mg L-1
– Annual P load: 0.5 kg (from 1 mil L yr-1)
– Hydraulic head: 17.89 cm (over 90 ft length)
• Target removal: 3 year lifespan, 25 or 50%
• Maximum area: 400 sq ft
• Material: Sieved Slag
Design: Tile drained field in IN
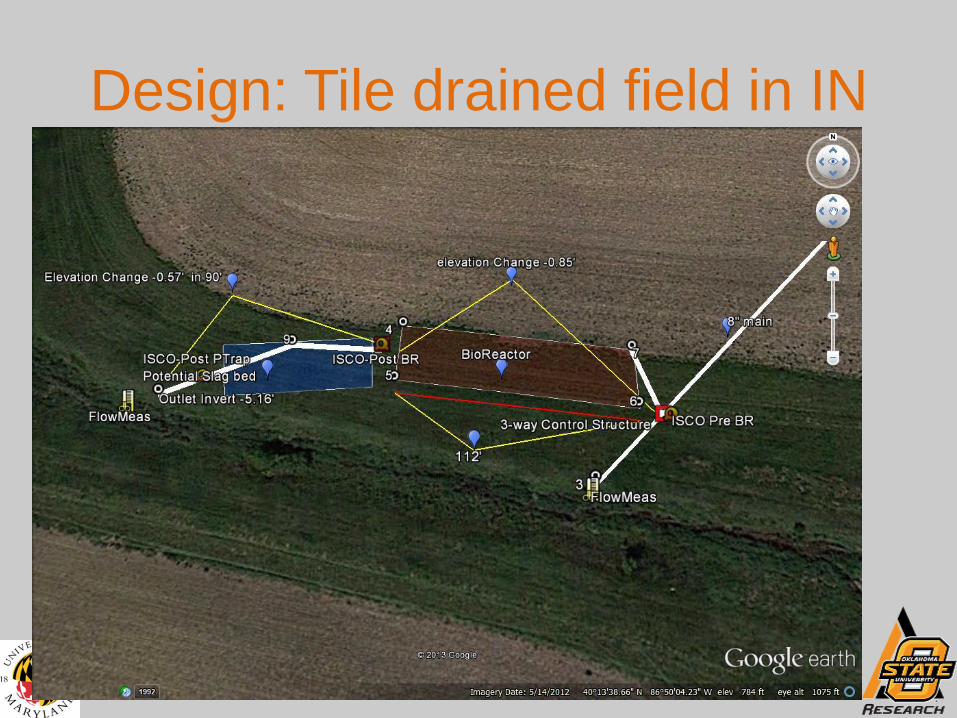
Design: Tile drained field in IN

Design: Tile drained field in IN

Design: Tile drained field in IN

Design Options: sieved slag
Target lifetime @
25% removal (yr)
Mass (tons)
Depth (in)
Head (in)
Peak flow
(gpm)
Total lifetime
(yr)
Cumulative removal
(%)
Area (sq ft)
1 5.5 6.8 6.8 206 9 10 239
3 16.5 Not enough area
27 10 718
54 10 1436 6 33

Design Options: coated slag
Target lifetime @
50% removal (yr)
Mass (tons)
Depth (in)
Head (in)
Peak flow
(gpm)
Total lifetime
(yr)
Cumulative removal
(%)
Area (sq ft)
1 4.7 6.8 6.8 2181 18 12 148
6 9.5 6.8 6.8 4363 36 12 296
10 15.7 Not enough area 60 12 494

Additional Support
• Design software currently being created
– Provide interactive design guidance based on
user inputs
– Will be made available to NRCS
• NRCS Standard will be completed after
software is completed
• Commercialization may be key to
dissemination


Comparison to other BMPs
• In the short term there is no BMP that can
appreciably reduce soluble P losses where
flow cannot be reduced
– P “mining” with hay crops
or corn to reduce soil P
levels
• Sharpley et al. (2009): only
4.6 mg/kg decrease per year
in Mehlich-3 P with
continuous corn
• Not very fast

Comparison to other BMPs • Treatment wetlands
– Require excessive
retention time (days),
thus requires many
acres of space if high
flow rates are to be
treated
• inefficient
– P is not really removed
from the system

ECONOMICS

Economics Example: Westville
• Metal & custom fabrication: $2677
– ¼” carbon steel
• Slag transportation, sieving, coating: $853
• Earth work for pad & berms: $846
• Paint, seed, & erosion mat: $613
• TOTAL: ~ $5000
• Includes profit from private companies
except for metal painting and installation
• Annual renewal estimated at $1213

Economics Example: Westville
Year $ P removal
(lbs.)
Cumulative P removal cost
($/lb P)
1 4989 22 226.77
2 1213 22 140.95
3 1213 22 112.35
4 1213 22 98.05
5 1213 22 89.46
6 1213 22 83.74
7 1213 22 79.66

Economics
• Economics will vary greatly between
locations
• Westville structure could have been
constructed for less money by using other
materials
• Consider that it costs a waste water
treatment plant 50-200 dollars/lb P
removed
– Easier to remove P at a high P concentration,
point source

www.p-structure.blogspot.com