passive design report (ch2 design report) · 1 introduction 1 2 approach 1 ... passive design...
TRANSCRIPT

design advice
passive systems
design analysis
low energy services
March 03
AESY820000\0\2\SFT30301\Draft.0
Melbourne City Council
Passive Design Report
Prepared for:
Melbourne City Council
Prepared by: Advanced Environmental Concepts Pty Ltd CAN 075 117 243 Level 1, 41 McLaren Street North Sydney NSW 2060

Passive Design Report Executive Summary
AESY820000\0\2\SFT30301\Draft.0 © Advanced Environmental Concepts 10/03/2003 i
EXECUTIVE SUMMARY
This report has been prepared by Advanced Environmental Concepts to examine several options affecting the thermal performance of the proposed Melbourne City Council building. The report is divided into three sections. Each section focuses on one aspect which will thermally affect the building and explores several options. Using computer simulations we find the optimum solution for each aspect. The first aspect considered is building ventilation. Air conditioning and natural ventilation options were modelled during different weather conditions to predict the effectiveness of natural ventilation during summer, mid-season and winter, especially when cooling the building at night using natural ventilation. The second aspect considered is optimising night purging. Different free/open window areas as a percentage of floor areas were modelled to show their effectiveness in affecting space cooling throughout the year. The third and last aspect is external wall analysis. Three different materials were modelled in the building’s external wall during summer, mid-season and winter and their thermal performance analysed ie the effect they have on the temperature inside the building. The aim of the report is to recommend options which provide and maintain good levels of thermal comfort year round.

Passive Design Report Table of Contents
AESY820000\0\2\SFT30301\Draft.0 © Advanced Environmental Concepts 10/03/2003 ii
TABLE OF CONTENTS
EXECUTIVE SUMMARY I
TABLE OF CONTENTS II
LIST OF FIGURES III
1 INTRODUCTION 1
2 APPROACH 1
3 VENTILATION STRATEGY 3
3.1.1 Summer conditions 3 3.1.2 Mid-season conditions 3 3.1.3 Winter conditions 4
4 OPTIMISING NIGHT PURGING 7
5 THERMAL MASS OF EXTERNAL WALLS 8
6 CONCLUSIONS AND RECOMMENDATIONS 10
APPENDIX A – VENTILATION STRATEGY RESULTS
APPENDIX B – EXTERNAL WALL THERMAL MASS RESULTS
Date 10 March 2003
Revision and Status
Author Su-fern Tan
Project Team Leader Mark Cummins

Passive Design Report List of Figures
AESY820000\0\2\SFT30301\Draft.0 © Advanced Environmental Concepts 10/03/2003 iii
LIST OF FIGURES
Figure 1Cooling loads on a typical summer’s day for ventilation options........................................ 3 Figure 2 Cooling loads on a typical mid-season day for ventilation options ................................... 4 Figure 3 Cooling loads on a typical winter’s day for ventilation options.......................................... 4 Figure 4 Load breakdown for naturally ventilated option ................................................................. 5 Figure 5 Load breakdown for air conditioned + night purging option ............................................. 5 Figure 6 Load breakdown for air conditioned + no night purging option....................................... 5 Figure 7 Load comparison for ventilation options............................................................................... 6 Figure 8 Free window area effects on space cooling........................................................................ 7 Figure 9 Cooling loads for wall element options ................................................................................. 8 Figure 10 Effect on cooling loads for external wall options................................................................ 9

Passive Design Report Approach
AESY820000\0\2\SFT30301\Draft.0 © Advanced Environmental Concepts 10/03/2003 1
1 INTRODUCTION
This study examines 3 aspects of the proposed Melbourne City Council Building which will affect its thermal performance.
1. Natural ventilation strategy options modelled: • naturally ventilated with no air conditioning • air conditioned with night purging • air conditioned building with no night purging
2. 2. Night purge optimisation options modelled(expressed as a percentage of
total floor area): • 0% • 1% • 2% • 3% • 4% • 5%
3. External wall thermal mass options modelled to test the effectiveness of using
thermal mass at the external walls for this building are: • concrete • autoclaved aerated concrete • plasterboard
Using Thermal Analysis Software, results were produced for each option showing their effects on temperatures and loads, radiant temperatures, air flows, resultant temperatures and air temperatures.
2 APPROACH
The graphical results for each option are attached in the Appendices. They show temperatures and loads, radiant temperatures, air flows (where relevant), frequency of resultant temperatures, and frequency of air temperatures.
2.1 Temperatures and Loads
The temperatures and loads data gives hourly air temperature and sensible load data in a specific zone on a given day. We have chosen days which represent in Melbourne:
• a typical hot summer’s day • a typical mid-season (spring/autumn) day • a typical cold winter’s day
Air temperatures are calculated by balancing heat gains and losses influenced by infiltration, ventilation, air movement, occupants, equipment, lighting, solar gains and, plant and surface convection. The sensible load graph represents the amount of energy required of the air conditioning plant to offset the air temperature and maintain the space within the required limits of 20-25°C.
2.2 Radiant Temperatures
The radiant temperature is an hourly estimate of an occupant’s perception of the radiant temperature of the zone on a specific day. It is what an occupant feels from

Passive Design Report Approach
AESY820000\0\2\SFT30301\Draft.0 © Advanced Environmental Concepts 10/03/2003 2
the temperatures and emissivities of her/his surrounding surfaces. It is calculated as an average of the zone’s surface temperatures modified by the effects of radiant gains from plant, incidental and solar gain. Radiant temperatures were also compared under the same three typical weather conditions.
2.3 Resultant Temperatures
The resultant temperature is a combination of the air temperature and radiant temperatures in a space. Resultant temperature explains why standing next to a sunny window inside feels hotter than standing in an enclosed office in the same building. The air temperature of both areas is the same, but due to a higher radiant temperature, the resultant temperature is higher at the façade. Each option will show its hourly resultant temperature on a given day that represents its typical weather condition.
2.4 Air Flows
The air flow diagrams show how much air is flowing in and out of one area into another. In our results we show firstly, the air flow from outside into a typical perimeter zone, zone 8. This is how we can see how much fresh air is entering the building. Then we show the air flows between the perimeter zone and the centre zone, zone10, to see how much fresh air is passing into the office spaces.
2.5 Frequency of Resultant Temperatures
The frequency resultant temperature graphs show the distribution of resultant temperatures measured in hours throughout the year in that particular zone. In our results we look at both zone 8, the perimeter zone, and zone 10, the centre zone.
2.6 Frequency of Air Temperatures
The frequency air temperature graphs show the distribution of air temperatures measured in hours throughout the year in that particular zone. Similarly, we look at both the frequency of air temperatures in both perimeter and centre zones.
2.7 Load Breakdowns
The load breakdown graphs show the different loads which are placed upon the building for the year. The loads include heating, cooling, humidify, dehumidify, internal, and solar loads.

Passive Design Report Ventilation Strategy
AESY820000\0\2\SFT30301\Draft.0 © Advanced Environmental Concepts 10/03/2003 3
3 VENTILATION STRATEGY
Ventilation is required to provide occupants with metabolic oxygen requirements, remove or dilute air pollutants, and provide cooling. For most buildings, 40% of energy consumption is used for air conditioning. Depending on climate and location, it is possible to reduce a building’s energy consumption by utilising natural ventilation. Natural ventilation can affect both energy consumption and ventilation effectiveness, hence indoor air quality and comfort. The results in this section show the cooling and heating loads experienced by the proposed Melbourne City Council building in summer, mid-season and winter when we use natural ventilation and/or air conditioning. We used computer modelling and test reference Melbourne weather files were to produce results.
3.1 Results
3.1.1 Summer conditions
During a typically hot summer’s day, when the building is fully naturally ventilated the resultant temperature of the office during working hours are at approximately 25°C in the morning and increases hourly until its peak of 33°C at 6pm. We can also see that the maximum temperature experienced in summer is 37°C (see Appendix A, section 1.1). This indicates that during summer, a fully naturally ventilated building is unsuitable and air conditioning is necessary. During night time, when the cooling load has been reduced drastically by the absence of the sun, occupants, equipment and lighting, we can look to natural ventilation to help us cool the building. This will reduce the load on the air conditioning plant, increase energy and cost savings, and reduce greenhouse gas emissions. The use of night purging would reduce daily cooling load requirements by approximately 14% on a summer’s day. The table below summarises the daily cooling load requirements for the three different ventilation options. It is highly recommended that during summer, air conditioning be used during working hours to maintain comfort levels; and night purging be utilised to reduce the cooling plant load and reduce energy consumption.
per day
loads
Fully naturally ventilated
Air cond with night purging
Air cond with no night purging
Load/area (kWh/m2)
0 0.35 (cooling) 0.40 (cooling)
Load for 1 level (kWh)
0
224 (cooling) 259 (cooling)
Load for total building (kWh)
0 2019 (cooling) 2332 (cooling)
Figure 1Cooling loads on a typical summer’s day for ventilation options
3.1.2 Mid-season conditions
During mid-season autumn and spring, results show that if the building was fully naturally ventilated, the resultant temperatures would remain between 21 – 23.5°C in

Passive Design Report Ventilation Strategy
AESY820000\0\2\SFT30301\Draft.0 © Advanced Environmental Concepts 10/03/2003 4
the office spaces on a typical day. This satisfies the design temperature limits of 20 - 25°C for comfort. However, when we look at naturally ventilating the building during working hours, we have to consider factors such as air and noise pollution. Although energy reductions are a priority, indoor air quality must also be considered. For the air conditioned buildings, the use of night purging would decrease cooling loads by 21%. During mid-season, during working hours, the building will maintain thermal comfort levels without air conditioning however air and noise pollution must be considered whilst using natural ventilation.
per day
loads
Fully naturally ventilated
Air cond with night purging
Air cond with no night purging
Load/area (kWh/m2)
0 0.27 (cooling) 0.34 (cooling)
Load for 1 level (kWh)
0
176 (cooling) 223 (cooling)
Load for total building (kWh)
0 1583.4 (cooling) 2005.4 (cooling)
Figure 2 Cooling loads on a typical mid-season day for ventilation options
3.1.3 Winter conditions
In the naturally ventilated building, we find that the temperature consistently stays around 20 - 21°C in the office areas on a typical winter’s day. Although the building does not have any cooling loads, the lower levels on the north side become too cold in the early morning before 9am, and minimal heating in the coldest perimeter zones will be required. (See Appendix A, section 2.4) In the air conditioned buildings during winter, no heating will be necessary to maintain thermal comfort. The building will still need cooling to cope with occupant, equipment, lighting, solar, etc gains. The use of night purging would decrease the building’s energy consumption (cooling load) by 36%. Similar to mid-season conditions, there will be no need for air conditioning to maintain thermal comfort within the design requirements of 20 – 25°C. However consideration must be given to the affects of utilising natural ventilation on noise pollution and indoor air quality.
per day
loads
Fully naturally ventilated
Air cond with night purging
Air cond with no night purging
Load/area (kWh/m2)
0.004 (heating) 0.11 (cooling) 0.18 (cooling)
Load for 1 level (kWh)
2.41 (heating)
76 (cooling) 118 (cooling)
Load for total building (kWh)
22 (heating 682 (cooling) 1058 (cooling)
Figure 3 Cooling loads on a typical winter’s day for ventilation options
Passive Design Report Ventilation Strategy
AESY820000\0\2\SFT30301\Draft.0 © Advanced Environmental Concepts 10/03/2003 5
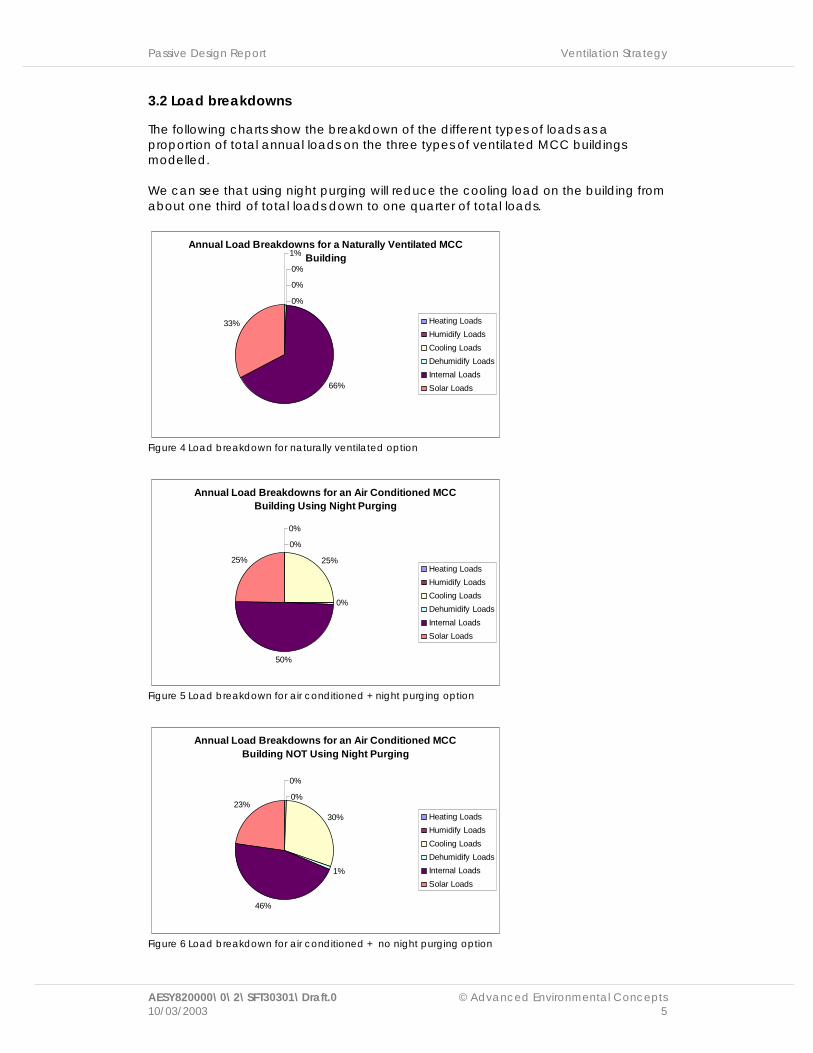
3.2 Load breakdowns
The following charts show the breakdown of the different types of loads as a proportion of total annual loads on the three types of ventilated MCC buildings modelled. We can see that using night purging will reduce the cooling load on the building from about one third of total loads down to one quarter of total loads.
Annual Load Breakdowns for a Naturally Ventilated MCC Building1%
0%
0%
0%
66%
33% Heating Loads
Humidify Loads
Cooling Loads
Dehumidify Loads
Internal Loads
Solar Loads
Figure 4 Load breakdown for naturally ventilated option
Annual Load Breakdowns for an Air Conditioned MCC Building Using Night Purging
0%
0%
25%
0%
50%
25%Heating Loads
Humidify Loads
Cooling Loads
Dehumidify Loads
Internal Loads
Solar Loads
Figure 5 Load breakdown for air conditioned + night purging option
Annual Load Breakdowns for an Air Conditioned MCC Building NOT Using Night Purging
0%
0%
30%
1%
46%
23%
Heating Loads
Humidify Loads
Cooling Loads
Dehumidify Loads
Internal Loads
Solar Loads
Figure 6 Load breakdown for air conditioned + no night purging option

Passive Design Report Ventilation Strategy
AESY820000\0\2\SFT30301\Draft.0 © Advanced Environmental Concepts 10/03/2003 6
If we compare all the options and their load breakdowns in one graph, we can see that natural ventilation contributes to a significant reduction in cooling loads.
Load Comparison for Ventilation Options
0
200000
400000
600000
800000
1000000
1200000
1400000
1600000
1800000
NaturallyVentilated
A/c with nightpurging
A/c with no nightpurging
(kW
h)
Solar Loads
Internal Loads
Dehumidify Loads
Cooling Loads
Humidify Loads
Heating Loads
Figure 7 Load comparison for ventilation options

Passive Design Report Optimising Night Purging
AESY820000\0\2\SFT30301\Draft.0 © Advanced Environmental Concepts 10/03/2003 7
4 OPTIMISING NIGHT PURGING
At night, it is normal that the air conditioning will turn off and the building will be cooled using natural ventilation. We call this process night purging. Night purging will depend on the amount of much free window area available. Free window area is the area of a window which allows air to flow through. This free area is dependent on the openable proportion of the window. We measure free areas as a percentage of floor area of the space we want to cool. For the proposed Melbourne City Council building we modelled six options of free window areas, from 0% to 5%, and the effect they have on cooling the office space.
4.1 Results
The graph below shows how free window areas affect space cooling in the Melbourne City Council building. We can see that after having 1% of free window area, the effect on space cooling loads is minimal.
% Free Area vs Space Cooling
0
50000
100000
150000
200000
250000
300000
350000
400000
450000
500000
0% 1% 2% 3% 4% 5% 6%
Percentage of Free Window Area
Ann
ual S
pa
ce C
oolin
g L
oad
s (k
Wh)
Figure 8 Free window area effects on space cooling
Thus for night purging to be carried out successfully, we only have to achieve a free window area which is a minimum of 1% of the office floor area.

Passive Design Report Thermal Mass of External Walls
AESY820000\0\2\SFT30301\Draft.0 © Advanced Environmental Concepts 10/03/2003 - 8
5 THERMAL MASS OF EXTERNAL WALLS
Thermal mass plays a role in the energy efficiency of a building. Materials with high thermal mass like concrete, store and release energy needed for heating and cooling more so than materials with low thermal mass like plasterboard. A building with good thermal mass is protected from big temperature swings and therefore will provide a higher level of thermal comfort year round.
5.1 Results
External walls with a variation in one building material were modelled on the MCC building. The aim is to show if the inclusion of thermal mass to the external walls by looking at their effects on air temperatures, radiant temperatures, resultant temperatures, and cooling loads. The three materials modelled in the external walls are:
• 90mm concrete • 90mm autoclaved aerated concrete (for example, Hebel) • 12mm plasterboard.
Below is a table summarising the loads on the building reflecting the effects the different external walls have on cooling loads. We can see that only in winter do the external wall types slightly affect thermal mass (see Appendix B section 3.1). Following this, on the next page is a graphical representation of this.
Cooling loads per level in kWh
concrete wall
autoclaved aerated concrete wall
plasterboard wall
summer
224 225 227
mid-season
176 176 178
winter
75 80 86
Figure 9 Cooling loads for wall element options

Passive Design Report Thermal Mass of External Walls
AESY820000\0\2\SFT30301\Draft.0 © Advanced Environmental Concepts 10/03/2003 - 9
External Wall Cooling Loads
0
100
200
300
400
500
600
concrete wall autoclaved aeratedconcrete wall
plasterboard wall
(kW
h) winter
mid-season
summer
Figure 10 Effect on cooling loads for external wall options
The results show that none of these materials had any significant effect on the heating and cooling loads for the proposed Melbourne City Council building so the selection of building materials for the external walls should be dependent on other factors other than thermal mass. Thermal mass is most effective where it can offer maximum exposure to all building occupants. Thus utilising thermal mass in ceilings is much more effective than utilising thermal mass in external walls.

Passive Design Report Conclusions and Recommendations
AESY820000\0\2\SFT30301\Draft.0 © Advanced Environmental Concepts 10/03/2003 - 10
6 CONCLUSIONS AND RECOMMENDATIONS
This report has collated the results from a number of computer simulations to find an optimum solution for building ventilation, night ventilation effectiveness and external wall thermal mass for the proposed Melbourne City Council building. A number of options were modelled and their thermal effects analysed for all weather conditions throughout the year using test reference data from Melbourne. With regard to building ventilation, we recommend that air conditioning be used during summer to maintain thermal comfort. During typical mid-season and winter days, air conditioning will not be necessary to maintain thermal comfort levels but noise and indoor air quality need to be considered. If air conditioning is to be used, we strongly recommend night purging to reduce energy consumption and cooling plant loads for all periods throughout the year. Night purging effects will be effective if 1% of the floor area is window area provided as openable/free. Results have shown that any increase in the free window area only marginally increases the effectiveness of space cooling. Results show that there is not any significant change in the thermal mass benefits of the building when we consider external wall materials. Very small thermal mass benefits may be felt only during winter. We conclude that the choice of building material selection for the external walls could be dependent on other factors other than thermal mass.

Passive Design Report Appendix A
AESY820000\0\2\SFT30301\Draft.0 © Advanced Environmental Concepts 10/03/2003 - 11
APPENDIX A – VENTILATION STRATEGY RESULTS

Passive Design Report Appendix A
AESY820000\0\2\SFT30301\Draft.0 © Advanced Environmental Concepts 10/03/2003 - 12
*zone 8 = mid level perimeter zone * zone 10 = mid level office zone
1 SUMMER – DAY 15
1.1 Fully Naturally Ventilated Option

Passive Design Report Appendix A
AESY820000\0\2\SFT30301\Draft.0 © Advanced Environmental Concepts 10/03/2003 - 13

Passive Design Report Appendix A
AESY820000\0\2\SFT30301\Draft.0 © Advanced Environmental Concepts 10/03/2003 - 14
1.2 Air Conditioned with Night Purging Option

Passive Design Report Appendix A
AESY820000\0\2\SFT30301\Draft.0 © Advanced Environmental Concepts 10/03/2003 - 15

Passive Design Report Appendix A
AESY820000\0\2\SFT30301\Draft.0 © Advanced Environmental Concepts 10/03/2003 - 16
1.3 Air Conditioned With No Night Purging Option

Passive Design Report Appendix A
AESY820000\0\2\SFT30301\Draft.0 © Advanced Environmental Concepts 10/03/2003 - 17

Passive Design Report Appendix A
AESY820000\0\2\SFT30301\Draft.0 © Advanced Environmental Concepts 10/03/2003 - 18
2 MID-SEASON – DAY 80
2.1 Fully Naturally Ventilated Option

Passive Design Report Appendix A
AESY820000\0\2\SFT30301\Draft.0 © Advanced Environmental Concepts 10/03/2003 - 19

Passive Design Report Appendix A
AESY820000\0\2\SFT30301\Draft.0 © Advanced Environmental Concepts 10/03/2003 - 20
2.2 Air Conditioned with Night Purging Option

Passive Design Report Appendix A
AESY820000\0\2\SFT30301\Draft.0 © Advanced Environmental Concepts 10/03/2003 - 21

Passive Design Report Appendix A
AESY820000\0\2\SFT30301\Draft.0 © Advanced Environmental Concepts 10/03/2003 - 22
2.3 Air Conditioned With No Night Purging Option

Passive Design Report Appendix A
AESY820000\0\2\SFT30301\Draft.0 © Advanced Environmental Concepts 10/03/2003 - 23

Passive Design Report Appendix A
AESY820000\0\2\SFT30301\Draft.0 © Advanced Environmental Concepts 10/03/2003 - 24
3 WINTER - DAY 180
3.1 Fully Naturally Ventilated Option

Passive Design Report Appendix A
AESY820000\0\2\SFT30301\Draft.0 © Advanced Environmental Concepts 10/03/2003 - 25

Passive Design Report Appendix A
AESY820000\0\2\SFT30301\Draft.0 © Advanced Environmental Concepts 10/03/2003 - 26
3.2 Air Conditioned with Night Purging Option

Passive Design Report Appendix A
AESY820000\0\2\SFT30301\Draft.0 © Advanced Environmental Concepts 10/03/2003 - 27

Passive Design Report Appendix A
AESY820000\0\2\SFT30301\Draft.0 © Advanced Environmental Concepts 10/03/2003 - 28
3.3 Air Conditioned With No Night Purging Option

Passive Design Report Appendix A
AESY820000\0\2\SFT30301\Draft.0 © Advanced Environmental Concepts 10/03/2003 - 29

Passive Design Report Appendix A
AESY820000\0\2\SFT30301\Draft.0 © Advanced Environmental Concepts 10/03/2003 - 30
4 FREQUENCY RESULTANT TEMPERATURES
4.1 Fully Naturally Ventilated Option
Frequency of Resultant Temperatures for Year
Zone 8, Days 1 to 5, Hours 5 to 18
0
100
200
300
400
500
600
-99
to -
4
-4
to -
3
-3
to -
2
-2
to -
1
-1
to
0
0
to
1
1
to
2
2
to
3
3
to
4
4
to
5
5
to
6
6
to
7
7
to
8
8
to
9
9
to 1
0
10
to 1
1
11
to 1
2
12
to 1
3
13
to 1
4
14
to 1
5
15
to 1
6
16
to 1
7
17
to 1
8
18
to 1
9
19
to 2
0
20
to 2
1
21
to 2
2
22
to 2
3
23
to 2
4
24
to 2
5
25
to 2
6
26
to 2
7
27
to 2
8
28
to 2
9
29
to 3
0
30
to 3
1
31
to 3
2
32
to 3
3
33
to 3
4
34
to 3
5
35
to 3
6
36
to 3
7
37
to 3
8
38
to 3
9
39
to 4
0
40
to 4
1
41
to 4
2
42
to 4
3
43
to 4
4
44
to 9
9
Temperature Range (C)
Nu
mb
er o
f H
ou
rs
Frequency of Resultant Temperatures for YearZone 10, Days 1 to 5, Hours 5 to 18
0
100
200
300
400
500
600
700
-99
to -
4
-4
to -
3
-3
to -
2
-2
to -
1
-1
to
0
0
to
1
1
to
2
2
to
3
3
to
4
4
to
5
5
to
6
6
to
7
7
to
8
8
to
9
9
to 1
0
10
to 1
1
11
to 1
2
12
to 1
3
13
to 1
4
14
to 1
5
15
to 1
6
16
to 1
7
17
to 1
8
18
to 1
9
19
to 2
0
20
to 2
1
21
to 2
2
22
to 2
3
23
to 2
4
24
to 2
5
25
to 2
6
26
to 2
7
27
to 2
8
28
to 2
9
29
to 3
0
30
to 3
1
31
to 3
2
32
to 3
3
33
to 3
4
34
to 3
5
35
to 3
6
36
to 3
7
37
to 3
8
38
to 3
9
39
to 4
0
40
to 4
1
41
to 4
2
42
to 4
3
43
to 4
4
44
to 9
9
Temperature Range (C)
Nu
mb
er o
f H
ou
rs
4.2 Air Conditioned with Night Purging Option
Frequency of Resultant Temperatures for Year
Zone 8, Days 1 to 5, Hours 7 to 18
0
200
400
600
800
1000
1200
-99
to -
4
-4
to -
3
-3
to -
2
-2
to -
1
-1
to
0
0
to
1
1
to
2
2
to
3
3
to
4
4
to
5
5
to
6
6
to
7
7
to
8
8
to
9
9
to 1
0
10
to 1
1
11
to 1
2
12
to 1
3
13
to 1
4
14
to 1
5
15
to 1
6
16
to 1
7
17
to 1
8
18
to 1
9
19
to 2
0
20
to 2
1
21
to 2
2
22
to 2
3
23
to 2
4
24
to 2
5
25
to 2
6
26
to 2
7
27
to 2
8
28
to 2
9
29
to 3
0
30
to 3
1
31
to 3
2
32
to 3
3
33
to 3
4
34
to 3
5
35
to 3
6
36
to 3
7
37
to 3
8
38
to 3
9
39
to 4
0
40
to 4
1
41
to 4
2
42
to 4
3
43
to 4
4
44
to 9
9
Temperature Range (C)
Nu
mb
er o
f H
ou
rs

Passive Design Report Appendix A
AESY820000\0\2\SFT30301\Draft.0 © Advanced Environmental Concepts 10/03/2003 - 31
Frequency of Resultant Temperatures for YearZone 10, Days 1 to 5, Hours 7 to 18
0
200
400
600
800
1000
1200
1400
1600
-99
to -
4
-4
to -
3
-3
to -
2
-2
to -
1
-1
to
0
0
to
1
1
to
2
2
to
3
3
to
4
4
to
5
5
to
6
6
to
7
7
to
8
8
to
9
9
to 1
0
10
to 1
1
11
to 1
2
12
to 1
3
13
to 1
4
14
to 1
5
15
to 1
6
16
to 1
7
17
to 1
8
18
to 1
9
19
to 2
0
20
to 2
1
21
to 2
2
22
to 2
3
23
to 2
4
24
to 2
5
25
to 2
6
26
to 2
7
27
to 2
8
28
to 2
9
29
to 3
0
30
to 3
1
31
to 3
2
32
to 3
3
33
to 3
4
34
to 3
5
35
to 3
6
36
to 3
7
37
to 3
8
38
to 3
9
39
to 4
0
40
to 4
1
41
to 4
2
42
to 4
3
43
to 4
4
44
to 9
9
Temperature Range (C)
Nu
mb
er o
f H
ou
rs
4.3 Air Conditioned With No Night Purging Option
Frequency of Resultant Temperatures for YearZone 8, Days 1 to 5, Hours 5 to 18
0
200
400
600
800
1000
1200
-99
to -
4
-4
to -
3
-3
to -
2
-2
to -
1
-1
to
0
0
to
1
1
to
2
2
to
3
3
to
4
4
to
5
5
to
6
6
to
7
7
to
8
8
to
9
9
to 1
0
10
to 1
1
11
to 1
2
12
to 1
3
13
to 1
4
14
to 1
5
15
to 1
6
16
to 1
7
17
to 1
8
18
to 1
9
19
to 2
0
20
to 2
1
21
to 2
2
22
to 2
3
23
to 2
4
24
to 2
5
25
to 2
6
26
to 2
7
27
to 2
8
28
to 2
9
29
to 3
0
30
to 3
1
31
to 3
2
32
to 3
3
33
to 3
4
34
to 3
5
35
to 3
6
36
to 3
7
37
to 3
8
38
to 3
9
39
to 4
0
40
to 4
1
41
to 4
2
42
to 4
3
43
to 4
4
44
to 9
9
Temperature Range (C)
Nu
mb
er o
f H
ou
rs
Frequency of Resultant Temperatures for YearZone 10, Days 1 to 5, Hours 5 to 18
0
200
400
600
800
1000
1200
1400
1600
1800
-99
to -
4
-4
to -
3
-3
to -
2
-2
to -
1
-1
to
0
0
to
1
1
to
2
2
to
3
3
to
4
4
to
5
5
to
6
6
to
7
7
to
8
8
to
9
9
to 1
0
10
to 1
1
11
to 1
2
12
to 1
3
13
to 1
4
14
to 1
5
15
to 1
6
16
to 1
7
17
to 1
8
18
to 1
9
19
to 2
0
20
to 2
1
21
to 2
2
22
to 2
3
23
to 2
4
24
to 2
5
25
to 2
6
26
to 2
7
27
to 2
8
28
to 2
9
29
to 3
0
30
to 3
1
31
to 3
2
32
to 3
3
33
to 3
4
34
to 3
5
35
to 3
6
36
to 3
7
37
to 3
8
38
to 3
9
39
to 4
0
40
to 4
1
41
to 4
2
42
to 4
3
43
to 4
4
44
to 9
9
Temperature Range (C)
Nu
mb
er o
f H
ou
rs

Passive Design Report Appendix A
AESY820000\0\2\SFT30301\Draft.0 © Advanced Environmental Concepts 10/03/2003 - 32
5 FREQUENCY DISTRIBUTION AIR TEMPERATURES
5.1 Fully Naturally Ventilated Option
Frequency of Air Temperatures for YearZone 8, Days 1 to 5, Hours 5 to 18
0
200
400
600
800
1000
1200
1400
-99
to -
4
-4
to -
3
-3
to -
2
-2
to -
1
-1
to
0
0
to
1
1
to
2
2
to
3
3
to
4
4
to
5
5
to
6
6
to
7
7
to
8
8
to
9
9
to 1
0
10
to 1
1
11
to 1
2
12
to 1
3
13
to 1
4
14
to 1
5
15
to 1
6
16
to 1
7
17
to 1
8
18
to 1
9
19
to 2
0
20
to 2
1
21
to 2
2
22
to 2
3
23
to 2
4
24
to 2
5
25
to 2
6
26
to 2
7
27
to 2
8
28
to 2
9
29
to 3
0
30
to 3
1
31
to 3
2
32
to 3
3
33
to 3
4
34
to 3
5
35
to 3
6
36
to 3
7
37
to 3
8
38
to 3
9
39
to 4
0
40
to 4
1
41
to 4
2
42
to 4
3
43
to 4
4
44
to 9
9
Temperature Range (C)
Nu
mb
er o
f H
ou
rs
Frequency of Air Temperatures for YearZone 10, Days 1 to 5, Hours 5 to 18
0
100
200
300
400
500
600
700
800
900
-99
to -
4
-4
to -
3
-3
to -
2
-2
to -
1
-1
to
0
0
to
1
1
to
2
2
to
3
3
to
4
4
to
5
5
to
6
6
to
7
7
to
8
8
to
9
9
to 1
0
10
to 1
1
11
to 1
2
12
to 1
3
13
to 1
4
14
to 1
5
15
to 1
6
16
to 1
7
17
to 1
8
18
to 1
9
19
to 2
0
20
to 2
1
21
to 2
2
22
to 2
3
23
to 2
4
24
to 2
5
25
to 2
6
26
to 2
7
27
to 2
8
28
to 2
9
29
to 3
0
30
to 3
1
31
to 3
2
32
to 3
3
33
to 3
4
34
to 3
5
35
to 3
6
36
to 3
7
37
to 3
8
38
to 3
9
39
to 4
0
40
to 4
1
41
to 4
2
42
to 4
3
43
to 4
4
44
to 9
9
Temperature Range (C)
Nu
mb
er o
f H
ou
rs
5.2 Air Conditioned with Night Purging Option
Frequency of Air Temperatures for Year
Zone 8, Days 1 to 5, Hours 7 to 18
0
500
1000
1500
2000
2500
3000
-99
to -
4
-4
to -
3
-3
to -
2
-2
to -
1
-1
to
0
0
to
1
1
to
2
2
to
3
3
to
4
4
to
5
5
to
6
6
to
7
7
to
8
8
to
9
9
to 1
0
10
to 1
1
11
to 1
2
12
to 1
3
13
to 1
4
14
to 1
5
15
to 1
6
16
to 1
7
17
to 1
8
18
to 1
9
19
to 2
0
20
to 2
1
21
to 2
2
22
to 2
3
23
to 2
4
24
to 2
5
25
to 2
6
26
to 2
7
27
to 2
8
28
to 2
9
29
to 3
0
30
to 3
1
31
to 3
2
32
to 3
3
33
to 3
4
34
to 3
5
35
to 3
6
36
to 3
7
37
to 3
8
38
to 3
9
39
to 4
0
40
to 4
1
41
to 4
2
42
to 4
3
43
to 4
4
44
to 9
9
Temperature Range (C)
Nu
mb
er o
f H
ou
rs

Passive Design Report Appendix A
AESY820000\0\2\SFT30301\Draft.0 © Advanced Environmental Concepts 10/03/2003 - 33
Frequency of Air Temperatures for YearZone 10, Days 1 to 5, Hours 7 to 18
0
500
1000
1500
2000
2500
3000
-99
to -
4
-4
to -
3
-3
to -
2
-2
to -
1
-1
to
0
0
to
1
1
to
2
2
to
3
3
to
4
4
to
5
5
to
6
6
to
7
7
to
8
8
to
9
9
to 1
0
10
to 1
1
11
to 1
2
12
to 1
3
13
to 1
4
14
to 1
5
15
to 1
6
16
to 1
7
17
to 1
8
18
to 1
9
19
to 2
0
20
to 2
1
21
to 2
2
22
to 2
3
23
to 2
4
24
to 2
5
25
to 2
6
26
to 2
7
27
to 2
8
28
to 2
9
29
to 3
0
30
to 3
1
31
to 3
2
32
to 3
3
33
to 3
4
34
to 3
5
35
to 3
6
36
to 3
7
37
to 3
8
38
to 3
9
39
to 4
0
40
to 4
1
41
to 4
2
42
to 4
3
43
to 4
4
44
to 9
9
Temperature Range (C)
Nu
mb
er o
f H
ou
rs
5.3 Air Conditioned With No Night Purging Option
Frequency of Air Temperatures for Year
Zone 8, Days 1 to 5, Hours 5 to 18
0
500
1000
1500
2000
2500
3000
-99
to -
4
-4
to -
3
-3
to -
2
-2
to -
1
-1
to
0
0
to
1
1
to
2
2
to
3
3
to
4
4
to
5
5
to
6
6
to
7
7
to
8
8
to
9
9
to 1
0
10
to 1
1
11
to 1
2
12
to 1
3
13
to 1
4
14
to 1
5
15
to 1
6
16
to 1
7
17
to 1
8
18
to 1
9
19
to 2
0
20
to 2
1
21
to 2
2
22
to 2
3
23
to 2
4
24
to 2
5
25
to 2
6
26
to 2
7
27
to 2
8
28
to 2
9
29
to 3
0
30
to 3
1
31
to 3
2
32
to 3
3
33
to 3
4
34
to 3
5
35
to 3
6
36
to 3
7
37
to 3
8
38
to 3
9
39
to 4
0
40
to 4
1
41
to 4
2
42
to 4
3
43
to 4
4
44
to 9
9
Temperature Range (C)
Nu
mb
er o
f H
ou
rs
Frequency of Air Temperatures for YearZone 10, Days 1 to 5, Hours 5 to 18
0
500
1000
1500
2000
2500
3000
-99
to -
4
-4
to -
3
-3
to -
2
-2
to -
1
-1
to
0
0
to
1
1
to
2
2
to
3
3
to
4
4
to
5
5
to
6
6
to
7
7
to
8
8
to
9
9
to 1
0
10
to 1
1
11
to 1
2
12
to 1
3
13
to 1
4
14
to 1
5
15
to 1
6
16
to 1
7
17
to 1
8
18
to 1
9
19
to 2
0
20
to 2
1
21
to 2
2
22
to 2
3
23
to 2
4
24
to 2
5
25
to 2
6
26
to 2
7
27
to 2
8
28
to 2
9
29
to 3
0
30
to 3
1
31
to 3
2
32
to 3
3
33
to 3
4
34
to 3
5
35
to 3
6
36
to 3
7
37
to 3
8
38
to 3
9
39
to 4
0
40
to 4
1
41
to 4
2
42
to 4
3
43
to 4
4
44
to 9
9
Temperature Range (C)
Nu
mb
er o
f H
ou
rs

Passive Design Report Appendix A
AESY820000\0\2\SFT30301\Draft.0 © Advanced Environmental Concepts 10/03/2003 - 34
6 LOAD BREAKDOWNS
6.1 Fully Naturally Ventilated Option
1 2 3 4 5 6 7 8 9 10 11 12
0
10000
20000
30000
40000
50000
60000
70000
Load (Kwh)
Month
Monthly Total Loads for mcc_nv_sch.bso
Heating Loads Humidify Loads Cooling Loads Dehumidify Loads Internal Loads Solar Loads
6.2 Air Conditioned with Night Purging Option
1 2 3 4 5 6 7 8 9 10 11 12
0
10000
20000
30000
40000
50000
60000
70000
Load (Kwh)
Month
Monthly Total Loads for mcc_np.bso
Heating Loads Humidify Loads Cooling Loads Dehumidify Loads Internal Loads Solar Loads
6.3 Air Conditioned With No Night Purging Option
1 2 3 4 5 6 7 8 9 10 11 12
0
10000
20000
30000
40000
50000
60000
70000
80000
Load (Kwh)
Month
Monthly Total Loads for mcc_nopurg.bso
Heating Loads Humidify Loads Cooling Loads Dehumidify Loads Internal Loads Solar Loads

Passive Design Report Appendix B
AESY820000\0\2\SFT30301\Draft.0 © Advanced Environmental Concepts 10/03/2003 - 35
APPENDIX B – EXTERNAL WALL THERMAL MASS RESULTS

Passive Design Report Appendix B
AESY820000\0\2\SFT30301\Draft.0 © Advanced Environmental Concepts 10/03/2003 - 36
*zone 8 = mid level perimeter zone * zone 10 = mid level office zone
1 SUMMER – DAY 15
1.1 Concrete wall option

Passive Design Report Appendix B
AESY820000\0\2\SFT30301\Draft.0 © Advanced Environmental Concepts 10/03/2003 - 37
1.2 Autoclaved aerated concrete wall option

Passive Design Report Appendix B
AESY820000\0\2\SFT30301\Draft.0 © Advanced Environmental Concepts 10/03/2003 - 38
1.3 Plasterboard wall option

Passive Design Report Appendix B
AESY820000\0\2\SFT30301\Draft.0 © Advanced Environmental Concepts 10/03/2003 - 39
2 MID-SEASON – DAY 80
2.1 Concrete wall option

Passive Design Report Appendix B
AESY820000\0\2\SFT30301\Draft.0 © Advanced Environmental Concepts 10/03/2003 - 40
2.2 Autoclaved aerated concrete wall option

Passive Design Report Appendix B
AESY820000\0\2\SFT30301\Draft.0 © Advanced Environmental Concepts 10/03/2003 - 41
2.3 Plasterboard wall option

Passive Design Report Appendix B
AESY820000\0\2\SFT30301\Draft.0 © Advanced Environmental Concepts 10/03/2003 - 42
3 WINTER – DAY 180
3.1 Concrete wall option

Passive Design Report Appendix B
AESY820000\0\2\SFT30301\Draft.0 © Advanced Environmental Concepts 10/03/2003 - 43
3.2 Autoclaved aerated concrete wall option

Passive Design Report Appendix B
AESY820000\0\2\SFT30301\Draft.0 © Advanced Environmental Concepts 10/03/2003 - 44
3.3 Plasterboard wall option

Passive Design Report Appendix B
AESY820000\0\2\SFT30301\Draft.0 © Advanced Environmental Concepts 10/03/2003 - 45
4 FREQUENCY DISTRIBUTION OF RESULTANT TEMPERATURES
4.1 Concrete wall option
Frequency of Resultant Temperatures for YearZone 8, Days 1 to 5, Hours 7 to 18
0
100
200
300
400
500
600
700
800
900
1000
-99
to -
4
-4
to -
3
-3
to -
2
-2
to -
1
-1
to
0
0
to
1
1
to
2
2
to
3
3
to
4
4
to
5
5
to
6
6
to
7
7
to
8
8
to
9
9
to 1
0
10
to 1
1
11
to 1
2
12
to 1
3
13
to 1
4
14
to 1
5
15
to 1
6
16
to 1
7
17
to 1
8
18
to 1
9
19
to 2
0
20
to 2
1
21
to 2
2
22
to 2
3
23
to 2
4
24
to 2
5
25
to 2
6
26
to 2
7
27
to 2
8
28
to 2
9
29
to 3
0
30
to 3
1
31
to 3
2
32
to 3
3
33
to 3
4
34
to 3
5
35
to 3
6
36
to 3
7
37
to 3
8
38
to 3
9
39
to 4
0
40
to 4
1
41
to 4
2
42
to 4
3
43
to 4
4
44
to 9
9
Temperature Range (C)
Nu
mb
er o
f H
ou
rs
Frequency of Resultant Temperatures for Year
Zone 10, Days 1 to 5, Hours 7 to 18
0
200
400
600
800
1000
1200
1400
1600
-99
to -
4
-4
to -
3
-3
to -
2
-2
to -
1
-1
to
0
0
to
1
1
to
2
2
to
3
3
to
4
4
to
5
5
to
6
6
to
7
7
to
8
8
to
9
9
to 1
0
10
to 1
1
11
to 1
2
12
to 1
3
13
to 1
4
14
to 1
5
15
to 1
6
16
to 1
7
17
to 1
8
18
to 1
9
19
to 2
0
20
to 2
1
21
to 2
2
22
to 2
3
23
to 2
4
24
to 2
5
25
to 2
6
26
to 2
7
27
to 2
8
28
to 2
9
29
to 3
0
30
to 3
1
31
to 3
2
32
to 3
3
33
to 3
4
34
to 3
5
35
to 3
6
36
to 3
7
37
to 3
8
38
to 3
9
39
to 4
0
40
to 4
1
41
to 4
2
42
to 4
3
43
to 4
4
44
to 9
9
Temperature Range (C)
Nu
mb
er o
f H
ou
rs
4.2 Autoclaved aerated concrete wall option
Frequency of Resultant Temperatures for YearZone 8, Days 1 to 5, Hours 7 to 18
0
200
400
600
800
1000
1200
-99
to -
4
-4
to -
3
-3
to -
2
-2
to -
1
-1
to
0
0
to
1
1
to
2
2
to
3
3
to
4
4
to
5
5
to
6
6
to
7
7
to
8
8
to
9
9
to 1
0
10
to 1
1
11
to 1
2
12
to 1
3
13
to 1
4
14
to 1
5
15
to 1
6
16
to 1
7
17
to 1
8
18
to 1
9
19
to 2
0
20
to 2
1
21
to 2
2
22
to 2
3
23
to 2
4
24
to 2
5
25
to 2
6
26
to 2
7
27
to 2
8
28
to 2
9
29
to 3
0
30
to 3
1
31
to 3
2
32
to 3
3
33
to 3
4
34
to 3
5
35
to 3
6
36
to 3
7
37
to 3
8
38
to 3
9
39
to 4
0
40
to 4
1
41
to 4
2
42
to 4
3
43
to 4
4
44
to 9
9
Temperature Range (C)
Nu
mb
er o
f H
ou
rs

Passive Design Report Appendix B
AESY820000\0\2\SFT30301\Draft.0 © Advanced Environmental Concepts 10/03/2003 - 46
Frequency of Resultant Temperatures for YearZone 10, Days 1 to 5, Hours 7 to 18
0
200
400
600
800
1000
1200
1400
1600
-99
to -
4
-4
to -
3
-3
to -
2
-2
to -
1
-1
to
0
0
to
1
1
to
2
2
to
3
3
to
4
4
to
5
5
to
6
6
to
7
7
to
8
8
to
9
9
to 1
0
10
to 1
1
11
to 1
2
12
to 1
3
13
to 1
4
14
to 1
5
15
to 1
6
16
to 1
7
17
to 1
8
18
to 1
9
19
to 2
0
20
to 2
1
21
to 2
2
22
to 2
3
23
to 2
4
24
to 2
5
25
to 2
6
26
to 2
7
27
to 2
8
28
to 2
9
29
to 3
0
30
to 3
1
31
to 3
2
32
to 3
3
33
to 3
4
34
to 3
5
35
to 3
6
36
to 3
7
37
to 3
8
38
to 3
9
39
to 4
0
40
to 4
1
41
to 4
2
42
to 4
3
43
to 4
4
44
to 9
9
Temperature Range (C)
Nu
mb
er o
f H
ou
rs
4.3 Plasterboard wall option
Frequency of Resultant Temperatures for YearZone 8, Days 1 to 5, Hours 7 to 18
0
200
400
600
800
1000
1200
-99
to -
4
-4
to -
3
-3
to -
2
-2
to -
1
-1
to
0
0
to
1
1
to
2
2
to
3
3
to
4
4
to
5
5
to
6
6
to
7
7
to
8
8
to
9
9
to 1
0
10
to 1
1
11
to 1
2
12
to 1
3
13
to 1
4
14
to 1
5
15
to 1
6
16
to 1
7
17
to 1
8
18
to 1
9
19
to 2
0
20
to 2
1
21
to 2
2
22
to 2
3
23
to 2
4
24
to 2
5
25
to 2
6
26
to 2
7
27
to 2
8
28
to 2
9
29
to 3
0
30
to 3
1
31
to 3
2
32
to 3
3
33
to 3
4
34
to 3
5
35
to 3
6
36
to 3
7
37
to 3
8
38
to 3
9
39
to 4
0
40
to 4
1
41
to 4
2
42
to 4
3
43
to 4
4
44
to 9
9
Temperature Range (C)
Nu
mb
er o
f H
ou
rs
Frequency of Resultant Temperatures for Year
Zone 10, Days 1 to 5, Hours 7 to 18
0
200
400
600
800
1000
1200
1400
1600
-99
to -
4
-4
to -
3
-3
to -
2
-2
to -
1
-1
to
0
0
to
1
1
to
2
2
to
3
3
to
4
4
to
5
5
to
6
6
to
7
7
to
8
8
to
9
9
to 1
0
10
to 1
1
11
to 1
2
12
to 1
3
13
to 1
4
14
to 1
5
15
to 1
6
16
to 1
7
17
to 1
8
18
to 1
9
19
to 2
0
20
to 2
1
21
to 2
2
22
to 2
3
23
to 2
4
24
to 2
5
25
to 2
6
26
to 2
7
27
to 2
8
28
to 2
9
29
to 3
0
30
to 3
1
31
to 3
2
32
to 3
3
33
to 3
4
34
to 3
5
35
to 3
6
36
to 3
7
37
to 3
8
38
to 3
9
39
to 4
0
40
to 4
1
41
to 4
2
42
to 4
3
43
to 4
4
44
to 9
9
Temperature Range (C)
Nu
mb
er o
f H
ou
rs

Passive Design Report Appendix B
AESY820000\0\2\SFT30301\Draft.0 © Advanced Environmental Concepts 10/03/2003 - 47
5 FREQUENCY OF AIR TEMPERATURES
5.1 Concrete wall option
Frequency of Air Temperatures for YearZone 8, Days 1 to 5, Hours 7 to 18
0
500
1000
1500
2000
2500
3000
-99
to -
4
-4
to -
3
-3
to -
2
-2
to -
1
-1
to
0
0
to
1
1
to
2
2
to
3
3
to
4
4
to
5
5
to
6
6
to
7
7
to
8
8
to
9
9
to 1
0
10
to 1
1
11
to 1
2
12
to 1
3
13
to 1
4
14
to 1
5
15
to 1
6
16
to 1
7
17
to 1
8
18
to 1
9
19
to 2
0
20
to 2
1
21
to 2
2
22
to 2
3
23
to 2
4
24
to 2
5
25
to 2
6
26
to 2
7
27
to 2
8
28
to 2
9
29
to 3
0
30
to 3
1
31
to 3
2
32
to 3
3
33
to 3
4
34
to 3
5
35
to 3
6
36
to 3
7
37
to 3
8
38
to 3
9
39
to 4
0
40
to 4
1
41
to 4
2
42
to 4
3
43
to 4
4
44
to 9
9
Temperature Range (C)
Nu
mb
er o
f H
ou
rs
Frequency of Air Temperatures for Year
Zone 10, Days 1 to 5, Hours 7 to 18
0
500
1000
1500
2000
2500
3000
-99
to -
4
-4
to -
3
-3
to -
2
-2
to -
1
-1
to
0
0
to
1
1
to
2
2
to
3
3
to
4
4
to
5
5
to
6
6
to
7
7
to
8
8
to
9
9
to 1
0
10
to 1
1
11
to 1
2
12
to 1
3
13
to 1
4
14
to 1
5
15
to 1
6
16
to 1
7
17
to 1
8
18
to 1
9
19
to 2
0
20
to 2
1
21
to 2
2
22
to 2
3
23
to 2
4
24
to 2
5
25
to 2
6
26
to 2
7
27
to 2
8
28
to 2
9
29
to 3
0
30
to 3
1
31
to 3
2
32
to 3
3
33
to 3
4
34
to 3
5
35
to 3
6
36
to 3
7
37
to 3
8
38
to 3
9
39
to 4
0
40
to 4
1
41
to 4
2
42
to 4
3
43
to 4
4
44
to 9
9
Temperature Range (C)
Nu
mb
er o
f H
ou
rs
5.2 Autoclaved aerated concrete wall option
Frequency of Air Temperatures for YearZone 8, Days 1 to 5, Hours 7 to 18
0
500
1000
1500
2000
2500
3000
-99
to -
4
-4
to -
3
-3
to -
2
-2
to -
1
-1
to
0
0
to
1
1
to
2
2
to
3
3
to
4
4
to
5
5
to
6
6
to
7
7
to
8
8
to
9
9
to 1
0
10
to 1
1
11
to 1
2
12
to 1
3
13
to 1
4
14
to 1
5
15
to 1
6
16
to 1
7
17
to 1
8
18
to 1
9
19
to 2
0
20
to 2
1
21
to 2
2
22
to 2
3
23
to 2
4
24
to 2
5
25
to 2
6
26
to 2
7
27
to 2
8
28
to 2
9
29
to 3
0
30
to 3
1
31
to 3
2
32
to 3
3
33
to 3
4
34
to 3
5
35
to 3
6
36
to 3
7
37
to 3
8
38
to 3
9
39
to 4
0
40
to 4
1
41
to 4
2
42
to 4
3
43
to 4
4
44
to 9
9
Temperature Range (C)
Nu
mb
er o
f H
ou
rs

Passive Design Report Appendix B
AESY820000\0\2\SFT30301\Draft.0 © Advanced Environmental Concepts 10/03/2003 - 48
Frequency of Air Temperatures for YearZone 10, Days 1 to 5, Hours 7 to 18
0
500
1000
1500
2000
2500
3000
-99
to -
4
-4
to -
3
-3
to -
2
-2
to -
1
-1
to
0
0
to
1
1
to
2
2
to
3
3
to
4
4
to
5
5
to
6
6
to
7
7
to
8
8
to
9
9
to 1
0
10
to 1
1
11
to 1
2
12
to 1
3
13
to 1
4
14
to 1
5
15
to 1
6
16
to 1
7
17
to 1
8
18
to 1
9
19
to 2
0
20
to 2
1
21
to 2
2
22
to 2
3
23
to 2
4
24
to 2
5
25
to 2
6
26
to 2
7
27
to 2
8
28
to 2
9
29
to 3
0
30
to 3
1
31
to 3
2
32
to 3
3
33
to 3
4
34
to 3
5
35
to 3
6
36
to 3
7
37
to 3
8
38
to 3
9
39
to 4
0
40
to 4
1
41
to 4
2
42
to 4
3
43
to 4
4
44
to 9
9
Temperature Range (C)
Nu
mb
er o
f H
ou
rs
5.3 Plasterboard wall option
Frequency of Air Temperatures for YearZone 8, Days 1 to 5, Hours 7 to 18
0
500
1000
1500
2000
2500
3000
-99
to -
4
-4
to -
3
-3
to -
2
-2
to -
1
-1
to
0
0
to
1
1
to
2
2
to
3
3
to
4
4
to
5
5
to
6
6
to
7
7
to
8
8
to
9
9
to 1
0
10
to 1
1
11
to 1
2
12
to 1
3
13
to 1
4
14
to 1
5
15
to 1
6
16
to 1
7
17
to 1
8
18
to 1
9
19
to 2
0
20
to 2
1
21
to 2
2
22
to 2
3
23
to 2
4
24
to 2
5
25
to 2
6
26
to 2
7
27
to 2
8
28
to 2
9
29
to 3
0
30
to 3
1
31
to 3
2
32
to 3
3
33
to 3
4
34
to 3
5
35
to 3
6
36
to 3
7
37
to 3
8
38
to 3
9
39
to 4
0
40
to 4
1
41
to 4
2
42
to 4
3
43
to 4
4
44
to 9
9
Temperature Range (C)
Nu
mb
er o
f H
ou
rs
Frequency of Air Temperatures for Year
Zone 10, Days 1 to 5, Hours 7 to 18
0
500
1000
1500
2000
2500
3000
-99
to -
4
-4
to -
3
-3
to -
2
-2
to -
1
-1
to
0
0
to
1
1
to
2
2
to
3
3
to
4
4
to
5
5
to
6
6
to
7
7
to
8
8
to
9
9
to 1
0
10
to 1
1
11
to 1
2
12
to 1
3
13
to 1
4
14
to 1
5
15
to 1
6
16
to 1
7
17
to 1
8
18
to 1
9
19
to 2
0
20
to 2
1
21
to 2
2
22
to 2
3
23
to 2
4
24
to 2
5
25
to 2
6
26
to 2
7
27
to 2
8
28
to 2
9
29
to 3
0
30
to 3
1
31
to 3
2
32
to 3
3
33
to 3
4
34
to 3
5
35
to 3
6
36
to 3
7
37
to 3
8
38
to 3
9
39
to 4
0
40
to 4
1
41
to 4
2
42
to 4
3
43
to 4
4
44
to 9
9
Temperature Range (C)
Nu
mb
er o
f H
ou
rs

Passive Design Report Appendix B
AESY820000\0\2\SFT30301\Draft.0 © Advanced Environmental Concepts 10/03/2003 - 49
6 LOAD BREAKDOWNS
6.1 Concrete wall option
1 2 3 4 5 6 7 8 9 10 11 12
0
10000
20000
30000
40000
50000
60000
70000
Load (Kwh)
Month
Monthly Total Loads for conc90.bso
Heating Loads Humidify Loads Cooling Loads Dehumidify Loads Internal Loads Solar Loads
6.2 Autoclaved aerated concrete wall option
1 2 3 4 5 6 7 8 9 10 11 12
0
10000
20000
30000
40000
50000
60000
70000
Load (Kwh)
Month
Monthly Total Loads for hebel90.bso
Heating Loads Humidify Loads Cooling Loads Dehumidify Loads Internal Loads Solar Loads
6.3 Plasterboard wall option
1 2 3 4 5 6 7 8 9 10 11 12
0
10000
20000
30000
40000
50000
60000
70000
Load (Kwh)
Month
Monthly Total Loads for plast12.bso
Heating Loads Humidify Loads Cooling Loads Dehumidify Loads Internal Loads Solar Loads