pasadena water & power 2009 integrated resource plan public meeting #3 december 17, 2008
Post on 19-Dec-2015
218 views
TRANSCRIPT

Pasadena Water & Power 2009 Integrated Resource Plan
Public Meeting #3
December 17, 2008

- 2 -The Power of Integration
Agenda
• IRP Goals and Process Review
• Findings and Recommendations
– Phase 2 Results and Pace Recommendations
– Action Items and Key Decision Points
– Near-Term Implementation Steps
• Next Steps

- 3 -The Power of Integration
Goals for 2009 IRP Process
• Comprehensive plan for satisfying PWP’s future electricity requirements for supply-side and demand-side resources
• Systematic approach to identify all relevant options, evaluate the trade-offs (reliability, cost, environmental) and assess the risks associated with each option
• Extensive public input and stakeholder review to ensure that the IRP process reflects the community’s needs
• Action Plan to identify specific decisions and initiatives that should be implemented to achieve the goals of the IRP

- 4 -The Power of Integration
Guiding Principles for the 2009 IRP
• Ensure alignment with the City’s aspirations to be an environmental advocate and leader
• Directly address several issues raised in the previous IRP
– Quantification of environmental impacts (CO2 costs)
– Resources options considered (In-city generation, local renewable energy, energy efficiency, fossil-fueled generation)
– Aggressiveness of renewable energy policies
– Strategic partnerships with local entities
• Conduct a collaborative process for public and stakeholder participation throughout the planning process

- 5 -The Power of Integration
Phase 1 – Narrowing the range of possibilities
DetermineObjectives/
Goals
ConstructPolicy
Scenarios
ConfigureResource
Parameters
AnalyzeResources/
Policies
RecommendPortfolios/
Policies
Stakeholder Advisory GroupStakeholder Advisory Group
Objectives
Policies &Portfolios
Screening Analysis Recommended
CandidatePortfolios
Supply & Demand
ResourceOptions

- 6 -The Power of Integration
Phase 2 – Evaluating Tradeoffs (environment, cost, risk)
Develop Assumptions
Configure AlternatePortfolios
DevelopReference Case
Perform Portfolio & Risk
AnalysisPrepare Report
Stakeholder Advisory Group Stakeholder Advisory Group
Final Set of Data Inputs
PortfolioRisk
AnalysisRecommendedresource plan
Portfolioanalysis
(best guessassumptions)
Final set of portfolios

- 7 -The Power of Integration
Pasadena Water & Power Existing Resource Portfolio
Capacity Mix (MW,%)
Energy/Fuel Mix

- 8 -The Power of Integration
Key Drivers Affecting PWP’s IRP Options
• High and volatile fuel and capital costs
• Rising Renewable Portfolio Standards
• Emerging carbon constraints weighing on coal generation
• Significant exposure to potential cost increases
• Evolving regulatory and environmental challenges
• Technology advances opening new opportunities, particularly regarding solar and other renewable options
• Reliability concerns and dependence on aging infrastructure

- 9 -The Power of Integration
Ranking IRP Objectives—PWP Stakeholder Surveys
IRP Advisory Group Rankings
Public Questionnaire 1 Rankings
Public Questionnaire 2 Rankings
Provide Reliable Service 1 1 4
Strive for Environmental Leadership 2 2 1 **
Maintain Stable Rates 3 3
Preserve Competitive Rates 5 2
Allow for Flexibility 4 5
Manage Market Risks 6 5
Maintain Fiscal Health 7 7
** High rankings for "Energy Efficiency and Conservation", Environmental Protection" and "Building a Renewable Energy Portfolio" also incorporated from Public Questionnaire responses
3

- 10 -The Power of Integration
PWP Customers’ Opinions on Climate Change Issues
PWP Residential Customers PWP Business Customers
"Very Familiar" with climate change issues 58% 60%
"Very Concerned" with climate change issues 61% 49%
"Reasonable" rate increase to fund climate change solutions
20% 24% 9%
15% 29% 15%
10% 49% 34%
5% 71% 56%
3% 78% 79%
"Reasonable" rate increase to do more than climate change law requires
20% 10% 13%
15% 14% 15%
10% 21% 25%
5% 29% 33%
3% 29% 37%
Source: RKS Consulting Surveys, November 2008

- 11 -The Power of Integration
Summary of Findings
• Phase 2 analysis is complete
• Key conclusions and recommendations are:– Carbon reduction and renewable portfolio standard (RPS) requirements are
uncertain, but PWP could meet a 33% RPS and at least a 25% carbon reduction without significant changes to the existing portfolio
– A 33+% RPS and about a 25% carbon reduction is achievable at little or no additional cost from the current portfolio by pursuing economical energy efficiency and demand response programs (31 MW), solar PV and other local renewables (24 MW), landfill gas (15 MW), geothermal (15 MW), solar thermal (10 MW), and wind (10 MW) by 2020
– Opportunities to achieve higher carbon reductions and RPS levels appear feasible, in exchange for higher costs and risk exposure
– Higher levels of carbon reductions may be achievable at about a $2.50/MWh (levelized NPV) increase for every 10% increase in carbon reductions, if IPP power can be sold off under carbon accounting rules at a reasonable price
– PWP needs to invest in local infrastructure, which could include new local gas-fired generation or transmission system upgrades (or both), in order to mitigate exposure to reliability risks in the existing portfolio

- 12 -The Power of Integration
Emissions Reduction
RPS 2020 Cost Reliability Price RiskIPP Sale
Feasibility
% Reduction from 2008
% of NELLevelized $/MWh
Added cost for 95% $/MWh
Added Cost Levelized $/MWh
1a: Low Diverse 29% 40% 89 16 0
5b: Med CC Renew 38% 50% 92 23 5
6: Med CC 60% 33% 104 26 24
8: High Diverse 74% 74% 105 26 24
Portfolio
Recommended Portfolios
Portfolio NameLocal
RenewablesRemote
RenewablesDSM/Eff.
Natural Gas
Coal Total
1a: Low Diverse 24 50 31 1055b: Med CC Renew 29 70 31 - 65 + 65 -35 956: Med CC 14 30 26 65 -108 278: High Diverse 50 70 59 -108 71
Pace recommends four specific alternatives for final consideration
Incremental Changes to Existing Portfolio (MW)
Performance Across Key IRP Objectives and Considerations

- 13 -The Power of Integration
Projected Impacts on Residential Customer Bills
0%
10%
20%
30%
40%
50%
60%
70%
80%
90%
100%
0% 5% 10% 15% 20% 25% 30% 35% 40% 45% 50%
Change in Levelized Monthly Residential Bill 2009-2030
Car
bo
n R
edu
ctio
n b
y 20
20
Status Quo
Portfolio 5
Portfolio 6
Portfolio 8
Portfolio 5a
Portfolio 5b
Portfolio 1a
Action ItemAction Item
- 14 -The Power of Integration
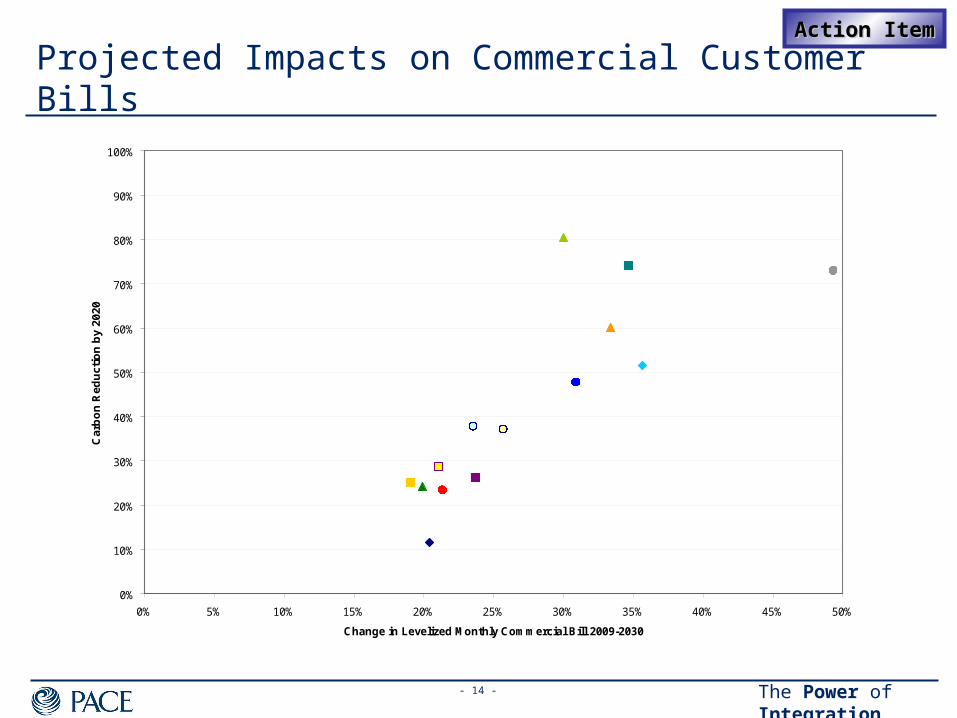
Projected Impacts on Commercial Customer Bills
0%
10%
20%
30%
40%
50%
60%
70%
80%
90%
100%
0% 5% 10% 15% 20% 25% 30% 35% 40% 45% 50%
Change in Levelized Monthly Commercial Bill 2009-2030
Car
bo
n R
edu
ctio
n b
y 20
20
Status Quo
Portfolio 5
Portfolio 6
Portfolio 8
Portfolio 5a
Portfolio 5b
Portfolio 1a
Action ItemAction Item

- 15 -The Power of Integration
Emissions Reduction
Cost Price Risk RPS 2020 ReliabilityCapital
Charges
Spot Market Dependence
2020
IPP Sale Feasibility
Carbon Price Risk
Regulatory Risk
% Reduction from 2008
Levelized $/MWh
Added cost for 95% $/MWh
% of NELAnnual
Levelized $MM in 2030
% of 2020 LoadAdded Cost Levelized $/MWh
Added Cost Levelized $/MWh
Status Quo 12% 89 9 12% 0 4% 0 20
1a: Low Diverse 29% 89 16 40% 31 29% 0 15
5: Med Remote Renew 48% 101 27 58% 65 26% 8 11
5a: Med Diverse Renew 37% 95 18 58% 39 21% 5 13
5b: Med CC Renew 38% 92 23 50% 51 41% 5 12
6: Med CC 60% 104 26 33% 34 -2% 24 10
8: High Diverse 74% 105 26 74% 49 -8% 24 7
Portfolio
Final Portfolio Ranking• Portfolio 1a has lowest emission reduction, but at lowest cost and price risk; since it holds all of IPP, it is significantly
exposed to the impact of higher CO2 pricing and may not adequately address reliability concerns
• Portfolio 5 may not adequately address reliability concerns and requires the most capital investment, but achieves nearly 50% emission reductions
• Portfolio 5a achieves moderate emission reductions, mitigates risk of IPP sale and has low market risk but may not adequately address reliability concerns
• Portfolio 5b achieves moderate emission reductions at relatively low cost, but directly addresses reliability concerns due to the addition of new local gas-fired generation
• Portfolio 6 achieves significant emission reductions and addresses reliability concerns, but at a higher cost and with exposure to market and IPP sale uncertainty
• Portfolio 8 achieves the highest emission reduction, but at highest cost, exposure to IPP sale uncertainty and may not adequately address reliability concerns
8
- 16 -The Power of Integration
Recommended Portfolios (cont.)
• Pace recommends four specific alternatives for final consideration
– Reduce GHG emissions by about 30% by 2020 through modest additions of renewable energy and other clean resources. This option seeks to minimize the upward pressure on PWP’s costs, but may not address reliability concerns and PWP’s ability to satisfy emerging environmental obligations.
– Reduce GHG emissions by about 40% by 2020 through a diverse mix of renewable energy, other clean resources, and efficient new natural gas-fired generation inside Pasadena. This option attempts to balance environmental, cost and reliability objectives without subjecting PWP to extreme risks.
– Reduce GHG emissions by about 60% by 2020 through completely displacing existing coal resources and replacing them with efficient new natural gas-fired generation and modest additions of renewable energy and other clean resources. This option addresses reliability risks, but at higher cost and the risk that full coal displacement is infeasible.
– Reduce GHG emissions by about 75% by 2020 through completely displacing existing coal resources and replacing them with a diverse mix of renewable energy and other clean resources. This option provides the highest GHG emissions reductions, but is the most expensive of the four options and may not adequately address reliability concerns associated with continued reliance on the aging local generating units.

- 17 -The Power of Integration
Summary of Key Decision Points
• Minimum Environmental Performance: Portfolio options break down into low, medium, and high emission reduction targets
– If the low reduction is considered a “non-starter” because it is deemed insufficient for likely carbon limits, then Portfolio 1a can be eliminated
– What additional cost to move to higher emission reduction targets is palatable to customers?
• IPP Sale Feasibility: Uncertainties regarding the sale of IPP power may dictate how much is removed from the portfolio, and the level of emission reductions that is achievable
– If no more than a 35 MW displacement is considered feasible, then Portfolios 6 and 8 can be eliminated
• Reliability: What local infrastructure investments provide acceptable reliability?
– If new local gas-fired generation is considered essential to providing an acceptable assurance of reliability (rather than extending the life of existing local units plus potential transmission system upgrades), then Portfolio 8 can be eliminated

- 18 -The Power of Integration
Action Items and Final Portfolio Selection
• A final selection among these alternatives requires specific decisions about the preferred balance between greater GHG emissions reductions, higher costs, and infrastructure improvements to reduce reliability risks
• Several key Action Items are recommended to select the best portfolio
– An evaluation of PWP customers’ appetite for paying premiums for environmental stewardship
– An evaluation of the potential sales, GHG accounting treatment, and price for power sales from IPP
– An evaluation of whether new local gas-fired generation or transmission system enhancements (or both) is the preferred approach for ensuring reliability
– An evaluation of the availability of low cost geothermal and landfill gas renewable energy projects to achieve potential cost reductions

- 19 -The Power of Integration
Near-Term Implementation Steps
• Regardless of the long-term GHG emissions reduction that is chosen, PWP should immediately commence with the following short-term implementation steps that are common among all of the long-term strategies:
– Continue securing contracts for power from a diverse mix of new renewable energy sources, balanced among landfill gas, geothermal, wind and solar projects
– Expand PWP’s already aggressive energy efficiency programs
– Develop demand response programs and rates to provide customers with economic incentives to reduce their peak electricity consumption
– Develop a new “feed-in tariff” program in which PWP will offer to purchase power, at a fixed price, to any qualifying renewable energy project within the City in order to facilitate the development of local renewable energy sources
– Evaluate innovative new financing approaches and electric rate structures in order to spur more PWP customers to install solar photovoltaic projects inside Pasadena

- 20 -The Power of Integration
Status Update
• Tentative Schedule for Remaining IRP Process
– December 17: AG and Public Meetings to present Phase 2 conclusions and recommendations
– January 12: Draft IRP Report Released
– January 23: Advisory Group Meeting #6
– January 24 (Saturday): Public Meeting #4
– Late January/Early February: Presentations to EAC and MSC
– Early February: Written Comments due on Final Report
– Mid-late February: Request EAC Support
– Early March: Request City Council Approval

- 21 -The Power of Integration
Public InputPublic Input