part three tqm – the tools and the improvement cycle
DESCRIPTION
Part Three TQM – The Tools and the Improvement Cycle. Chapter # 8 Tools and techniques for quality improvement. Chapter Outline. 8.1 A systematic approach 8.2 Some basic tools and techniques 8.4 Statistical process control (SPC) 8.5 Quality improvement techniques in non-manufacturing. - PowerPoint PPT PresentationTRANSCRIPT
1
Greg Baker © 2004
Part ThreePart ThreeTQM – The Tools and the TQM – The Tools and the
Improvement CycleImprovement Cycle
Chapter # 8Chapter # 8
Tools and techniques for Tools and techniques for quality improvementquality improvement
2
Greg Baker © 2004
Chapter OutlineChapter Outline
8.1 A systematic approach 8.2 Some basic tools and techniques 8.4 Statistical process control (SPC) 8.5 Quality improvement techniques in
non-manufacturing
3
Greg Baker © 2004
8.1 A systematic approach8.1 A systematic approach
In addition to the basic elements of a quality system that provide a framework for recording, there exists a set of methods the Japanese quality guru Ishikawa has called the seven basic tools.
These should be used to interpret and derive the maximum use from data.
4
Greg Baker © 2004
8.1 A systematic approach8.1 A systematic approach
The simple methods listed below, of which there are clearly more than seven, will offer any organization means of collecting, presenting, and analyzing most of its data:
Process flowcharting – what is done? Check sheets/tally charts – how often is it done? Histograms – what do overall variations look
like? Scatter diagrams – what are the relationships
between factors? Pareto analysis – which are the big problems? Cause and effect analysis and Brainstorming –
what causes the problems? Control charts – which variations to control and
how?
5
Greg Baker © 2004
8.1 A systematic approach8.1 A systematic approach
The effective use of the tools requires their application by the people who actually work on the process.
Managers must show they are serious by establishing a systematic approach and providing the training and implementation support required.
A focus on improvement opportunities leads to the creation of teams whose membership is determined by their work on and detailed knowledge of the process, and their ability to take improvement action.
6
Greg Baker © 2004
8.1 A systematic approach8.1 A systematic approach
By using reliable methods, creating a favorable environment for team based problem solving, and continuing to improve using systematic techniques, the never-ending improvement helix will be engaged.
This approach requires a change in the language of many organizations from percentage defects, percentage 'prime' product, and number of errors, to process capability.
7
Greg Baker © 2004
8.1 A systematic approach8.1 A systematic approach
The traditional approach 'If it meets the specification, there are no problems and no further improvements are necessary'.
The driving force for this will be the need for better internal and external customer satisfaction levels, which will lead to the continuous improvement question, 'Could we do the job better?'.
8
Greg Baker © 2004
8.2 Some basic tools and 8.2 Some basic tools and techniquestechniques
Process flowcharting To ensure a full understanding of the inputs
and flow of the process. The process chart lists every step that is
involved in the manufacturing of a product or the delivery of a service.
It is a good idea to draw the process chart using the standard symbols because this aids clarity.
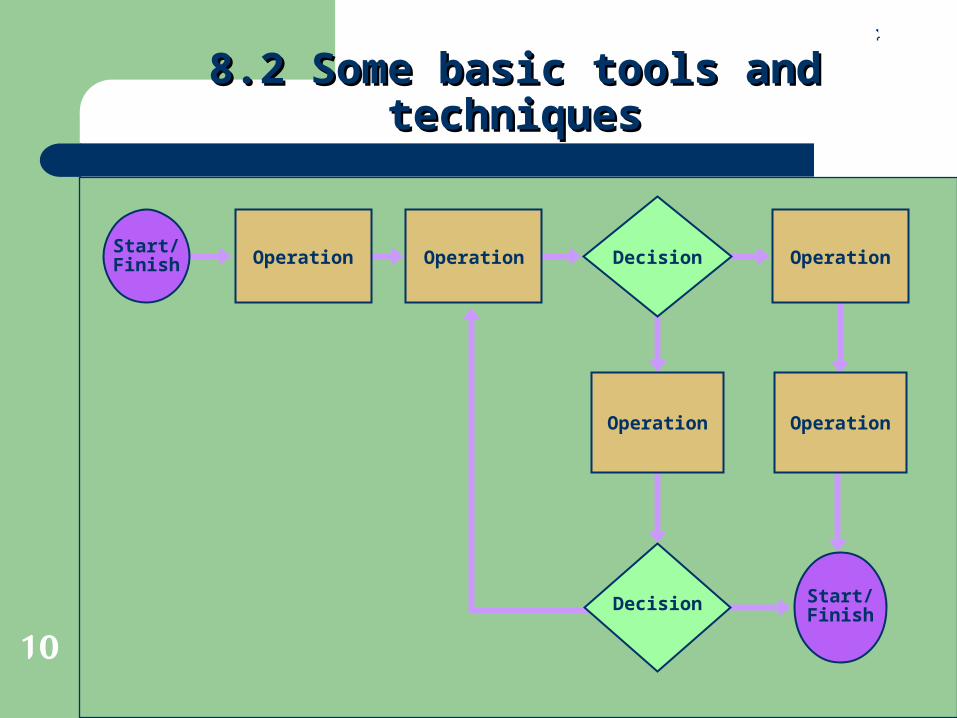
A flow chart is similar to process chart and is often used when there are decisions involved.
9
Greg Baker © 2004
8.2 Some basic tools and 8.2 Some basic tools and techniquestechniques
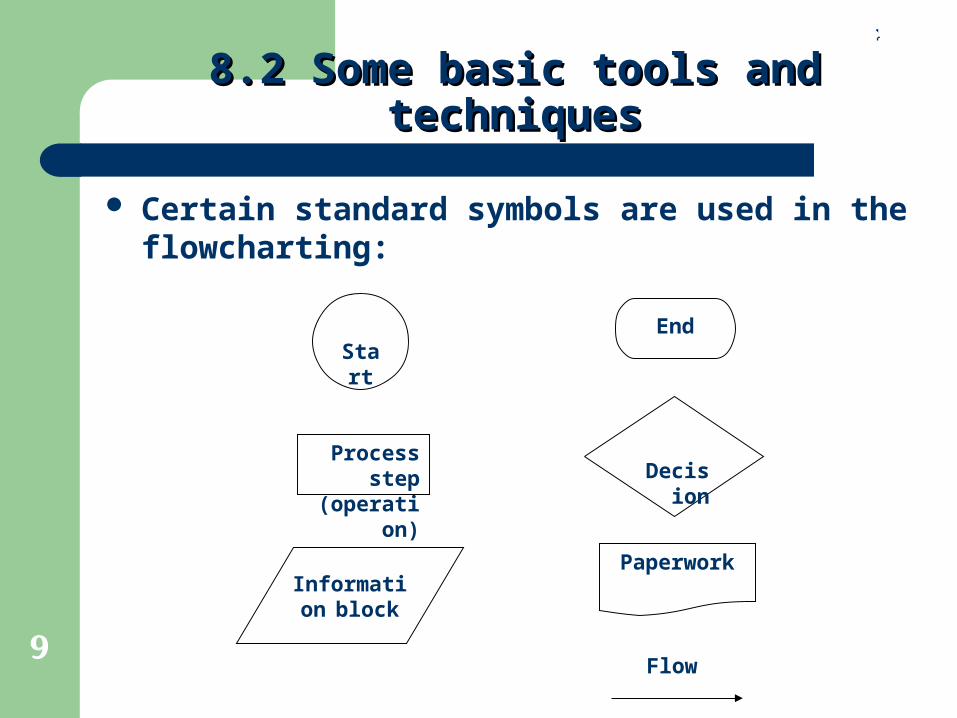
Certain standard symbols are used in the flowcharting:
Start
Decision
Information
block
End
Process step (operation)
Paperwork
Flow
10
Greg Baker © 2004
8.2 Some basic tools and 8.2 Some basic tools and techniquestechniques
Operation DecisionStart/ Finish
Start/ Finish
Operation
OperationOperation
Operation
Decision
11
Greg Baker © 2004
8.2 Some basic tools and 8.2 Some basic tools and techniquestechniques
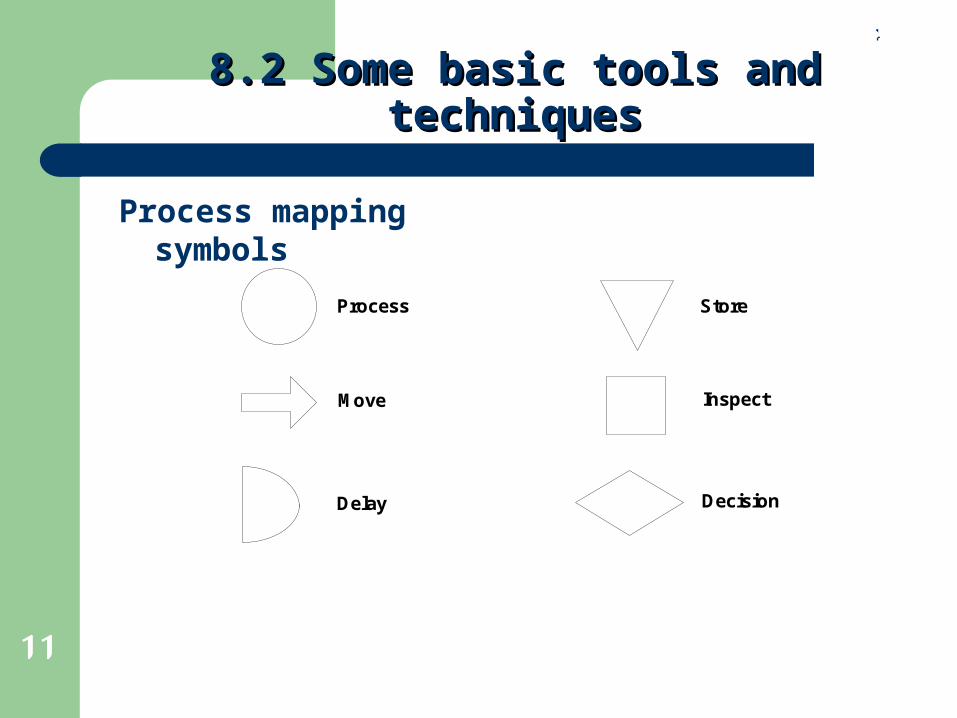
Process
Move
Delay
Store
Inspect
Decision
Process mapping symbols
12
Greg Baker © 2004
8.2 Some basic tools and 8.2 Some basic tools and techniquestechniques
Check sheets or tally charts It is particularly useful for recording direct
observations and helping to gather in facts rather than opinions about the process.
The use of simple check sheets or tally charts aids the collection of data of the right type, in the right form, at the right time.
The objectives of the data collection will determine the design of the record sheet used.

13
Greg Baker © 2004
8.2 Some basic tools and 8.2 Some basic tools and techniquestechniques
Check sheet example
COMPONENTS REPLACED BY LABTIME PERIOD: 22 Feb to 27 Feb 2002REPAIR TECHNICIAN: Bob
TV SET MODEL 1013
Integrated Circuits ||||Capacitors |||| |||| |||| |||| |||| ||Resistors ||Transformers ||||CommandsCRT |
14
Greg Baker © 2004
8.2 Some basic tools and 8.2 Some basic tools and techniquestechniques
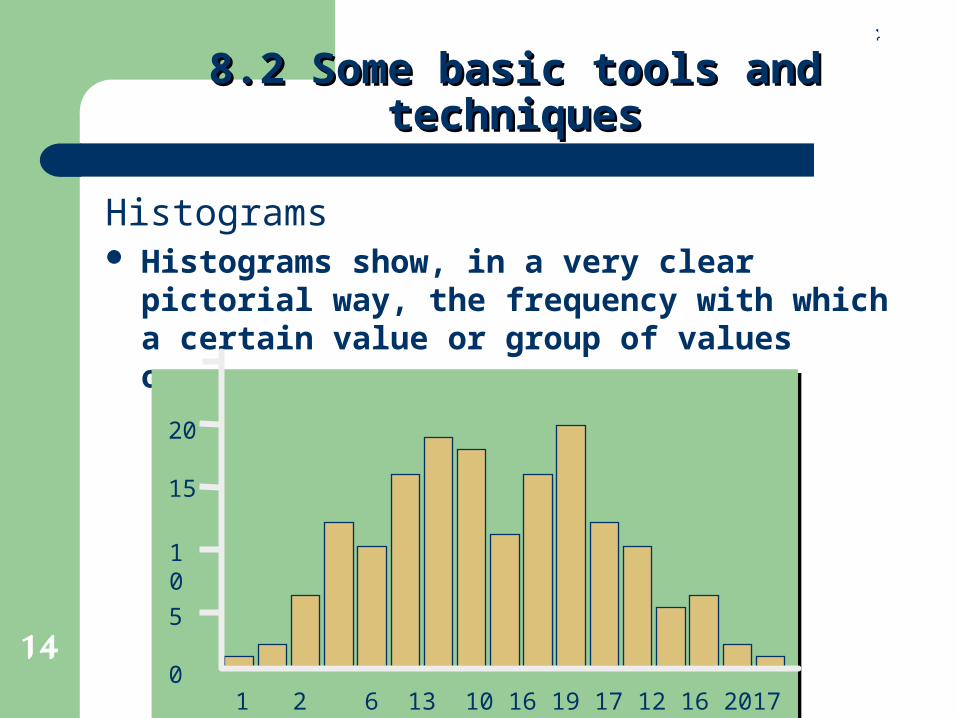
Histograms Histograms show, in a very clear pictorial
way, the frequency with which a certain value or group of values occurs.
0
5
10
15
20
1 2 6 13 10 16 19 17 12 16 2017 13 5 6 2 1
15
Greg Baker © 2004
8.2 Some basic tools and 8.2 Some basic tools and techniquestechniques
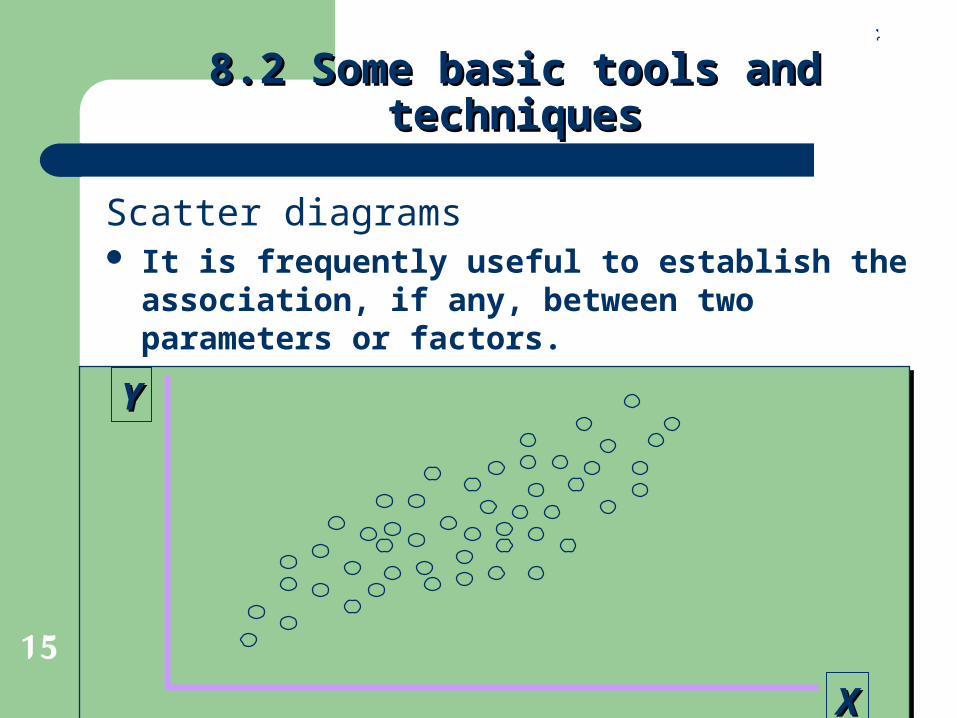
Scatter diagrams It is frequently useful to establish the
association, if any, between two parameters or factors.
YY
XX
16
Greg Baker © 2004
8.2 Some basic tools and 8.2 Some basic tools and techniquestechniques
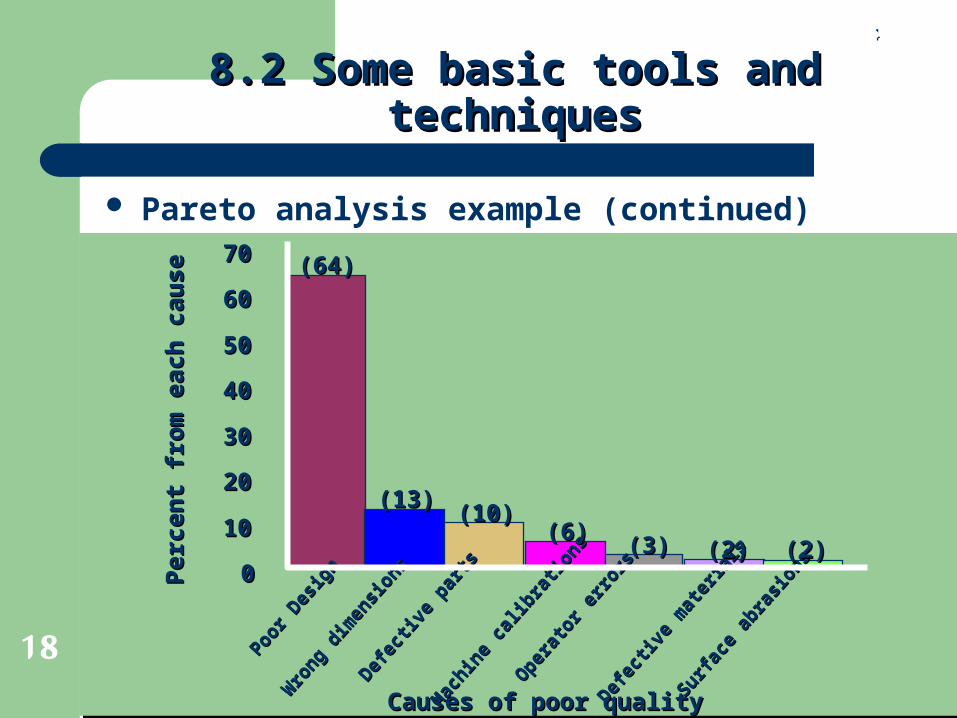
Pareto analysis If symptoms or causes of defective output
or some other 'effect' are identified and recorded, it will be possible to determine what percentage can be attributed to any cause, and the probable results will be that the bulk (typically 80 per cent) of errors, waste, or 'effects' derive from a few of the causes (typically 20 per cent).
Pareto analysis begins by ranking problems from highest to lowest.
17
Greg Baker © 2004
8.2 Some basic tools and 8.2 Some basic tools and techniquestechniques
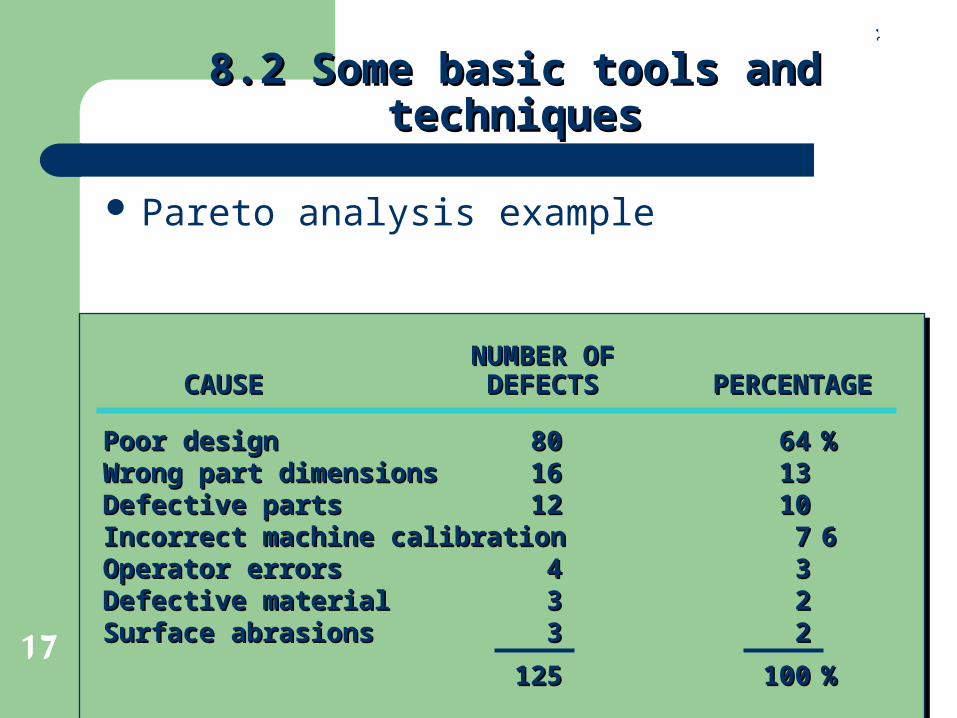
Pareto analysis example
NUMBER OFNUMBER OFCAUSECAUSE DEFECTSDEFECTS PERCENTAGEPERCENTAGE
Poor designPoor design 8080 6464 %%Wrong part dimensionsWrong part dimensions 1616 1313Defective partsDefective parts 1212 1010Incorrect machine calibrationIncorrect machine calibration 77 66Operator errorsOperator errors 44 33Defective materialDefective material 33 22Surface abrasionsSurface abrasions 33 22
125125 100100 %%
18
Greg Baker © 2004
8.2 Some basic tools and 8.2 Some basic tools and techniquestechniques
Pareto analysis example (continued)P
erce
nt
fro
m e
ach
cau
seP
erce
nt
fro
m e
ach
cau
se
Causes of poor qualityCauses of poor quality
Mac
hine
cal
ibra
tions
Mac
hine
cal
ibra
tions
Defec
tive
parts
Defec
tive
parts
Wro
ng d
imen
sion
s
Wro
ng d
imen
sion
s
Poor D
esig
n
Poor D
esig
n
Ope
rato
r err
ors
Ope
rato
r err
ors
Defec
tive
mat
eria
ls
Defec
tive
mat
eria
ls
Surfa
ce a
bras
ions
Surfa
ce a
bras
ions00
1010
2020
3030
4040
5050
6060
7070 (64)(64)
(13)(13)(10)(10)
(6)(6)(3)(3) (2)(2) (2)(2)
19
Greg Baker © 2004
8.2 Some basic tools and 8.2 Some basic tools and techniquestechniques
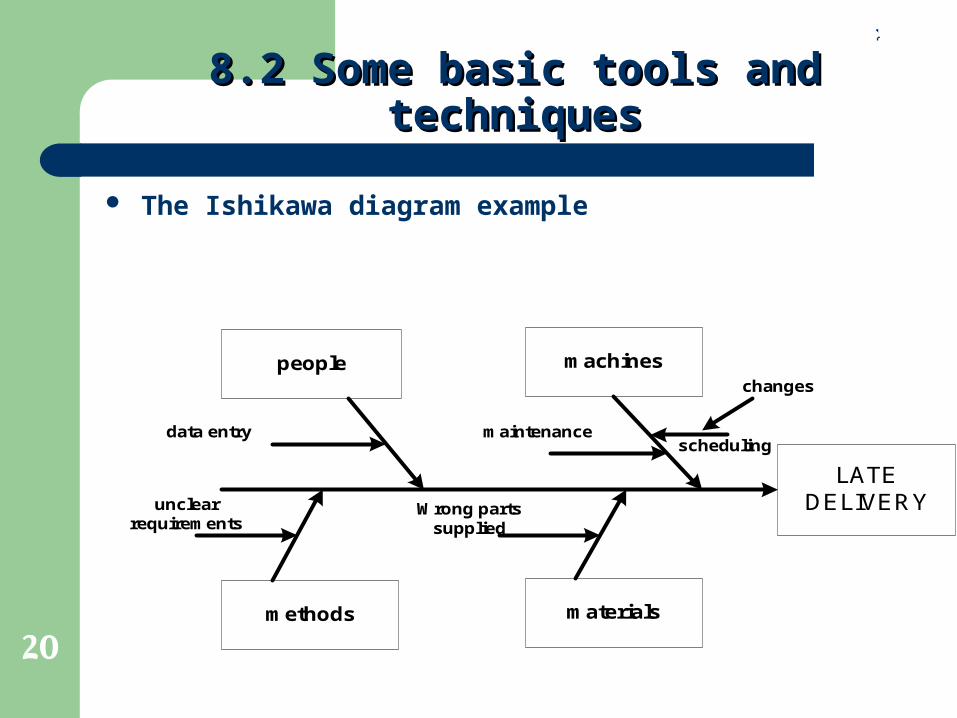
Cause and effect analysis and brainstorming
Brainstorming is a technique used to generate a large number of ideas quickly, and may be used in a variety of situations.
Cause and effect diagram, also known as the "Ishikawa diagram " diagram and the "fishbone" diagram, is used to brainstorm out possible contributing causes of a particular problem or defect.
20
Greg Baker © 2004
8.2 Some basic tools and 8.2 Some basic tools and techniquestechniques
The Ishikawa diagram example
LATE DELIVERY
machinespeople
materialsmethods
scheduling
changes
maintenance
Wrong parts supplied
data entry
unclear requirements
21
Greg Baker © 2004
8.2 Some basic tools and 8.2 Some basic tools and techniquestechniques
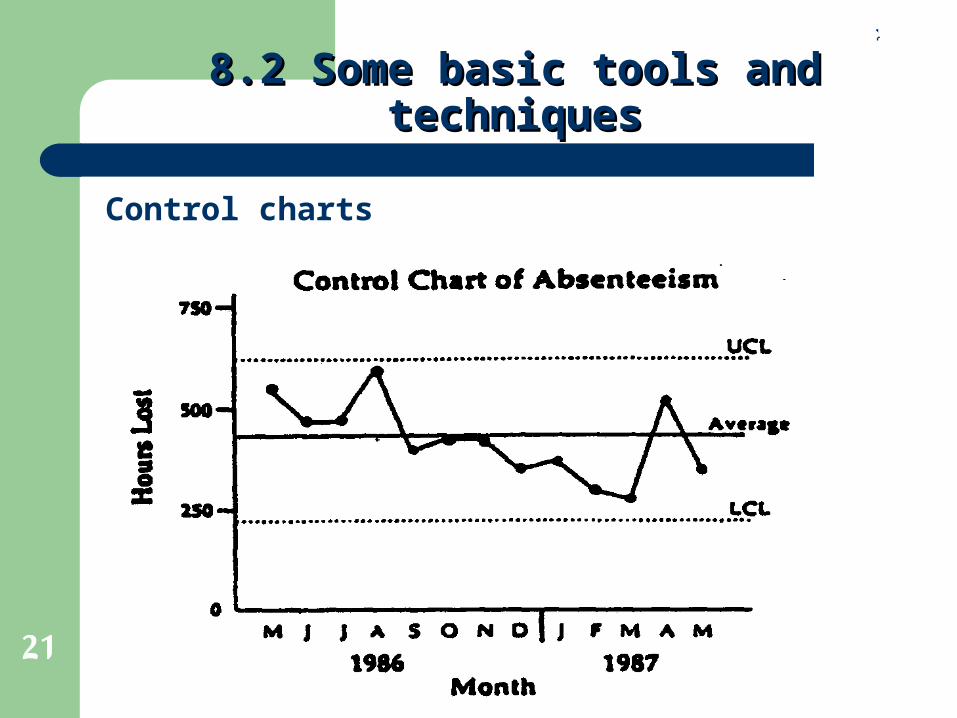
Control charts
22
Greg Baker © 2004
8.4 Statistical process control 8.4 Statistical process control (SPC)(SPC)
The responsibility for quality in any transformation process must lie with the operators of that process.
To fulfill this responsibility, however, people must be provided with the tools necessary to:
Know whether the process is capable of meeting the requirements.
Know whether the process is meeting the requirements at any point in time.
Make correct adjustment to the process or its inputs when it is not meeting the requirements.
• The techniques of statistical process control (SPC) will greatly assist in these stages.
23
Greg Baker © 2004
8.4 Statistical process control 8.4 Statistical process control (SPC)(SPC)
To begin to monitor and analyze any process, it is necessary first of all to identify what the process is, and what the inputs and outputs are.
In many situations it can be extremely difficult to define the process.
Once the process is specified, the inputs and suppliers, outputs and customers can also be defined, together with the requirements at each of the interfaces.
Prevention of failure in any transformation is possible only if the process definition, flow, inputs, and outputs are properly documented and agreed.
24
Greg Baker © 2004
8.4 Statistical process control 8.4 Statistical process control (SPC)(SPC)
The documentation of procedures will allow reliable data about the process itself to be collected, analysis to be performed, and action to be taken to improve the process and prevent failure or non-conformance with the requirements.
SPC methods, backed by management commitment and good organization, provide objective means of controlling quality in any transformation process, whether used in the manufacture of artefacts, the provision of services, or the transfer of information.
25
Greg Baker © 2004
8.4 Statistical process control 8.4 Statistical process control (SPC)(SPC)
SPC is not only a toolkit, it is a strategy for reducing variability, the cause of most quality problems: variation in products, in times of deliveries, in ways of doing things, in materials, in people's attitudes, in equipment and its use, in maintenance practices, in every thing.
Total quality management requires that the processes should be improved continually by reducing variability.
26
Greg Baker © 2004
8.4 Statistical process control 8.4 Statistical process control (SPC)(SPC)
It is worth repeating that SPC is not only about plotting charts on the walls of a plant or office, it must become part of the company-wide adoption of TQM and act as the focal point of never-ending improvement.
The SPC system A systematic study of any process though
answering the questions: Are we capable of doing the job correctly? Do we continue to do the job correctly? Have we done the job correctly? Could we do the job more consistently and
on target?
27
Greg Baker © 2004
8.4 Statistical process control 8.4 Statistical process control (SPC)(SPC)
SPC techniques may be used to measure and control the degree of variation of any purchased materials, services, processes, and products, and to compare this, if required, to previously agreed specifications.
In essence, SPC techniques select a representative, simple, random sample from the 'population', which can be an input to or an output from a process.
From an analysis of the sample it is possible to make decisions regarding the current performance of the process.
28
Greg Baker © 2004
8.5 Quality improvement 8.5 Quality improvement techniques in non-manufacturingtechniques in non-manufacturing
Organizations that embrace the TQM concepts should recognize the value of SPC techniques in areas such as sales, purchasing, invoicing, finance, distribution, training, and in the service sector generally.
Theses are outside the traditional areas for SPC use, but SPC needs to be seen as an organization-wide approach to reducing variation with the specific techniques integrated into a program of change throughout.
29
Greg Baker © 2004
8.5 Quality improvement 8.5 Quality improvement techniques in non-manufacturingtechniques in non-manufacturing
Some of the most exciting applications of SPC have emerged from organizations and departments which, when first introduced to the methods, could see little relevance in them to their own activities. Following appropriate training, however, they have learned how to, for example:
Pareto analyze errors on invoices to customers. Brainstorm and cause and effect analyze
reasons for late payment. Histogram defects in invoice matching and
arrival of trucks at certain times during the day. Control chart the weekly demand of a product.
30
Greg Baker © 2004
8.5 Quality improvement 8.5 Quality improvement techniques in non-manufacturingtechniques in non-manufacturing
Distribution staff have used control charts to monitor the proportion of late deliveries, and Pareto analyses to look at complaints about the distribution system.
Those organizations that have made most progress in implementing continuous improvement have recognized at an early stage that SPC is for the whole organization.
Applying the methods and techniques outside manufacturing will make it easier, not harder, to gain maximum benefit from an SPC program.
31
Greg Baker © 2004
8.5 Quality improvement 8.5 Quality improvement techniques in non-manufacturingtechniques in non-manufacturing
Sales, marketing and customer-service are areas often resistant to SPC training on the basis that it is difficult to apply.
Personnel in these vital functions need to be educated in SPC methods for two reasons:
1. They need to understand the way the manufacturing or service producing processes in their organizations work.
2. They will be able to improve the marketing processes and activities.
SPC has considerable applications for non-manufacturing organizations, including universities, hospitals, schools……
32
Greg Baker © 2004
Adding the tools to the TQM Adding the tools to the TQM modelmodel
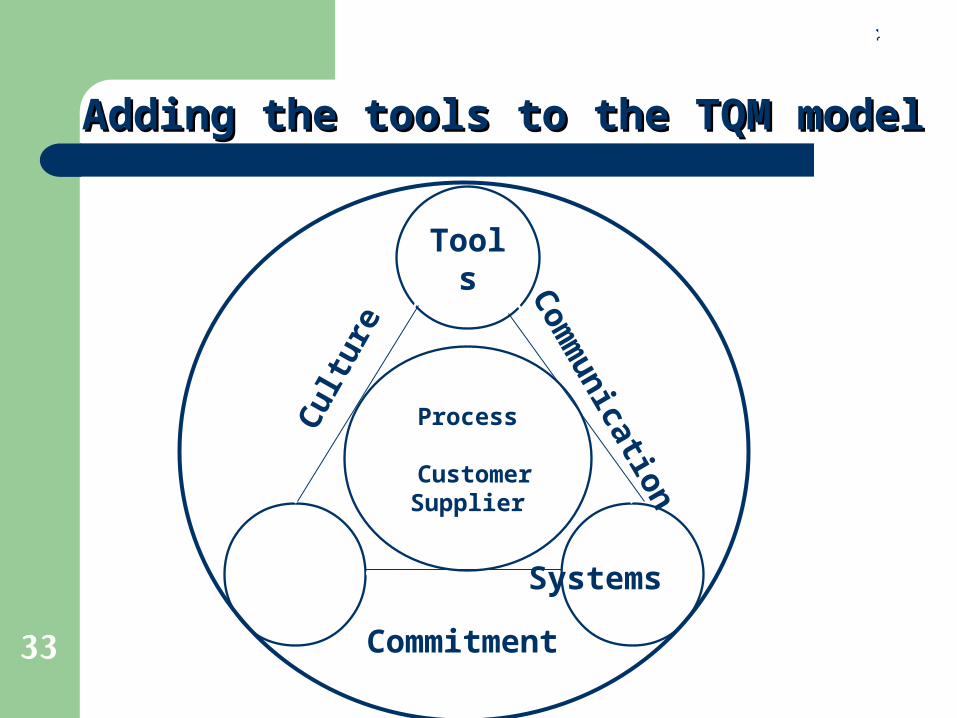
Having looked at some of the many tools and techniques of measurement and improvement, we see that the generic term ‘tools’ may be added, as the second hard management necessity, to the TQM model.
The systems manage the processes, and the tools are used to progress further round the improvement cycle by creating better customer-supplier relationships, both externally and internally.
33
Greg Baker © 2004
Adding the tools to the TQM modelAdding the tools to the TQM model
Tools
Process
Customer Supplier
Cul
ture
Com
munication
CommitmentSystems