a tqm improvement process model, an … tqm improvement process model, an implementation case study....
TRANSCRIPT
International Journal of Scientific & Engineering Research Volume 4, Issue 5, May 2013 ISSN 2229-5518
1
A TQM improvement process model, an implementation case study.
Walid Youssef Montasser - Prof Dr. Abd Alhakim Al Manhawy
Abstract: Total quality management is a criterion for managing people, tasks and processes to ensure a superior service/product quality which guarantees complete customer satisfaction. It is an aspect of management which solely focuses on quality as its prime success factor; total quality management (TQM) is the set of management processes and systems that create delighted customers through empowered employees, leading to higher revenue and lower cost. TQM is an approach to improving the competitiveness, effectiveness and flexibility of a whole organization. TQM represents a substantial change in organization and management philosophy for most organizations. Simply “deciding to do it” and “understanding it” are not enough to create the management systems that are required to launch and sustain a TQM effort. Insight alone does not produce change. As in any other type of major undertaking, an organization needs plan to improve TQM implementation. The aim of this part of the study was to develop an improvement Plan that is formulated, directed, supported and controlled by the highest levels in the organization. This planning is linked to the processes by which the hotel services are fabricated and delivered, after the completion of the plan implementation stage, and as a future work, the results will be evaluated and used to ensure the validity of the proposed theoretical model through the re-testing of the hypotheses introduced in the first part of this research. Index terms- the role of top management, team formulation, team training, plan formulation, plan implementation, implementation check, results
analysis, feedback.
- - - - - - - - - - - - - -
1-INTRODUCTION QM is a management philosophy that helps managing organizations to improve its overall performance and
effectiveness in achieving quality status at global level (Zhang et al., 2000; Yousof and Aspinwall, 2000, 2001; Arumugam et al., 2008).Further, (Dahlgaard et al., 1998), contended that there is no standard recipe for a good TQM program.
In the second part of this research, the researcher tried to prove the validity of the pre-proposed theoretical model through testing the pre-introduced hypotheses, and as to do so; four main points were taken in consideration and were clarified before proceeding into the steps of the research as follows: • Fifty employees from each of the 5 hotels (a total of 250
employees) were selected with at least 15 years experience in the 5- stars hotels business, those employees whom may be considered as an experts in the field of concern should have spent at least 3 years of their career working at a well known quality- oriented 5- stars hotels, for this reason the total number of employees in the selected five hotels was as big and convergent as possible. (see Walid montasser and Abd Alhakim Almanhawy, IJSER magazine, volume 4, issue 4).
• The distribution of the selected employees (experts) over the managerial structure of each of the five hotels whether vertically (top management, middle managers, front line managers, etc….) or horizontally (head of divisions, head of departments, head of sections, captains and heads of chiefs ,etc….) was considered
• The geographic distribution in selecting the 5 hotels was taking in consideration to benefit from the diverse in age, gender, education and cultural background of the external customers in evaluating the quality of different packages of services offered by the 5 selected hotels.
• Furthermore two crucial values were to be determined , the first was the expected value of quality of service accepted in 5-stars hotels, and through investigating references and institutions concerned of that matter such as the European consumer centre network(ECCN) and the national tourist board for England(NTBE), it was found that it ranges between 85 - 100% or between 4.25 – 5 on Likert scale, the second was the expected acceptable value of the degree of implementation of the selected 10 TQM CSFs in order to achieve the desired quality of service for 5-stars hotels , and through a series of interviews with seven of quality experts especially in the field of concern , it was estimated in average as a range between 87 – 100% or between 4.35 – 5 on Likert scale, therefore the researcher selected the value 4.25 for quality of service and 4.35 for TQM CSFs degree of implementation to be used for the purposes of the research. Finally the research was preceded through 3 steps as
follows. Step 1
In order to test the main hypothesis H1 and its 10 sub- hypotheses H11 to H110, a questionnaire composed of 10 constructs representing the chosen 10 CSF was disseminated over the selected hotels experts (250 questionnaires), as to determine to what degree the 10 TQM CSFs were implemented in the 5 hotels. Step 2:
In order to test the main hypothesis H2 and its 10 sub-hypotheses H21 to H210 it was important to evaluate the quality of service offered by the hotels from the professionals point of view, so the researcher communicated the Egyptian ministry of tourism to obtain this necessary information as appraised by auditing companies hired especially for that matter.
T
2298
IJSER

International Journal of Scientific & Engineering Research Volume 4, Issue 5, May 2013 ISSN 2229-5518
2
Step 3: In order to test the two main hypotheses H3 and H4, a
questionnaire composed of 4 parts was disseminated over a calculated sample size of (380) of hotels customers as will be shown below. -The first part of the questionnaire was used to describe the
demographic characteristic of the customers. -The second part composed of 22 questions to measure the
5 dimensions of quality of service identified by (Parssuraman, 1980) as perceived by the hotels customers. (These 5 dimensions are reliability, assurance, tangibles, empathy and responsiveness).
-The third part composed of 5 questions to measure the degree of customer satisfaction.
-The fourth part composed of another 5 question to measure the degree of customer loyalty.
4-Results: As for step 1:
The internal reliability of each construct of the gathered 250 questionnaire forms with its different number of statements was measured; Cranach’s alpha was calculated for each construct. In this model, 10 construct which are (Leadership, Teamwork, Training and education, HRM practices, Customer focus, Organizational culture, Benchmarking, Communication, Supplier relationship management, Process management ) were focused upon, and the results ranged between ( 0.728 & 0.823 ) which is larger than 0.7 (a level considered “acceptable” in most social science research). - Testing the first main hypothesis H1
The means and standard deviations of the employee’s answers extracted from the gathered 250 questionnaire (see Walid montasser and Abd Alhakim Almanhawy, IJSER magazine, volume 4, issue 4) showed that the perceived mean value of the implemented 10 TQM CSFs was equal to (3.81) which is a moderate value, and that the standard deviation was equal to (0.92), this calculated mean was less than the expected mean value which was estimated before by (4.35) according to Likert scale, so it was clear that there is a gap existence between them.
To conhotel this result the researcher developed a one sample T-test that revealed a significant difference between the perceived value of the implemeted10 TQM critical success factors and of the expected value through calculating (P value=0.00) which was less than (0.05) which meant that the null hypothesis is rejected and the alternative hypothesis is accepted, also by measuring the value of (T calculated= -9.28) it was less than the value of (T tabulated= -1.970).
These results were ensured by measuring the value of (confidence intervals = 3.695; 3.92) which did not include the value of (zero). • From the above results it was clear that the first main
hypothesis H1 is rejected. -Testing the 10 sub-hypotheses H11 to H110
The researcher developed 10 one sample T tests, and the results showed that for all tests (P value= 0.00) which was
less than (0.05), also all the values of (T calculated) which ranges between (-14.82 & - 3.86) were less than (T tabulated=-1.970), these results were ensured by the values of (C.I) that ranges between (3.33& 4.11) which did not include the value of (zero). • From the above results it was clear that the 10 sub-
hypotheses H11 to H110 are rejected. As for step 2
The feedback from the Egyptian ministry of tourism revealed that the 5 selected hotels were audited through the last two months of year 2012, and the service quality offered was evaluated for each of the 5 hotels and it was ( 3.717, 3.621, 3.415, 3.235, 3.170 ) respectively, The results also showed that the perceived mean value of service quality for the whole 5 hotels was equal to (3.43) which is a moderate value, and was less than the expected mean value of service quality which was estimated before by (4.25), so it was clear that there is a gap existence between them. - Testing the second main hypothesis H2
The researcher developed Pearson correlation matrix between the mean value of 10 TQM critical success factors and the mean value of service quality, the results revealed a direct and strongly positive relationship between them, their values ranges between (0.738 & 0.856) and significance with (P value = 0.00), and indicated that as the mean value of the implemented TQM CSFs increases the quality of service increases.
Also, a multiple regressions model was developed between the 10 TQM critical success factors as independent variables and service quality as dependent variable, and the results revealed that the model was significant through a (P value= 0.00) which was less than (0.05), and conhoteled by (F calculated = 6.678 ) which was greater than (F tabulated = 1.870 ), also the effect of the 10 TQM CSFs on the service quality was proved through the P values for the coefficients of the multiple regression which ranges between (0.000 & 0.003) that was less than (0.05), so it was clear that all of the 10 TQM critical success factors have a positive impact on service quality, to ensure the previous results the coefficient of determination was calculated and its value was (r2= 82.35%) and that conhoteled that all of the 10 TQM critical success factors have a strongly positive impact on service quality, • From the above results it was clear that the second
main hypothesis H2 is accepted. - Testing the 10 sub-hypotheses H21 to H210
The researcher developed a 10 simple regression models between the quality of service as dependent variable and each of the 10 TQM CSFs as independent variable, and the results showed that all models proved to be significant through (P value) that ranges between (0.003 & 0.008) which was less than (0.05), and conhoteled by (F calculated) which ranges between (7.358 & 9.256) that were greater than (F tabulated = 3.879), also the coefficients of determination r2 were calculated and it ranges between (33% & 55%), these results meant that each of the 10 TQM CSFs positively affect the service quality.
2299
IJSER
International Journal of Scientific & Engineering Research Volume 4, Issue 5, May 2013 ISSN 2229-5518
3
• So it was clear that the 10 sub- hypotheses H21 to H210 are accepted.
As for step 3: - The internal reliability of each construct of the
questionnaire form with its different number of statements, Cranach’s alpha was calculated for each construct, in this model, 7 constructs which are (Reliability, Assurance, Tangibles, Empathy, Responsiveness, Customer satisfaction, Customer loyalty) were focused on. And the results ranged between (0.752 & 0.821) which were larger than 0.7 (a level considered “acceptable” in most social science research).
- The researcher determined the Sample Size for customers through the following.
First: the size of the sample was determined without taking into account the research population, the researcher found the required sample size n = 385. Second: the size of the sample was determined taking into consideration the size of the community, the researcher found the required sample size n = 373
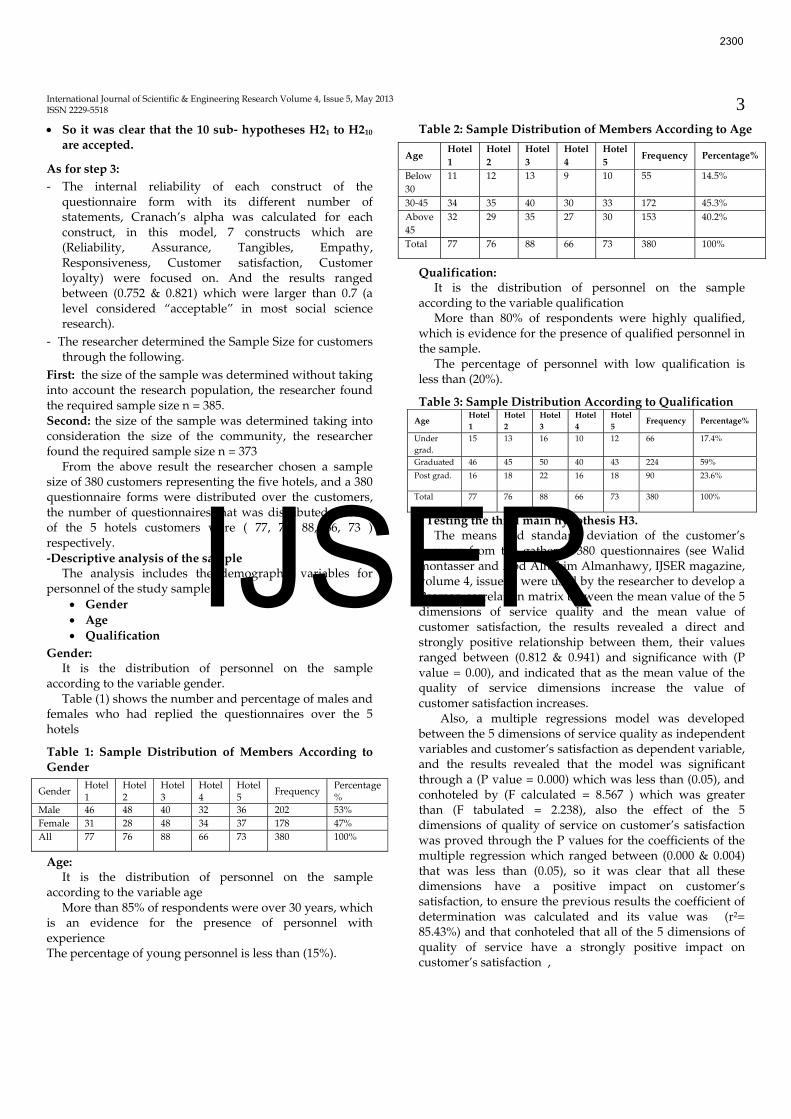
From the above result the researcher chosen a sample size of 380 customers representing the five hotels, and a 380 questionnaire forms were distributed over the customers, the number of questionnaires that was distributed to each of the 5 hotels customers were ( 77, 76, 88, 66, 73 ) respectively. -Descriptive analysis of the sample
The analysis includes the demographic variables for personnel of the study sample:
• Gender • Age • Qualification
Gender: It is the distribution of personnel on the sample
according to the variable gender. Table (1) shows the number and percentage of males and
females who had replied the questionnaires over the 5 hotels
Table 1: Sample Distribution of Members According to Gender
Gender Hotel 1
Hotel 2
Hotel 3
Hotel 4
Hotel 5
Frequency Percentage %
Male 46 48 40 32 36 202 53% Female 31 28 48 34 37 178 47% All 77 76 88 66 73 380 100%
Age: It is the distribution of personnel on the sample
according to the variable age More than 85% of respondents were over 30 years, which
is an evidence for the presence of personnel with experience The percentage of young personnel is less than (15%).
Table 2: Sample Distribution of Members According to Age
Age Hotel 1
Hotel 2
Hotel 3
Hotel 4
Hotel 5
Frequency Percentage%
Below 30
11 12 13 9 10 55 14.5%
30-45 34 35 40 30 33 172 45.3% Above 45
32 29 35 27 30 153 40.2%
Total 77 76 88 66 73 380 100%
Qualification: It is the distribution of personnel on the sample
according to the variable qualification More than 80% of respondents were highly qualified,
which is evidence for the presence of qualified personnel in the sample.
The percentage of personnel with low qualification is less than (20%).
Table 3: Sample Distribution According to Qualification Age
Hotel 1
Hotel 2
Hotel 3
Hotel 4
Hotel 5
Frequency Percentage%
Under grad.
15 13 16 10 12 66 17.4%
Graduated 46 45 50 40 43 224 59%
Post grad. 16 18 22 16 18 90 23.6%
Total 77 76 88 66 73 380 100%
- Testing the third main hypothesis H3. The means and standard deviation of the customer’s
answers from the gathered 380 questionnaires (see Walid montasser and Abd Alhakim Almanhawy, IJSER magazine, volume 4, issue 4) were used by the researcher to develop a Pearson correlation matrix between the mean value of the 5 dimensions of service quality and the mean value of customer satisfaction, the results revealed a direct and strongly positive relationship between them, their values ranged between (0.812 & 0.941) and significance with (P value = 0.00), and indicated that as the mean value of the quality of service dimensions increase the value of customer satisfaction increases.
Also, a multiple regressions model was developed between the 5 dimensions of service quality as independent variables and customer’s satisfaction as dependent variable, and the results revealed that the model was significant through a (P value = 0.000) which was less than (0.05), and conhoteled by (F calculated = 8.567 ) which was greater than (F tabulated = 2.238), also the effect of the 5 dimensions of quality of service on customer’s satisfaction was proved through the P values for the coefficients of the multiple regression which ranged between (0.000 & 0.004) that was less than (0.05), so it was clear that all these dimensions have a positive impact on customer’s satisfaction, to ensure the previous results the coefficient of determination was calculated and its value was (r2= 85.43%) and that conhoteled that all of the 5 dimensions of quality of service have a strongly positive impact on customer’s satisfaction ,
2300
IJSER

International Journal of Scientific & Engineering Research Volume 4, Issue 5, May 2013 ISSN 2229-5518
4
The researcher developed a 5 simple regression models between the customer satisfaction as dependent variable and each of the 5 dimensions of service quality as independent variable, and the results showed that all models proved to be significant through (P value) that ranged between (0.003 & 0.005) which was less than (0.05), and conhoteled by (F calculated) which ranged between (8.235 & 9.654) that were greater than (F tabulated = 3.866), also the coefficients of determination r2 were calculated and it ranged between (30% & 45%), these results meant that each of the dimensions of service quality positively affect customer’s satisfaction.
• From the above results it was clear that the third main hypothesis H3 is accepted.
- Testing the fourth main hypothesis H4 The researcher calculated Pearson correlation between
the mean value of the customer’s loyalty and the mean value of customer’s satisfaction , the result revealed a direct and strongly positive relationship between them, their value equal (0.88) and significance with (P value = 0.00), and indicated that as the mean value of customer satisfaction increases the value of customer loyalty increases.
Also, a simple regression model was developed between customer’s loyalty as dependent variable and customer satisfaction as independent variable, the results revealed that the model was significant through a (P value = 0.000) which was less than (0.05), and conhoteled by (F calculated = 7.123) which was greater than (F tabulated = 3.866), so it was clear that customer’s satisfaction has a positive impact on customer’s loyalty, to ensure the previous result the coefficient of determination was calculated and its value was (r2= 88.67%) and it conhoteled that customer’s satisfaction has a strongly positive impact on customer’s loyalty. • From the above results it was clear that the fourth
main hypothesis H4 is accepted. The above results can be briefly explained, that the low
degree of implementation of the 10 selected TQM CSFs caused a low level of perceived service quality, which in return led to a low levels in both customers satisfaction and loyalty, and this prove that the proposed theoretical model is valid to be used. So as a future work the researcher decided to investigate the causes that led to the shortage in implementation of the selected 10 TQM CSFs, and an improvement plan was to be carried out in coordination with the top managers of one or two of the previously selected 5 hotels, then after the completion of the improvement process, the validity of the proposed theoretical model could be re-tested, using the statistical package for social science (SPSS) approach for hypothesis testing.
2- TQM CSFs Improvement Process Model This section provides the processes of TQM
improvement model in practice. Figure (1) displays the primary processes of TQM improvement model, it is consisting of seven steps. First, in order to have an effective TQM improvement model, commitment of top management for this improvement model is essential. Second, based on top management commitment, a team should be established to guide the TQM improvement
model in the hotel. Third, the training of the selected team is crucial to any required change effort. Fourth, a PDCA cycle should begin. The cycle starts with the problem finding stage, this stage includes collecting and analyzing data, evaluating current TQM practices and quality of service offered, in addition to clarifying improvement objectives, so as to formulate a plan of action intended to improve TQM implementation and service quality. Fifth, once a plan for improvement has been agreed on the next step is the display stage, during which the plan is implemented in practice. This stage may itself involve a mini-PDCA cycle as the problems of implementation are resolved. Sixth, comes to the clear stage. In this stage, the effects of implementing the improvement plan are measured and used to compare with the plan. Seventh, things move to the acknowledge stage, through feedback to top management the change is standardized if it has been successful. Alternatively, if the change has not been successful, the lessons learned from the “trial” are formalized before the cycle starts again. Such information is used by top management and the TQM improvement team in making corrective actions through formulating further improvement plans. Finally, it is essential to restart the PDCA cycle, which is the most important part of implementation. Implementing TQM is like the PDCA cycle – never-ending!
Top management commitment
(Step1)
Formation of a TQM improvement
team (Step2)
Training of TQM improvement team
(Step 3)
Formulate improvement plan
(Step 4)
Taking corrective
actions
Investigate and analyze results
(Step 7)
Implement improvement plan
(Step 5)
Observe and check results
(Step 6)
Feedback
Clear
Display
Acknowledge
Problem finding
Figure 1 TQM Improvement Process
Model
Continuous Improvement
2301
IJSER

International Journal of Scientific & Engineering Research Volume 4, Issue 5, May 2013 ISSN 2229-5518
5
2-1- The Role of Top Management (step 1) Top management commitment is essential in improving
this model implementation; For TQM to be introduced successfully there has to be top management commitment and this is to be demonstrated through active involvement, setting clear goals and a vision for the organization and integrating TQM into the strategic quality planning process. Everything starts with a committed and passionate leader of the business organization, a leader who is really committed to making fundamental changes (Steven Stanton in Watts, 1996; Thiagarajan & Zairi, 1997). Senior managers are actively involved in promoting the importance of quality and customer satisfaction and they devote a substantial part of their time to quality-related issues.
Top management commitment is the most important factor determining the success of TQM implementation and improvement. For TQM to be introduced successfully active involvement is a top management prime responsibility, thus they need to become immersed in it(Zang,Z.H.,2001) Without top management involvement this TQM implementation model cannot be implemented in the first place, and nothing of significance will happen. In addition, four distinctive ways that management can support TQM implementation: allocating budgets and resources; control through visibility, monitoring progress, and planning for change (Motwani, 2001).The management team, especially upper management, will be viewed as being those who are ultimately accountable for the success or failure of the TQM program, and they are responsible! These managers need to be empowered to create their visions, openly discuss them, and link actions and behaviors to the TQM effort (Anjard,1998 ) Furthermore, top management should study this TQM implementation model in order to have a better understanding of these TQM practices and their potential benefits. They should understand that TQM is a long-term and not a short-term intervention. Finally, without a deep understanding of the TQM practices, the most effective TQM improvement plan cannot be developed. 2-2-Formation of TQM improvement team (step 2)
Teamwork is a critical element if TQM to be succeeded (Crosby, 1989).Teamwork promotes a bottom-up trust for quality improvement and delivers synergistic enhancement of quality effort (Thiagarajan & Zairi, 1997).Successful organizations are run with teams-for solving problems, for improving quality, for introducing new processes and products (hoevemeyer, 1993).Quality teams are often interdepartmental, and a quality assurance system makes it difficult for divisions to see themselves as independent operations(Partlow,1993). On the basis of top management commitment, a TQM implementation team should be established. Top management selects team participants either functional or cross functional appropriate to detect problems as to establish improvement objectives, this team should consist of people from the top management team and various functional departments, selection of such a team should reflect a variety of knowledge, experience and
on their potential contributions to TQM implementation(Zang,Z.H.,2001). The main responsibility of the team is to evaluate the hotel’s current TQM practices as well as its offered quality of service, formulate improvement objectives, prioritize these objectives, and transfer them into the improvement plan, also the team should be given the authority to summoned members to contribute specialized knowledge about a certain issue as necessary, and finally supervise the implementation of the improvement plan. Finally it should be noted that the general manager of the hotel holds a complete responsibility over the improvement team, and he should provide a fully support to the team in conducting its implementation work. 2-3- Training of TQM Implementation Team (step 3)
The role of training in TQM implementation and improvement is crucial to any change effort(Taylor & Wilson,1996), The main objective of any training programs is to transfer work-related skills, knowledge, or information to staff in order to improve their performance (Janes, 2003).
Training is also beneficial for both staff and managers. Some organizations find that organizational change, organizational culture, competition, guest demands to improve quality, product expansion, or problems, staff suggestion and technological changes stimulates the need for training. However, there are some barriers to training. They are lack of time, high staff turnover, high business demands, cost, and a lack of training resources (Janes, 2003).
The role of training in TQM implementation is crucial to any change effort (Taylor & Wilson 1996). Introducing new systems such as TQM when people do not have the fundamental skills to work in the new system is a prescription for disaster (Thiagarajan & Zairi , 1997). as training and education prepare team members for greater and effective involvement in the improvement processes, thus they should be provided with the right type of training, and this is ensured by offering an education and training programs, which include both the basics of TQM and set of skills for continues quality improvement(Zang, Z.H., 2001), and as (Goal/QPC research committee,1990) reports training teams should involves how to use the quality techniques (e.g., the seven basic QC tools and the new seven management and planning tools), the team should be able to use team processes (e.g., problem solving steps, breakthrough steps, decision steps). Finally, the team should be able to understand the team dynamics (e.g., listening, participation techniques). 2-4- Formulation of Improvement Plan (step 4) Planning has been defined in many ways. Planning involves formation of a program of action for achieving development objectives, A.waterson defines that planning is, in essence, an organized, conscious and continual attempt to select the best available alternatives to achieve specific goals (Waterson, 1971). Planning is a function of management that involves setting objectives and determining a course of an action for achieving those
2302
IJSER

International Journal of Scientific & Engineering Research Volume 4, Issue 5, May 2013 ISSN 2229-5518
6
objectives (H.Mintzberg, 2004). Planners must establish objectives, which are statements of what needs to be achieved and when. Planners must then identify alternative courses of action for achieving objectives. After evaluating the various alternatives, planners must take decisions about the best courses of actions for achieving objectives. They must then formulate necessary steps and ensure effective implementation of plans. Finally, planners must constantly evaluate the success of their plans and take corrective action when necessary (D.Lamond, 2004). In order to help the hotel to easily identify the weaknesses in its TQM practices implementation, so as to define its improvement objectives, an assessment tool was developed on the basis of the ten TQM implemented practices. The implemented ten CSFs include 84 activities. In each of these, there is specifically addressed area which should be emphasized by the hotel. Thus, it is easy for the hotel to identify its strengths and weaknesses in each of the implemented ten TQM practices, and thus provide an effective and efficient way to identify areas urgently need improvement. This assessment tool can be also used by the TQM implementation team to measure the hotel’s TQM implementation progress over time.
The hotel may develop its own specific measurement system that can better measure employee satisfaction, service quality, customer satisfaction, and customer loyalty as indicators of overall hotel performance, an assessment tool was developed as a measurement system that suits the hotel, and can assist the TQM improvement team in evaluating the hotel’s overall hotel performance. Through such analysis, the team can identify improvement areas, which can be used as a major indicator to test the effects of the ten TQM implementation practices, which are valuable in formulating the hotel’s improvement plan. Then actions can be taken. Improving overall hotel performance is a never-ending process.
Note that the scoring criteria in the two assessment tools provide a fact-based measurement, help the hotel learn the strengths and weaknesses of its current implementation of TQM practices, and help the hotel in identifying improvement possibilities. The strengths and weaknesses of the hotel’s TQM implementation practices and overall business performance are determined by the numeric scores assigned to them.
Through using the assessment tools, the hotel can identify many improvement objectives, top management takes the gathered information from the improvement team and uses them as a basis upon which a short or/and long term improvement plans can be articulated by the hotel, however, the hotels’ resources are limited; it cannot implement all these improvement objectives at the same time. Therefore, it is important for the hotel to formulate an improvement plan that handles only limited critical improvement objectives that are vital to the hotel success.
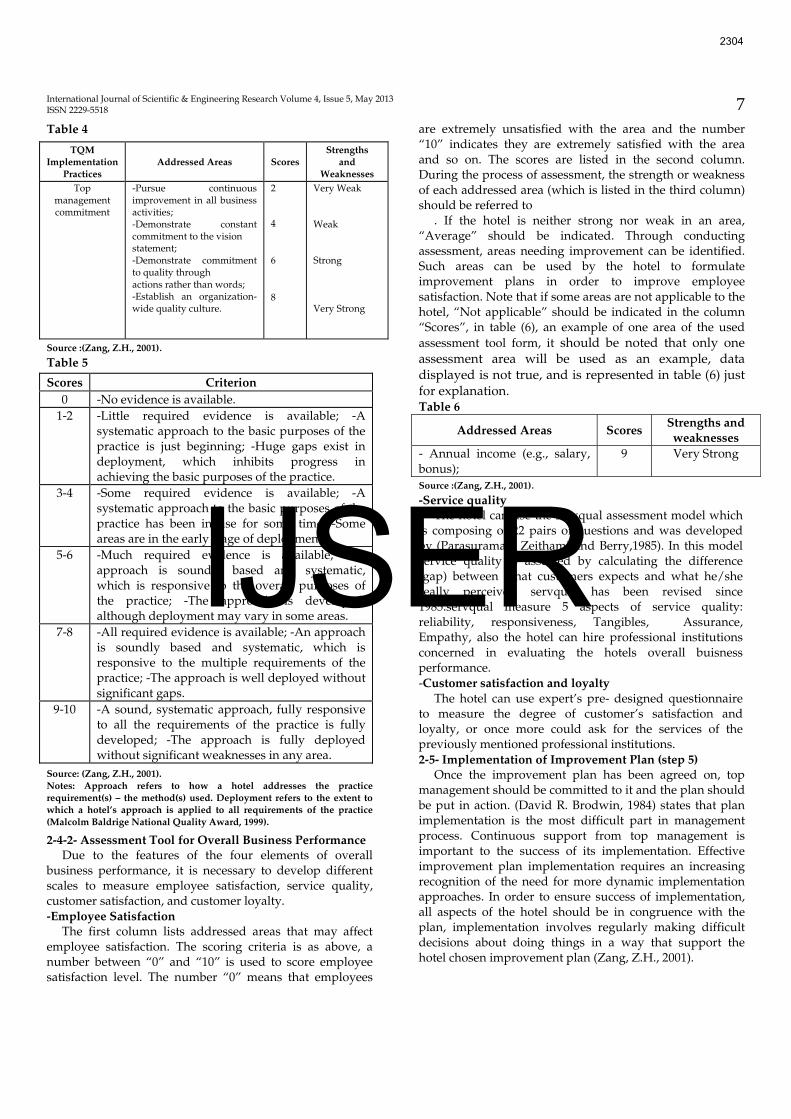
Such an improvement plan should be in consistent with the hotel’s limited resources (e.g., financial resources, human resources, etc…), so they should be cleverly assigned. To determine which improvement objectives to achieve, the hotel should adopt a breakthrough planning techniques; the hotel focuses on the critical areas needed for significant service improvements. The breakthrough plan does not replace the hotel’s strategic plan but supplements it; various conditions (e.g., organizational structure, employee level of education, employee attitude to change, traditional working methods, and overall hotel performance) should be taken into account in making such a plan. Different improvement objectives should be prioritized according to their predicted effects. The evaluation of the overall hotel performance is better to be considered during the process of formulating the improvement plan. Because each specifically addressed area is not equally important in practice-some are more important than the others, the score obtained using the assessment tools can only be used as reference in formulating the plan, not as the only standard for selecting critical improvement objectives. 3-4-1- Assessment Tool for TQM Implementation This assessment tool can be used to assess TQM implementation in a hotel. A sample is shown in table (4), the first column lists the TQM implementation practices. The second column lists the addressed area(s) for each practice. These specifically addressed areas are presented in the form of positive statements. . In order to help the user in rating each TQM implemented practices, scoring guidelines were developed on the basis of the European Model for Total Quality Management (1994) and the American Malcolm Baldrige National Quality Award (1999). Scoring results are listed in the third column. Thus, a user can rate the hotel’s TQM CSFs implementation using a score between “0” and “10”. The number “0” means that the hotel is extremely weak in this practice, the numbers”1”and”2” mean that the hotel is very weak in this practice, numbers”3”and”4” mean weak in a certain practice,”5” means average,”6” and”7”mean strong,”8” and”9” mean very strong, while the number “10” indicates that the hotel is extremely strong in a certain practice. Lower scored practices (e.g., lower than or equal to 5) should be given more attention by the hotel. During the process of assessment, the strengths and weaknesses of addressed areas should be referred to. If the hotel is neither strong nor weak in the identified area, “Average” should be indicated. The strengths and weaknesses are listed in the fourth column. The weak areas of the hotel’s TQM implementation can be used by the hotel to formulate improvement plans. If some TQM implementation practices are not applicable (e.g., the hotel does not have product design activities), “Not applicable” should be indicated in the “Scores” column. It should be noted that only one assessment area will be used as an example, data displayed is not true, and is represented in table (4) just for explanation.
2303
IJSER
International Journal of Scientific & Engineering Research Volume 4, Issue 5, May 2013 ISSN 2229-5518
7
Table 4
Source :(Zang, Z.H., 2001). Table 5
Scores Criterion 0 -No evidence is available.
1-2 -Little required evidence is available; -A systematic approach to the basic purposes of the practice is just beginning; -Huge gaps exist in deployment, which inhibits progress in achieving the basic purposes of the practice.
3-4 -Some required evidence is available; -A systematic approach to the basic purposes of the practice has been in use for some time; -Some areas are in the early stage of deployment.
5-6 -Much required evidence is available; -An approach is soundly based and systematic, which is responsive to the overall purposes of the practice; -The approach is developed, although deployment may vary in some areas.
7-8 -All required evidence is available; -An approach is soundly based and systematic, which is responsive to the multiple requirements of the practice; -The approach is well deployed without significant gaps.
9-10 -A sound, systematic approach, fully responsive to all the requirements of the practice is fully developed; -The approach is fully deployed without significant weaknesses in any area.
Source: (Zang, Z.H., 2001). Notes: Approach refers to how a hotel addresses the practice requirement(s) – the method(s) used. Deployment refers to the extent to which a hotel’s approach is applied to all requirements of the practice (Malcolm Baldrige National Quality Award, 1999).
2-4-2- Assessment Tool for Overall Business Performance Due to the features of the four elements of overall
business performance, it is necessary to develop different scales to measure employee satisfaction, service quality, customer satisfaction, and customer loyalty. -Employee Satisfaction
The first column lists addressed areas that may affect employee satisfaction. The scoring criteria is as above, a number between “0” and “10” is used to score employee satisfaction level. The number “0” means that employees
are extremely unsatisfied with the area and the number “10” indicates they are extremely satisfied with the area and so on. The scores are listed in the second column. During the process of assessment, the strength or weakness of each addressed area (which is listed in the third column) should be referred to
. If the hotel is neither strong nor weak in an area, “Average” should be indicated. Through conducting assessment, areas needing improvement can be identified. Such areas can be used by the hotel to formulate improvement plans in order to improve employee satisfaction. Note that if some areas are not applicable to the hotel, “Not applicable” should be indicated in the column “Scores”, in table (6), an example of one area of the used assessment tool form, it should be noted that only one assessment area will be used as an example, data displayed is not true, and is represented in table (6) just for explanation. Table 6
Addressed Areas Scores Strengths and weaknesses
- Annual income (e.g., salary, bonus);
9 Very Strong
Source :(Zang, Z.H., 2001). -Service quality
The hotel can use the servqual assessment model which is composing of 22 pairs of questions and was developed by (Parasuraman, Zeithami and Berry,1985). In this model service quality is assessed by calculating the difference (gap) between what customers expects and what he/she really perceives, servqual has been revised since 1985.servqual measure 5 aspects of service quality: reliability, responsiveness, Tangibles, Assurance, Empathy, also the hotel can hire professional institutions concerned in evaluating the hotels overall buisness performance. -Customer satisfaction and loyalty
The hotel can use expert’s pre- designed questionnaire to measure the degree of customer’s satisfaction and loyalty, or once more could ask for the services of the previously mentioned professional institutions. 2-5- Implementation of Improvement Plan (step 5)
Once the improvement plan has been agreed on, top management should be committed to it and the plan should be put in action. (David R. Brodwin, 1984) states that plan implementation is the most difficult part in management process. Continuous support from top management is important to the success of its implementation. Effective improvement plan implementation requires an increasing recognition of the need for more dynamic implementation approaches. In order to ensure success of implementation, all aspects of the hotel should be in congruence with the plan, implementation involves regularly making difficult decisions about doing things in a way that support the hotel chosen improvement plan (Zang, Z.H., 2001).
TQM Implementation
Practices Addressed Areas Scores
Strengths and
Weaknesses Top
management commitment
-Pursue continuous improvement in all business activities; -Demonstrate constant commitment to the vision statement; -Demonstrate commitment to quality through actions rather than words; -Establish an organization-wide quality culture.
2
4
6
8
Very Weak Weak Strong Very Strong
2304
IJSER
International Journal of Scientific & Engineering Research Volume 4, Issue 5, May 2013 ISSN 2229-5518
8
2-6- Check of Implementation (step 6) The plan implementation needs to be continually
monitored in order to understand whether things are going according to the plan and causing the expected change (Larry Webber, 2007). If not, corrective actions should be taken to ensure that the improvement plan is effectively implemented; the effects of implementing the improvement plan on overall hotel performance should be checked. The measurement of overall hotel performance can be used for this. It is meaningless to implement the improvement plan if the overall hotel performance cannot be improved (Zang, Z.H., 2001) 2-7- Analysis of Implementation Results (step 7)
After the implementation of TQM practices is checked, the hotel can obtain a great deal of information about the implemented ten TQM CSFs and its effects on overall hotel performance, it is essential to analyze the gathered results from the Clear stage. Acknowledge what you discovered, and conduct positive changes throughout the process, (Michael Wallace, 2007) states that changes required should be identified to make what you have learned part of you process, and plan ongoing monitoring of the solution to make sure it does not cause new problems, after you solve the problem and improve the process, start over again to plan the solution to next problem in a never ending improvement cycle, 2-8- Feedback and taking corrective actions
Feedback is important because planning is in the first place a decision making process. For so, decision making is not completed when an executive or board of directors votes yes or no. Feedback provides decision makers with information that participate a new decision cycle. The decision may fail, thus generating a new analysis of problems, an evaluation of alternatives, and a selection of a new alternative, many problems are solved by trying several alternatives in sequence, each providing modest improvement. Feedback is the part of monitoring that assesses whether a new decision is to be made (Richard L .Daft, 2007).
3-Case study description To fulfill the requirements of the study, two main points
should be clarified before proceeding into the steps of the research as follows:
• This part of the research was conducted in hotel no. 3, information’s about this hotel location and statistics is presented in the second part of the research (see Walid montasser and Abd Alhakim Almanhawy, IJSER magazine, volume 4, issue 4).
• The assessment tool forms stated above were distributed on the hotels head of divisions and departments, a total of 31 forms, these forms were gathered and their analysis are represented in table (9). Finally, the steps of the TQM practices improvement process model presented in figure (1) were conducted as follows.
• The first step in improvement process of the TQM CSFs implementation model was top management commitment. With the commitment from top
management, the researcher easily obtained enough information for the purposes of the research, as well as the contribution of many employees whose inputs were useful in running this part of the research. It should be noted, that top management commitment was pivotal in achieving this research.
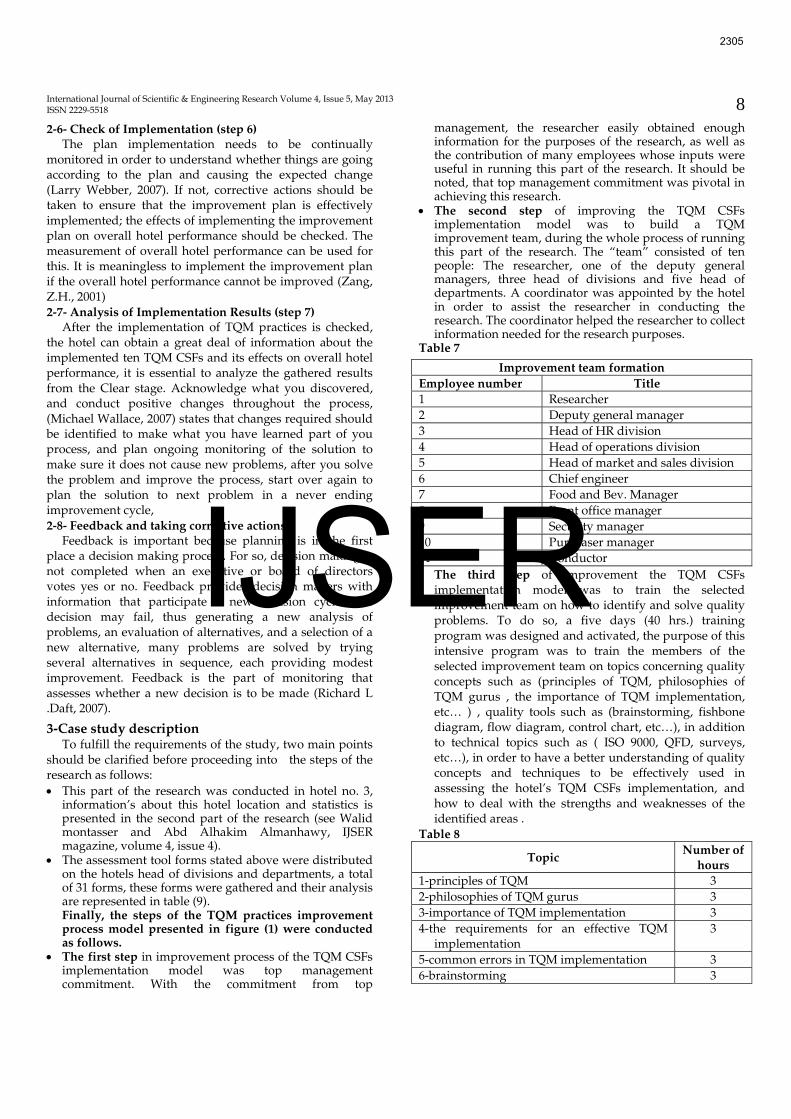
• The second step of improving the TQM CSFs implementation model was to build a TQM improvement team, during the whole process of running this part of the research. The “team” consisted of ten people: The researcher, one of the deputy general managers, three head of divisions and five head of departments. A coordinator was appointed by the hotel in order to assist the researcher in conducting the research. The coordinator helped the researcher to collect information needed for the research purposes.
Table 7
Improvement team formation Employee number Title 1 Researcher 2 Deputy general manager 3 Head of HR division 4 Head of operations division 5 Head of market and sales division 6 Chief engineer 7 Food and Bev. Manager 8 Front office manager 9 Security manager 10 Purchaser manager 11 Conductor • The third step of improvement the TQM CSFs
implementation model was to train the selected improvement team on how to identify and solve quality problems. To do so, a five days (40 hrs.) training program was designed and activated, the purpose of this intensive program was to train the members of the selected improvement team on topics concerning quality concepts such as (principles of TQM, philosophies of TQM gurus , the importance of TQM implementation, etc… ) , quality tools such as (brainstorming, fishbone diagram, flow diagram, control chart, etc…), in addition to technical topics such as ( ISO 9000, QFD, surveys, etc…), in order to have a better understanding of quality concepts and techniques to be effectively used in assessing the hotel’s TQM CSFs implementation, and how to deal with the strengths and weaknesses of the identified areas .
Table 8
Topic Number of
hours 1-principles of TQM 3 2-philosophies of TQM gurus 3 3-importance of TQM implementation 3 4-the requirements for an effective TQM
implementation 3
5-common errors in TQM implementation 3 6-brainstorming 3
2305
IJSER

International Journal of Scientific & Engineering Research Volume 4, Issue 5, May 2013 ISSN 2229-5518
9
7-cause and effect diagram 3 8-flow diagram 2 9-tree diagram 2 10-pareto chart 2 11-control chart 3 12-ISO 9000 3 13-QFD 3 14-FMEA 2 15-survays and focus group 2 Total 40 hours
• The fourth step was to formulate an improvement plan that could be implemented by the hotel to improve its TQM implementation and overall business performance. This plan was formulated on the basis of the weaknesses of the hotel’s TQM practices implementation. Through evaluation of the implemented TQM CSFs, using the introduced assessment tools many weaknesses were identified as shown in table below, and further categorized in terms of two improvement possibilities: Long term improvement possibilities and short term improvement possibilities, because of time limitations Only short term improvement possibilities were used in determining the improvement objectives and in formulating the improvement plan. The hotel’s available resources were taken into account in formulating the improvement plan. In order to make the plan practical, a time schedule was designed, and the departments responsible in implementing the plan were determined. Furthermore, the improvement team was asked to be involved in formulating an improvement plan that suit the hotel. Finally, this improvement plan was accepted by the hotel top management. Finally it should be noted that for the sake of this part of the research only the activities of the implemented 10 TQM CSFs model was assessed to identify the weak areas that need improvement, but as for the hotel overall business performance, the assessment process will be conducted through the hypotheses re-testing later on, also because of text limitation and for the purposes of this study, only the weakness areas are presented in the following table.
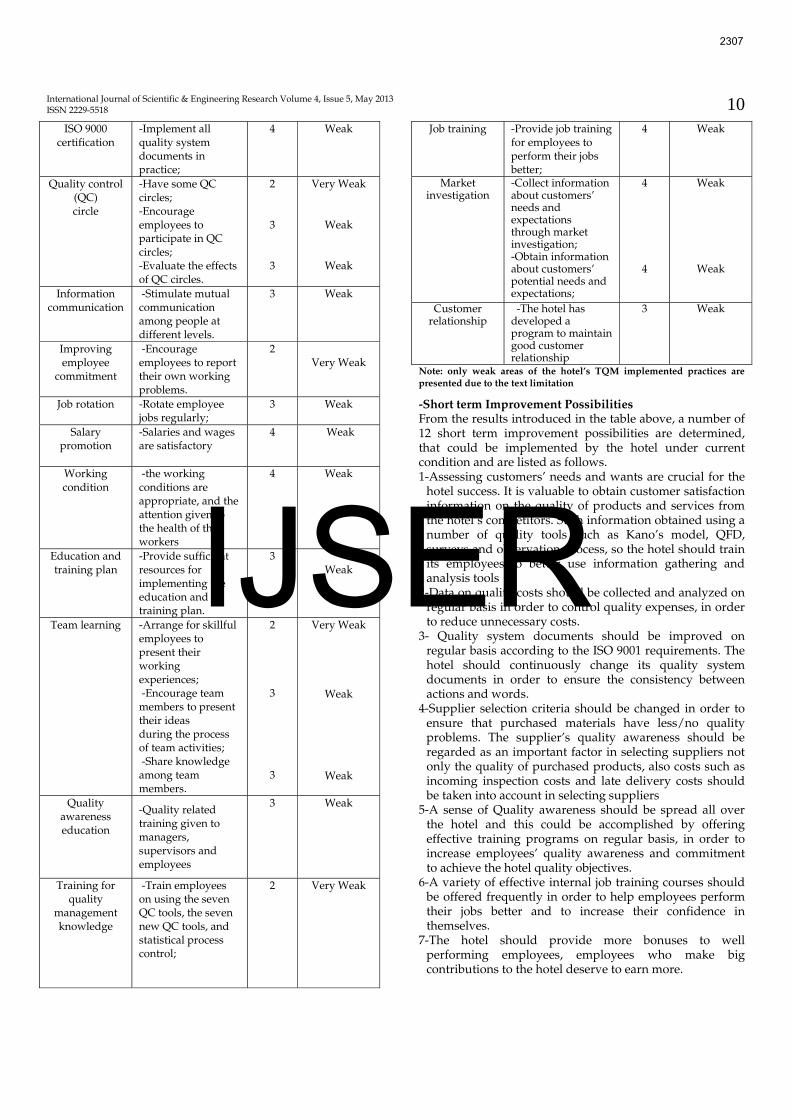
Table 9: assessment of TQM CSFs implementation
TQM Practices
Addressed Areas Scores Strengths
and Weaknesses
Top management commitment
-Communicate the company’s policy, and values to the customers, employees, suppliers
3 Weak
Pursuit of long-term business success
-Senior executives actively develop one integrated quality plan to meet business objectives.
2 Very Weak
Partnership with
suppliers
-Work together with suppliers for mutual benefits; -The hotel involves the suppliers in the service development process.
2
3
Very Weak
Weak
Supplier selection criteria
-Reliance on reasonably few dependable suppliers who are evaluated and selected based on their capability and commitment to service quality, and value for money
3 Weak
Vision statement
-Have a long-term vision statement;
2 Very Weak
Overall business
performance plan
-Have a long-term overall business performance plan;
2 Very Weak
Quality improvement
plan
-Implement the quality improvement plan in practice.
2 Very Weak
Evaluation of overall business
performance
-Have data on employee satisfaction and evaluate employee satisfaction;
4 Weak
Benchmarking -The hotel carries out informal benchmarking to identify best practices for identify best practices for improvements and opportunities.
2 Very Weak
Quality costs -Hotel has an accurate and efficient database that provides information on its quality costs
4 Weak
Information system
-Have a computer-based integrated information system;
4 Weak
Process capability
-Control and improve process capability;
2 Very Weak
Inspection -Inspection, review,
and checking the process implement continuously.
4 Weak
Use of quality tools
-Use the seven QC tools extensively; -Use the seven new QC tools extensively;
3
3
Weak
Weak
2306
IJSER
International Journal of Scientific & Engineering Research Volume 4, Issue 5, May 2013 ISSN 2229-5518
10
ISO 9000 certification
-Implement all quality system documents in practice;
4 Weak
Quality control (QC) circle
-Have some QC circles; -Encourage employees to participate in QC circles; -Evaluate the effects of QC circles.
2
3
3
Very Weak
Weak
Weak
Information communication
-Stimulate mutual communication among people at different levels.
3 Weak
Improving employee
commitment
-Encourage employees to report their own working problems.
2 Very Weak
Job rotation -Rotate employee jobs regularly;
3 Weak
Salary promotion
-Salaries and wages are satisfactory
4 Weak
Working condition
-the working conditions are appropriate, and the attention given to the health of the workers
4 Weak
Education and training plan
-Provide sufficient resources for implementing the education and training plan.
3 Weak
Team learning -Arrange for skillful employees to present their working experiences; -Encourage team members to present their ideas during the process of team activities; -Share knowledge among team members.
2
3
3
Very Weak
Weak
Weak
Quality awareness education
-Quality related training given to managers, supervisors and employees
3 Weak
Training for quality
management knowledge
-Train employees on using the seven QC tools, the seven new QC tools, and statistical process control;
2 Very Weak
Job training -Provide job training for employees to perform their jobs better;
4 Weak
Market investigation
-Collect information about customers’ needs and expectations through market investigation; -Obtain information about customers’ potential needs and expectations;
4
4
Weak
Weak
Customer relationship
-The hotel has developed a program to maintain good customer relationship
3 Weak
Note: only weak areas of the hotel’s TQM implemented practices are presented due to the text limitation
-Short term Improvement Possibilities From the results introduced in the table above, a number of 12 short term improvement possibilities are determined, that could be implemented by the hotel under current condition and are listed as follows. 1-Assessing customers’ needs and wants are crucial for the
hotel success. It is valuable to obtain customer satisfaction information on the quality of products and services from the hotel’s competitors. Such information obtained using a number of quality tools such as Kano’s model, QFD, surveys and observation process, so the hotel should train its employees to better use information gathering and analysis tools
2-Data on quality costs should be collected and analyzed on regular basis in order to control quality expenses, in order to reduce unnecessary costs.
3- Quality system documents should be improved on regular basis according to the ISO 9001 requirements. The hotel should continuously change its quality system documents in order to ensure the consistency between actions and words.
4-Supplier selection criteria should be changed in order to ensure that purchased materials have less/no quality problems. The supplier’s quality awareness should be regarded as an important factor in selecting suppliers not only the quality of purchased products, also costs such as incoming inspection costs and late delivery costs should be taken into account in selecting suppliers
5-A sense of Quality awareness should be spread all over the hotel and this could be accomplished by offering effective training programs on regular basis, in order to increase employees’ quality awareness and commitment to achieve the hotel quality objectives.
6-A variety of effective internal job training courses should be offered frequently in order to help employees perform their jobs better and to increase their confidence in themselves.
7-The hotel should provide more bonuses to well performing employees, employees who make big contributions to the hotel deserve to earn more.
2307
IJSER

International Journal of Scientific & Engineering Research Volume 4, Issue 5, May 2013 ISSN 2229-5518
11
8-An effective benchmarking process should be carried on in order to understand competitors’ products, and in improving the hotel service quality to achieve its goals in gaining its customers trust and loyalty, the hotel should train a specific team to know how to use different tools in detecting and selecting the best practice in the field of concern.
9-Employees should be encouraged to voluntary train on using a variety of QC tools in achieving their hotel quality objectives. QC tools should be used extensively in detecting and solving service quality problems.
10-Team learning should be further improved by arranging a variety of training methods which includes orientation training, classroom training, self-directed training, and computer- based training, skillful employees could be asked to report their working experiences in an arranged lectures, job rotation is a good and effective idea to train team members to present their good ideas, extrinsic motivation is essential to encourage members of the team to perform better and to share their gained knowledge and experience with other hotel employees.
11-The level of Employee satisfaction should be measured on regular basis. Such information should be frequently used by the hotel to continuously improve its employee level of satisfaction.
12-Communication between individuals at all levels should be encouraged through the stimulation of a culture that encourages an environment of open communication in the hotel, education courses could play an effective role in achieving this object. These short term possibilities were then transferred
into three training programs. Thus, the formulated improvement plan is composed of three training programs which are: Employee training program, analysis of quality costs training program, proper supplier selection process training program. The first two programs will start at the same time; the other one will start one month later, Figure 2 displays the time dimension, while the major responsible departments involved in implementing this improvement plan are represented in milestones tables below, which was formulated on a monthly basis.
Figure 2
Employee training (Program 1) • This program consists of five activities: Quality
awareness education, internal job training, team learning, information gathering and analysis training and benchmarking tools training, which are explained as follows:
First, quality awareness education should be carried on in order to improve employees’ quality awareness and performance. It can be expected that employee’s performance will be improved, and in return fewer quality problems will occur. It will be more effective to use practices and experiments to teach employees rather than only depend on theories. Finally, the effects of quality awareness education should be regularly monitored in order to continually improve the effectiveness of this practice. Second, a variety of internal job training courses should be conducted to improve employees’ skills and morals. Skilled employees can be asked to give training lectures. Thus, training costs could be extremely reduced. External job training should go along hand by hand with internal job training. If qualified lecturers cannot be found within the hotel in some cases, external trainers should be invited to give training lectures. Before conducting internal job training, it is essential to understand employees’ skill levels, so the training program can be effective and give back the desired impact. Third, team learning effectiveness will be further improved by encouraging skillful employees to report their knowledge gained through their working experiences, in addition rewarding of team members financially and morally is a good idea to help team members to share their knowledge and experiences with their colleagues. Fourth, training courses should be introduced to team members as to teach them how to gather and analyze information’s using a variety of different tools for information gathering such as books, magazines, internet, surveys, data sheets, employees logs, databases, newspapers, focus group…etc., and for information analysis such as brainstorming, tree diagram, statistical charts…etc., in order to increase abilities, knowledge and improve performance of the hotel employees. Fifth, team members should be taught how to effectively use the proper tools in benchmarking the hotel various departments and practices with the first in class, as to select the best practice in the field of concern, to help the hotel in achieving the hotel financial and marketing goals and objectives. Benchmarking tools include for example qualitative research, process mapping, cycle time analysis, graphs, SWOT analysis, etc…, To ensure the success of Program 1, two departments (HR and quality) are mainly responsible for its implementation. Other departments or workshops should cooperate with these two major responsible departments. The HR department is in charge of making the detailed time plan for running this program and articulate incentives to encourage team members to share their knowledge with their colleagues. The quality department is responsible for selecting suitable personnel to give training lectures or present their working experiences.
Employee training Program (1)
Analysis of quality costs Training Program (2)
Feb. Mar. Apr.
Programs
Months
Supplier selection Training Program (3)
May.
2308
IJSER

International Journal of Scientific & Engineering Research Volume 4, Issue 5, May 2013 ISSN 2229-5518
12
Table 10: Employees training Milestones Program 1 Start Date End Date Department
Quality awareness education
1/2/2013 18/2/2013 HR Quality
Internal job training 19/2/2013 8/3/2013 HR Quality
Team learning 9/3/2013 27/3/2013 HR Quality
Information gathering and
analysis training
28/3/2013 15/4/2013
HR Quality
Benchmarking tools training
16/4/2013 1/5/2013 HR Quality
Analysis of Quality Costs training (Program 2) • Data related to quality costs should be collected and
analyzed; there are four categories of quality-related costs: Internal failure, external failure, appraisal, and prevention, different reasons leading to quality costs can be identified. In order to analyze data efficiently, Pareto analysis, cause-and-effect diagram, histogram, cost indexes and flow charts could be used. It should be noted that of quality costs are considered the primary reason for formulating an improvement action. To ensure the success of this program, the departments of quality and finance are mainly responsible for implementing this program.
Table 11: Analysis of quality costs Milestones Program 2 Start Date End Date Department
Training on internal failure appraisal
1/2/2013 1/3/2013 Quality Finance
Training on external failure appraisal
2/3/2013 1/4/2013 Quality Finance
Proper Supplier Selection training (Program 3) • Supplier selection should be based on the supplier
quality awareness not just on total costs. From the analysis of quality costs (Program 2), the amount of quality costs caused by poor purchased products can be identified. This information can be used in optimizing supplier selection by balancing between quality and price. But this is not enough the hotel should concentrate on its supplier quality awareness, a long term relationship that upgrade quality concepts should be established on basis of mutual benefit, to do so; the hotel should train its employees to how to assess and improve its supplier’s quality awareness so it can help in selecting suitable suppliers, as it will take some time to assess supplier’s quality awareness in addition to the collection and analyzing of quality costs. Therefore, the program of supplier selection will start one month later than that of analysis of quality costs, To ensure the success of this program, the departments of quality, purchasing and HR are mainly responsible for implementing this program.
Table 12: Proper supplier selection Milestone Program 3 Start Date End Date Department Appraising quality costs related to supplying process
2/4/2013 15/4/2013 Quality Purchasing
Training on proper supplier selection
16/4/2013 1/5/2013 Quality Purchasing
HR
• The fifth step, according to the TQM improvement process presented in figure (1), there are another three steps representing the process implementation stage, the action plan is activated, and the researcher along with the previously selected improvement team will contribute in conducting the implementation stage in coordination with the departments in charge, after this stage is completed the degree of success achieved through implementing the formulated improvement plan will be evaluated.
4- Conclusion
Based on the evaluation, the strengths and weaknesses of the hotel’s implemented TQM CSFs were identified. The weaknesses of the hotel’s TQM implementation provided opportunities for the hotel to improve its TQM implementation. Based on these weaknesses, the hotel’s targeted improvement areas of the implemented TQM practices, and regarding the hotel’s available resources, an improvement plan was formulated. The hotel’s deputy general manager agreed that the hotel would implement this improvement plan in practice, and the implementation stage has already begun and it should lasts at the first of May, so after the completion of the implementation stage, as a future work, the assessment tool will be re-used to evaluate the results of the improvement process, this evaluation will be used to re-test as to ensure the validity of the theoretical model that was proposed in the first part of this research.
5-Refrences • Adam, E.E., Jr. (1994), Alternative quality improvement
practices and organization performance, Journal of Operations Management, Vol. 12, pp. 27-44.
• Adler, N.J. (1983), A typology of management studies involving culture, Journal of International Business Studies, Vol. 14 No. 2, pp. 29-47.
• Ahire, S.L., Golhar, D.Y. and Waller, M.A. (1996), Development and validation of TQM implementation constructs, Decision Sciences, Vol. 27 No. 1, pp. 23-56.
• American Quality Foundation and Ernst & Young (1991), International Quality Study: The Definitive Study of the Best International Quality Management Practices, Ernst & Young, Cleveland, OH.
• Anderson, E. W., Fornell, C. and Lehmann, D.R. (1994), Customer satisfaction, market share, and profitability: Findings from Sweden, Journal of Marketing, Vol. 58, July, pp. 53-56.
• Aravindan, P., Devadasan, S.R. and Selladurai, V., (1996), A focused system model for strategic quality
2309
IJSER

International Journal of Scientific & Engineering Research Volume 4, Issue 5, May 2013 ISSN 2229-5518
13
management, International Journal of Quality & Reliability Management, Vol. 13 No. 8, pp. 79-96.
• Black, S.A. and Porter, L.J. (1996), Identification of the critical factors of TQM, Decision Sciences, Vol. 27 No. 1, pp. 1-21. .
• Blauw, J.N. and During, W.E. (1990), Total quality control in Dutch industry, Quality Progress, Vol. 23 No. 2, February, pp. 50-52.
• Byrne, B.M. (1998), Structural Equation Modeling With LISREL, PRELIS, and SIMPLIS, Basic Concepts, Applications, and Programming, Lawrence Erlbaum Associates, Inc., Mahwah, New Jersey.
• Cole, R.E. (1992), The quality revolution, Production and Operations Management, Vol. 1 No. 1, pp. 118-20.
• Daetz, D., Barnard, B. and Norman, R. (1995), Customer integration: The quality function deployment (QFD) leader’s guide for decision making, John Wiley & Sons, Inc., New York.
• Dale, B.G. (1999), Managing Quality, Third edition, Blackwell Publisher Inc., Oxford, UK.
• Dean, J.W., Jr. and Bowen, D.E. (1994), Management theory and total quality: Improving research and practice through theory development, Academy of Management Review, Vol. 19 No. 3, pp. 392-418.
• Easton, G. (1993), The 1993 state of U.S. total quality management: A Baldrige examiner’s perspective, California Management Review, Vol. 35 No. 3, pp. 32-54.
• Feigenbaum, A.V. (1991), Total Quality Control, Third edition, McGraw-Hill, Inc., New York.
• Finlay, W. and Marin, J.K. (1995), Organizational structure and job satisfaction, Administration and Society, Vol. 27 No. 3, pp. 427-451.
• Flynn, B.B., Schroeder, R.G. and Sakakibara, S. (1994), A framework for quality management research and an associated measurement instrument, Journal of Operations Management, Vol. 11, pp. 339-366.
• Garvin, D.A. (1986), Quality problems, policies and attitudes in the United States and Japan: An exploratory study, Academy of Management Journal, Vol. 29, pp. 653-673.
• Ghobadian, A. and Woo, H.S. (1996), Characteristics, benefits and shortcomings of four major quality awards, International Journal of Quality & Reliability Management, Vol. 13 No. 2, pp. 10-44.
• Ginder, D.A. (1990), The engineer and TQM, Automotive Engineering, October, pp.18-19.
• Green, K. (1990), The uphill climb toward quality, The China Business Review, May-June, pp. 10-13.
• Hackman, J.R. and Oldham, G.R. (1975), Development of the job diagnostic survey, Journal of Applied Psychology, Vol. 60, pp. 159-170.
• Hendricks, K.B. and Singhal, V.R. (1996), Quality awards and the market value of the hotel: An empirical investigation, Management Science, Vol. 42 No. 3, pp. 415-436.
• Imai, M. (1986), Kaizen - The Key to Japan’s Competitive Success, First edition, Random House Business Division, New York.
• Ishikawa, K. (1985), What is Total Quality Control? The Japanese Way, Prentice-Hall, London.
• Jenner, R.A., Hebert, L., Appell, A. and Baack, J. (1998), Using quality management for cultural transformation of Chinese state enterprises: A case study, Journal of Quality Management, Vol. 3 No. 2, pp.193-210.
• Juran, J.M. (1994), The upcoming century of quality, Quality Progress, Vol. 27 No. 8, August, pp. 29-37.
• Juran, J.M. and Gryna, F.M. (1993), Quality Planning and Analysis, Third edition, McGraw-Hill, Inc., New York.
• Kanji, G.K. and Asher, M. (1996), 100 Methods for Total Quality Management, SAGE Publications, London.
• Kano, N. (1993), A perspective on quality activities in American hotels, California Management Review, Vol. 35 No. 3, pp. 12-31.
• Kassicieh, S.K. and Yourstone, S.A. (1998), Training, performance evaluation, rewards, and TQM implementation success, Journal of Quality Management, Vol. 3 No. 1, pp.
• 25-38. • Kolarik, W.J. (1995), Creating Quality: Concepts,
Systems, Strategies, and Tools, McGraw-Hill, Inc., New York.
• Lam, S.S.K. (1995), Quality management and job satisfaction: An empirical study, International Journal of Quality & Reliability Management, Vol. 12 No. 4, pp. 72-78.
• Lau, R.S.M. and Anderson, C.A., (1998), A three-dimensional perspective of total quality management, International Journal of Quality & Reliability Management, Vol. 15 No. 1, pp. 85-98.
• Lee, H., Kwak, W. and Han, I. (1995), Developing a business performance evaluation system: An analytic hierarchical model, The Engineering Economist, Vol. 40 No. 4, pp. 343-357.
• Longenecker, C.O. and Scazzero, J.A. (1993), Total quality management from theory to practice: A case study, International Journal of Quality & Reliability Management, Vol. 10 No. 5, pp. 24-31.
• Malcolm Baldrige National Quality Award (1999), Criteria for Performance Excellence, National Institute of Standards and Technology, United States Department of Commerce, Gaithersburg, MD.
• Mann, R.S. (1992), The Development of a Framework to Assist in the Implementation of TQM, PhD thesis, Department of Industrial Studies, University of Liverpool, UK.
• Mann, R. and Kehoe, D. (1994), An evaluation of the effects of quality improvement activities on business performance, International Journal of Quality & Reliability Management, Vol. 11 No. 4, pp. 29-44.
2310
IJSER

International Journal of Scientific & Engineering Research Volume 4, Issue 5, May 2013 ISSN 2229-5518
14
• Mirams, M., McElheron, P. (1995), Gaining and Maintaining the New Quality Standard, FT Pitman Publishing, London.
• Mizuno, S. (1979), Management for quality improvement, The seven new QC tools, Productivity Press, Cambridge, MA.
• Motwani, J., Kumar, A. and Cheng, C.H. (1996), A roadmap to implementing ISO 9000, International Journal of Quality & Reliability Management, Vol. 13 No. 1, pp. 72-83.
• Ollila, A. and Malmipuro, M. (1999), Maintenance has a role in quality, TQM Magazine, Vol. 11 No. 1, pp. 17-21.
• Patton, M.Q. (1990), Qualitative Evaluation and Research Methods, Second edition, Sage Publications, Newbury Park, London.
• Phillips, L.W., Chang, D.R. and Buzzell, R.D. (1983), Product quality, cost position, and business performance: A test of some key hypotheses, Journal Marketing, Vol. 46, pp. 26-43.
• Powell, T.C. (1995), Total quality management as competitive advantage: A review and empirical study, Strategic Management Journal, Vol. 16, pp. 15-37.
• Punch, K.F. (2000), Developing Effective Research Proposals, SAGE Publications, London.
• Randall, R.C. (1995), Randall’s Practical Guide to ISO 9000: Implementation, Registration, and Beyond, Addison-Wesley Publish Company, Reading, MA.
• Reed, R., Lemak, D.J. and Montgomery, J.C. (1996), Beyond process: TQM content and hotel performance, Academy of Management Review, Vol. 21 No. 1, pp. 173-202.
• Reeves, V.A. and Bednar, D.A. (1994), Defining quality: Alternatives and implications, Academy of Management Review, Vol. 19 No. 3, pp. 419-445.
• Robson, M. (1992), Quality Circles: A Practical Guide, Second edition, Gower, Hants, England.
• Ross, J.E. (1993), Total Quality Management, St. Lucie Press, Delray Beach, FL.
• Rust, R.T. and Zahorik, A.J. (1993), Customer satisfaction, customer retention, and market share, Journal of Retailing, Vol. 69 No. 2, pp. 193-215.
• Schwab, D. (1973), The motivational impact of a compensation system on employee performance, Organizational Behavior and Human Performance, Vol. 9, pp. 215225.
• Spector, P.E. (1985), Measurement of human service staff satisfaction: Development of the Job Satisfaction Survey, American Journal of Community Psychology, Vol. 13, pp. 693-713.
• Tornow, W.W. and Wiley, J.W. (1991), Service quality and management practices: A look at employee attitudes, customer satisfaction, and bottom-line consequences, Human Resource Planning, Vol. 14, pp. 105-115.
• Turban, E., McLean, E. and Wetherbe, J. (1999), Information Technology for Management, Second
edition, John Wiley & Sons, Inc., New York. United States General Accounting Office (1991), Management Practices: US Companies Improve Performance Through Quality Efforts, U.S. General Accounting Office, Gaithersburg, MD.
• Voss, C., Blackmon, K. (1995), TQM and ISO 9000 as quality management tools: Empirical evidence from the UK, paper submitted to Management Science.
• Vuppalapati, K., Ahire, S.L. and Gupta, T. (1995), JIT and TQM: A case for joint implementation, International Journal of Operations & Production Management, Vol. 15 No. 5, pp. 84-94.
• Waldman, D.A. (1994), The contribution of total quality management to a theory of work performance, Academy of Management Review, Vol. 19 No.3, pp. 510-536.
• Montasser,W. and Manhawy. (2013),TQM critical success factors in hospitality Industry and their impact on Customer Loyalty, a theoretical Model, International journal of scientific and engineering research magazine. Vol. 4 Issue 2.
• Montasser,W. and Manhawy. (2013),Testing the Validity of the Theoretical Model for TQM CSFs in hospitality Industry and their impact on Customer Loyalty, International journal of scientific and engineering research magazine. Vol. 4 Issue 4.
• Weiss, D.J., Dawis, R.V., England, G.W. and Lofquis, L.H. (1967), Manual for the Minnesota Satisfaction Questionnaire (Minnesota Studies in Vocational Rehabilitation, No. 22), University of Minnesota, Minneapolis.
• Wollner, G.E. (1992), The law of producing quality, Quality Progress, Vol. 25 No. 1, January, pp. 35-40.
• Wruck, K.H. and Jensen, M.C. (1994), Science, specific knowledge, and total quality management, Journal of Accounting and Economics, Vol. 18, pp. 247-287.
• Xu, B. (1999), Debt-to-equity plan unveiled, China Daily, August 4.
• Yin, R.K. (1989), Case Study Research: Design and Methods, Revised edition, Sage Publications, London.
• Yu, C.S., Cochran, D.S. and Spencer, B. (1998), Quality management practices in China, Quality Management Journal, Vol. 5, No. 2, pp. 91-106.
• Zairi, M., Letza, S.R. and Oakland, J.S. (1994), Does TQM impact on bottom-line results? TQM Magazine, Vol. 6, pp. 38-43.
• Zhang, Z.H. (2001), developing a TQM quality management method model, SOM Research Report, 970A48, University of Groningen, The Netherlands.
2311
IJSER