part e financial information - wced
TRANSCRIPT

185Annual Report 2019/2020
Annual Report for 2019/20 Financial YearVote 5: Department of Education
Province of the Western Cape
Part EFinancial Information

187Annual Report 2019/2020
Annual Report for 2019/20 Financial YearVote 5: Department of Education
Province of the Western Cape
Report of the auditor-general to the Western Cape Provincial Parliament on vote no. 5: Western Cape Education Department
Report on the audit of the financial statements
Opinion
�! I have audited the financial statements of the Western Cape Education Department(WCED), set out on pages 195 to 2��, which comprise the appropriation statement,statement of financial position as at 31 March 2020, statement of financial performance,statement of changes in net assets and cash flow statement for the year then ended, aswell as the notes to the financial statements, including a summary of significantaccounting policies.
�! In my opinion, the financial statements present fairly, in all material respects, the financialposition of the WCED as at 31 March 2020, and its financial performance and cash flowsfor the year then ended in accordance with the Modified Cash Standard (MCS)prescribed by the National Treasury and the requirements of the Public FinanceManagement Act of South Africa, 1999 (Act No. 1 of 1999) (PFMA) and the Division ofRevenue Act of South Africa, 2019 (Act No.16 of 2019) (Dora).
Basis for opinion
3. I conducted my audit in accordance with the International Standards on Auditing (ISAs).My responsibilities under those standards are further described in the auditor-general’sresponsibilities for the audit of the financial statements section of this auditor’s report.
4. I am independent of the department in accordance with sections 290 and 291 of theCode of ethics for professional accountants and parts 1 and 3 of the International Codeof Ethics for Professional Accountants (including International Independence Standards)of the International Ethics Standards Board for Accountants (IESBA codes), as well as theethical requirements that are relevant to my audit in South Africa. I have fulfilled my otherethical responsibilities in accordance with these requirements and the IESBA codes.
5. I believe that the audit evidence I have obtained is sufficient and appropriate to providea basis for my opinion.
Emphasis of matters
6. I draw attention to the matters below. My opinion is not modified in respect of thesematters

188 Annual Report 2019/2020
Annual Report for 2019/20 Financial YearVote 5: Department of EducationProvince of the Western Cape
� Restatement of corresponding figures 7. As disclosed in note 31 to the financial statements, the corresponding figures for 31 March
2019 were restated as a result of errors in the financial statements of the department at, and for the year ended, 31 March 2020.
Non-adjusting events after the reporting date 8. I draw attention to note 27 in the financial statements, which deals with subsequent
events and specifically the possible effects of the future implications of Covid-19 on the department’s future prospects, performance and cash flow. Management has assessed the impact of the Covid-19 pandemic and concluded that no further reporting of information in the 2019-20 annual financial statements is deemed material. My opinion is not modified in respect of this matter.
Other matter 9. I draw attention to the matter below. My opinion is not modified in respect of this matter. Unaudited supplementary schedules 10. The supplementary information set out on pages 257 to 267 does not form part of the
financial statements and is presented as additional information. I have not audited these schedules and, accordingly, I do not express an opinion on them.
Responsibilities of the accounting officer for the financial statements 11. The accounting officer is responsible for the preparation and fair presentation of the
financial statements in accordance with MCS and the requirements of the PFMA and Dora, and for such internal control as the accounting officer determines is necessary to enable the preparation of financial statements that are free from material misstatement, whether due to fraud or error.
12. In preparing the financial statements, the accounting officer is responsible for assessing
the department’s ability to continue as a going concern, disclosing, as applicable, matters relating to going concern and using the going concern basis of accounting unless the appropriate governance structure either intends to liquidate the department or to cease operations, or has no realistic alternative but to do so.

189Annual Report 2019/2020
Annual Report for 2019/20 Financial YearVote 5: Department of Education
Province of the Western Cape
Auditor-general’s responsibilities for the audit of the financial statements
13. My objectives are to obtain reasonable assurance about whether financial statementsas a whole are free from material misstatement, whether due to fraud or error, and toissue an auditor’s report that includes my opinion. Reasonable assurance is a high levelof assurance but is not a guarantee that an audit conducted in accordance with theISAs will always detect a material misstatement when it exists. Misstatements can arisefrom fraud or error and are considered material if, individually or in aggregate, they couldreasonably be expected to influence the economic decisions of users taken on the basisof these financial statements.
14. A further description of my responsibilities for the audit of the financial statements isincluded in the annexure to this auditor’s report.
Report on the audit of the annual performance report
Introduction and scope
15. In accordance with the Public Audit Act of South Africa, 2004 (Act No. 25 of 2004) (PAA)and the general notice issued in terms thereof, I have a responsibility to report on theusefulness and reliability of the reported performance information againstpredetermined objectives for selected programmes presented in the annualperformance report. I performed procedures to identify material findings but not togather evidence to express assurance.
16. My procedures address the usefulness and reliability of the reported performanceinformation, which must be based on the approved performance planning documentsof the department. I have not evaluated the completeness and appropriateness of theperformance indicators / measures included in the planning documents. My proceduresdo not examine whether the actions taken by the department enabled service delivery.My procedures also do not extend to any disclosures or assertions relating to plannedperformance strategies and information in respect of future periods that may beincluded as part of the reported performance information. Accordingly, my findings donot extend to these matters.
17. I evaluated the usefulness and reliability of the reported performance information inaccordance with the criteria developed from the performance management andreporting framework, as defined in the general notice, for the following selectedprogrammes presented in the annual performance report of the department for the yearended 31 March 2020:
Programmes Pages in the annual performance report
Programme 2: public ordinary school education
73-79

190 Annual Report 2019/2020
Annual Report for 2019/20 Financial YearVote 5: Department of EducationProvince of the Western Cape
18. I performed procedures to determine whether the reported performance informationwas properly presented and whether performance was consistent with the approvedperformance planning documents. I performed further procedures to determine whetherthe indicators and related targets were measurable and relevant, and assessed thereliability of the reported performance information to determine whether it was valid,accurate and complete.
19. The material findings in respect of the usefulness and reliability of the selectedprogramme are as follows:
Programme 2: public ordinary school education
PPM 216: percentage of learners provided with required textbooks in all grades and in all subjects per annum
20. The planned target of 99,8% for this indicator was not specific in clearly identifying thenature and required level of performance.
PPM 213: percentage of Funza Lushaka bursary holders placed in school within six months upon completion of their studies or upon confirmation that the bursar has completed studies
21. I was unable to obtain sufficient appropriate audit evidence for the achievement of8,49% as reported against the target of 65% in the annual performance report, due tothe lack of accurate and complete records. I was unable to confirm the reportedachievement by alternative means. Consequently, I was unable to determine whetherany adjustments were required to the reported achievement
Various indicators
22. The achievements reported in the annual performance report materially differed fromthe supporting evidence provided for the indicators listed below:
Indicator description Reported achievement
PPM 216: percentage of learners provided with required textbooks in all grades and in all subjects per annum
94,25%
PPI 2.3: learner absenteeism rate 5,73%

191Annual Report 2019/2020
Annual Report for 2019/20 Financial YearVote 5: Department of Education
Province of the Western Cape
Other matters
23. I draw attention to the matters below.
Programme 1: administration
PPM 108: Teacher absenteeism not reliable
24. The performance indicator, previously included in programme 2: public ordinary schooleducation, was included under programme 1: administration for the year under review,which was not selected for audit in 2019-20. The performance reported against theplanned target in the previous year materially differed from the supporting evidence asall the leave taken by teachers during the previous financial year was not recorded orincluded as part of the reported achievement in the performance report. Due to therelevance and importance of this indicator to the education sector, the 2019-20 auditalso included a confirmation of whether the processes had improved to address theweaknesses previously identified. These matters were, however, not addressed and as aresult the reported achievement of 3,95% as included on page 50 in the annualperformance report is not reliable.
Achievement of planned targets
25. Refer to the annual performance report on pages 73 to 79 for information on theachievement of planned targets for the year and explanations provided for the under- and overachievement of a number of targets. This information should be considered inthe context of the material findings on the usefulness and reliability of the reportedperformance information in paragraphs 20 to 22 of this report
Adjustment of material misstatements
26. I identified material misstatements in the annual performance report submitted forauditing. These material misstatements were in the reported performance information ofprogramme 2: public ordinary school education. As management subsequentlycorrected only some of the misstatements, I raised material findings on the usefulness andreliability of the reported performance information. Those that were not corrected arereported above.
Report on the audit of compliance with legislation
Introduction and scope
27. In accordance with the PAA and the general notice issued in terms thereof, I have aresponsibility to report material findings on the department’s compliance with specificmatters in key legislation. I performed procedures to identify findings but not to gatherevidence to express assurance

192 Annual Report 2019/2020
Annual Report for 2019/20 Financial YearVote 5: Department of EducationProvince of the Western Cape
28. I did not identify any material findings on compliance with the specific matters in keylegislation set out in the general notice issued in terms of the PAA
Other information
��! The accounting officer is responsible for the other information. The other informationcomprises the information included in the annual report! The other information does notinclude the financial statements, the auditor’s report and those selected programmespresented in the annual performance report that have been specifically reported in thisauditor’s report.
��! My opinion on the financial statements and findings on the reported performanceinformation and compliance with legislation do not cover the other information and I donot express an audit opinion or any form of assurance conclusion thereon.
��! In connection with my audit, my responsibility is to read the other information and, indoing so, consider whether the other information is materially inconsistent with thefinancial statements and the selected programme presented in the annual performancereport, or my knowledge obtained in the audit, or otherwise appears to be materiallymisstated. If based on the work I have performed, I conclude that there is a materialmisstatement in this other information, I am required to report that fact.
��! I have nothing to report in this regard.
Internal control deficiencies
33. I considered internal control relevant to my audit of the financial statements, reportedperformance information and compliance with applicable legislation; however, myobjective was not to express any form of assurance on it. The matters reported below arelimited to the significant internal control deficiencies that resulted in, the findings on theWCED performance report in this report.
34. Management did not have appropriate record-keeping processes in place to ensurethat reported performance information was supported by credible supporting evidence
35. The method of calculation for PPM 216, which measures the percentage of learnersreceiving the required textbooks, was amended in the current year by the relevantauthorities without adequately considering the performance management andreporting framework prescripts relating to predetermined objectives, which resulted inthe indicator not being well defined.
36. The implementation of the action plan to address repeat findings on predeterminedobjectives was not adequate to prevent material misstatements in the performancereport.

193Annual Report 2019/2020
Annual Report for 2019/20 Financial YearVote 5: Department of Education
Province of the Western Cape
��
Other reports
37. I draw attention to the following engagement conducted which had, or could have, an
impact on the matters reported in the department’s financial statements, reported performance information, compliance with applicable legislation and other related matters.
38. I draw attention to the following engagement conducted which had, or could have, an impact on the matters reported in the department’s financial statements, reported performance information, compliance with applicable legislation and other related matters.
39. The special investigating unit is currently investigating the Covid-19 procurement processes. The investigation is still in progress.
Cape Town 5 November 2020

194 Annual Report 2019/2020
Annual Report for 2019/20 Financial YearVote 5: Department of EducationProvince of the Western Cape
�Annexure – Auditor-general’s responsibility for the audit 1. As part of an audit in accordance with the ISAs, I exercise professional judgement and
maintain professional scepticism throughout my audit of the financial statements, and the procedures performed on reported performance information for selected programmes and on the department’s compliance with respect to the selected subject matters.
Financial statements 2. In addition to my responsibility for the audit of the financial statements as described in this
auditor’s report, I also: � identify and assess the risks of material misstatement of the financial statements,
whether due to fraud or error; design and perform audit procedures responsive to those risks; and obtain audit evidence that is sufficient and appropriate to provide a basis for my opinion. The risk of not detecting a material misstatement resulting from fraud is higher than for one resulting from error, as fraud may involve collusion, forgery, intentional omissions, misrepresentations or the override of internal control
� obtain an understanding of internal control relevant to the audit in order to design audit procedures that are appropriate in the circumstances, but not for the purpose of expressing an opinion on the effectiveness of the department’s internal control
� evaluate the appropriateness of accounting policies used and the reasonableness of accounting estimates and related disclosures made by the accounting officer
� conclude on the appropriateness of the accounting officer’s use of the going concern basis of accounting in the preparation of the financial statements. I also conclude, based on the audit evidence obtained, whether a material uncertainty exists relating to events or conditions that may cast significant doubt on the ability of the WCED’s to continue as a going concern. If I conclude that a material uncertainty exists, I am required to draw attention in my auditor’s report to the related disclosures in the financial statements about the material uncertainty or, if such disclosures are inadequate, to modify my opinion on the financial statements. My conclusions are based on the information available to me at the date of this auditor’s report. However, future events or conditions may cause a department to cease operating as a going concern
� evaluate the overall presentation, structure and content of the financial statements, including the disclosures, and determine whether the financial statements represent the underlying transactions and events in a manner that achieves fair presentation.
Communication with those charged with governance 3. I communicate with the accounting officer regarding, among other matters, the planned
scope and timing of the audit and significant audit findings, including any significant deficiencies in internal control that I identify during my audit.
4. I also confirm to the accounting officer that I have complied with relevant ethical
requirements regarding independence, and communicate all relationships and other matters that may reasonably be thought to have a bearing on my independence and, where applicable, actions taken to eliminate threats or safeguards applied.

195Annual Report 2019/2020
Annual Report for 2019/20 Financial YearVote 5: Department of Education
Province of the Western Cape
�Appropriation Statement
for the year ended 31 March 2020
Appropriation per programme 2019/20 2018/19
Voted funds and direct charges
Adjusted Appropriation
Shifting of
Funds
Virement Final Appropriation
Actual Expenditure
Variance Expenditure as % of final
appropriation
Final Appropriation
Actual Expenditure
R'000 R'000 R'000 R'000 R'000 R'000 % R'000 R'000 Programme 1. Administration 1 666 567 - (31 574) 1 634 993 1 630 972 4 021 99.8% 1 563 125 1 556 902 2. Public Ordinary School
Education 17 670 025 - (15 976) 17 654 049 17 466 301 187 748 98.9% 16 352 197 16 347 764
3. Independent School Subsidies
119 510 - (973) 118 537 118 537 - 100% 113 179 113 179
4. Public Special School Education
1 345 286 - (28 212) 1 317 074 1 314 143 2 931 99.8% 1 258 980 1 258 295
5. Early Childhood Development
606 653 - (16 335) 590 318 590 318 - 100% 569 355 569 355
6. Infrastructure Development
1 783 348 - 92 709 1 876 057 1 869 152 6 905 99.6% 1 835 544 1 810 370
7. Examination and Education Related Services
458 634 - 361 458 995 456 966 2 029 99.6% 457 400 456 569
Total 23 650 023 - - 23 650 023 23 446 389 203 634 99.1% 22 149 780 22 112 434 Reconciliation with Statement of Financial Performance Add: Departmental receipts 12 862 - Actual amounts per Statement of Financial Performance (Total Revenue) 23 662 885 22 149 780 Actual amounts per Statement of Financial Performance Expenditure 23 446 389 22 112 434
Virements�� Shifting of R16,201 million to Programme 1: Administration for the higher than anticipated expenditure for compensation
of employees from Programme 2: Public Ordinary School Education (R2,115 million) and Programme 4: Public Special School Education (R14,086 million).
� Shifting of R41 000 to Programme 2: Public Ordinary School Education for the higher than anticipated expenditure for the Social Sector EPWP Incentive Grant for Provinces from Programme 5: Early Childhood Development (R41 000)
� Shifting of R5,071 million to Programme 4: Public Special School Education for the higher than anticipated severance package pay-outs and leave gratuities, payments for financial assets and the increase in the daily vehicle tariffs from Programme 1: Administration (R36 000), Programme 2: Public Ordinary School Education (R4,840 million) and Programme 5: Early Childhood Development (R195 000).
� Shifting of R93,866 million to Programme 6: Infrastructure Development for the higher than anticipated expenditure for MOD school halls and sports fields, and maintenance at public ordinary schools from Programme 1: Administration (R47,739 million), Programme 2: Public Ordinary School Education (R8,536 million), Programme 3: Independent Schools (R973 000), Programme 4: Public Special School Education (R11,982 million), Programme 5: Early Childhood Development (R14,049 million) and Programme 7: Examination and Education Related Services (R10,587 million).
� Shifting of R10,948 million to Programme 7: Examination and Education Related Services for the higher than anticipated compensation of employees, severance package pay-outs and leave gratuities, annual subscription fees and computer equipment in respect of examinations from Programme 2: Public Ordinary School Education (R526 000), Programme 4: Public Special School Education (R7,215 million), Programme 5: Early Childhood Development (R2,050 million) and Programme 6: Infrastructure Development (R1,157 million).

196 Annual Report 2019/2020
Annual Report for 2019/20 Financial YearVote 5: Department of EducationProvince of the Western Cape
�Appropriation Statement
for the year ended 31 March 2020
Appropriation per economic classification 2019/20 2018/19
Adjusted Appropriation
Shifting of Funds
Virement Final Appropriation
Actual Expenditure
Variance Expenditure as % of final
appropriation
Final Appropriatio
n
Actual Expenditure
Economic classification R'000 R'000 R'000 R'000 R'000 R'000 % R'000 R'000 Current payments 20 267 745 (71 788) (46 340) 20 149 617 19 952 888 196 729 99.0% 18 693 509 18 675 616 Compensation of employees 17 689 799 (64 027) (137) 17 625 635 17 474 935 150 700 99.1% 16 353 149 16 352 318 Salaries and wages 15 422 618 (18 433) 14 957 15 419 142 15 309 682 109 460 99.3% 14 312 500 14 311 669 Social contributions 2 267 181 (45 594) (15 094) 2 206 493 2 165 253 41 240 98.1% 2 040 649 2 040 649 Goods and services 2 577 946 (7 761) (46 203) 2 523 982 2 477 953 46 029 98.2% 2 340 360 2 323 298 Administrative fees 634 (83) - 551 551 - 100.0% 402 402 Advertising 11 077 1 791 (1 917) 10 951 10 951 - 100.0% 7 266 7 266 Minor assets 5 251 (1 134) 410 4 527 4 527 - 100.0% 3 607 3 607 Audit costs: External 16 529 - (2 958) 13 571 13 571 - 100.0% 13 512 11 927 Bursaries: Employees 3 415 (133) - 3 282 3 282 - 100.0% 1 073 1073 Catering: Departmental activities 16 858 (3 028) (5) 13 825 12 065 1 760 87.3% 13 352 13 352 Communication (G&S) 10 952 (837) (3 155) 6 960 6 960 - 100.0% 7 654 7 654 Computer services 30 168 (1 785) (5 247) 23 136 23 136 - 100.0% 19 169 19 169 Consultants: Business and advisory services 53 533 4 348 - 57 881 57 881 - 100.0% 43 131 43 131 Infrastructure and planning services 107 272 - 13 877 121 149 121 149 - 100.0% 112 843 112 843 Legal services 8 111 - (2 778) 5 333 5 333 - 100.0% 6 266 6 266 Contractors 16 102 (615) (2 126) 13 361 13 361 - 100.0% 11 031 11 031 Agency and support / outsourced services 465 779 5 368 (3 909) 467 238 453 486 13 752 97.1% 442 343 440 641 Entertainment 203 (160) - 43 43 - 100.0% 34 34
Fleet services (including government motor transport) 26 078 8 264 (4 150) 30 192 30 192 - 100.0% 30 221 27 285
Inventory: Learner and teacher support material 187 064 (7 178) (13 092) 166 794 163 863 2 931 98.2% 142 802 142 117
Inventory: Materials and supplies 746 (476) - 270 270 - 100.0% 126 126 Inventory: Other supplies 387 814 (19 818) (1 383) 366 613 341 222 25 391 93.1% 405 780 401 347 Consumable supplies 6 341 785 - 7 126 7 126 - 100.0% 5 008 5 008
Consumable: Stationery printing and office supplies 24 152 421 (4 062) 20 511 20 511 - 100.0% 19 716 19 716
Operating leases 78 733 (2 620) - 76 113 76 113 - 100.0% 68 772 68 772 Property payments 655 731 20 004 2 295 678 030 678 030 - 100.0% 569 011 563 290 Transport provided: Departmental activity 343 801 (9 935) (11 145) 322 721 322 721 - 100.0% 307 770 307 770 Travel and subsistence 43 792 2 133 (2 810) 43 115 40 920 2 195 94.9% 39 568 39 568 Training and development 27 227 (4 556) (4 048) 18 623 18 623 - 100.0% 21 881 21 881 Operating payments 43 127 2 409 - 45 536 45 536 - 100.0% 40 239 40 239 Venues and facilities 6 806 (741) - 6 065 6 065 - 100.0% 7 421 7 421 Rental and hiring 650 (185) - 465 465 - 100.0% 362 362 Transfers and subsidies 2 271 902 91 488 12 850 2 376 240 2 376 240 - 100.0% 2 260 554 2 260 554 Departmental agencies and accounts 9 937 1 - 9 938 9 938 - 100.0% 9 410 9 410 Departmental agencies (non-business
entities) 9 937 1 - 9 938 9 938 - 100.0% 9 410 9 410
Non-profit institutions 2 151 848 93 344 12 740 2 257 932 2 257 932 - 100.0% 2 152 440 2 152 440 Households 110 117 (1 857) 110 108 370 108 370 - 100.0% 98 704 98 704 Social benefits 107 649 (1 398) 305 106 556 106 556 - 100.0% 87 913 87 913 Other transfers to households 2 468 (459) (195) 1 814 1 814 - 100.0 10 791 10 791 Payments for capital assets 1 104 331 (16 529) 33 490 1 121 292 1 114 387 6 905 99.4% 1 188 411 1 168 958 Buildings and other fixed structures 1 047 739 (12 332) 34 663 1 070 070 1 063 165 6 905 99.4 1 143 373 1 123 920 Buildings 471 794 76 622 33 620 582 036 582 036 - 100.0% 575 568 575 568 Other fixed structures 575 945 (88 954) 1 043 488 034 481 129 6 905 98.6% 567 805 548 352 Machinery and equipment 53 887 (4 099) 482 50 270 50 270 - 100.0% 43 863 43 863 Transport equipment 27 481 6 648 2 291 36 420 36 420 - 100.0 30 801 30 801 Other machinery and equipment 26 406 (10 747) (1 809) 13 850 13 850 - 100.0% 13 062 13 062 Software and other intangible assets 2 705 (98) (1 655) 952 952 - 100.0% 1 175 1 175 Payment for financial assets 6 045 (3 171) - 2 874 2 874 - 100.0% 7 306 7 306 Total 23 650 023 - - 23 650 023 23 446 389 203 634 99.1% 22 149 780 22 112 434

197Annual Report 2019/2020
Annual Report for 2019/20 Financial YearVote 5: Department of Education
Province of the Western Cape
�Appropriation Statement
for the year ended 31 March 2020
Programme 1: Administration
Sub programme
2019/20 2018/19 Adjusted
Appro-priation
Shifting of
Funds
Virement Final Appro-priation
Actual Expenditure
Variance Expenditure as % of final
appropriation
Final Appropriation
Actual Expenditure
R'000 R'000 R'000 R'000 R'000 R'000 % R'000 R'000 1. Office of the MEC 8 160 (610) 1 130 8 680 8 680 - 100.0% 7 062 7 062 2. Corporate Services 346 417 (693) (15 427) 330 297 330 297 - 100.0% 317 717 311 494 3. Education Management 1 283 756 6 366 (17 277) 1 272 845 1 268 824 4 021 99.7% 1 222 528 1 222 528 4. Human Resource
Development 4 136 (192) - 3 944 3 944 - 100.0% 2 143 2 143
5. Education Management Information System (EMIS)
24 098 (4 871) - 19 277 19 227 - 100.0% 13 675 13 675
Total 1 666 567 - (31 574) 1 634 993 1 630 972 4 021 99.8% 1 563 125 1 556 902

198 Annual Report 2019/2020
Annual Report for 2019/20 Financial YearVote 5: Department of EducationProvince of the Western Cape
�Appropriation Statement
for the year ended 31 March 2020
2019/20 2018/19 Adjusted Appro-priation
Shifting of
Funds
Virement Final Appro-priation
Actual Expenditure
Variance Expenditure as % of final appropriatio
n
Final Appro-priation
Actual Expenditure
Economic classification R'000 R'000 R'000 R'000 R'000 R'000 % R'000 R'000 Current payments 1 561 671 6 473 (31 538) 1 536 606 1 532 585 4 021 99.7% 1 461 126 1 454 903 Compensation of employees 970 001 - 16 201 986 202 986 136 66 100.0% 906 168 906 168
Salaries and wages 830 480 - 21 908 852 388 852 322 66 100.0% 784 540 784 540 Social contributions 139 521 - (5 707) 133 814 133 814 - 100.0% 121 628 121 628
Goods and services 591 670 6 473 (47 739) 550 404 546 449 3 955 99.3% 554 958 548 735 Administrative fees 538 (45) - 493 493 - 100.0% 378 378 Advertising 10 960 1 679 (1 914) 10 725 10 725 - 100.0% 7 015 7 015 Minor assets 4 795 (825) (1 361) 2 609 2 609 - 100.0% 3 338 3 338 Audit costs: External 16 529 - (2 958) 13 571 13 571 - 100.0% 13 512 11 927 Bursaries: Employees 1 301 (82) - 1 219 1 219 - 100.0% 784 784 Catering: Departmental activities 6 514 (363) (5) 6 146 4 386 1 760 71.4% 3 510 3 510 Communication (G&S) 10 247 (910) (3 155) 6 182 6 182 - 100.0% 6 945 6 945 Computer services 30 163 (2 316) (5 750) 22 097 22 097 - 100.0% 19 158 19 158 Consultants: Business and advisory services
53 018 1 804 - 54 822 54 822 - 100.0% 42 953 42 953
Legal services 8 111 - (2 778) 5 333 5 333 - 100.0% 6 264 6 264 Contractors 14 269 (249) (2 130) 11 890 11 890 - 100.0% 10 010 10 010 Agency and support / outsourced services
48 301 5 866 (3 760) 50 407 50 407 - 100.0% 39 141 37 439
Entertainment 201 (159) - 42 42 - 100.0% 34 34 Fleet services (including government motor transport)
17 235 2 803 (4 150) 15 888 15 888 - 100.0% 17 546 14 610
Inventory: Learner and teacher support material
2 387 267 (2 255) 399 399 - 100.0% 2 589 2 589
Inventory: Materials and supplies 455 (455) - - - - - 94 94 Inventory: Other supplies 275 256 2 690 - 277 946 277 946 - 100.0% 311 940 311 940 Consumable supplies 3 124 1 427 - 4 537 4 537 - 100.0% 2 884 2 884 Consumable: Stationery printing and office supplies
13 275 (378) (4 062) 8 835 8 835 - 100.0% 10 628 10 628
Operating leases 3 691 (1 007) - 2 684 2 684 - 100.0% 3 408 3 408 Property payments 29 760 (12) (8 236) 21 512 21 512 - 100.0% 23 860 23 860 Transport provided: Departmental activity 2 235 (1 499) - 736 736 - 100.0% 668 668 Travel and subsistence 21 941 (736) (2 799) 18 406 16 211 2 195 88.1% 16 616 16 616 Training and development 7 505 (682) (2 426) 4 397 4 397 - 100.0% 2 632 2 632 Operating payments 6 652 1 087 - 7 739 7 739 - 100.0% 4 352 4 352 Venues and facilities 3 038 (1 469) - 1 569 1 569 - 100.0% 4 470 4 470 Rental and hiring 169 51 - 220 220 - 100.0% 229 229
Transfers and subsidies 57 197 (3 708) - 53 489 53 489 - 100.0% 58 993 58 993 Departmental agencies and accounts 7 2 - 9 9 - 100.0% 8 8
Departmental agencies (non-business entities)
7 2 - 9 9 - 100.0% 8 8
Non-profit institutions 43 554 (1 950) - 41 604 41 604 - 100.0% 40 696 40 696 Households 13 636 (1 760) - 11 876 11 876 - 100.0% 18 289 18 289
Social benefits 12 244 (2 040) - 10 204 10 204 - 100.0% 7 726 7 726 Other transfers to households 1 392 280 - 1 672 1 672 - 100.0% 10 563 10 563
Payments for capital assets 41 654 406 - 42 060 42 060 - 100.0% 35 700 35 700 Machinery and equipment 40 803 459 - 41 262 41 262 - 100.0% 34 525 34 525
Transport equipment 22 594 6 822 - 29 416 29 416 - 100.0% 24 179 24 179 Other machinery and equipment 18 209 (6 363) - 11 846 11 846 - 100.0% 10 346 10 346
Software and other intangible assets 851 (53) - 798 798 - 100.0% 1 175 1 175 Payment for financial assets 6 045 (3 171) (36) 2 838 2 838 - 100.0% 7 306 7 306 Total 1 666 567 - (31 574) 1 634 993 1 630 972 4 021 99.8% 1 563 125 1 556 902

199Annual Report 2019/2020
Annual Report for 2019/20 Financial YearVote 5: Department of Education
Province of the Western Cape
�Appropriation Statement
for the year ended 31 March 2020 Subprogramme: 1.1: Office of the MEC
Economic classification
2019/20 2018/19 Adjusted
Appropriation Shifting of
Funds Virement Final
Appropriation Actual
Expenditure Variance Expenditure
as % of final appropriation
Final Appropriation
Actual Expenditure
R'000 R'000 R'000 R'000 R'000 R'000 % R'000 R'000 Current payments 7 701 (553) 1 130 7 684 7 684 - 100.0% 6 744 6 744 Compensation of employees 5 574 - 1 130 6 704 6 704 - 100.0% 5 757 5 757 Goods and services 1 533 (553) - 980 980 - 100.0% 987 987 Transfers and subsidies 637 30 - 667 667 - 100.0% 5 5 Non-profit institutions - - - - - - - - - Households 637 30 - 667 667 - 100.0% 5 5 Payments for capital assets 416 (90) - 326 326 - 100.0% 313 313 Machinery and equipment 416 (90) - 326 326 - 100.0%` 313 313 Total 8 160 (610) 1 130 8 680 8 680 - 100.% 7 062 7 062
Subprogramme: 1.2: Corporate Services 2019/20 2018/19
Economic classification
Adjusted Appropriation
Shifting of Funds
Virement Final Appropriation
Actual Expenditure
Variance Expenditure as % of final
appropriation
Final Appropriation
Actual Expenditure
R'000 R'000 R'000 R'000 R'000 R'000 % R'000 R'000 Current payments 331 159 (651) (15 391) 315 117 315 117 - 100.0% 292 021 285 798 Compensation of employees 259 959 - 6 411 266 370 266 370 - 100.0% 239 428 239 428 Goods and services 71 200 (651) (21 802) 48 747 48 747 - 100.0% 52 593 46 370 Transfers and subsidies 3 729 46 - 3 775 3 775 - 100.01% 12 341 12 341 Departmental agencies and accounts 1 - - 1 1 - 100.0% 1 1
Non-profit institutions - - - - - - - 27 27 Households 3 728 46 - 3 774 3 774 - 100.0% 12 313 12 313 Payments for capital assets 5 484 3 116 - 8 600 8 600 - 100.0% 6 049 6 049 Machinery and equipment 4 633 3 169 - 7 802 7 802 - 100.0% 4 874 4 874 Software and other intangible assets 851 (53) - 798 798 - 100.0% 1 175 1 175 Payment for financial assets 6 045 (3 204) (36) 2 805 2 805 - 100.0% 7 306 7 306 Total 346 417 (693) (15 427) 330 297 330 297 - 100.0% 317 717 311 494 Subprogramme: 1.3: Education Management
Economic classification
2019/20 2018/19 Adjusted
Appropriation Shifting of
Funds Virement Final
Appropriation Actual
Expenditure Variance Expenditure
as % of final appropriation
Final Appropriation
Actual Expenditure
R'000 R'000 R'000 R'000 R'000 R'000 % R'000 R'000 Current payments 1 203 928 9 879 (17 277) 1 196 530 1 192 509 4 201 99.7% 1 151 555 1 151 555 Compensation of employees 704 468 - 8 660 713 128 713 062 66 100.0% 660 983 660 983 Goods and services 499 460 9 879 (25 937) 483 402 479 447 3 955 99.2% 490 572 490 572 Transfers and subsidies 46 383 (2 362) - 44 021 44 021 - 100.0% 41 747 41 747 Departmental agencies and accounts 6 2 - 8 8 - 100.0% 7 7
Non-profit institutions 37 106 (528) - 36 578 36 578 - 100.0% 35 769 35 769 Households 9 271 (1 836) - 7 435 7 435 - 100.0% 5 971 5 971 Payments for capital assets 33 445 (1 181) - 32 264 32 264 - 100.0% 29 226 29 226 Machinery and equipment 33 445 (1 181) - 32 264 32 264 - 100.0% 29 226 29 226 Total 1 283 756 6 366 (17 277) 1 272 845 1 268 824 4 021 99.7% 1 222 528 1 222 528
200 Annual Report 2019/2020
Annual Report for 2019/20 Financial YearVote 5: Department of EducationProvince of the Western Cape
�
Appropriation Statement for the year ended 31 March 2020
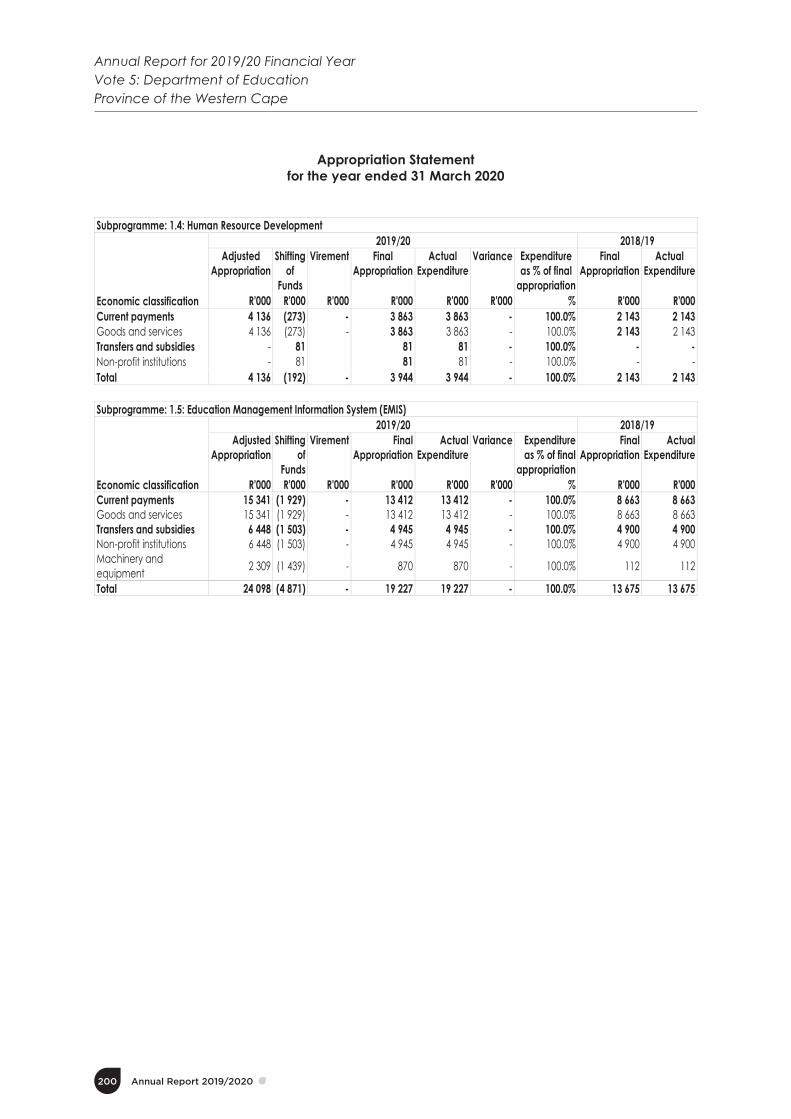
Subprogramme: 1.4: Human Resource Development
Economic classification
2019/20 2018/19 Adjusted
Appropriation Shifting
of Funds
Virement Final Appropriation
Actual Expenditure
Variance Expenditure as % of final
appropriation
Final Appropriation
Actual Expenditure
R'000 R'000 R'000 R'000 R'000 R'000 % R'000 R'000 Current payments 4 136 (273) - 3 863 3 863 - 100.0% 2 143 2 143 Goods and services 4 136 (273) - 3 863 3 863 - 100.0% 2 143 2 143 Transfers and subsidies - 81 81 81 - 100.0% - - Non-profit institutions - 81 81 81 - 100.0% - - Total 4 136 (192) - 3 944 3 944 - 100.0% 2 143 2 143
Subprogramme: 1.5: Education Management Information System (EMIS)
Economic classification
2019/20 2018/19 Adjusted
Appropriation Shifting
of Funds
Virement Final Appropriation
Actual Expenditure
Variance Expenditure as % of final
appropriation
Final Appropriation
Actual Expenditure
R'000 R'000 R'000 R'000 R'000 R'000 % R'000 R'000 Current payments 15 341 (1 929) - 13 412 13 412 - 100.0% 8 663 8 663 Goods and services 15 341 (1 929) - 13 412 13 412 - 100.0% 8 663 8 663 Transfers and subsidies 6 448 (1 503) - 4 945 4 945 - 100.0% 4 900 4 900 Non-profit institutions 6 448 (1 503) - 4 945 4 945 - 100.0% 4 900 4 900 Machinery and equipment 2 309 (1 439) - 870 870 - 100.0% 112 112
Total 24 098 (4 871) - 19 227 19 227 - 100.0% 13 675 13 675

201Annual Report 2019/2020
Annual Report for 2019/20 Financial YearVote 5: Department of Education
Province of the Western Cape
�Appropriation Statement
for the year ended 31 March 2020
Programme 2: Public Ordinary School Education
Sub programme
2019/20 2018/19 Adjusted
Appropriation Shifting of
Funds Virement Final
Appropriation Actual
Expenditure Variance Expenditure
as % of final appropriation
Final Appropriation
Actual Expenditure
R'000 R'000 R'000 R'000 R'000 R'000 % R'000 R'000 1. Public Primary Level 10 538 278 305 763 (4 584) 10 839 457 10 829 487 9 970 99.9% 10 070 472 10 068 940 2. Public Secondary Level 6 594 145 (299 418) (7 521) 6 287 206 6 128 484 158 722 97.5% 5 790 389 5 790 389 3. Human Resource Development 105 515 (6 347) (3 912) 95 256 95 256 - 100.0% 85 619 85 619 4. Conditional Grants 432 087 2 41 432 130 413 074 19 056 95.6% 405 717 402 816 Total 17 670 025 - (15 976) 17 654 049 17 466 031 187 748 98.9% 16 352 197 16 347 764
Economic classification
2019/20 2018/19 Adjusted
Appropriation Shifting
of Funds Virement Final
Appropriation Actual
Expenditure Variance Expenditure
as % of final appropriation
Final Appropriation
Actual Expenditure
R'000 R'000 R'000 R'000 R'000 R'000 % R'000 R'000 Current payments 16 334 560 (92 374) (9 896) 16 232 290 16 044 542 187 748 98.8% 15 051 631 15 047 198 Compensation of employees 15 192 605 (58 336) (2 115) 15 132 154 14 983 549 148 605 99.0% 14 030 845 14 030 845
Salaries and wages 13 235 182 (4 150) (2 115) 13 228 917 13 121 552 107 365 99.2% 12 270 356 12 270 356 Social contributions 1 957 423 (54 186) - 1 903 237 1 861 997 41 240 97 .8% 1 760 489 1 760 489
Goods and services 1 141 955 (34 038) (7 781) 1 100 136 1 060 993 39 143 96.4% 1 020 786 1 016 353 Administrative fees 96 (47) - 49 49 - 100.0% - - Advertising 108 102 - 210 210 - 100.0% 137 137 Minor assets 389 (312) - 77 77 - 100.0% 172 172 Bursaries: Employees 2 114 (51) - 2 063 2 063 - 100.0% 289 289 Catering: Departmental activities 6 072 (733) - 5 339 5 339 - 100.0% 5 705 5 705 Communication (G&S) 222 10 - 232 232 - 100.0% 211 211 Computer services 3 1 - 4 4 - 100.0% 5 5 Consultants: Business and advisory services
166 2 347 - 2 513 2 513 - 100.0% 178 178
Contractors 651 (76) - 575 575 - 100.0% 204 204 Agency and support / outsourced services
377 039 1 931 - 378 970 365 218 13 752 96.4% 366 922 366 922
Fleet services (including government motor transport)
621 517 - 1 138 1 138 - 100.0% 908 908
Inventory: Learner and teacher support material
172 985 (5 528) (5 837) 161 620 161 620 - 100.0% 134 709 134 709
Inventory: Materials and supplies 278 (27) - 251 251 - 100.0% 32 32 Inventory: Other supplies 93 053 (22 448) - 70 605 45 214 25 391 64.0% 64 957 60 524 Consumable supplies 2 940 (613) - 2 327 2 327 - 100.0% 1 839 1 839 Consumable: Stationery printing and office supplies
2 179 (149) - 2 030 2 030 - 100.0% 2 044 2 044
Operating leases 44 194 (5 416) - 38 778 38 778 - 100.0% 37 194 37 194 Property payments 87 345 1 894 (1 944) 87 295 87 295 - 100.0% 81 595 81 595 Transport provided: Departmental activity
325 335 (8 436) - 316 899 316 899 - 100.0% 301 055 301 055
Travel and subsistence 10 057 857 - 10 914 10 914 - 100.0% 10 004 10 004 Training and development 11 638 431 - 12 069 12 069 - 100.0% 9 275 9 275 Operating payments 1 299 2 438 - 3 737 3 737 - 100.0% 775 775 Venues and facilities 2 857 (481) - 2 376 2 376 - 100.0% 2 518 2 518 Rental and hiring 314 (249) - 65 65 - 100.0% 58 58
Transfers and subsidies 1 329 321 93 148 (2 459) 1 420 010 1 420 010 - 100.0% 1 297 725 1 297 725 Departmental agencies and accounts 2 - - 2 2 - 100.0% 2 2
Departmental agencies (non-business entities)
2 - - 2 2 - 100.0% 2 2
Non-profit institutions 1 237 929 93 317 41 1 331 287 1 331 287 - 100.0% 1 225 460 1 225 460 Households 91 390 (169) (2 500) 88 721 88 721 - 100.0% 72 263 72 263
Social benefits 90 314 570 (2 209) 88 675 88 675 - 100.0% 72 035 72 035 Other transfers to households 1 076 (739) (291) 46 46 - 100.0% 228 228
Payments for capital assets 6 144 (774) (3 621) 1 749 1 749 - 100.0% 2 841 2 841 Machinery and equipment 4 290 (729) (1 966) 1 595 1 595 - 100.0% 2 841 2 841
Transport equipment 1 103 (174) - 929 929 - 100.0% 928 928 Other machinery and equipment 3 187 (555) (1 966) 666 666 - 100.0% 1 913 1 913
Software and other intangible assets 1 854 (45) (1 655) 154 154 - 100.0% - - Total 17 670 025 - (15 976) 17 654 049 17 466 301 187 748 98.9% 16 352 197 16 347 764

202 Annual Report 2019/2020
Annual Report for 2019/20 Financial YearVote 5: Department of EducationProvince of the Western Cape
�Appropriation Statement
for the year ended 31 March 2020
Subprogramme: 2.1: Public Primary Level
Economic classification
2019/20 2018/19 Adjusted
Appropriation Shifting of
Funds Virement Final
Appropriation Actual
Expenditure Variance Expenditure as
% of final appropriation
Final Appropriation
Actual Expenditure
R'000 R'000 R'000 R'000 R'000 R'000 % R'000 R'000 Current payments 9 747 011 178 520 (2 375) 9 923 156 9 913 186 9 970 99.9% 9 264 942 9 263 410 Compensation of employees 9 308 889 202 274 - 9 511 163 9 511 163 - 100.0% 8 882 808 8 882 808 Goods and services 438 122 (23 754) (2 375) 411 993 402 023 9 970 97.6% 382 134 380 602 Transfers and subsidies 791 267 127 243 (2 209) 916 301 916 301 - 100.0% 805 530 805 530 Non-profit institutions 738 189 127 228 - 865 417 865 417 - 100.0% 762 917 762 917 Households 53 078 15 (2 209) 50 884 50 884 - 100.0% 42 613 42 613 Total 10 538 278 305 763 (4 584) 10 839 457 10 829 487 9 970 99.9% 10 070 472 10 068 940
Subprogramme: 2.2: Public Secondary Level
Economic classification
2019/20 2018/19 Adjusted
Appropriation Shifting of
Funds Virement Final
Appropriation Actual
Expenditure Variance Expenditure as
% of final appropriation
Final Appropriation
Actual Expenditure
R'000 R'000 R'000 R'000 R'000 R'000 % R'000 R'000 Current payments 6 139 766 (265 696) (7 521) 5 866 549 5 707 827 158 722 97.3% 5 384 069 5 384 069 Compensation of employees 5 834 081 (256 931) (2 115) 5 575 035 5 426 497 148 538 97.3% 5 105 225 5 105 225 Goods and services 305 685 (8 765) (5 406) 291 514 281 330 10 184 96.5% 278 844 278 844 Transfers and subsidies 454 379 (33 722) - 420 657 420 657 - 100.0% 406 320 406 320 Non-profit institutions 417 313 (34 493) - 382 820 382 820 - 100.0% 376 698 376 698 Households 37 066 771 - 37 837 37 837 - 100.0% 29 622 29 622 Total 6 594 145 (299 418) (7 521) 6 287 206 6 128 484 158 722 97.5% 5 790 389 5 790 389 Subprogramme: 2.3: Human Resource Development
Economic classification
2019/20 2018/19 Adjusted
Appropriation Shifting of
Funds Virement Final
Appropriation Actual
Expenditure Variance Expenditure as
% of final appropriation
Final Appropriation
Actual Expenditure
R'000 R'000 R'000 R'000 R'000 R'000 % R'000 R'000 Current payments 87 652 (4 626) - 83 026 83 026 - 100.0% 68 890 68 890 Compensation of employees 37 696 (4 923) - 32 773 32 773 - 100.0% 30 489 30 489 Goods and services 49 956 297 - 50 253 50 253 - 100.0% 38 401 38 401 Transfers and subsidies 13 306 (1 721) (291) 11 294 11 294 - 100.0% 14 737 14 737 Departmental agencies and accounts 2 - - 2 2 - 100.0% 2 2 Non-profit institutions 12 228 (936) - 11 292 11292 - 100.0% 14 707 14 707 Households 1 076 (785) (291) - - - - 28 28 Payments for capital assets 4 557 - 3 621 936 936 - 100.0% 1 992 1 992 Machinery and equipment 2 703 45 (1 966) 782 782 - 100.0% 1 992 1 992 Software and other intangible assets 1 854 (45) (1 665) 154 154 - 100.0% - - Total 105 515 (6 347) (3 912) 95 256 95 256 - 100.0% 85 619 85 619
Subprogramme: 2.4: Conditional Grants
Economic classification
2019/20 2018/19 Adjusted
Appropriation Shifting of
Funds Virement Final
Appropriation Actual
Expenditure Variance Expenditure as % of
final appropriation Final
Appropriation Actual
Expenditure R'000 R'000 R'000 R'000 R'000 R'000 % R'000 R'000
Current payments 360 131 (572) - 359 559 340 503 19 056 94.7% 333 730 330 829 Compensation of employees 11 939 1 244 - 13 183 13 116 67 99.5% 12 323 12 323 Goods and services 348 192 (1 816) - 346 376 327 387 18 989 94.5% 321 407 318 506 Transfers and subsidies 70 369 1 348 41 71 758 71 758 - 100.0% 71 138 71 138 Non-profit institutions 70 199 1 518 41 71 758 71 758 - 100.0% 71 138 71 138 Households 170 (170) - - - - - - - Payments for capital assets 1 587 (774) - 813 813 - 100.0% 849 849 Machinery and equipment 1 587 (774) - 813 813 - 100.0% 849 849 Total 432 087 2 41 432 130 413 074 19 056 95.6% 405 717 402 816
203Annual Report 2019/2020
Annual Report for 2019/20 Financial YearVote 5: Department of Education
Province of the Western Cape
�Appropriation Statement
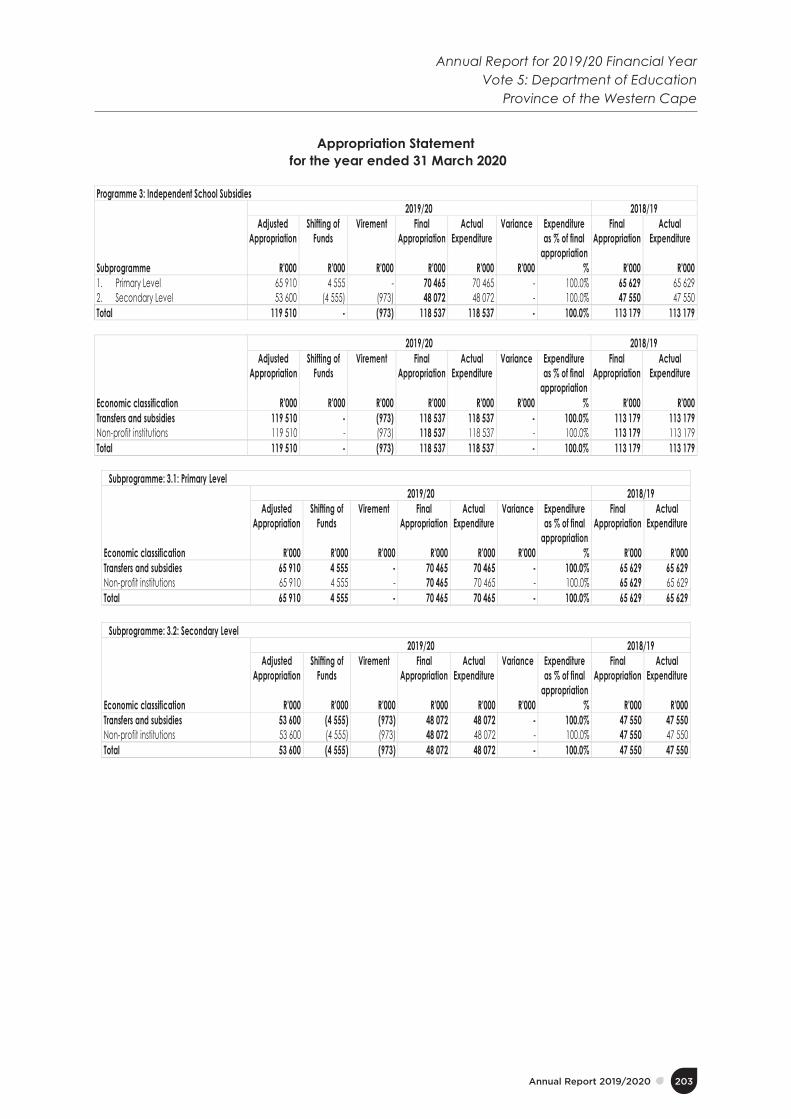
for the year ended 31 March 2020 Programme 3: Independent School Subsidies
Subprogramme
2019/20 2018/19 Adjusted
Appropriation Shifting of
Funds Virement Final
Appropriation Actual
Expenditure Variance Expenditure
as % of final appropriation
Final Appropriation
Actual Expenditure
R'000 R'000 R'000 R'000 R'000 R'000 % R'000 R'000 1. Primary Level 65 910 4 555 - 70 465 70 465 - 100.0% 65 629 65 629 2. Secondary Level 53 600 (4 555) (973) 48 072 48 072 - 100.0% 47 550 47 550 Total 119 510 - (973) 118 537 118 537 - 100.0% 113 179 113 179
Economic classification
2019/20 2018/19 Adjusted
Appropriation Shifting of
Funds Virement Final
Appropriation Actual
Expenditure Variance Expenditure
as % of final appropriation
Final Appropriation
Actual Expenditure
R'000 R'000 R'000 R'000 R'000 R'000 % R'000 R'000 Transfers and subsidies 119 510 - (973) 118 537 118 537 - 100.0% 113 179 113 179 Non-profit institutions 119 510 - (973) 118 537 118 537 - 100.0% 113 179 113 179 Total 119 510 - (973) 118 537 118 537 - 100.0% 113 179 113 179
Subprogramme: 3.1: Primary Level
Economic classification
2019/20 2018/19 Adjusted
Appropriation Shifting of
Funds Virement Final
Appropriation Actual
Expenditure Variance Expenditure
as % of final appropriation
Final Appropriation
Actual Expenditure
R'000 R'000 R'000 R'000 R'000 R'000 % R'000 R'000 Transfers and subsidies 65 910 4 555 - 70 465 70 465 - 100.0% 65 629 65 629 Non-profit institutions 65 910 4 555 - 70 465 70 465 - 100.0% 65 629 65 629 Total 65 910 4 555 - 70 465 70 465 - 100.0% 65 629 65 629
Subprogramme: 3.2: Secondary Level
Economic classification
2019/20 2018/19 Adjusted
Appropriation Shifting of
Funds Virement Final
Appropriation Actual
Expenditure Variance Expenditure
as % of final appropriation
Final Appropriation
Actual Expenditure
R'000 R'000 R'000 R'000 R'000 R'000 % R'000 R'000 Transfers and subsidies 53 600 (4 555) (973) 48 072 48 072 - 100.0% 47 550 47 550 Non-profit institutions 53 600 (4 555) (973) 48 072 48 072 - 100.0% 47 550 47 550 Total 53 600 (4 555) (973) 48 072 48 072 - 100.0% 47 550 47 550

204 Annual Report 2019/2020
Annual Report for 2019/20 Financial YearVote 5: Department of EducationProvince of the Western Cape
�Appropriation Statement
for the year ended 31 March 2020 Programme 4: Public Special School Education
Subprogramme
2019/20 2018/19 Adjusted
Appropriation Shifting
of Funds Virement Final
Appropriation Actual
Expenditure Variance Expenditure
as % of final appropriation
Final Appropriation
Actual Expenditure
R'000 R'000 R'000 R'000 R'000 R'000 % R'000 R'000 1. Schools 1 318 402 1 (28 212) 1 290 191 1 290 191 - 100.0% 1 232 774 1 232 774 2. Human Resource Development 1 (1) - - - - - - - 3. Conditional Grant 26 883 - - 26 883 23 952 2 931 89.1% 26 206 25 521 Total 1 345 286 - (28 212) 1 317 074 1 314 143 2 931 99.8% 1 258 980 1 258 295
Economic classification
2019/20 2018/19 Adjusted
Appropriation Shifting of
Funds Virement Final
Appropriation Actual
Expenditure Variance Expenditure
as % of final appropriation
Final Appropriation
Actual Expenditure
R'000 R'000 R'000 R'000 R'000 R'000 % R'000 R'000 Current payments 1 160 252 (2 396) (33 283) 1 124 573 1 121 642 2 931 99.7% 1 071 008 1 070 323 Compensation of employees 1 103 242 (1 040) (21 301) 1 080 901 1 080 901 - 100.0% 1 025 772 1 025 772
Salaries and wages 951 265 (1 600) (3 904) 945 761 945 761 - 100.0% 899 816 899 816 Social contributions 151 977 560 (17 397) 135 140 135 140 - 100.0% 125 956 125 956
Goods and services 57 010 (1 356) (11 982) 43 672 40 741 2 931 93.3% 45 236 44 551 Administrative fees - 9 - 9 9 - 100.0% - - Advertising - - - - - - - 107 107 Minor assets - 3 - 3 3 - 100.0% 21 21 Catering: Departmental activities 132 143 - 275 275 - 100.0% 99 99 Fleet services (including government motor transport)
6 910 5 008 - 11 918 11 918 - 100.0% 10 736 10 736
Inventory: Learner and teacher support material 6 692 (2 219) - 4 473 1 542 2 931 34.5% 3 843 3 158 Inventory: Materials and supplies - 6 - 6 6 - 100.0% - - Inventory: Other supplies 4 583 (2 995) (1 330) 258 258 - 100.0% 491 491 Consumable supplies 273 (172) - 101 101 - 100.0% 215 215 Consumable: Stationery printing and office supplies
100 (96) - 4 4 - 100.0% 22 22
Operating leases 21 884 2 048 - 23 932 23 932 - 100.0% 23 183 23 183 Property payments Transport provided: Department activity
- 10 652
106 -
- (10 652)
106 -
106 -
- -
100.0% -
1 304 -
1 304 -
Travel and subsistence 569 106 - 675 675 - 100.0% 979 979 Training and development 5 117 (3 835) - 1 282 1 282 - 100.0% 4 119 4 119 Operating payments 78 195 - 273 273 - 100.0% - - Venues and facilities 20 337 - 357 357 - 100.0% 117 117 Transfers and subsidies 181 240 2 406 2 694 186 340 186 340 - 100.0% 182 236 182 236 Non-profit institutions 178 320 2 406 - 180 726 180 726 - 100.0% 177 403 177 403
Households 2 920 - 2 694 5 614 5 614 - 100.0% 4 833 4 833 Social benefits
Other transfers to households 2 920
- - -
2 598 96
5 518 96
5 518 96
- -
100.0% 100.0%
4 833 -
4 833 -
Payments for capital assets 3 794 (10) 2 341 6 125 6 125 - 100.0% 5 736 5 736 Machinery and equipment 3 794 (10) 2 341 6 125 6 125 - 100.0% 5 736 5 736
Transport equipment 3 784 - 2 291 6 075 6 075 - 100.0% 5 717 5 717 Other machinery and equipment
Payment for financial assets 10
- (10)
- 50 36
50 36
50 36
- -
100.0% 100.0%
19 -
19 -
Total 1 345 286 - (28 212) 1 317 074 1 314 143 2 931 99.8% 1 258 980 1 258 295

205Annual Report 2019/2020
Annual Report for 2019/20 Financial YearVote 5: Department of Education
Province of the Western Cape
�Appropriation Statement
for the year ended 31 March 2020
Subprogramme: 4.1: Schools
Economic classification
2019/20 2018/19 Adjusted
Appropriation Shifting of
Funds Virement Final
Appropriation Actual
Expenditure Variance Expenditure as
% of final appropriation
Final Appro-priation
Actual Expenditure
R'000 R'000 R'000 R'000 R'000 R'000 % R'000 R'000 Current payments 1 138 713 (664) (33 283) 1 104 766 1 104 766 - 100.0% 1 053 899 1 053 899 Compensation of employees 1 086 913 - (21 301) 1 065 612 1 065 612 - 100.0% 1 012 958 1 012 958 Goods and services 51 800 (664) (11 982) 39 154 39 154 - 100.0% 40 941 40 941 Transfers and subsidies 175 905 665 2 694 179 264 179 264 - 100.0% 173 156 173 156 Non-profit institutions 172 985 665 - 173 650 173 650 - 100.0% 168 323 168 323 Households 2 920 - 2 694 5 614 5 614 - 100.0% 4 833 4 833 Payments for capital assets 3 784 - 2 341 6 125 6 125 - 100.0% 5 719 5 719 Machinery and equipment Payment for financial assets
3 784 -
- -
2 341 36
6 125 36
6 125 36
- -
100.0% 100.0%
5 719 -
5 719 -
Total 1 318 402 1 (28 212) 1 290 191 1 290 191 - 100.0% 1 232 774 1 232 774
Subprogramme: 4.2: Human Resource Development
Economic classification
2019/20 2018/19 Adjusted
Appropriation Shifting of
Funds Virement Final
Appropriation Actual
Expenditure Variance Expenditure as
% of final appropriation
Final Appro-priation
Actual Expenditure
R'000 R'000 R'000 R'000 R'000 R'000 % R'000 R'000 Transfers and subsidies 1 (1) - - - - - - - Non-profit institutions 1 (1) - - - - - - - Total 1 (1) - - - - - - -
Subprogramme: 4.3: Conditional Grant
Economic classification
2019/20 2018/19 Adjusted
Appropriation Shifting of
Funds Virement Final
Appropriation Actual
Expenditure Variance Expenditure as
% of final appropriation
Final Appro-priation
Actual Expenditure
R'000 R'000 R'000 R'000 R'000 R'000 % R'000 R'000 Current payments 21 539 (1 732) - 19 807 16 876 2 931 85.2% 17 109 16 424 Compensation of employees 16 329 (1 040) - 15 289 15 289 - 100.0% 12 814 12 814 Goods and services 5 210 (692) - 4 518 1 587 2 931 35 .1% 4 295 3 610
rTransfers and subsidies 5 334 1 742 - 7 076 7 076 - 100.0% 9 080 9 080 Non-profit institutions 5 334 1 742 - 7 076 7 076 - 100.0% 9 080 9 080 Payments for capital assets 10 (10) - - - - - 17 17 Machinery and equipment 10 (10) - - - - - 17 17 Total 26 883 - - 26 883 23 952 2 931 89.1% 26 206 25 521

206 Annual Report 2019/2020
Annual Report for 2019/20 Financial YearVote 5: Department of EducationProvince of the Western Cape
�Appropriation Statement
for the year ended 31 March 2020 Programme 5: Early Childhood Development
Subprogramme
2019/20 2018/19 Adjusted
Appropriation Shifting of
Funds Virement Final
Appropriation Actual
Expenditure Variance Expenditure
as % of final appropriation
Final Appropriation
Actual Expenditure
R'000 R'000 R'000 R'000 R'000 R'000 % R'000 R'000 1. Grade R in Public Schools 415 747 1 (8 681) 407 067 407 067 - 100.0% 393 149 393 149 2. Grade R in Early Childhood
Development Centres 84 057 - (662) 83 395 83 395 - 100.0% 74 789 74 789
3. Pre-Grade R Training 99 315 - (6 951) 92 364 92 364 - 100.0% 86 569 86 569 4. Human Resource Development 1 (1) - - - - - - - 5. Conditional Grants 7 533 - (41) 7 492 7 492 - 100.0% 14 848 14 848 Total 606 653 - (16 335) 590 318 590 318 - 100.0% 569 355 569 355
Economic classification
2019/20 2018/19 Adjusted
Appropriation Shifting of
Funds Virement Final
Appropriation Actual
Expenditure Variance Expenditure
as % of final appropriation
Final Appropriation
Actual Expenditure
R'000 R'000 R'000 R'000 R'000 R'000 % R'000 R'000 Current payments 108 258 1 (8 179) 100 080 100 080 - 100.0% 105 088 105 088 Compensation of employees 56 222 - (848) 55 374 55 374 - 100.0% 57 815 57 815
Salaries and wages 47 564 - 225 47 789 47 789 - 100.0% 49 893 49 893 Social contributions 8 658 - (1 073) 7 585 7 585 - 100.0% 7 922 7 922
Goods and services 52 036 1 (7 331) 44 706 44 706 - 100.0% 47 273 47 273 Advertising 2 1 (3) - - - - 2 2 Catering: Departmental activities 35 5 - 40 40 - 100.0% 108 108 Agency and support / outsourced services
37 711 (830) (149) 36 732 36 732 - 100.0% 34 086 34 086
Inventory: Learner and teacher support material
5 000 - (5 000) - - - - 1 661 1 661
Inventory: Other supplies 658 - (53) 605 605 - 100.0% 527 527 Consumable supplies 3 122 - 125 125 - 100.0% - - Transport provided: Departmental activity 5 579 - (493) 5 086 5 086 - 100.0% 6 017 6 017 Travel and subsistence 80 23 (11) 92 92 - 100.% 16 16 Training and development 2 077 - (1 622) 455 455 - 100.0% 4 643 4 643 Venues and facilities 891 680 - 1 571 1 571 - 100.0% 213 213
Transfers and subsidies 498 395 (1) (8 156) 490 238 490 238 - 100.0% 464 267 464 267 Non-profit institutions 496 323 (1) (6 733) 489 589 489 589 - 100.0% 463 536 463 536 Households 2 072 - (1 423) 649 649 - 100.0% 731 731
Social benefits 2 072 (1 423) 649 649 100.0% 731 731 Total 606 653 - (16 335) 590 318 590 318 - 100.0% 569 355 569 355

207Annual Report 2019/2020
Annual Report for 2019/20 Financial YearVote 5: Department of Education
Province of the Western Cape
�Appropriation Statement
for the year ended 31 March 2020
Subprogramme: 5.1: Grade R in Public Schools
Economic classification
2019/20 2018/19 Adjusted
Appropriation Shifting of
Funds Virement Final
Appropriation Actual
Expenditure Variance Expenditure
as % of final appropriation
Final Appropriation
Actual Expenditure
R'000 R'000 R'000 R'000 R'000 R'000 % R'000 R'000 Current payments 66 286 1 (6 382) 59 905 59 905 - 100.0% 65 043 65 043 Compensation of employees 54 987 - (822) 54 165 54 165 - 100.0% 56 725 56 725 Goods and services 11 299 1 (5 560) 5 740 5 740 - 100.0% 8 318 8 318 Transfers and subsidies 349 461 - (2 299) 347 162 347 162 - 100.0% 328 106 328 106 Non-profit institutions 347 389 - (876) 346 513 346 513 - 100.0% 327 375 327 375 Households 2 072 - (1 423) 649 649 - 100.0% 731 731 Total 415 747 1 (8 681) 407 067 407 067 - 100.0% 393 149 393 149
Subprogramme: 5.2: Grade R in Early Childhood Development Centres
Economic classification
2019/20 2018/19 Adjusted
Appropriation Shifting of
Funds Virement Final
Appropriation Actual
Expenditure Variance Expenditure
as % of final appropriation
Final Appropriation
Actual Expenditure
R'000 R'000 R'000 R'000 R'000 R'000 % R'000 R'000 Current payments - - - - - - - - - Goods and services - - - - - - - - - Transfers and subsidies 84 057 - (662) 83 395 83 395 - 100.% 74 789 74 789 Non-profit institutions 84 057 - (662) 83 395 83 395 - 100.0% 74 789 74 789 Payments for capital assets - - - - - - - - - Machinery and equipment - - - - - - - - - Total 84 057 - (662) 83 395 83 395 - 100.0% 74 789 74 789
Subprogramme: 5.3: Pre-Grade R Training
Economic classification
2019/20 2018/19 Adjusted
Appropriation Shifting of
Funds Virement Final
Appropriation Actual
Expenditure Variance Expenditure as
% of final appropriation
Final Appropriation
Actual Expenditure
R'000 R'000 R'000 R'000 R'000 R'000 % R'000 R'000 Current payments 40 737 - (1 771) 38 966 38 966 - 100.0% 38 955 38 955 Goods and services 40 737 - (1 771) 38 966 38 966 - 100.0% 38 955 38 955 Transfers and subsidies 58 578 - (5 180) 53 398 53 398 - 100.0% 47 614 47 614 Non-profit institutions 58 578 - (5 180) 53 398 53 398 - 100.0% 47 614 47 614 Total 99 315 - (6 951) 92 364 92 364 - 100.0% 86 569 86 569

208 Annual Report 2019/2020
Annual Report for 2019/20 Financial YearVote 5: Department of EducationProvince of the Western Cape
�Appropriation Statement
for the year ended 31 March 2020
Subprogramme: 5.4: Human Resource Development
Economic classification
2019/20 2018/19 Adjusted
Appropriation Shifting of
Funds Virement Final
Appropriation Actual
Expenditure Variance Expenditure as
% of final appropriation
Final Appropriation
Actual Expenditure
R'000 R'000 R'000 R'000 R'000 R'000 % R'000 R'000 Transfers and subsidies 1 (1) - - - - - - - Non-profit institutions 1 (1) - - - - - - - Total 1 (1) - - - - - - -
Subprogramme: 5.5: Conditional Grants
Economic classification
2019/20 2018/19 Adjusted
Appropriation Shifting of
Funds Virement Final
Appropriation Actual
Expenditure Variance Expenditure as
% of final appropriation
Final Appropriation
Actual Expenditure
R'000 R'000 R'000 R'000 R'000 R'000 % R'000 R'000 Current payments 1 235 - (26) 1 206 1 206 - 100.0% 1 090 1 090 Compensation of employees 1 235 - (26) 1 206 1 206 - 100.0% 1 090 1 090 Transfers and subsidies 6 298 - (15) 6 283 6 283 - 100.0% 13 758 13 758 Non-profit institutions 6 298 - (15) 6 283 6 283 - 100.0% 13 758 13 758 Total 7 533 - (41) 7 492 7 492 - 100.0% 14 848 14 848

209Annual Report 2019/2020
Annual Report for 2019/20 Financial YearVote 5: Department of Education
Province of the Western Cape
�Appropriation Statement
for the year ended 31 March 2020 Programme 6: Infrastructure Development
Subprogramme
2019/20 2018/19 Adjusted
Appropriation Shifting of
Funds Virement Final
Appropriation Actual
Expenditure Variance Expenditure
as % of final appropriation
Final Appropriation
Actual Expenditure
R'000 R'000 R'000 R'000 R'000 R'000 % R'000 R'000 1. Administration 63 202 (29 042) 702 34 862 34 862 - 100.0% 26 670 26 670 2. Public Ordinary Schools 1 652 973 44 230 90 168 1 787 371 1 780 466 6 905 99.6% 1 776 033 1 750 859 3. Special Schools 8 673 10 993 796 20 462 20 462 - 100.0% 14 913 14 913 4. Early Childhood Development 58 500 (26 181) 1 043 33 362 33 362 - 100.0% 17 928 17 928 Total 1 783 348 - 92 709 1 876 057 1 869 152 6 905 100.0% 1 835 544 1 810 370
Economic classification
2019/20 2018/19 Adjusted
Appropriation Shifting of
Funds Virement Final
Appropriation Actual
Expenditure Variance Expenditure
as % of final appropriation
Final Appropriation
Actual Expenditure
R'000 R'000 R'000 R'000 R'000 R'000 % R'000 R'000 Current payments 694 609 16 080 27 054 737 743 737 743 - 100.0% 628 897 623 176 Compensation of employees 34 361 (5 307) (1 157) 27 897 27 897 - 100.0% 26 089 26 089
Salaries and wages 34 361 (8 778) (1 157) 24 426 24 426 - 100.0% 22 880 22 880 Social contributions - 3 471 - 3 471 3 471 - 100.0% 3 209 3 209
Goods and services Advertising
660 248 6
21 387 -
28 211 -
709 846 6
709 846 6
- -
100.0% 100.0%
602 808 -
597 087 -
Minor assets Computer services
67 -
- -
1 771 84
1 838 84
1 838 84
- -
100.0% 100.0%
62 -
62 -
Consultants: Business and advisory services
349 197 - 546 546 - 100.0% - -
Infrastructure and planning services 107 272 - 13 877 121 149 121 149 - 100.0% 112 843 112 843 Legal services - - - - - - - 2 2 Contractors Inventory: Material and supplies
21 13
- -
4 -
25 13
25 13
- -
100.0% 100.0%
177 -
177 -
Inventory: Other supplies 14 264 2 935 - 17 199 17 199 - 100.0% 27 865 27 865 Consumable supplies 1 - - 1 1 - 100.0% 11 11 Property payments 538 126 18 277 12 475 568 878 568 878 - 100.0% 461 847 456 126 Travel and subsistence - 13 - 13 13 - 100.0% 1 1 Operating payments 129 (35) 94 94 100.0%
Transfers and subsidies 36 000 71 30 992 67 063 67 063 - 100.0% 63 274 63 274 Non-profit institutions 36 000 - 30 992 66 992 66 992 - 100.0% 63 274 63 274 Households Social benefits
- -
71 71
- -
71 71
71 71
- -
100.0% 100.0%
- -
- -
Payments for capital assets 1 052 739 (16 151) 34 663 1 071 251 1 064 346 6 905 99.4% 1 143 373 1 123 920 Buildings and other fixed structures 1 047 739 (12 332) 34 663 1 070 070 1 063 165 6 905 99.4% 1 143 373 1 123 920
Buildings 471 794 76 622 33 620 582 036 582 036 - 100.0% 575 568 575 568 Other fixed structures 575 945 (88 954) 1 043 488 034 481 129 6 905 100.0% 567 805 548 352
Machinery and equipment 5 000 (3 819) - 1 181 1 181 - 100.0% - - Other machinery and equipment 5 000 (3 819) - 1 181 1 181 - 100.0% - -
Total 1 783 348 - 92 709 1 876 057 1 869 152 6 905 99.6% 1 835 544 1 810 370

210 Annual Report 2019/2020
Annual Report for 2019/20 Financial YearVote 5: Department of EducationProvince of the Western Cape
�Appropriation Statement
for the year ended 31 March 2020
Subprogramme: 6.1: Administration
Economic classification
2019/20 2018/19 Adjusted
Appropriation Shifting of
Funds Virement Final
Appropriation Actual
Expenditure Variance Expenditure as
% of final appropriation
Final Appropriation
Actual Expenditure
R'000 R'000 R'000 R'000 R'000 R'000 % R'000 R'000 Current payments 38 202 (5 294) 702 33 610 33 610 - 100.0% 26 395 26 395 Compensation of employees 34 361 (5 307) (1 157) 27 897 27 897 - 100.0% 26 089 26 089 Goods and services 3 841 13 1 859 5 713 5 713 - 100.0% 306 306 Transfers and subsidies - 71 - 71 71 - 100.0% - - Households - 71 - 71 71 - 100.0% - - Payments for capital assets 25 000 (23 819) - 1 181 1 181 - 100.0% 275 275 Buildings and other fixed structures 20 000 (20 000) - - - - - 275 275 Machinery and equipment 5 000 (3 819) - 1 181 1 181 - 100.0% - - Total 63 202 (29 042) 702 34 862 34 862 - 100.0% 26 670 26 670
Subprogramme: 6.2: Public Ordinary Schools
Economic classification
2019/20 2018/19 Adjusted
Appropriation Shifting of
Funds Virement Final
Appropriation Actual
Expenditure Variance Expenditure as
% of final appropriation
Final Appropriation
Actual Expenditure
R'000 R'000 R'000 R'000 R'000 R'000 % R'000 R'000 Current payments 656 353 21 409 25 830 703 592 703 592 - 100.0% 602 481 596 760 Goods and services 656 353 21 409 25 830 703 592 703 592 - 100.0% 602 481 596 760 Transfers and subsidies 36 000 - 30 992 66 992 66 992 - 100.0% 59 757 59 757 Non-profit institutions 36 000 - 30 992 66 992 66 992 - 100.0% 59 757 59 757 Payments for capital assets 960 620 22 821 33 346 1 016 787 1 009 882 6 905 99.3% 1 113 795 1 094 342 Buildings and other fixed structures 960 620 22 821 33 346 1 016 787 1 009 882 6 905 99.3% 1 113 795 1 094 342 Total 1 652 973 44 230 90 168 1 787 371 1 780 466 6 905 99.6% 1 776 033 1 750 859
Subprogramme: 6.3: Special Schools
Economic classification
2019/20 2018/19 Adjusted
Appropriation Shifting of
Funds Virement Final
Appropriation Actual
Expenditure Variance Expenditure
as % of final appropriation
Final Appropriation
Actual Expenditure
R'000 R'000 R'000 R'000 R'000 R'000 % R'000 R'000 Current payments 54 (35) 522 541 541 - 100% - - Goods and services 54 (35) 522 541 541 - 100% - - Transfers and subsidies - - - - - - - 3 517 3 517 Non-profit institutions - - - - - - - 3 517 3 517 Payments for capital assets 8 619 11 028 274 19 921 19 921 - 100.0% 11 396 11 396 Buildings and other fixed structures 8 619 11 028 274 19 921 19 921 - 100.0% 11 396 11 396 Total 8 673 10 993 796 20 462 20 462 - 100.0% 14 913 14 913
Subprogramme: 6.4: Early Childhood Development
Economic classification
2019/20 2018/19 Adjusted
Appropriation Shifting of
Funds Virement Final
Appropriation Actual
Expenditure Variance Expenditure
as % of final appropriation
Final Appropriation
Actual Expenditure
R'000 R'000 R'000 R'000 R'000 R'000 % R'000 R'000 Current payments - - - - - - - 21 21 Goods and services - - - - - - - 21 21 Payments for capital assets 58 500 (26 181) 1 043 33 362 33 362 - 100.0% 17 907 17 907 Buildings and other fixed structures 58 500 (26 181) 1 043 33 362 33 362 - 100.0% 17 907 17 907 Total 58 500 (26 181) 1 043 33 362 33 362 - 100.0% 17 928 17 928

211Annual Report 2019/2020
Annual Report for 2019/20 Financial YearVote 5: Department of Education
Province of the Western Cape
�
Appropriation Statement for the year ended 31 March 2020
Programme 7: Examination and Education Related Services
Subprogramme
2019/20 2018/19 Adjusted
Appropriation Shifting
of Funds
Virement Final Appropriation
Actual Expenditure
Variance Expenditure as % of final
appropriation
Final Appropriation
Actual Expenditure
R'000 R'000 R'000 R'000 R'000 R'000 % R'000 R'000 1. Payments to SETA 9 927 - - 9 927 9 927 - 100.0% 9 400 9 400 2. Professional Services 145 459 4 183 10 042 159 684 159 684 - 100.0% 146 119 146 119 3. External Examinations 242 530 (2 251) 906 241 185 241 185 - 100.0% 211 133 211 133 4. Special Projects 38 918 (2 288) (10 587) 26 043 24 014 2 029 92.2% 67 495 66 664 5. Conditional Grant 21 800 356 - 22 156 22 156 - 100.0% 23 253 23 253 Total 458 634 - 361 458 995 456 966 2 029 99.6% 457 400 456 569
Economic classification
2019/20 2018/19 Adjusted
Appropriation Shifting of
Funds Virement Final
Appropriation Actual Expenditure Variance Expenditure as % of
final appropriation Final Appropriation Actual
Expenditure R'000 R'000 R'000 R'000 R'000 R'000 % R'000 R'000
Current payments 408 395 428 9 502 418 325 416 296 2 029 99.5% 375 759 374 928 Compensation of employees 333 368 656 9 083 343 107 341 078 2 029 99.4% 306 460 305 629
Salaries and wages 323 766 (3 905) - 319 861 317 832 2 029 99.4% 285 015 284 184 Social contributions 9 602 4 561 9 083 23 246 23 246 - 100.0% 21 445 21 445
Goods and services 75 027 (228) 419 75 218 75 218 - 100.0% 69 299 69 299 Administrative fees - - - - - - - 24 24 Advertising 1 9 - 10 10 - 100.0% 5 5 Minor assets - - - - - - - 14 14 Catering: Departmental activities 4 105 (2 080) - 2 025 2 025 - 100.0% 3 930 3 930 Communication (G&S) 483 63 - 546 546 - 100.0% 498 498 Computer services 2 530 - 532 532 - 100.0% 6 6 Contractors 1 161 (290) - 871 871 - 100.0% 640 640 Agency and support / outsourced services 2 728 (1 599) - 1 129 1 129 - 100.0% 2 194 2 194 Entertainment 2 (1) - 1 1 - 100.0% - - Fleet services (including government motor transport) 1 312 (64) - 1 248 1 248 - 100.0% 1 031 1 031 Inventory: Learner and teacher support material - 302 - 302 302 - 100.0% - - Inventory: Materials and supplies - - - - - - - - - Consumable supplies - 35 - 35 35 - 100.0% 59 59 Consumable: Stationery printing and office supplies 8 598 1 044 - 9 642 9 642 - 100.0% 7 022 7 022 Operating leases 8 964 1 755 - 10 719 10 719 - 100.0% 4 987 4 987 Property payments 500 (261) - 239 239 - 100.0% 405 405 Transport provided: Departmental activity - - - - - - - 30 30 Travel and subsistence 11 145 1 870 - 13 015 13 015 - 100.0% 11 952 11 952 Training and development 890 (470) - 420 420 - 100.0% 1 212 1 212 Operating payments 34 969 (1 276) - 33 693 33 693 - 100.0% 35 112 35 112 Venues and facilities - 192 - 192 192 - 100.0% 103 103 Rental and hiring 167 13 - 180 180 - 100.0% 75 75
Transfers and subsidies 50 239 (428) (9 248) 40 563 40 563 - 100.0% 80 880 80 880 Departmental agencies and accounts 9 928 (1) - 9 927 9 927 - 100.0% 9 400 9 400
Departmental agencies (non-business entities) 9 928 (1) - 9 927 9 927 - 100.0% 9 400 9 400 Non-profit institutions 40 212 (428) (10 587) 29 197 29 197 - 100.0% 68 892 68 892 Households 99 1 1 339 1 439 1 439 - 100.0% 2 588 2 588
Social benefits 99 1 1 339 1 439 1 439 - 100.0% 2 588 2 588 Other transfers to households - - - - - - - - -
Payments for capital assets - - 107 107 107 - 100.0% 761 761 Machinery and equipment - - 107 107 107 - 100.0% 761 761
Transport equipment - - - - - - - (23) (23) Other machinery and equipment - - 107 107 107 - 100.0% 784 784
Total 458 634 - 361 458 995 456 966 2 029 99.6% 457 400 456 569

212 Annual Report 2019/2020
Annual Report for 2019/20 Financial YearVote 5: Department of EducationProvince of the Western Cape
�Appropriation Statement
for the year ended 31 March 2020
Subprogramme: 7.1: Payments to SETA
Economic classification
2019/20 2018/19 Adjusted
Appropriation Shifting of
Funds Virement Final
Appropriation Actual
Expenditure Variance Expenditure
as % of final appropriation
Final Appropriation
Actual Expenditure
R'000 R'000 R'000 R'000 R'000 R'000 % R'000 R'000 Transfers and subsidies 9 927 - - 9 927 9 927 - 100.0% 9 400 9 400 Departmental agencies and accounts 9 927 - - 9 927 9 927 - 100.0% 9 400 9 400 Total 9 927 - - 9 927 9 927 - 100.0% 9 400 9 400
Subprogramme: 7.2: Professional Services
Economic classification
2019/20 2018/19 Adjusted
Appropriation Shifting of
Funds Virement Final
Appropriation Actual
Expenditure Variance Expenditure
as % of final appropriation
Final Appropriation
Actual Expenditure
R'000 R'000 R'000 R'000 R'000 R'000 % R'000 R'000 Current payments 145 459 4 183 9 083 158 725 158 725 - 100.0% 144 756 144 756 Compensation of employees 144 844 4 399 9 083 158 326 158 326 - 100.0% 144 375 144 375 Goods and services 615 (216) - 399 399 - 100.0% 381 381 Transfers and subsidies - - 959 959 959 - 100.0% 994 994 Households - - 959 959 959 - 100.0% 1 363 1 363 Payments for capital assets - - - - - - - - - Machinery and equipment - - - - - - - - - Total 145 459 4 183 10 042 159 684 159 684 - 100.0% 146 119 146 119
Subprogramme: 7.3: External Examinations
Economic classification
2019/20 2018/19 Adjusted
Appropriation Shifting of
Funds Virement Final
Appropriation Actual
Expenditure Variance Expenditure
as % of final appropriation
Final Appropriation
Actual Expenditure
R'000 R'000 R'000 R'000 R'000 R'000 % R'000 R'000 Current payments 228 371 (1 286) 419 227 504 227 504 - 100.0% 198 375 198 375 Compensation of employees 162 362 (3 629) - 158 733 158 733 - 100.0% 143 646 143 646 Goods and services 66 009 2 343 - 68 771 68 771 - 100.0% 54 729 54 729 Transfers and subsidies 14 159 (965) 380 13 574 13 574 - 100.0% 11 974 11 974 Non-profit institutions 14 067 (967) - 13 100 13 100 - 100.0% 10 749 10 749 Households 92 2 380 474 474 - 100.0% 1 225 1 225 Payments for capital assets - - 107 107 107 - 100.0% 784 784 Machinery and equipment - - 526 526 526 - 100.0% 784 784 Total 242 530 (2 251) 906 241 185 241 185 - 100.0% 211 133 211 133

213Annual Report 2019/2020
Annual Report for 2019/20 Financial YearVote 5: Department of Education
Province of the Western Cape
�Appropriation Statement
for the year ended 31 March 2020
Subprogramme: 7.5: Conditional Grant
Economic classification
2019/20 2018/19 Adjusted
Appropriation Shifting of
Funds Virement Final
Appropriation Actual
Expenditure Variance Expenditure
as % of final appropriation
Final Appropriation
Actual Expenditure
R'000 R'000 R'000 R'000 R'000 R'000 % R'000 R'000 Current payments 18 887 (1 778) - 17 109 17 109 - 100.0% 20 273 20 273 Compensation of employees 10 750 657 - 11 407 11 407 - 100.0% 6 090 6 090 Goods and services 8 137 (2 435) - 5 702 5 702 - 100.0% 14 183 14 183 Transfers and subsidies 2 913 2 134 - 5 047 5 047 - 100.0% 3 003 3 003 Non-profit institutions 2 912 2 135 - 5 047 5 047 - 100.0% 3 003 3 003 Payments for capital assets - - - - - - - (23) (23) Machinery and equipment - - - - - - - (23) (23) Total 21 800 356 - 22 156 22 156 - 100.0% 23 253 23 253
Subprogramme: 7.4: Special Projects
Economic classification
2019/20 2018/19 Adjusted
Appropriation Shifting of
Funds Virement Final
Appropriation Actual
Expenditure Variance Expenditure
as % of final appropriation
Final Appropriation
Actual Expenditure
R'000 R'000 R'000 R'000 R'000 R'000 % R'000 R'000 Current payments 15 678 (691) - 14 987 12 958 2 029 86.5% 12 355 11 524 Compensation of employees 15 412 (771) - 14 641 12 612 2 029 86.1% 12 349 11 518 Goods and services 266 80 - 346 346 - 100.0% 6 6 Transfers and subsidies 23 240 (1 597) (10 587) 11 056 11 056 - 100.0% 55 140 55 140 Non-profit institutions 23 233 (1 596) (10 587) 11 050 11 050 - 100.0% 55 140 55 140 Total 38 918 (2 288) (10 587) 26 043 24 014 2 029 92.2% 67 495 66 664

214 Annual Report 2019/2020
Annual Report for 2019/20 Financial YearVote 5: Department of EducationProvince of the Western Cape
�Notes to the Appropriation Statement
for the year ended 31 March 2020
1. Detail of transfers and subsidies as per Appropriation Act (after Virement): Detail of these transactions can be viewed in the note on Transfers and subsidies and Annexure 1 (A-H) to the Annual Financial Statements.
2. Detail of specifically and exclusively appropriated amounts voted (after Virement):
Detail of these transactions can be viewed in note 1 (Annual Appropriation) to the Annual Financial Statements.
3. Detail on payments for financial assets
Detail of these transactions per programme can be viewed in the note on Payments for financial assets to the Annual Financial Statements.
4. Explanations of material variances from Amounts Voted (after virement): 4.1 Per programme Final
Appropriation Actual
Expenditure Variance Variance
as a % of Final
Appropriation Per programme: R’000 R’000 R’000 R’000 Administration 1 634 993 1 630 972 4 021 0.2% The under-spending can mainly be attributed to: � Goods and services
- Due to cost containment measures Public Ordinary School Education 17 654 049 17 466 301 187 748 1.1% The under-spending can mainly be attributed to: � Compensation of employees
- Due to vacancies and fewer temporary appointments. - Goods and services
- Delivery of MOD furniture and equipment which could not be completed before financial year-end and for which rollovers have been requested; and
- Maths, Science & Technology Grant: Deliveries of workshop equipment, consumables, tools and machinery and laboratory equipment, which could not be completed before financial year and for which rollovers have been requested.
- National School Nutrition Programme Grant: Due to the increase in the price of milk and pilchards as a result of the contaminated products which delayed the purchasing thereof as well as the procurement of food processors, kitchen equipment and transport equipment, which could not be completed before financial year end and for which rollovers have been requested.
- Goods and services - Delivery of MOD furniture and equipment which could not be completed before
financial year-end and for which rollovers have been requested; and - Deliveries of workshop equipment, consumables, tools and machinery which could
not be completed before financial year-end and for which rollovers have been requested for the Maths, Science & Technology Grant.

215Annual Report 2019/2020
Annual Report for 2019/20 Financial YearVote 5: Department of Education
Province of the Western Cape
�Notes to the Appropriation Statement
for the year ended 31 March 2020
Independent School Subsidies 118 537 118 537 - 0.0% This programme is within budget after application of virements. Public Special School Education 1 317 074 1 314 143 2 931 0.2% The under-spending can mainly be attributed to: - Goods and services
- Learners with Profound Intellectual Disabilities Grant: Delivery and supply of Learner Training and Support Material (LTSM) toolkits and wheelchair training services to special care centres which could not be completed before financial year end and for which rollovers have been requested.
Final
Appropriation Actual
Expenditure Variance Variance
as a % of Final
Appropriation Per programme: R’000 R’000 R’000 R’000 Early Childhood Development 590 318 590 318 - 0.0%
This programme is within budget after application of virements.
Infrastructure Development 1 876 057 1 869 152 6 905 0.4% The under-spending can mainly be attributed to: - Buildings and other fixed structures:
- The funding received from the National Disaster Management during the 2019/20 financial year in aid of the storm and fire disasters that occurred for the purpose of the Knysna High School hostel reconstruction project. The services of the contractors to perform the work could not be procured and delivered given the time frame and could only be committed for the 2020/21 financial year. The funds will be surrendered to Provincial Treasury.
Examination and Education Related Services 458 995 456 966 2 029 0.4%
The under-spending can mainly be attributed to: - Compensation of employees
- Earmarked funding for the e-Learning Game Changer for graduate interns which will be surrendered to Provincial Treasury.

216 Annual Report 2019/2020
Annual Report for 2019/20 Financial YearVote 5: Department of EducationProvince of the Western Cape
�Notes to the Appropriation Statement
for the year ended 31 March 2020 4.2 Per economic classification
Final Appropriation
Actual Expenditure
Variance Variance as a % of
Final Appropriation
Per economic classification: R’000 R’000 R’000 R’000 Current expenditure Compensation of employees 17 625 635 17 474 935 150 700 0.9% Goods and services 2 523 982 2 477 953 46 029 1.8% Transfers and subsidies Departmental agencies and accounts
9 938 9 938 - 0.0%
Non-profit institutions 2 257 932 2 257 932 - 0.0% Households 108 370 108 370 - 0.0% Payments for capital assets Buildings and other fixed structures
1 070 070 1 063 165 6 905 0.6%
Machinery and equipment 50 270 50 270 - 0.0% Software and other intangible assets
952 952 - 0.0%
Payments for financial assets 2 874 2 874 - 0.0% The under-spending can mainly be attributed to: � Compensation of employees
- Due to vacancies and fewer temporary appointments; - The saving is due to unspent earmarked funding for the e-Learning for graduate interns which
will be paid over to Provincial Treasury. � Goods and services
- Due to cost containment measures - Delivery of MOD furniture and equipment which could not be completed before financial year
end and for which rollovers have been requested; and Deliveries of workshop equipment, consumables, tools and machinery and laboratory equipment, which could not be completed before financial year and for which rollovers have been requested for the Maths, Science & Technology Grant R7,376 million.
- Delivery and supply of learner training and support material (Toolkits), wheelchair training services, school furniture and office & furniture equipment for the CPSID teams which could not be completed before financial year end and for which rollovers have been requested for the Learners with Profound Intellectual Disabilities Grant for the committed funds of R2,820 million.��
- Due to the increase in the price of milk and pilchards as a result of the contaminated products which delayed the purchasing thereof as well as the procurement of food processors, kitchen equipment and transport equipment, which could not be completed before financial year end and for which rollovers have been requested for the National School Nutrition Programme Grant for the committed funds of R3,347 million
- Buildings and other fixed structures - Due to the funding received from the National Disaster Management during the 2019/20
financial year in aid of the storm and fire disasters that occurred for the purpose of the Knysna High School hostel reconstruction project. The services of the contractors to perform the work could not be procured and delivered given the time frame and could only be committed for the 2020/21 financial year. The funds will be surrendered to Provincial treasury.

217Annual Report 2019/2020
Annual Report for 2019/20 Financial YearVote 5: Department of Education
Province of the Western Cape
�Notes to the Appropriation Statement
for the year ended 31 March 2020 4.3 Per conditional grant
Final Appropriation
Actual Expenditure
Variance Variance as a % of
Final Appropriation
Per conditional grant R’000 R’000 R’000 R’000 Education Infrastructure Grant 1 134 505 1 127 600 6 905 0.6% EPWP Integrated Grant for Provinces
2 485 2 485 - 0.0%
HIV/AIDS (Life-skills Education) Grant
21 800 21 800 - 0.0%
Maths Science & Technology Grant
37 317 28 015 9 302 24.9%
National School Nutrition Programme Grant
385 202 375 515 9 687 2.5%
Social sector EPWP Incentive Grant to Provinces
17 101 17 034 67 0.4%
Learners with Profound Intellectual Disabilities Grant
26 883 23 952 2 931 10.9%
The under-spending can mainly be attributed to: • Education Infrastructure Grant:
- Due to the funding received from the National Disaster Management during the 2019/20 financial year in aid of the storm and fire disasters that occurred for the purpose of the Knysna High School hostel reconstruction project. The services of the contractors to perform the work could not be procured and delivered given the time frame and could only be committed for the 2020/21 financial year. The funds will be surrendered to Provincial Treasury.
• Maths, Science and Technology Grant:
- Due to the procurement and delivery of workshop equipment, consumables, tools and machinery and laboratory equipment, which could not be completed before financial year end and for which rollovers have been requested totalling R7,376m.
• National Schools Nutritional Programme Grant:
- Due to the increase in the price of milk and pilchards as a result of the contaminated products which delayed the purchasing thereof as well as the procurement of food processors, kitchen equipment and transport equipment, which could not be completed before financial year end. Rollovers totalling R3,347m have been requested, with the balance surrendered to Provincial Treasury.
• Social Sector EPWP Incentive Grant to Provinces:
- The grant has been spent in line with projections set as per business plan with a slight underspending of R67k.
• Learners with Profound Intellectual Disabilities Grant:
- Due to the delivery and supply of Learner Training and Support Material (LTSM) toolkits and wheelchair training services to special care centres which could not be completed before financial year end and for which rollovers have been requested totalling R2,820m, with the balance surrendered to Provincial Treasury.
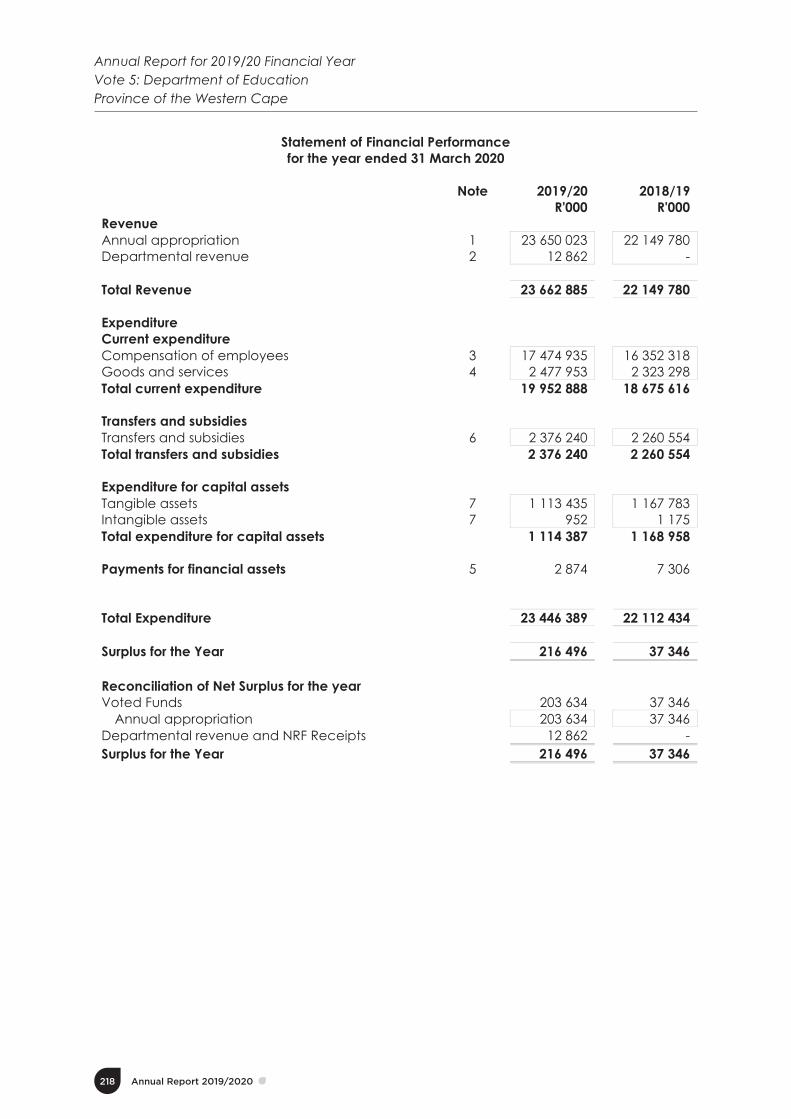
218 Annual Report 2019/2020
Annual Report for 2019/20 Financial YearVote 5: Department of EducationProvince of the Western Cape
�Statement of Financial Performance for the year ended 31 March 2020
� � Note � 2019/20 � 2018/19 � � � � R'000 � R'000 Revenue � � � � � �Annual appropriation � 1 � 23 650 023 � 22 149 780 Departmental revenue � 2 � 12 862 � - � � � � � Total Revenue � � � 23 662 885 � 22 149 780 � � � � � � �Expenditure � � � � � �Current expenditure � � � � Compensation of employees � 3 � 17 474 935 � 16 352 318 Goods and services � 4 � 2 477 953 � 2 323 298 Total current expenditure � � � 19 952 888 � 18 675 616 � � � � � � �Transfers and subsidies � � � � Transfers and subsidies � 6 � 2 376 240 � 2 260 554 Total transfers and subsidies � � � 2 376 240 � 2 260 554 � � � � � � �Expenditure for capital assets � � � � Tangible assets � 7 � 1 113 435 1 167 783 Intangible assets � 7 � 952 � 1 175 Total expenditure for capital assets � � � 1 114 387 � 1 168 958 � � � � � � �Payments for financial assets � 5 � 2 874 � 7 306 � � � � � � �� � � � � � �Total Expenditure � � � 23 446 389 � 22 112 434 � � � � � � �Surplus for the Year � � � 216 496 � 37 346 � � � � � � �Reconciliation of Net Surplus for the year � � � � � �Voted Funds � � � 203 634 � 37 346
Annual appropriation � � � 203 634 � 37 346 Departmental revenue and NRF Receipts � � � 12 862 � - Surplus for the Year � � � 216 496 � 37 346 � � � � � � �� � � � � � �

219Annual Report 2019/2020
Annual Report for 2019/20 Financial YearVote 5: Department of Education
Province of the Western Cape
�Statement of Financial Position
as at 31 March 2020
�� Note � 2019/20 � 2018/19
�� � R'000 � R'000
Assets ��
�� � �
��
�� �
Current Assets � � � 199 911 � 23 821 Cash and cash equivalents
�8
�188 888 � 15 347
Prepayments and advances �
9 �
44 � - Receivables
�10
�10 979 � 8 474
� � � � � Non-Current Assets
��
�49 992 � 48 673
Investments �
11 �
11 548 � 10 796 Receivables
�10
�38 444 � 37 877
� � � � � Total Assets � � � 249 903 � 72 494 �
��
� � � �Liabilities �
�� � � �
��
��
Current Liabilities � � 220 651 � 44 033 Voted funds to be surrendered to the Revenue Fund
�12
�203 634 33 488
Departmental revenue and PRF Receipts to be surrendered to the Revenue Fund
�13
�1 175 � 567
Payables �
14 �
15 842 � 9 978 � � � � Non-Current Liabilities � � � � � �Total Liabilities � 220 651 44 033 � � � � �Net Assets � 29 252 28 461 �
��
� � � �Represented by: �
�� �
Capitalisation reserve ��
� 11 548 � 10 796 Recoverable revenue �
�� 17 704 � 17 665
��
��
Total � 29 252 28 461

220 Annual Report 2019/2020
Annual Report for 2019/20 Financial YearVote 5: Department of EducationProvince of the Western Cape
�Statement of Changes in Net Assets
as at 31 March 2020
Note
2019/20 2018/19 R'000 R'000 Net Assets
Capitalisation Reserves Opening balance
10 796 10 020
Transfers:
Movement in Operational Funds
752 776
Closing balance
11 548 10 796 Recoverable revenue
Opening balance
17 665 23 430 Transfers
39 (5 765)
Irrecoverable amounts written off
5.2
(2 501) (5 934) Debts raised
2 540 169
Closing balance
17 704 17 665
Total
29 252 28 461

221Annual Report 2019/2020
Annual Report for 2019/20 Financial YearVote 5: Department of Education
Province of the Western Cape
�Cash Flow Statement
for the year ended 31 March 2020
�� Note � 2019/20 � 2018/19
��
� � R'000 � R'000 Cash Flows from Operating Activities �
� � Receipts �
� � 23 681 951 � 22 169 677 Annual appropriated funds received � 1.1 � 23 650 023 � 22 145 922
Departmental revenue received �
2.1 2.2 2.4
� 31 602 � 23 380
Interest received � 2.3 � 326 � 375 �
�� � �
Net (increase)/ decrease in working capital �� � 3 315 � (500 585)
Surrendered to Revenue Fund � 15� � (64 808) � (183 121) Current payments �
� � (19 952 888) � (18 675 616) Payments for financial assets � 5 � (2 874) � (7 306) Transfers and subsidies paid � 6 � (2 376 240) � (2 260 554) Net cash flow available from operating activities � 15 � 1 288 456 � 542 495 �
� � � � �Cash Flows from Investing Activities �
� � � Payments for capital assets � 7 � (1 114 387) � (1 168 958) Increase in investments Increase in non-current receivables �
11 � � (752) (567)
� (776) 3 502
Net cash flows from investing activities � � � (1 115 706) � (1 166 232) �
� � � � �Cash Flows from Financing Activities �
� � � Increase/ (decrease) in net assets �
� � 791 � (4 989) Net cash flows from financing activities � � � 791 � (4 989) �
� � � � �Net increase/ (decrease) in cash and cash equivalents �
� � 173 541 � (628 726) �
�� � � � �
Cash and cash equivalents at beginning of period �� � 15 347 � 644 073
Cash and cash equivalents at end of period � 8 16 � 188 888 � 15 347

222 Annual Report 2019/2020
Annual Report for 2019/20 Financial YearVote 5: Department of EducationProvince of the Western Cape
�Accounting Policies
for the year ended 31 March 2020
Summary of significant accounting policies The financial statements have been prepared in accordance with the following policies, which have been applied consistently in all material aspects, unless otherwise indicated. Management has concluded that the financial statements present fairly the department’s primary and secondary information. The historical cost convention has been used, except where otherwise indicated. Management has used assessments and estimates in preparing the annual financial statements. These are based on the best information available at the time of preparation. Where appropriate and meaningful, additional information has been disclosed to enhance the usefulness of the financial statements and to comply with the statutory requirements of the Public Finance Management Act (PFMA), Act 1 of 1999 (as amended by Act 29 of 1999), and the Treasury Regulations issued in terms of the PFMA and the annual Division of Revenue Act. 1. Basis of preparation
The financial statements have been prepared in accordance with the Modified Cash Standard (MCS).
2. Going concern The financial statements have been prepared on a going concern basis.
3. Presentation currency Amounts have been presented in the currency of the South African Rand (R) which is also the functional currency of the department.
4. Rounding Unless otherwise stated financial figures have been rounded to the nearest one thousand Rand (R’000).
5. Foreign currency translation Cash flows arising from foreign currency transactions are translated into South African Rands using the spot exchange rates prevailing at the date of payment/receipt.
6. Comparative information
6.1 Prior period comparative information Prior period comparative information has been presented in the current year’s financial statements. Where necessary figures included in the prior period financial statements have been reclassified to ensure that the format in which the information is presented is consistent with the format of the current year’s financial statements.
6.2 Current year comparison with budget A comparison between the approved, final budget and actual amounts for each programme and economic classification is included in the appropriation statement.

223Annual Report 2019/2020
Annual Report for 2019/20 Financial YearVote 5: Department of Education
Province of the Western Cape
�Accounting Policies
for the year ended 31 March 2020
7. Revenue 7.1 Appropriated funds
Appropriated funds comprise of departmental allocations as well as direct charges against the revenue fund (i.e. statutory appropriation). Appropriated funds are recognised in the statement of financial performance on the date the appropriation becomes effective. Adjustments made in terms of the adjustments budget process are recognised in the statement of financial performance on the date the adjustments become effective. The net amount of any appropriated funds due to/from the relevant revenue fund at the reporting date is recognised as a payable/receivable in the statement of financial position.
7.2 Departmental revenue Departmental revenue is recognised in the statement of financial performance when received and is subsequently paid into the relevant revenue fund, unless stated otherwise. Any amount owing to the relevant revenue fund at the reporting date is recognised as a payable in the statement of financial position.
7.3 Accrued departmental revenue Accruals in respect of departmental revenue (excluding tax revenue) are recorded in the notes to the financial statements when: � It is probable that the economic benefits or service potential associated with the
transaction will flow to the department; and � The amount of revenue can be measured reliably. The accrued revenue is measured at the fair value of the consideration receivable. Accrued tax revenue (and related interest and/penalties) is measured at amounts receivable from collecting agents. Write-offs are made according to the department’s debt write-off policy.
8. Expenditure 8.1 Compensation of employees 8.1.1 Salaries and wages
Salaries and wages are recognised in the statement of financial performance on the date of payment.
8.1.2 Social contributions Social contributions made by the department in respect of current employees are recognised in the statement of financial performance on the date of payment. Social contributions made by the department in respect of ex-employees are classified as transfers to households in the statement of financial performance on the date of payment.

224 Annual Report 2019/2020
Annual Report for 2019/20 Financial YearVote 5: Department of EducationProvince of the Western Cape
�Accounting Policies
for the year ended 31 March 2020
8.2 Other expenditure Other expenditure (such as goods and services, transfers and subsidies and payments for capital assets) is recognised in the statement of financial performance on the date of payment. The expense is classified as a capital expense if the total consideration paid is more than the capitalisation threshold.
8.3 Accruals and payables not recognised Accruals and payables not recognised are recorded in the notes to the financial statements at cost at the reporting date.
8.4 Leases 8.4.1 Operating leases
Operating lease payments made during the reporting period are recognised as current expenditure in the statement of financial performance on the date of payment. The operating lease commitments are recorded in the notes to the financial statements.
8.4.2 Finance leases Finance lease payments made during the reporting period are recognised as capital expenditure in the statement of financial performance on the date of payment. The finance lease commitments are recorded in the notes to the financial statements and are not apportioned between the capital and interest portions. Finance lease assets acquired at the end of the lease term are recorded and measured at the lower of: � Cost, being the fair value of the asset; or � The sum of the minimum lease payments made, including any payments made
to acquire ownership at the end of the lease term, excluding interest.
9. Aid Assistance
9.1 Aid assistance received Aid assistance received in cash is recognised in the statement of financial performance when received. In-kind aid assistance is recorded in the notes to the financial statements on the date of receipt and is measured at fair value. Aid assistance not spent for the intended purpose and any unutilised funds from aid assistance that are required to be refunded to the donor are recognised as a payable in the statement of financial position.
9.2 Aid assistance paid Aid assistance paid is recognised in the statement of financial performance on the date of payment. Aid assistance payments made prior to the receipt of funds are recognised as a receivable in the statement of financial position.

225Annual Report 2019/2020
Annual Report for 2019/20 Financial YearVote 5: Department of Education
Province of the Western Cape
�Accounting Policies
for the year ended 31 March 2020 �10. Cash and cash equivalents
Cash and cash equivalents are stated at cost in the statement of financial position. Bank overdrafts are shown separately on the face of the statement of financial position as a current liability. For the purposes of the cash flow statement, cash and cash equivalents comprise cash on hand, deposits held, other short-term highly liquid investments and bank overdrafts.
11. Prepayments and advances Prepayments and advances are recognised in the statement of financial position when the department receives or disburses the cash. Prepayments and advances are initially and subsequently measured at cost. Transport and subsistence advances are paid when an official embarks on a trip away from headquarters and makes application for the estimated costs to be incurred on official duty. On the official’s return, a claim for actual expenses will be submitted and offset against the advance paid. Any advances not settled by 31 March will be reflected in the Statement of Financial Position.
12. Loans and receivables Loans and receivables are recognised in the statement of financial position at cost plus accrued interest, where interest is charged, less amounts already settled or written-off. Write-offs are made according to the department’s write-off policy.
13. Investments Investments are recognised in the statement of financial position at cost.
14. Financial assets 14.1 Financial assets (not covered elsewhere)
A financial asset is recognised initially at its cost-plus transaction costs that are directly attributable to the acquisition or issue of the financial asset. At the reporting date, a department shall measure its financial assets at cost, less amounts already settled or written-off, except for recognised loans and receivables, which are measured at cost plus accrued interest, where interest is charged, less amounts already settled or written-off.
14.2 Impairment of financial assets Where there is an indication of impairment of a financial asset, an estimation of the reduction in the recorded carrying value, to reflect the best estimate of the amount of the future economic benefits expected to be received from that asset, is recorded in the notes to the financial statements.
15. Payables Payables are recognised in the statement of financial position at cost.

226 Annual Report 2019/2020
Annual Report for 2019/20 Financial YearVote 5: Department of EducationProvince of the Western Cape
�Accounting Policies
for the year ended 31 March 2020 16. Capital Assets 16.1 Immovable capital assets
Immovable capital assets are initially recorded in the notes to the financial statements at cost. Immovable capital assets acquired through a non-exchange transaction is measured at fair value as at the date of acquisition. Where the cost of immovable capital assets cannot be determined accurately, the immovable capital assets are measured at fair value for recording in the asset register. Immovable capital assets are subsequently carried at cost and are not subject to depreciation or impairment. Subsequent expenditure that is of a capital nature is added to the cost of the asset at the end of the capital project unless the immovable asset is recorded by another department in which case the completed project costs are transferred to that department.
16.2 Movable capital assets Movable capital assets are initially recorded in the notes to the financial statements at cost. Movable capital assets acquired through a non-exchange transaction is measured at fair value as at the date of acquisition. Where the cost of movable capital assets cannot be determined reliably, the movable capital assets are measured at fair value and where fair value cannot be determined; the movable assets are measured at R1. All assets acquired prior to 1 April 2002 (or a later date as approved by the OAG) may be recorded at R1. Movable capital assets are subsequently carried at cost and are not subject to depreciation or impairment. Subsequent expenditure that is of a capital nature forms part of the cost of the existing asset when ready for use.
16.3 Intangible assets Intangible assets are initially recorded in the notes to the financial statements at cost. Intangible assets acquired through a non-exchange transaction are measured at fair value as at the date of acquisition. Internally generated intangible assets are recorded in the notes to the financial statements when the department commences the development phase of the project. Where the cost of intangible assets cannot be determined reliably, the intangible capital assets are measured at fair value and where fair value cannot be determined; the intangible assets are measured at R1. All assets acquired prior to 1 April 2002 (or a later date as approved by the OAG) may be recorded at R1.

227Annual Report 2019/2020
Annual Report for 2019/20 Financial YearVote 5: Department of Education
Province of the Western Cape
�Accounting Policies
for the year ended 31 March 2020 16.3 Intangible assets (continued)
Intangible assets are subsequently carried at cost and are not subject to depreciation or impairment. Subsequent expenditure of a capital nature forms part of the cost of the existing asset when ready for use.
16.4.
Project Costs: Work-in-progress Expenditure of a capital nature is initially recognised in the statement of financial performance at cost when paid. Amounts paid towards capital projects are separated from the amounts recognised and accumulated in work-in-progress until the underlying asset is ready for use. Once ready for use, the total accumulated payments are recorded in an asset register. Subsequent payments to complete the project are added to the capital asset in the asset register. Where the department is not the custodian of the completed project asset, the asset is transferred to the custodian subsequent to completion. �
17. Provisions and Contingents 17.1 Provisions
Provisions are recorded in the notes to the financial statements when there is a present legal or constructive obligation to forfeit economic benefits as a result of events in the past and it is probable that an outflow of resources embodying economic benefits or service potential will be required to settle the obligation and a reliable estimate of the obligation can be made. The provision is measured as the best estimate of the funds required to settle the present obligation at the reporting date.
17.2 Contingent liabilities Contingent liabilities are recorded in the notes to the financial statements when there is a possible obligation that arises from past events, and whose existence will be confirmed only by the occurrence or non-occurrence of one or more uncertain future events not within the control of the department or when there is a present obligation that is not recognised because it is not probable that an outflow of resources will be required to settle the obligation or the amount of the obligation cannot be measured reliably.
17.3 Contingent assets Contingent assets are recorded in the notes to the financial statements when a possible asset arises from past events, and whose existence will be confirmed by the occurrence or non-occurrence of one or more uncertain future events not within the control of the department.

228 Annual Report 2019/2020
Annual Report for 2019/20 Financial YearVote 5: Department of EducationProvince of the Western Cape
�Accounting Policies
for the year ended 31 March 2020 17.4 Commitments
Commitments are recorded at cost in the notes to the financial statements when there is a contractual arrangement or an approval by management in a manner that raises a valid expectation that the department will discharge its responsibilities thereby incurring future expenditure that will result in the outflow of cash.
18. Unauthorised expenditure Unauthorised expenditure is recognised in the statement of financial position until such time as the expenditure is either: � Approved by Parliament or the Provincial Legislature with funding and the related
funds are received; or � Approved by Parliament or the Provincial Legislature without funding and is
written off against the appropriation in the statement of financial performance; or
� Transferred to receivables for recovery. Unauthorised expenditure is measured at the amount of the confirmed unauthorised expenditure.
19. Fruitless and wasteful expenditure Fruitless and wasteful expenditure is recorded in the notes to the financial statements when confirmed. The amount recorded is equal to the total value of the fruitless and or wasteful expenditure incurred. Fruitless and wasteful expenditure is removed from the notes to the financial statements when it is resolved or transferred to receivables for recovery. Fruitless and wasteful expenditure receivables are measured at the amount that is expected to be recoverable and are de-recognised when settled or subsequently written-off as irrecoverable.
20. Irregular expenditure Irregular expenditure is recorded in the notes to the financial statements when confirmed. The amount recorded is equal to the value of the irregular expenditure incurred unless it is impracticable to determine, in which case reasons therefore are provided in the note. Irregular expenditure is removed from the note when it is either condoned by the relevant authority, transferred to receivables for recovery or not condoned and is not recoverable. Irregular expenditure receivables are measured at the amount that is expected to be recoverable and are de-recognised when settled or subsequently written-off as irrecoverable.
�
�

229Annual Report 2019/2020
Annual Report for 2019/20 Financial YearVote 5: Department of Education
Province of the Western Cape
�Accounting Policies
for the year ended 31 March 2020 21. Changes in accounting policies, accounting estimates and errors
Changes in accounting policies that are affected by management have been applied retrospectively in accordance with MCS requirements, except to the extent that it is impracticable to determine the period-specific effects or the cumulative effect of the change in policy. In such instances the department shall restate the opening balances of assets, liabilities and net assets for the earliest period for which retrospective restatement is practicable. Changes in accounting estimates are applied prospectively in accordance with MCS requirements. Correction of errors is applied retrospectively in the period in which the error has occurred in accordance with MCS requirements, except to the extent that it is impracticable to determine the period-specific effects or the cumulative effect of the error. In such cases the department shall restate the opening balances of assets, liabilities and net assets for the earliest period for which retrospective restatement is practicable.
22. Events after the reporting date Events after the reporting date that are classified as adjusting events have been accounted for in the financial statements. The events after the reporting date that are classified as non-adjusting events after the reporting date have been disclosed in the notes to the financial statements.
23. Departures from the MCS requirements Management concludes that the financial statements present fairly the department’s primary and secondary information and the department has complied with the Modified Cash Standard.
24. Capitalisation reserve The capitalisation reserve comprises of financial assets and/or liabilities originating in a prior reporting period, but which are recognised in the statement of financial position. Amounts are recognised in the capitalisation reserves when identified in the current period and are transferred to the Provincial Revenue Fund when the underlying asset is disposed, and the related funds are received.
25. Recoverable revenue Amounts are recognised as recoverable revenue when a payment made in a previous financial year becomes recoverable from a debtor in the current financial year. Amounts are either transferred to the Provincial Revenue Fund when recovered or are transferred to the statement of financial performance when written-off.
26. Related party transactions A related party transaction is a transfer of resources, services or obligations between the reporting entity and a related party. Related party transactions within the Minister’s portfolio are recorded in the notes to the financial statements when the transaction is not at arm’s length.

230 Annual Report 2019/2020
Annual Report for 2019/20 Financial YearVote 5: Department of EducationProvince of the Western Cape
�Accounting Policies
for the year ended 31 March 2020
27. Key management personnel Key management personnel are those persons having the authority and responsibility for planning, directing and controlling the activities of the department. The number of individuals and their full compensation is recorded in the notes to the financial statements.
28. Inventories At the date of acquisition, inventories are recognised at cost in the statement of financial performance. Where inventories are acquired as part of a non-exchange transaction, the inventories are measured at fair value as at the date of acquisition. Inventories are subsequently measured at the lower of cost and net realisable value or where intended for distribution (or consumed in the production of goods for distribution) at no or a nominal charge, the lower of cost and current replacement value. The cost of inventories is assigned by using the weighted average cost basis.
29. Employee benefits The value of each major class of employee benefit obligation (accruals, payables not recognised and provisions) is disclosed in the Employee benefits note.

231Annual Report 2019/2020
Annual Report for 2019/20 Financial YearVote 5: Department of Education
Province of the Western Cape
�Notes to the Annual Financial Statements
for the year ended 31 March 2020
1. Appropriation 1.1 Annual Appropriation 2019/20 2018/19
Final
Appropriation Actual Funds
Received Final
Appropriation Appropriation
Received
Funds not requested/
not received
Programmes R'000 R'000 R'000 R'000 R'000 Administration 1 634 993 1 634 993 1 563 125 1 563 125 - Public Ordinary School Education 17 654 049 17 654 049 16 352 197 16 348 339 3 858 Independent School Subsidies 118 537 118 537 113 179 113 179 - Public Special School Education 1 317 074 1 317 074 1 258 980 1 258 980 - Early Childhood Development 590 318 590 318 569 355 569 355 - Infrastructure Development 1 876 057 1 876 057 1 835 544 1835 544 - Examination and Education Related Services
458 995 458 995
457 400 457 400 -
Total 23 650 023 23 650 023 22 149 780 22 145 922 3 858
2018/19 Final Appropriation and Appropriation received amounts have been restated to include the virements as per the Appropriation Statement.
Note 2019/20 2018/19 R'000 R'000
1.2 Conditional Grants** Total grants received 33 1 625 293 1 517 457 Provincial grants included in Total Grants received - -
(** It should be noted that the Conditional grants are included in the amounts per the Final Appropriation in Note 1.1)
2. Departmental Revenue Sales of goods and services other than capital assets 2.1 14 056 13 320 Fines, penalties and forfeits 2.2 1 552 1 924 Interest, dividends and rent on land 2.3 326 375 Transactions in financial assets and liabilities 2.4 15 994 8 136 Total revenue collected 31 928 23 755 Less: Own revenue included in appropriation 13 (19 066) (23 755) Departmental revenue collected 12 862 -
The department collected R12 682 million additional revenue than budgeted for.
2.1 Sales of goods and services other than capital assets 2
Sales of goods and services produced by the department 13 752 13 001
Sales by market establishment 13 752 13 001 Sales of scrap, waste and other used current goods 304 319 Total 14 056 13 320

232 Annual Report 2019/2020
Annual Report for 2019/20 Financial YearVote 5: Department of EducationProvince of the Western Cape
�Notes to the Annual Financial Statements
for the year ended 31 March 2020
� �Note 2019/20 � 2018/19
R'000 � R'000
2.2 Fines, penalties and forfeits 2 Fines 1 552 1 924 Total 1 552 1 924
2.3 Interest, dividends and rent on land 2 Interest 326 375 Total 326 375
2.4 Transactions in financial assets and liabilities 2 Receivables 3 788 6 038 Other receipts including Recoverable Revenue 12 206 2 098 Total 15 994 8 136
3. Compensation of employees 3.1 Salaries and wages Basic Salary 13 002 712 12 192 048 Performance award 14 235 20 586 Service Based 23 254 20 392 Compensative/circumstantial 233 936 206 579 Periodic payments 23 933 19 205 Other non-pensionable allowances 2 011 613 1 852 859 Total 15 309 683 14 311 669
3.2 Social contributions Employer contributions Pension 1 437 489 1 359 492 Medical 723 301 676 843 Bargaining council 1 415 1 313 Official unions and associations 3 047 3 001 Total 2 165 252 2 040 649 Total compensation of employees 17 474 935 16 352 318 Average number of employees 42 378 41 754

233Annual Report 2019/2020
Annual Report for 2019/20 Financial YearVote 5: Department of Education
Province of the Western Cape
�Notes to the Annual Financial Statements
for the year ended 31 March 2020
� �Note 2019/20 � 2018/19
R'000 � R'000
4. Goods and services Administrative fees 551 402 Advertising 10 951 7 267 Minor assets 4.1 4 527 3 606 Bursaries (employees) 3 282 1 073 Catering 12 068 13 354 Communication 6 959 7 656 Computer services 4.2 23 135 19 168 Consultants: Business and advisory services 57 882 43 130 Infrastructure and planning services 121 150 112 843 Legal services 5 333 6 266 Contractors 13 360 11 032 Agency and support / outsourced services 453 486 440 640 Entertainment 43 33 Audit cost – external 4.3 13 571 11 927 Fleet services 30 192 27 284 Inventory 4.4 505 353 543 592 Consumables 4.5 27 635 24 725 Operating leases 76 112 68 772 Property payments 4.6 678 030 563 286 Rental and hiring 465 362
Transport provided as part of the departmental activities 322 721 307 770
Travel and subsistence 4.7 40 923 39 566 Venues and facilities 6 065 7 421 Training and development 18 622 21 883 Other operating expenditure 4.8 45 537 40 240 Total 2 477 953 2 323 298
4.1 Minor Assets 4 Tangible assets 4 357 3 527 Machinery and equipment 4 357 3 527 Intangible assets 170 79 Software 170 79 Total 4 527 3 606
�

234 Annual Report 2019/2020
Annual Report for 2019/20 Financial YearVote 5: Department of EducationProvince of the Western Cape
�Notes to the Annual Financial Statements
for the year ended 31 March 20120
� �Note 2019/20 � 2018/19
R'000 � R'000
4.2 Computer Services 4 SITA computer services 14 107 12 886 External computer service providers 9 028 6 282 Total 23 135 19 168
4.3 Audit cost – external 4 Regularity audits 12 686 11 297 Computer audits 885 630 Total 13 571 11 927
The difference between the expenditure for 2018/19 and 2019/20 is due to the timing of invoices.
4.4 Inventory 4 Learning and teaching support material 163 864 142 118 Materials and supplies 268 126 Other supplies 4.4.1 341 221 401 348 Total Annex 5 505 353 543 592
4.4.1 Other supplies 4.4 Assets for distributions 341 221 401 348 Machinery and equipment 341 221 401 200 Library material - 148 Total 341 221 401 348
4.5 Consumables 4 Consumable supplies 7 128 5 008
Uniform and clothing Household supplies 301
1 214 - 1 462
Communication accessories - 17 IT consumables 331 805 Other consumables 5 282 2 724 Stationery printing and office supplies 20 507 19 717 Total 27 635 24 725
4.6 Property payments 4 Municipal services 89 082 84 999 Property maintenance and repairs 566 779 459 260 Other 22 169 19 027 Total 678 030 563 286
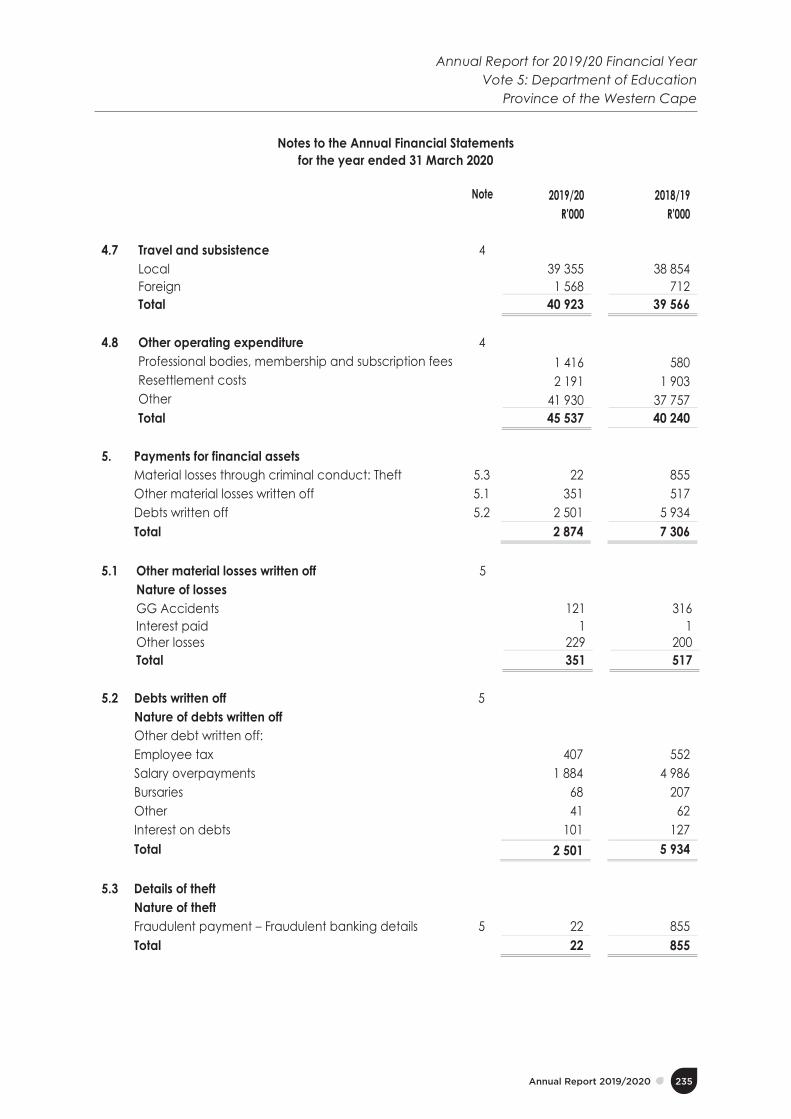
235Annual Report 2019/2020
Annual Report for 2019/20 Financial YearVote 5: Department of Education
Province of the Western Cape
�Notes to the Annual Financial Statements
for the year ended 31 March 2020
� �Note 2019/20 � 2018/19
R'000 � R'000
4.7 Travel and subsistence 4 Local 39 355 38 854 Foreign 1 568 712 Total 40 923 39 566
4.8 Other operating expenditure 4 Professional bodies, membership and subscription fees 1 416 580 Resettlement costs 2 191 1 903 Other 41 930 37 757 Total 45 537 40 240
5. Payments for financial assets Material losses through criminal conduct: Theft 5.3 22 855 Other material losses written off 5.1 351 517 Debts written off 5.2 2 501 5 934 Total 2 874 7 306
5.1 Other material losses written off 5 Nature of losses GG Accidents 121 316 Interest paid 1 1 Other losses 229 200 Total 351 517
5.2 Debts written off 5 Nature of debts written off Other debt written off: Employee tax 407 552 Salary overpayments 1 884 4 986 Bursaries 68 207 Other 41 62 Interest on debts 101 127 Total 2 501 5 934
5.3 Details of theft Nature of theft Fraudulent payment – Fraudulent banking details 5 22 855 Total 22 855

236 Annual Report 2019/2020
Annual Report for 2019/20 Financial YearVote 5: Department of EducationProvince of the Western Cape
�Notes to the Annual Financial Statements
for the year ended 31 March 2020
� �Note 2019/20 � 2018/19
R'000 � R'000 �
6. Transfers and subsidies Departmental agencies and accounts Annexure 1A 9 938 9 410 Non-profit institutions Annexure 1B 2 257 932 2 152 440 Households Annexure 1C 108 370 98 704 Total 2 376 240 2 260 554
7. Expenditure for capital assets Tangible assets 1 113 435 1 167 783 Buildings and other fixed structures 30.1 1 063 165 1 123 920 Machinery and equipment 28.1 50 270 43 863 Intangible assets 952 1 175 Software 29.1 952 1 175 Total 1 114 387 1 168 958
7.1 Analysis of funds utilised to acquire capital assets – 2019/20
Voted Funds Aid assistance
Total
Tangible assets 1 113 435 - 1 113 435 Buildings and other fixed structures 1 063 165 - 1 063 165 Machinery and equipment 50 270 - 50 270 Intangible assets 952 - 952 Software 952 - 952 Total 1 114 387 - 1 114 387
7.2 Analysis of funds utilised to acquire capital assets – 2018/19
Voted Funds Aid assistance
Total
Tangible assets 1 167 783 - 1 167 783 Buildings and other fixed structures 1 123 920 - 1 123 920 Machinery and equipment 43 863 - 43 863 Intangible assets 1 175 - 1 175 Software 1 175 - 1 175 Total 1 168 958 - 1 168 958

237Annual Report 2019/2020
Annual Report for 2019/20 Financial YearVote 5: Department of Education
Province of the Western Cape
�Notes to the Annual Financial Statements
for the year ended 31 March 2020
� �Note 2019/20 � 2018/19
R'000 � R'000 �
7.3 Finance lease expenditure included in expenditure for capital assets
Tangible assets Machinery and equipment 36 008 30 800 Total 36 008 30 800
8. Cash and cash equivalents
Consolidated Paymaster General Account Cash receipts Disbursements
212 003
- (23 115)
29 220
(4) (13 869)
Total 188 888 15 347
9. Prepayments and Advances Travel and subsistence 44 - Total 44 -
Note Balance as at 1 April 2019
Less: Received in the current
year
Add: Current Year
prepayments
Amount as at 31 March 2020
9.1 Prepayments (Expensed) R'000 R'000 R'000 R'000 Listed by economic classification Capital assets 5 765 (5 765) - - Total 5 765 (5 765) - -
The last 9 buses of the 23-seater buses were delivered in the 2019/20 financial year which were prepaid in 2017/18.
Note Balance as at 1 April 2018
Less: Received in the current
year
Add: Current Year
prepayments
Amount as at 31 March 2019
Prepayments (Expensed) R'000 R'000 R'000 R'000 Listed by economic classification Capital assets 31 829 (26 064) 5 765 Total 31 829 (26 064) 5 765

238 Annual Report 2019/2020
Annual Report for 2019/20 Financial YearVote 5: Department of EducationProvince of the Western Cape
Notes to the Annual Financial Statements for the year ended 31 March 2020
10. Receivables 2019/20 2018/19
Current Non-current
Total Current Non-current
Total
Note R’000 R’000 R’000 R’000 R’000 R’000 Claims recoverable 10.1 2 395 4 768 7 163 899 4 915 5 814 Recoverable expenditure 10.2 5 111 - 5 111 3 921 354 4 275 Staff debt 10.3 966 7 323 8 289 535 7 599 8 134 Other debtors 10.4 2 507 26 353 28 860 3 119 25 009 28 128 Total 10 979 38 444 49 423 8 474 37 877 46 351
Note 2019/20 2018/19 R'000 R'000
10.1 Claims recoverable 10 National departments 455 486 Provincial Departments 1 230 1 016 Household and non-profit institutions 5 478 4 312 Total Annexure 3 7 163 5 814
�10.2 Recoverable expenditure (disallowance accounts) 10 Disallowance accounts 1 665 1 559 Salary: Reversal Control 2 414 1 844 Salary: Tax debt 1 032 872 Total 5 111 4 275
10.3 Staff debt 10 Debt account 8 289 8 134 Total 8 289 8 134
10.4 Other debtors 10 Breach of contract 539 715 Ex-employees 25 332 20 023 State guarantees - 14 Miscellaneous 2 989 7 376 Total 28 860 28 128
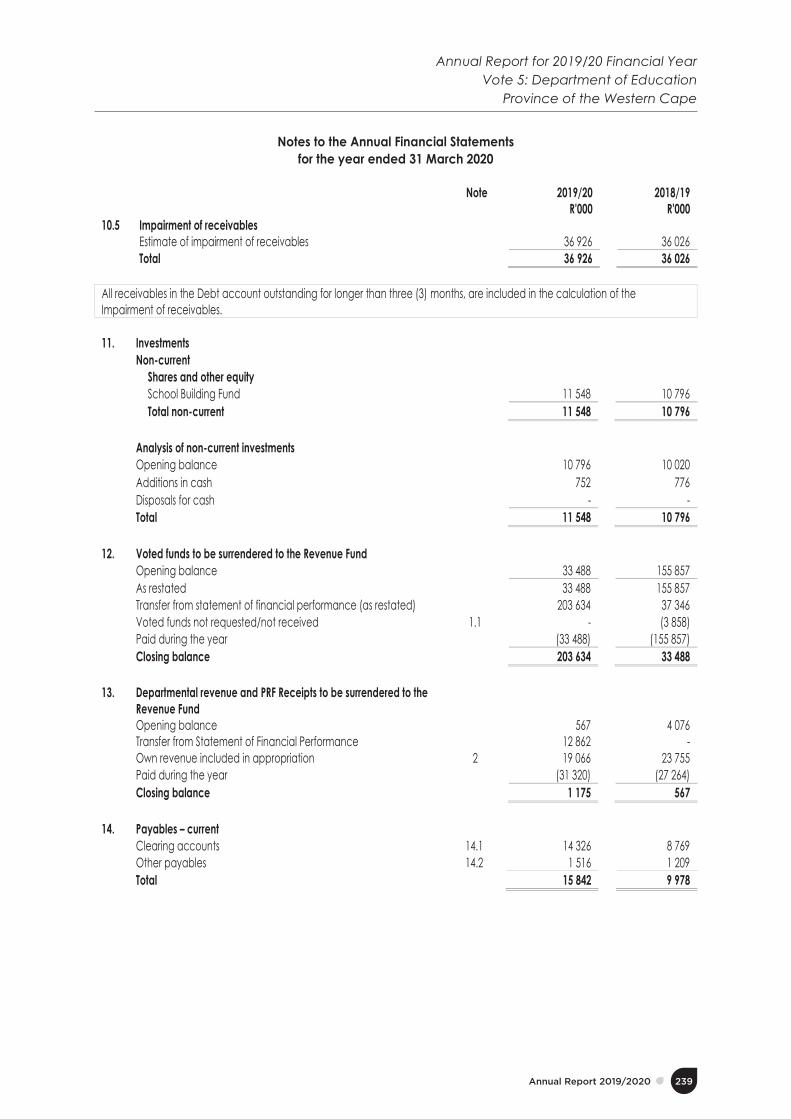
239Annual Report 2019/2020
Annual Report for 2019/20 Financial YearVote 5: Department of Education
Province of the Western Cape
Notes to the Annual Financial Statements for the year ended 31 March 2020
Note 2019/20 2018/19 R'000 R'000 10.5 Impairment of receivables Estimate of impairment of receivables 36 926 36 026 Total 36 926 36 026
All receivables in the Debt account outstanding for longer than three (3) months, are included in the calculation of the Impairment of receivables.
11. Investments Non-current Shares and other equity School Building Fund 11 548 10 796 Total non-current 11 548 10 796
Analysis of non-current investments Opening balance 10 796 10 020 Additions in cash 752 776 Disposals for cash - - Total 11 548 10 796
12. Voted funds to be surrendered to the Revenue Fund Opening balance 33 488 155 857 As restated 33 488 155 857 Transfer from statement of financial performance (as restated) 203 634 37 346 Voted funds not requested/not received 1.1 - (3 858) Paid during the year (33 488) (155 857) Closing balance 203 634 33 488
13. Departmental revenue and PRF Receipts to be surrendered to the
Revenue Fund
Opening balance Transfer from Statement of Financial Performance 567
12 862 4 076 -
Own revenue included in appropriation 2 19 066 23 755 Paid during the year (31 320) (27 264) Closing balance 1 175 567
14. Payables – current Clearing accounts 14.1 14 326 8 769 Other payables 14.2 1 516 1 209 Total 15 842 9 978

240 Annual Report 2019/2020
Annual Report for 2019/20 Financial YearVote 5: Department of EducationProvince of the Western Cape
�Notes to the Annual Financial Statements
for the year ended 31 March 2020
Note 2019/20 � 2018/19
R'000 � R'000 14.1 Payables – clearing accounts 14 Sal: ACB recalls 553 180 Sal: Income tax 7 777 2 658 Sal: Medical aid 332 52 Other deduction accounts 170 237 Disallowance: damages and losses 5 494 5 345 Adv: Public entities - 297 Total 14 326 8 769
14.2 Payables – other payables 14 Debt account credits 190 345 Sal: GEHS Refund Control 1 326 864 Total 1 516 1 209
15. Net cash flow available from operating activities Net surplus as per Statement of Financial Performance 216 496 37 346
Add back non cash/cash movements not deemed operating activities 1 071 960 505 149
(Increase)/decrease in receivables (2 505) 3 397 (Increase)/decrease in prepayments and advances (44) 3 Increase/(decrease) in payables – current 5 864 (503 985) Expenditure on capital assets 1 114 387 1 168 958 Surrenders to Revenue Fund (64 808) (183 121) Voted funds not requested/not received - (3 858) Own revenue included in appropriation 19 066 23 755 Net cash flow generated from operating activities 1 288 456 542 495
16. Reconciliation of cash and cash equivalents for cash flow
purposes
Consolidated Paymaster General account 212 003 29 220 Cash receipts - (4) Disbursements (23 115) (13 869) Total 188 888 15 347

241Annual Report 2019/2020
Annual Report for 2019/20 Financial YearVote 5: Department of Education
Province of the Western Cape
�Notes to the Annual Financial Statements
for the year ended 31 March 2020
Note 2019/20 2018/19
R'000 R'000
17. Contingent liabilities and contingent assets 17.1 Contingent liabilities Liable to Nature Housing loans guarantees Employees Annexure 2A 333 333 Claims against the department Annexure 2B 285 142 274 379
Intergovernmental payables (unconfirmed balances) Annexure 4 2 557 340
Other Annexure 2B 58 012 73 277 Total 346 044 348 329
�Financial Institutions: Financial guarantees issued relate to housing guarantees provided for employees for housing loans. Various persons (Various claims): The claims will only be settled when either the court decides that the department is liable or the department accepts the liability, both of which are unknown. Intergovernmental payables (unconfirmed balances): Inter-government payables relate to unconfirmed balances outstanding at year end Municipalities: The closing balance represents the total of outstanding municipal service accounts of schools as at 31 March 2020. It is not possible to determine the total amount of municipal services accounts of schools incurred and paid/cancelled/reduced during the year as these accounts are also settled directly by schools.
�17.2 Contingent assets
� At this stage the Department is not able to reliably measure the contingent asset as the funds that are held by SA Home
Loans in respect of the Government Employees Housing Scheme (GEHS) of the Individually Linked Savings Facility (ILSF) may be returned to the Department in cases of resignations and dismissals.
18. Capital commitments
Infrastructure: Non-residential buildings Moveable Tangible Capital assets 756 486
415 726 865 1 707
Total 756 901 728 572
The Modified Cash Standard has been revised in respect of the disclosure of commitments, which only includes commitments for the capital expenditure. In the 2018/19 AFS, current and capital commitments amounted to R1 608,991m, which consisted of Capital commitments of R639,778 and Current Commitments of R 969,213m. 2018/19 Capital commitments have also been restated due to additional Infrastructure commitments and Movable capital assets previously excluded. Infrastructure commitments represent contracts for the Prefabricated classrooms and building of schools which are for longer than a year. Movable tangible capital assets represent outstanding LOGIS orders placed with suppliers.

242 Annual Report 2019/2020
Annual Report for 2019/20 Financial YearVote 5: Department of EducationProvince of the Western Cape
�Notes to the Annual Financial Statements
for the year ended 31 March 2020
Note 2019/20 2018/19
R'000 R'000 19 Accruals and payables not recognised 19.1 Accruals Listed by economic classification 30 days 30+ days Total Total Goods and services 32 586 5 441 38 027 27 708 Transfers and subsidies 652 60 712 2 122 Capital assets 23 990 1 196 25 186 53 485 Total 57 228 6 697 63 925 83 315
Listed by programme level Programme 1 12 488 5 395 Programme 2 20 793 16 969 Programme 4 1 508 8 Programme 5 11 449 Programme 6 26 444 58 275 Programme 7 2 681 2 219 Total 63 925 83 315
19.2 Payables not recognised Listed by economic classification 30 days 30+ days Total Total Goods and services 46 661 4 404 51 065 29 698 Transfers and subsidies 461 502 963 252 Capital assets 52 655 1 441 54 096 15 532 Other - - - 3 666 Total 99 777 6 347 106 124 49 148
Listed by programme level Programme 1 10 484 8 995 Programme 2 8 737 6 891 Programme 4 19 - Programme 5 9 577 34 Programme 6 77 078 33 187 Programme 7 229 41 Total 106 124 49 148
Included in the above totals are the following Confirmed balances with departments Annexure 4 - 3 666 Total - 3 666
20. Employee benefits Leave entitlement 85 000 75 877 Service bonus (thirteenth cheque) 461 869 436 647 Performance awards 11 374 19 702 Capped leave commitments 778 205 841 496 Other 95 488 77 805 Total 1 431 936 1 451 527
�
The amount for leave entitlement includes a negative amount of R933 731.59 in respect of leave taken on the total number of days one is eligible for but exceeding the pro-rata as at 31 March 2020.At this stage the department is not able to reliably measure the long term portion of the long service awards.

243Annual Report 2019/2020
Annual Report for 2019/20 Financial YearVote 5: Department of Education
Province of the Western Cape
�Notes to the Annual Financial Statements
for the year ended 31 March 2020
Note 2019/20
R'000 21. Lease commitments 21.1 Operating leases expenditure
Buildings and
other fixed structures
Machinery and
equipment
Total
2019/20 R’000 R’000 R’000 Not later than a year 62 424 4 784 67 208 Later than 1 year and not later than 5 years 139 637 1 013 140 650 Later than 5 years 88 118 232 88 350 Total lease commitments 290 179 6 029 296 208
Buildings and
other fixed structures
Machinery and
equipment
Total
2018/19 R’000 R’000 R’000 Not later than a year 59 001 7 197 66 198 Later than 1 year and not later than 5 years 95 246 1 949 97 195 Later than 5 years 47 553 425 47 978 Total lease commitments 201 800 9 571 211 371
Buildings: Lease commitments for school buildings are calculated based on a contractual obligation between the lessee and the lessors. A fixed annual escalation of between 0.00% and 16.67 % or the applicable CPIX linked inflation rate is catered for in these calculations.� For the reporting period the department made provision for 257 facilities. The department capped leases for a maximum period of 20 years. In the case of renewal of expired leases, the commitment is for a three-year period. The department may not sub-lease without the consent of the owner. Maintenance of the property is shared by the department and the owner. Machinery and equipment: The major portion of this commitment relates to photocopier equipment.
21.2 Finance leases expenditure
Machinery
and equipment
Total
2019/20 R’000 R’000 Not later than a year 32 642 32 642 Later than 1 year and not later than 5 years 42 122 42 122 Later than 5 years 672 672 Total lease commitments 75 436 75 436
� � Machinery
and equipment
Total
2018/19 R’000 R’000 Not later than a year 28 470 28 470 Later than 1 year and not later than 5 years 47 491 47 491 Later than 5 years 1 716 1 716 Total lease commitments 77 677 77 677
The department of Education leased 505 vehicles from GMT during 2019/2020. Daily tariffs are payable on a monthly basis, covering the operational costs and capital costs towards the replacement of vehicles, and the implicit financial costs in this type of arrangement.

244 Annual Report 2019/2020
Annual Report for 2019/20 Financial YearVote 5: Department of EducationProvince of the Western Cape
Notes to the Annual Financial Statements for the year ended 31 March 2020
2019/20 2018/19 22. Irregular expenditure Note R'000 R'000 22.1 Reconciliation of irregular expenditure Opening balance - As restated - - Add: Irregular expenditure – relating to prior year 1 845 163 Add: Irregular expenditure – relating to current year 1 430 22 Less: Prior year amounts condoned (163) Less: Current year amounts condoned (22)
Closing balance 3 275 -
Analysis of awaiting condonation per age classification Current year 1 430 - Prior year 1 845 -
Total 3 275 -
2019/20
22.2 Details of current and prior irregular expenditure – added current year (under determination and investigation) R'000
Incident Disciplinary steps taken/ criminal proceedings
Procurement Management - Contract expansions and extensions (2 cases) None 5
Non-compliance with Treasury Regulations - Insufficient quotations (24 cases)
None 2 558
Non-compliance with Preferential Procurement Regulations - Award (2 cases)
None 180
Non-compliance with Treasury Regulations - Deviations not justified (13 cases)
None 532
Total 3 275
2019/20
22.3 Details of irregular expenditure under assessment (not included in main note) R'000
Incident Procurement Management - Contract expansions and extensions (3 cases) 66 440 Non-compliance with Treasury Regulations - Insufficient quotations (12 cases) 304 Non-compliance with Treasury Regulations - Deviations not justified (4 cases) 1 133 Non-compliance with Public Service Act - Appointment process (2 cases) 11 Non-compliance with Treasury Regulations - Tax status (2 cases) 78 Non-compliance with Treasury Regulations- Splitting of quotes (3 cases) 1 098 Non-compliance with Treasury Regulations - Fairness in procurement (1 case) 39
Total 69 103 �

245Annual Report 2019/2020
Annual Report for 2019/20 Financial YearVote 5: Department of Education
Province of the Western Cape
Notes to the Annual Financial Statements for the year ended 31 March 2020
2019/20 2018/19 23. Fruitless and wasteful expenditure Note R'000 R'000 23.1 Reconciliation of fruitless and wasteful expenditure Opening balance - - As restated - - Fruitless and wasteful expenditure – relating to prior year 6 6 Fruitless and wasteful expenditure – relating to current year 2 24
Less: Amounts recoverable Less: Amounts Written Off -
(8) -
(30) Closing balance - -
23.2 Details of current and prior year fruitless and wasteful-added current year (under determination and investigation)
2019/20
Incident Disciplinary steps taken/criminal proceedings R'000 Catering (16 cases) None 5 Interest (6 cases) None 1 Other (3 cases) None 2 Total 8
23.3 Details of fruitless and wasteful expenditure written off Incident Catering (16 cases) 5 Interest (6 cases) 1 Other (3 cases) 2 Total 8
23.4 Details of fruitless and wasteful expenditure under investigation (not in the main note)
Incident Interest (5 cases) 2 Total 2

246 Annual Report 2019/2020
Annual Report for 2019/20 Financial YearVote 5: Department of EducationProvince of the Western Cape
Notes to the Annual Financial Statements for the year ended 31 March 2020
24 Related party transactions Related party relationships
1. The transactions relating to public ordinary schools are disclosed under Annexure 1B. 2. During the year the Department received services from the Western Cape Department of Transport and Public Works
(DTPW) as follows: - The Department occupies a building managed by the DTPW, free of charge. Parking space is also provided to
government officials at an approved fee which is not market related. - The Department makes use of government motor vehicles managed by the Government Motor Transport (GMT)
Section of the DTPW in terms of an arm’s length transaction at tariffs approved by the Provincial Treasury. 3. The Department received corporate services from the Department of the Premier (DOTP) Western Cape as follows:
- Information and Communication Technology - Organisation Development - Provincial Training (transversal) - Enterprise Risk Management - Internal Audit - Provincial Forensic Services - Legal Services - Corporate Communication
4. The Department received security advisory services and security operations from the Department of Community Safety Western Cape.
5. The Department has the Western Cape Schools Evaluation Authority under its control
25. Key management personnel
No of individuals
2019/20 2018/19
R'000 R'000 Political office bearers 1 1 978 1 978 Officials: Management 21 23 719 23 529 Family members of key management personnel 10 7 941 3 244
Total 33 638 28 751
Key Management includes all officials who have significant influence over the financial and operational policy decisions of the department.

247Annual Report 2019/2020
Annual Report for 2019/20 Financial YearVote 5: Department of Education
Province of the Western Cape
Notes to the Annual Financial Statements for the year ended 31 March 2020
Note 2019/20 R'000
�27 Non-adjusting events after reporting date
The Department has assessed the impact of the COVID 19 pandemic that resulted in a National lock- down from 27 March 2020. No further reporting of information in the 2019/20 AFS is deemed material due to COVID 19 pandemic. The Department adjusted its planned deliverables for 2020/21 to provide for the impact of the COVID-19 pandemic and all Covid-19 related costs will be reflected in the 2020/21 AFS.
28 Movable Tangible Capital Assets Movement in movable tangible capital assets per asset register for the year ended 31 March 2020
Opening balance
Value adjustments
Additions Disposals Closing balance
R’000 R’000 R’000 R’000 R’000 Machinery and equipment 96 591 - 20 149 (12 166) 104 574
Transport assets 52 - 6 177 (6 177) 52 Computer equipment 52 361 - 10 574 (4 852) 58 083 Furniture and office equipment 38 888 - 3 398 (431) 41 855 Other machinery and equipment 5 290 - - (706) 4 584 Total movable tangible capital assets 96 591 - 20 149 (12 166) 104 574
Information on Transport assets (GG Vehicle Finance lease assets) for the current and comparative years is disclosed in Annexure 7 to the AFS.
28.1 Additions Additions to movable tangible capital assets per asset register for the year ended 31 March 2020
Cash Non-Cash (Capital work-in-progress current
costs and finance lease payments)
Received current not paid (Paid
current year received prior
year)
Total
R’000 R’000 R’000 R’000 R’000 Machinery and equipment 50 270 5 887 (36 008) - 20 149
Transport assets 36 420 5 765 (36 008) - 6 177 Computer equipment 10 552 22 - - 10 574 Furniture and office equipment 3 298 100 - - 3 398 Total additions to movable tangible capital assets 50 270 5 887 (36 008) - 20 149
Non-cash additions include R5,765 million for the remaining of 9 of 23 buses which were expensed as a prepayment during 2017/18. Cash additions include R412 000 for top-up to the buses due to price variations.

248 Annual Report 2019/2020
Annual Report for 2019/20 Financial YearVote 5: Department of EducationProvince of the Western Cape
�Notes to the Annual Financial Statements
for the year ended 31 March 2020 28.2 Disposals Disposals of movable tangible capital assets per asset register for the year ended 31 March 2020
Sold for cash Non-cash
disposal Total
disposals Cash
received actual
R’000 R’000 R’000 R’000 Machinery and equipment - (12 166) (12 166) -
Transport assets - (6 177) (6 177) - Computer equipment - (4 852) (4 852) - Furniture and office equipment - (431) (431) - Other machinery and equipment - (706) (706) - Total disposal of movable tangible capital assets - (12 166) (12 166) -
Non-cash disposals include R6,177 million for buses for schools.
28.3 Movement for 2018/19 Movement in movable tangible capital assets per asset register for the year ended 31 March 2019
Opening balance Prior period error Additions Disposals Closing balance
R’000 R’000 R’000 R’000 R’000 Machinery and equipment 87 282 (125) 39 153 (29 719) 96 591
Transport assets 52 - 26 064 (26 064) 52 Computer equipment 46 595 - 8 839 (3 073) 52 361 Furniture and office equipment 35 768 - 3 592 (472) 38 888 Other machinery and equipment 4 867 (125) 658 (110) 5 290
Total movable tangible capital assets 87 282 (125) 39 153 (29 719) 96 591
28.3.1 2018/19 Prior period error Note R'000 Nature of prior period error Relating to 2018/19 financial year (125) Restatement of opening balances- Other Machinery and equipment (125)
Total (125)
On other machinery and equipment (Library) each title in a set was loaded with a set price in 2012 which has now been corrected to reflect cost price per book instead.

249Annual Report 2019/2020
Annual Report for 2019/20 Financial YearVote 5: Department of Education
Province of the Western Cape
�Notes to the Annual Financial Statements
for the year ended 31 March 2020
28.5 Minor assets Movement in minor assets per the asset register for the year ended 31 March 2020
Intangible
assets Machinery
and equipment
Total
R’000 R’000 R’000 Opening balance 1 808 72 537 74 345 Additions 170 7 844 8 014 Disposals (475) (3 664) (4 139)
Total minor assets 1 503 76 717 78 220
Intangible
assets Machinery
and equipment
Total
Number of R1 minor assets - 27 361 27 361 Number of minor assets at cost 389 197 667 198 056 Total number of minor assets 389 225 028 225 417
Minor assets Movement in minor assets per the asset register for the year ended 31 March 2019
Intangible
assets Machinery
and equipment
Total
R’000 R’000 R’000 Opening balance 1 729 73 956 75 685 Prior period error - (625) (625) Additions 79 3 600 3 679 Disposals - (4 394) (4 394)
Total minor assets 1 808 72 537 74 345
Intangible
assets Machinery
and equipment
Total
Number of R1 minor assets - 35 646 35 646 Number of minor assets at cost 473 198 482 198 955 Total number of minor assets 473 234 128 234 601
28.6 Prior period error Note 2018/19 R'000 Nature of prior period error Relating to 2018/19 (625) Restatement of opening balances- Machinery and equipment (625)
Total (625) �
On machinery and equipment- minor assets (Library) each title in a set was loaded with a set price in 2012 which has now been corrected to reflect cost price per book instead. Previously major asset because of value have now been reclassified to be minor assets due to correction.

250 Annual Report 2019/2020
Annual Report for 2019/20 Financial YearVote 5: Department of EducationProvince of the Western Cape
�Notes to the Annual Financial Statements
for the year ended 31 March 2020
28.5 Movable assets written off Movable assets written off for the year ended 31 March 2020
Machinery
and equipment
Total
R’000 R’000 Assets written off 6 156 6 156
Total movable assets written off 6 156 6 156
Movable assets written off for the year ended 31 March 2019
Machinery
and equipment
Total
R’000 R’000 Assets written off 7 509 7 509
Total movable assets written off 7 509 7 509
29. Intangible Capital Assets Movement in intangible capital assets per asset register for the year ended 31 March 2020
Opening balance
Value adjustments
Additions Disposals Closing balance
R’000 R’000 R’000 R’000 R’000 Software 22 899 - 952 (5 548) 18 303
Total intangible capital assets 22 899 - 952 (5 548) 18 303
29.1 Additions to intangible capital assets per asset register for the year ended 31 March 2020
Cash Non-Cash (Development work-in-
progress current
costs)
Received current not paid (Paid
current year received
prior year)
Total
R’000 R’000 R’000 R’000 R’000 Software 952 - - - 952
Total additions to intangible capital assets 952 - - - 952
29.2 Disposal of intangible capital assets per asset register for the year ended 31 March 2020
Sold for
cash Non-cash
disposal Total
disposals Cash
received Actual
R’000 R’000 R’000 R’000 Software - (5 548) (5 548) -
Total additions to intangible capital assets - (5 548) (5 548) -

251Annual Report 2019/2020
Annual Report for 2019/20 Financial YearVote 5: Department of Education
Province of the Western Cape
�Notes to the Annual Financial Statements
for the year ended 31 March 2020
29.3 Movement for 2018/19 Movement in intangible capital assets per asset register for the year ended 31 March 2019
Opening balance
Prior Period error
Additions Disposals Closing balance
R’000 R’000 R’000 R’000 R’000 Software 21 724 - 1 175 - 22 899
Total intangible capital assets 21 724 - 1 175 - 22 899
30. Immovable tangible capital assets Movement in immovable tangible capital assets per asset register for the year ended 31 March 2020
Opening balance
Value adjustments
Additions Disposals Closing balance
R’000 R’000 R’000 R’000 R’000 Buildings and other fixed structures 3 549 652 - 783 040 (16 186) 4 316 506 Non-residential buildings 3 549 652 - 783 040 (16 186) 4 316 506
Total immovable tangible capital assets 3 549 652 - 783 040 (16 186) 4 316 506
30.1 Additions Additions to immovable tangible capital assets per asset register for the year ended 31 March 2020
Cash Non-Cash (Capital work-in-progress current
costs and finance lease payments)
Received current not paid
(Paid current year received
prior year)
Total
R’000 R’000 R’000 R’000 R’000 Buildings and other fixed structures 1 063 165 657 048 (922 842) (14 331) 783 040 Non-residential buildings 1 063 165 657 048 (922 842) (14 331) 783 040
Total additions to immovable tangible capital assets 1 063 165 657 048 (922 842) (14 331) 783 040
30.2 Disposals Disposals of immovable tangible capital assets per asset register for the year ended 31 March 2020
Sold for cash Non-cash disposal
Total disposals Cash received actual
R’000 R’000 R’000 R’000 Buildings and other fixed structures (16 186) (16 186) -
Non-residential buildings (16 186) (16 186) -
Total disposal of immovable tangible capital assets (16 186) (16 186) -

252 Annual Report 2019/2020
Annual Report for 2019/20 Financial YearVote 5: Department of EducationProvince of the Western Cape
Notes to the Annual Financial Statements for the year ended 31 March 2020
30.3 Movement for 2018/19 Movement in immovable tangible capital assets per asset register for the year ended 31 March 2019 Opening
balance Prior Period error Additions Disposals Closing balance
R’000 R’000 R’000 R’000 R’000 Buildings and other fixed structures 4 330 563 95 534 546 969 (1 423 414) 3 549 652 Non-residential buildings 4 330 563 95 534 546 969 (1 423 414) 3 549 652
Total immovable tangible capital assets 4 330 563 95 534 546 969 (1 423 414) 3 549 652
2018/19 30.3.1 Prior period error Note R’000 Nature of period error
Relating to 2018/19 (affecting the opening balance) 95 534 Buildings - Ready for use asset register 52 239 Prefabricated assets - Ready for use asset register 43 295 Total 95 534
Buildings - Ready for use asset register was restated as a result of timing difference of assets being ready for use and calculation errors that were discovered on certain projects, the project costs were then recalculated using BAS reports. Prefabricated assets - Ready for use asset register was restated as result of applying practical completion (PC) date to identify assets that are ready for use instead of previous method used which relied on barcoding only.
30.4 Capital Work-in-progress Capital Work-in-Progress as at 31 March 2020
Note Opening Balance
1 April 2019
Current Year WIP
Ready for use (Assets to the AR) /
Contracts terminated
Closing Balance
31 March 2020
Annexure 6 R’000 R’000 R’000 R’000 Buildings and other fixed structures 1 060 699 922 842 (658 171) 1 325 370 Total 1 060 699 922 842 (658 171) 1 325 370
Age analysis on ongoing projects Number of projects 2019/20
0 to 1 year
Planned construction not started Planned construction started
Total R'000
35 31 483 482 1 to 3 year(s) 28 20 742 022 3 to 5 years 7 2 99 866 Longer than 5 years - - - Total 70 53 1 325 370

253Annual Report 2019/2020
Annual Report for 2019/20 Financial YearVote 5: Department of Education
Province of the Western Cape
Notes to the Annual Financial Statements for the year ended 31 March 2020
2019/20 2018/19 Payables not recognised relating to Capital WIP R’000 R’000
Amounts relating to progress certificates received but not paid at year end and therefore not included in capital work-in-progress 32 434 13 058
Total 32 434 13 058 �
2018/19 amount of Payables not recognised relating to Capital Work In Progress has been restated and disclosed in 2019/20. �
Capital Work-in-Progress as at 31 March 2019
Note Opening Balance
Prior period error
Current Year WIP
Ready for use (Assets to the
AR) / Contracts terminated
Closing
Balance 31 March
2017 Annexure 6 R’000 R’000 R’000 R’000 R’000 Buildings and other fixed structures 31.1 557 699 (6 835) 1 123 920 (614 085) 1 060 699
Total 557 699 (6 835) 1 123 920 (614 085) 1 060 699
2018/19 Work in Progress register was restated for the following: Prefabricated assets –was restated as a result of the adjustment for the timing differences of task order payments and assets being ready for use. Buildings - was restated as a result of timing differences of assets being ready for use and calculation errors that were discovered on certain projects, the project costs were then recalculated using BAS reports.
Age analysis on ongoing projects Number of projects 2018/19
Planned construction not started
Planned construction started
Total R'000
0 to 1 year 16 62 597 092 1 to 3 year(s) 26 8 447 496 3 to 5 years 3 - 16 111 Longer than 5 years - - - Total 45 70 1 060 699

254 Annual Report 2019/2020
Annual Report for 2019/20 Financial YearVote 5: Department of EducationProvince of the Western Cape
Notes to the Annual Financial Statements for the year ended 31 March 2020
31 Prior period errors 2018/19
Note Amount before error
correction
Prior period error
Restated amount
31.1 Correction of prior period errors R’000 R’000 R’000 Assets: Movable Tangible capital assets 28
Restatement of opening balances- Other Machinery and equipment
28.3 180 198 (125) 180 073
Restatement of opening balances- Machinery and equipment (minor assets)
28.4 73 956 (625) 73 331
Assets: Immovable Tangible capital assets
Restatement of opening balances- Buildings and Prefabricated assets – Immovable assets
30.3 4 330 563 95 534 4 426 097
Restatement of opening balances for Work in Progress - Buildings and Prefabricated assets (Immovable assets)
30.4 557 699 (6 835) 550 864
Net effect 5 142 416 87 949 5 230 365
Other machinery and equipment (Library) - each title in a set was loaded with a set price in 2012 which has now been corrected to reflect cost price per book instead. Machinery and equipment- minor assets (Library)- each title in a set was loaded with a set price in 2012 which has now been corrected to reflect cost price per book instead. Previously major asset because of value have now been reclassified to be minor assets due to correction. Buildings - Ready for Use asset register was restated as a result of timing difference of assets being ready for use and calculation errors that were discovered on certain projects, the project costs were then recalculated using BAS reports. Prefabricated assets Ready for Use asset register was restated as result of applying the practical completion (PC) date to identify assets that are ready for use instead of previous method used which relied on barcoding only. 2018/19 Work in Progress register was restated for the following: Prefabricated assets –was restated as a result of the adjustment for the timing differences of task order payments and assets being ready for use. Buildings - was restated as a result of timing difference of assets being ready for use and calculation errors that were discovered on certain projects, the project costs were then recalculated using BAS reports.

255Annual Report 2019/2020
Annual Report for 2019/20 Financial YearVote 5: Department of Education
Province of the Western Cape
Notes to the Annual Financial Statements for the year ended 31 March 2020
2018/19
Note Amount before error
correction
Prior period error
Restated amount
31.1 Correction of prior period errors (Continued) R’000 R’000 R’000 Capital commitments 18 Infrastructure: Non-residential buildings 18 639 778 87 087 726 865 Movable Tangible Capital assets 18 - 1 707 1 707 639 778 88 794 728 572
2018/19 Capital commitments have been restated due to additional Infrastructure commitments and Movable capital assets previously excluded.
32 Inventories 32.1 Inventories for the year ended 31 March 2020
Note
Learning and
Teaching Support Material
Materials &
Supplies
Assets for distribution: Machinery
& Equipment
Prior period
error
Total
Annexure 5 R’000 R’000 R’000 R’000 R’000 Add: Additions/Purchases - Cash 163 864 268 341 221 - 505 353 (Less): Issues (163 864) (268) (341 221) - (505 353)
Closing balance - - - - -
Inventories for the year ended 31 March 2019
Note
Learning and
Teaching Support Material
Materials &
Supplies
Assets for distribution: Machinery
& Equipment
Prior period
error
Total
Annexure 5 R’000 R’000 R’000 R’000 R’000 Add: Additions/Purchases - Cash 142 118 126 401 348 - 543 592 (Less): Issues (142 118) (126) (401 348) - (543 592)
Closing balance - - - - -

256 Annual Report 2019/2020
Annual Report for 2019/20 Financial YearVote 5: Department of EducationProvince of the Western Cape
�Notes to the Annual Financial Statements
for the year ended 31 March 2020
33. Statement of Conditional Grants received
Name of Grant
Grant Allocation Spent 2018/19 Division of Revenue
Act/Provincial Grants
Roll Overs
DORA Adjustments
Other Adjustments
Total Available
Amount received
by department
Amount spent by
department
Under / (over-
spending)
% of available
funds spent by
department
Division of Revenue
Act
Amount spent by
department
R'000 R'000 R'000 R'000 R'000 R'000 R'000 R'000 % R'000 R'000 Education Infrastructure Grant
1 109 331 25 174 - - 1 134 505 1 134 505 1 127 600 6 905 99% 1 046 905 1 021 731
EPWP Integrated Grant for Provinces
2 485 - - - 2 485 2 485 2 485 - 100% 2 221 2 221
HIV/AIDS (Life-skills Educ) Grant
21 800 - - - 21 800 21 800 21 800 - 100% 22 043 22 043
Maths Science & Technology Grant
34 416 2 901 37 317 37 317 28 015 9 302 75% 32 583 29 682
National School Nutrition Programme Grant
385 202 - - - 385 202 385 202 375 515 9 687 97% 357 097 357 097
Social sector EPWP Incentive Grant to Provinces
17 101 - - - 17 101 17 101 17 034 67 99.6% 30 402 30 402
Learners with Profound Intellectual Disabilities Grant
26 198 685 - - 26 883 26 883 23 952 2 931 89% 26 206 25 521
1 596 533 28 760 - - 1 625 293 1 625 293 1 596 401 28 892 - 1 517 457 1 488 697

257Annual Report 2019/2020
Annual Report for 2019/20 Financial YearVote 5: Department of Education
Province of the Western Cape
�Annexures to the Annual Financial Statements
for the year ended 31 March 2020
Annexure 1A Statement of transfers to Departmental Agencies and Accounts
Transfer Allocation Transfer 2018/19 Adjusted
appropriation Roll Overs Adjustments Total
Available Actual
Transfer % of Available
funds transferred
Appropriation Act
Department/Agency/Account R'000 R'000 R'000 R'000 R'000 % R'000
SETA 9 927 - - 9 927 9 927 100% 9 400 SABC TV licence 10 - 1 11 11 100% 10 Total 9 937 - 1 9 938 9 938 9 410

258 Annual Report 2019/2020
Annual Report for 2019/20 Financial YearVote 5: Department of EducationProvince of the Western Cape
�Annexures to the Annual Financial Statements
for the year ended 31 March 2020 Annexure 1B Statement of transfers to non-profit institutions
Transfer Allocation Expenditure 2018/19 Adjusted
appropriation Act
Roll Overs
Adjustments Total Available
Actual Transfer
% of Available
funds transferred
Appropriation Act
Non-Profit Institutions R'000 R'000 R'000 R'000 R'000 % R'000 Transfers Public Ordinary schools 1 357 695 - 111 385 1 469 080 1 469 080 100% 1 394 805 Independent schools 119 510 - (973) 118 537 118 537 100% 113 179 Schools for learners with special education needs 178 320 - 2 406 180 726 180 726 100% 180 920 ECD: Gr R Public Schools 347 390 - (877) 346 513 346 513 100% 327 375 ECD: Gr R Community Centres 84 057 - (662) 83 395 83 395 100% 74 789 ECD: Learnerships 64 876 - (5 195) 59 681 59 681 100% 61 372 Total 2 151 848 - 106 084 2 257 932 2 257 932 2 152 440

259Annual Report 2019/2020
Annual Report for 2019/20 Financial YearVote 5: Department of Education
Province of the Western Cape
�Annexures to the Annual Financial Statements
for the year ended 31 March 2020
Annexure 1C Statement of transfers to households
Household
TRANSFER ALLOCATION EXPENDITURE 2018/19 Adjusted
appropriation Act
Roll Overs
Adjustments Total Available
Actual Transfer % of Available
funds transferred
Appropriation Act
R'000 R'000 R'000 R'000 R'000 % R'000 Transfers H/H employee service benefit: injury on duty 2 103 (1 482) 621 621 100% 269 H/H employee service benefit: leave gratuity 95 392 10 544 105 936 105 936 100% 86 678 H/H employee service benefit: PST retirement benefit 10 154 (10 154) - - - - 966 H/H employee service benefit: Bursaries (non-employees) 1 076 (1 076) - - - -
H/H: claims against the state (cash) 1 392 411 1 803 1 803 100% 10 785 H/H: PMT/Refund & Rem - Act /GRCE - - 10 10 10 100% 6 Total 110 117 - (1 747) 108 370 108 370 98 704

260 Annual Report 2019/2020
Annual Report for 2019/20 Financial YearVote 5: Department of EducationProvince of the Western Cape
Annexures to the Annual Financial Statements for the year ended 31 March 2020
Annexure 1D Statement of Gifts Donations and Sponsorships Received.
Name of Organisation Nature of Gift Donation or
Sponsorship 2019/20 2018/19
R'000 R'000 Received in kind
Hanneli Rupert Getuienis Trust Ethos leadership development sponsorship
1 522 1 335
LEARNIT NSC Awards Ceremony sponsorship
- 177
Total 1 522 1 512

261Annual Report 2019/2020
Annual Report for 2019/20 Financial YearVote 5: Department of Education
Province of the Western Cape
Annexures to the Annual Financial Statements for the year ended 31 March 2020
Annexure 2A Statement of Financial Guarantees Issued as at 31 March 2020 – Local
Guarantee in respect of
Original guaranteed
capital amount
Opening balance
1 April 2019
Guarantees drawn down
during the year
Guaranteed repayments/
cancelled/ reduced/ released during the
year
Revaluations Closing balance 31 March 2020
Revaluations due to
inflation rate movements
Accrued guaranteed
interest for year ended
31 March 2020
Guarantor Institution R'000 R'000 R'000 R'000 R'000 R'000 R'000 R'000 Housing
Standard Bank of S.A. Limited
83 83
Firstrand Bank Limited: First National Bank
149 149
ABSA 101 101 Total 333 333
Financial guarantees issued relate to housing guarantees provided for employees for housing loans.

262 Annual Report 2019/2020
Annual Report for 2019/20 Financial YearVote 5: Department of EducationProvince of the Western Cape
Annexures to the Annual Financial Statements for the year ended 31 March 2020
Annexure 2B Statement of Contingent Liabilities as at 31 March 2020
Opening balance
1 April 2019
Liabilities incurred
during the year
Liabilities paid/ cancelled/
reduced during the year
Liabilities recoverable
(Provide details
hereunder)
Closing balance 31 March 2020
Nature of liability R'000 R'000 R'000 R'000 R'000 Claims against the department Various claims 274 379 55 083 (44 320) 285 142 Subtotal 274 379 55 083 (44 320) 285 142 Other Municipal accounts * 73 277 218 221 (233 486) - 58 012 Subtotal 73 277 218 221 (233 486) - 58 012 Total 347 656 273 304 (277 806) - 343 154
Claims against the department (Various claims): The claims will only be settled when either the court decides that the department is liable or the department accepts the liability, both of which are unknown Municipal accounts closing balance represents the total amount of outstanding municipal service accounts of schools as at 31 March 2020. It is not possible to�determine the total amount of municipal services accounts of schools incurred and paid/cancelled/reduced during the year as the municipal�services accounts are also settled directly by schools. Furthermore, due to the implementation of the MSCOA at municipalities, not all the data�required has been received from the municipalities.

263Annual Report 2019/2020
Annual Report for 2019/20 Financial YearVote 5: Department of Education
Province of the Western Cape
Annexures to the Annual Financial Statements for the year ended 31 March 2020
Annexure 3 Claims Recoverable
Government Entity
Confirmed balance outstanding
Unconfirmed balance outstanding
Total
Cash in transit at year end 2019/20
31/03/2020 31/03/2019 31/03/2020 31/03/2019 31/03/2020 31/03/2019 Receipt date up to
six (6) working
days after year end
Amount
R'000 R'000 R'000 R'000 R'000 R'000 R'000
Departments Department of Education - North West - - - - - -
- -
Department of Premier (WAM) - - 32 7 32 7
- - Department of Health (WHW) - - 2 25 2 25
- -
Department of Education - Kwazulu Natal (ZED)
- - - 21 - 21
- -
Department of Basic Education (DBE) - - 403 403 403 403 - - Department of Social Development - - 37 - 37 - - - Department of Cultural Affairs & Sport - - - 5 - 5 - - Department of Community Safety (WSL) - - - 27 - 27 - - Department of Human Settlement (WHA)
- - - 1 - 1 - -
National Department of Labour (DLB) - - - 32 - 32 - - Department of Economic Development and Tourism
- - - 550 - 550 - -
Dept. of Local Government & Housing - - 1 19 1 19 - - Dept. of Justice & Constitutional Dev.(DJC)
- - 52 52 52 52
- -
Dept. of Rural development & Land Reform (WEF)
- - - 55 - 55 - -
Dept. of Education E Cape (BED) - - 1 125 88 1 125 88 - - Dept. of Water and Sanitation (DWS) - - - 27 - 217 - - Dept. of Correctional Services (DCS) - - 33 - 33 - - - - - 1 685 1 502 1 685 1 502
- -
Other Government Entities
Education Labour Relations Council (ELRC)
- - 5 478 4 312 5 478 4 312 - -
- - 5 478 4 312 5 478 4 312
- -
Total - - 7 163 5 814 7 163 5 814
- -

264 Annual Report 2019/2020
Annual Report for 2019/20 Financial YearVote 5: Department of EducationProvince of the Western Cape
�Annexures to the Annual Financial Statements
for the year ended 31 March 2019 Annexure 4 Inter-Government Payables
Government Entity Confirmed balance outstanding
Unconfirmed balance outstanding Total Cash in transit at year end
2019/20 31/03/2020 31/03/2019 31/03/2020 31/03/2019 31/03/2020 31/03/2019 Payment
date up to six (6)
working days after year end
Amount
R'000 R'000 R'000 R'000 R'000 R'000 R'000
Departments Current Department of Justice & Constitutional Development
- - 969 - 969 - - -
Department of the Premier WC - - - 25 - 25 - - Provincial Treasury WC - - - - - - - - Department of Education Free State - 40 - - - 40 - - Government Motor Transport WC - - 1 486 314 1 486 314 - - Department of Education GP - - SA Police Services - - Department of Health - 3 - - - 3 - - Department of Human Settlement - 3 623 - - - 3 623 - - Department of Transport & Public Works 102 1 102 1 - - Total Departments - 3 666 2 557 340 2 557 4 006 -

265Annual Report 2019/2020
Annual Report for 2019/20 Financial YearVote 5: Department of Education
Province of the Western Cape
�Annexures to the Annual Financial Statements
for the year ended 31 March 2019 Annexure 5 Inventories
Inventories for the year ended 31 March 2020
Learning and Teaching
Support Material
Materials & Supplies
Assets for distribution:
Machinery & Equipment
Total
Note 32.1 R’000 R’000 R’000 R’000 Add: Additions/Purchases - Cash 163 864 268 341 221 505 353 (Less): Issues (163 864) (268) (341 221) (505 353)
Closing balance - - - -
Inventories for the year ended 31 March 2019
Note 32.1
Learning and
Teaching Support Material
Materials &
Supplies
Assets for distribution: Machinery
& Equipment
Prior period
error
Total
Annexure 6 R’000 R’000 R’000 R’000 R’000 Add: Additions/Purchases - Cash 102 666 39 578 401 348 - 543 592 (Less): Issues (102 666) (39 578) (401 348) - (543 592)
Closing balance - - - - -
These items include stationery, textbooks, school furniture and IT equipment which vary in price and have been issued to schools.

266 Annual Report 2019/2020
Annual Report for 2019/20 Financial YearVote 5: Department of EducationProvince of the Western Cape
�Annexures to the Annual Financial Statements
for the year ended 31 March 2020 Annexure 6 Movement in Capital Work-in-Progress
Movement in Capital Work-in-Progress for the year ended 31 March 2020 Opening balance
Current Year
Capital WIP Ready for use
(Asset register)/ Contract
terminated
Closing
balance
R'000 R'000 R'000 R'000
Buildings and other Fixed Structures 1 060 699 922 842 (658 171) 1 325 370
Non-residential buildings 1 060 699 922 842 (658 171) 1 325 370
Total 1 060 699 922 842 (658 171) 1 325 370
Movement in Capital Work-in-Progress for the year ended 31 March 2019
Opening balance
Prior
period errors
Current Year Capital WIP
Ready for use (Asset
register)/ Contract
terminated
Closing
balance
R'000
R'000 R'000 R'000
R'000
Buildings and other Fixed Structures 557 699
(6 835) 1 123 920 (614 085) 1 060 699 Non-residential buildings 557 699 (6 835) 1 123 920 (614 085) 1 060 699
Total
557 699 (6 835) 1 123 920 (614 085) 1 060 699

267Annual Report 2019/2020
Annual Report for 2019/20 Financial YearVote 5: Department of Education
Province of the Western Cape
Annexures to the Annual Financial Statements for the year ended 31 March 2020
Annexure 7 Transport assets as per finance lease register year ended 31 March 2020
Movable Tangible Capital Assets – GG Vehicles Movement in movable tangible capital assets per asset register for the year ended 31 March 2020
Opening balance
Value adjustments
Additions Disposals Closing balance
R’000 R’000 R’000 R’000 R’000 95 543 - 9 397 (7 232) 97 708 Transport assets- GG Motor Vehicles 95 543 - 9 397 (7 232) 97 708 Total movable tangible capital assets 95 543 - 9 397 (7 232) 97 708
Movement for 2018/19 Movement in movable tangible capital assets per asset register for the year ended 31 March 2019 Opening balance Prior period error Additions Disposals Closing balance R’000 R’000 R’000 R’000 R’000 Machinery and equipment 92 916 - 10 108 (7 481) 95 543 Transport assets 92 916 - 10 108 (7 481) 95 543 Total movable tangible capital assets 92 916 - 10108 (7 481) 95 543
As at 31 March 2020 the department used 505 (March 2019: 509) motor vehicles which were under a financing arrangement unique to the Western Cape and this Annexure 7 enhance the minimum requirement ito Modified Cash Standard.

269Annual Report 2019/2020
Annual Report for 2019/20 Financial YearVote 5: Department of Education
Province of the Western Cape
Part EAppendices

271 Annual Report 2019/2020
Annual Report for 2019/20 Financial YearVote 5: Department of Education
Province of the Western Cape
Annual R
epo
rt 2019/20
20
�APPENDIX A: Service Delivery Improvement Plan (SDIP) The Department has completed a Service Delivery Improvement Plan (SDIP) for 1 April 2018 to 31 March 2021. The tables below highlight the service delivery plan and the achievements to date. Main Service and Standards
Main Services Beneficiaries Current/actual standard of service
Desired standard of service Actual achievement
Examinations Registrations and Client Service Support
� Learners � Educators � Public Service staff � Officials from other
National- and Provincial Government Departments
� Officials from Local municipalities
� Staff members of NGO’s
� Citizens
� 31 853 clients were assisted at the Walk-in Centre (located at Head Office) for Senior Certificate (SCA) and National Senior Certificate (NSC) registrations
The nationally declared increase of matric examination opportunities are the major reason for the increase in enquiries, client registrations and related services offered throughout the financial year. The decentralisation of services to district offices are still being investigated and being considered
� 7 000 clients assisted at the Walk-in Centre (located at Head Office) for SCA registrations
� 7 000 clients assisted at the Walk-in Centre (located at Head Office) for NSC registrations
It is envisaged that the reduction in the number of clients assisted at the Walk-in Centre (located at Head Office) would be due to the increase in the number of clients accessing the registration service on-line or at their closest District Office (if the service is decentralized)
48 597 clients were assisted at the Walk-in Centre for the period 1 April 2019 to 19 March 2020. Separate statistics for SCA vs NSC enquiries were not available Examination functions were not fully decentralised to districts, because most clients felt that Head Office was more accessible (on bus, taxi and train route) than the District offices. Clients preferred to travel to Head Office for registration or any other exam related matter Service delivery to clients continued, despite the COVID-19 Lockdown, through non-contact engagements with clients via email and drop off boxes

272 Annual Report 2019/2020
Annual Report for 2019/20 Financial YearVote 5: Department of Education
Province of the Western Cape
�Main Services Beneficiaries Current/actual standard of
service Desired standard of service Actual achievement
The increased number of candidates enquired about the exam details and available exam materials, exam timetable, despite all examination related information being available online and in pamphlet format. This calls for more advocacy to this group of clients and increase the use of electronic media 19 361 adult (SC) candidates and 11 661 NSC 201911 candidates have been registered for the NSC/SC June 2020 examination In excess of 16 604 candidates were registered for the SC 2020/06 exam using hard copies

273 Annual Report 2019/2020
Annual Report for 2019/20 Financial YearVote 5: Department of Education
Province of the Western Cape
�Main Services Beneficiaries Current/actual standard of
service Desired standard of service Actual achievement
Examinations Client Service Support: 31 853 clients were assisted at the Walk-in Centre
30 000 clients will be assisted at the Walk-in Centre
48 597 clients were assisted at the Walk-in Centre for the period 1 April 2019 to 19 March 2020 In excess of 19 000 candidates registered for the SC 2020/06 exam, which increased the number of candidates enquiring about the exam, available exam materials, exam timetable, etc. although all examination related information was available online Compulsory closure of the WCED offices from 19 March 2020 due to the COVID-19 situation. The Walk-in Centre did not attend to face-to-face clients but a drop off box for completed applications were processed daily. Service Delivery to clients continued, through non-contact engagements with clients via email and drop off boxes

274 Annual Report 2019/2020
Annual Report for 2019/20 Financial YearVote 5: Department of Education
Province of the Western Cape
�Main Services Beneficiaries Current/actual standard of
service Desired standard of service Actual achievement
17 026 switchboard calls were attended by exams personnel (certification unit). However, the current telephone system does not allow for automated reporting
20 000 switchboard calls are estimated to be attended by exams personnel
21 714 switchboard calls were attended to by exams personnel (certification unit) Calls being dealt with mainly relate to Registration enquiries or the release of the NSC and SC results. It would be more feasible and productive to have a dedicated team assisting with examination telephone enquiries, whether result or registration related. Currently the staff responsible for the processing of results and registrations are also responsible for telephone service and this is counterproductive The upgrading of the current telephone system was in the process of being implemented, however this will resume after the COVID-19 lockdown is lifted

275 Annual Report 2019/2020
Annual Report for 2019/20 Financial YearVote 5: Department of Education
Province of the Western Cape
�Main Services Beneficiaries Current/actual standard of
service Desired standard of service Actual achievement
7 639 applications for certificates were processed. The reduction in the number of replacement certificates being requested could be due to the implementation of a bulk sms system where candidates are informed via sms to collect their certificates from their schools, hence fewer unclaimed certificates have to be pulped and then later replaced.
10 000 applications for certificates processed
14 688 applications for replacement or combined certificates were processed The increase in the number of replacement certificates being requested is the norm after the release of the NSC 2019/11 results where candidates combine results to qualify for the NSC and/or for possible registration for the 2020/06 NSC supplementary exam The increase in the number of replacement certificates can also be ascribed to the fact that the Certification Unit annually destroys NSC of candidates that were not collected from the respective schools after a 3-year period. This is in line with Umalusi Policy, which state that i.e. Provincial Education Departments (PEDs) may only store certificates for up to 3 years after issue. When candidates, however, are in need of the certificate, in most instances, the
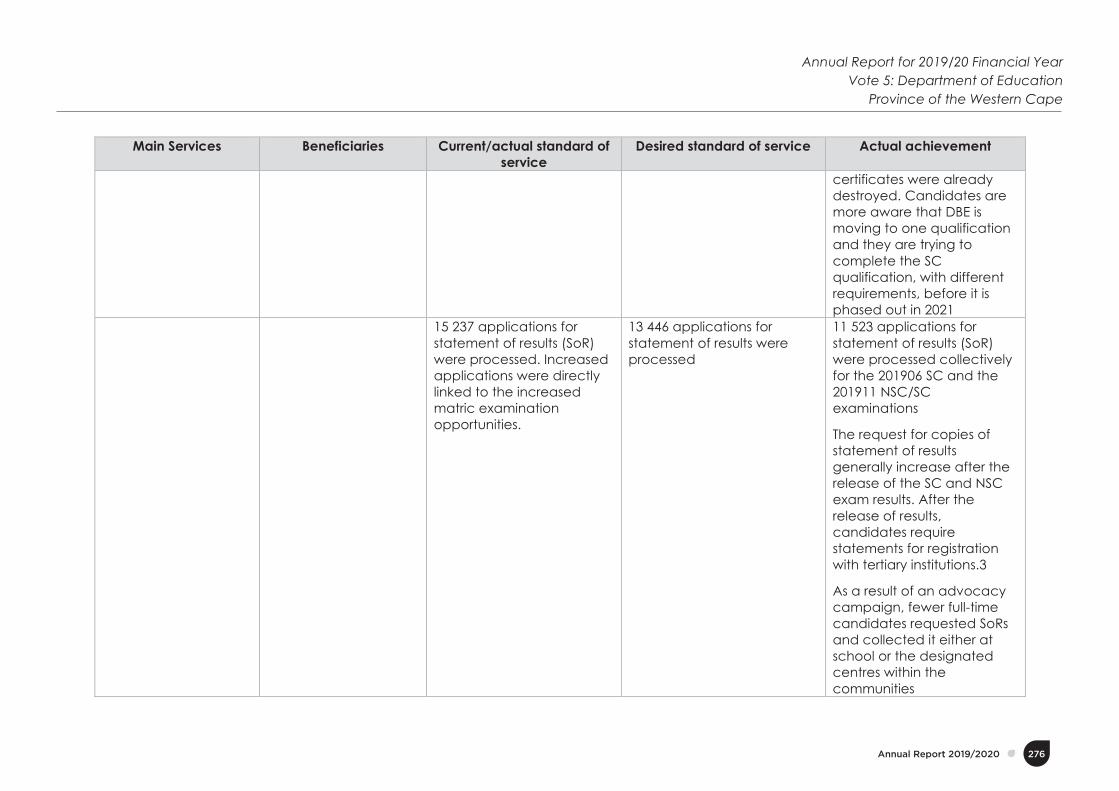
276 Annual Report 2019/2020
Annual Report for 2019/20 Financial YearVote 5: Department of Education
Province of the Western Cape
�Main Services Beneficiaries Current/actual standard of
service Desired standard of service Actual achievement
certificates were already destroyed. Candidates are more aware that DBE is moving to one qualification and they are trying to complete the SC qualification, with different requirements, before it is phased out in 2021
15 237 applications for statement of results (SoR) were processed. Increased applications were directly linked to the increased matric examination opportunities.
13 446 applications for statement of results were processed
11 523 applications for statement of results (SoR) were processed collectively for the 201906 SC and the 201911 NSC/SC examinations
The request for copies of statement of results generally increase after the release of the SC and NSC exam results. After the release of results, candidates require statements for registration with tertiary institutions.3
As a result of an advocacy campaign, fewer full-time candidates requested SoRs and collected it either at school or the designated centres within the communities

277 Annual Report 2019/2020
Annual Report for 2019/20 Financial YearVote 5: Department of Education
Province of the Western Cape
�Main Services Beneficiaries Current/actual standard of
service Desired standard of service Actual achievement
Examinations Registration: 19 265 candidates registered for the SC 201906 examination 7 319 (38%) candidates used the online application. This was an increase of 10,3% compared to 201806 and may reflect that the system is functioning more effectively than before 12 824 candidates registered for the NSC Supplementary exam (almost doubling the 201803 enrolment of 6 877). Increased NSC enrolment was due to changes in the admission criteria and the extended application period
26 000 (75%) on-line registrations (SC, NSC repeat). In 2019, the Supplementary exam will also be written in June, hence the increase in candidates
Only 2 757 (14, 5%) of the 19 000 SC 202006 candidates successfully registered via the e-Services online platform. This may be partially due to accessibility, as the target group is largely from disadvantaged communities, as well as the lack of a targeted approach to encourage clients to use the online platform and the lack of a formal provincial help-desk to deal with technical issues and provide support to clients Client services also participated in WCED 2nd Chance Programme and registered candidates by completing hard copies at these sessions

278 Annual Report 2019/2020
Annual Report for 2019/20 Financial YearVote 5: Department of Education
Province of the Western Cape
�Main Services Beneficiaries Current/actual standard of
service Desired standard of service Actual achievement
100% of applications for certificates were processed within 10 working days from receipt of a correctly completed application form Re-issue and combination requests require 10 - 15 days. The office is dependent on external role players to comply with due dates viz. SITA & Umalusi. System delays and rejections of applications negatively impacts service delivery and prolongs issuing of certificates
90% of applications for certificates are processed within 10 working days from receipt of a correctly completed application form
82.5% of applications for certificates were processed within 10 working days from receipt of a correctly completed application form. System challenges has a direct impact on effective service delivery in shorter time frames. Re-issue and combination requests require 10 - 15 working days The office is dependent on external role players to comply with due dates viz. SITA and Umalusi. Communication and regular follow-up with service providers are on record and to expedite outstanding requests will require system changes from them
1 891 verifications of qualification requests were concluded. The Province only verifies certificates issued prior to Umalusi’s take over as accreditation authority in 1992.
2 850 verifications of qualification requests will be concluded
2 569 verifications of qualification requests were concluded. Verification requests are completed within 48 hours or less, hence there is no waiting period for these requests

279 Annual Report 2019/2020
Annual Report for 2019/20 Financial YearVote 5: Department of Education
Province of the Western Cape
�Main Services Beneficiaries Current/actual standard of
service Desired standard of service Actual achievement
Hence the decrease in the number of requests for the verification is due to the aging of the population that this function covers. Fewer persons from this age group are seeking new employment
The Province only verifies certificates issued prior to Umalusi’s instatement as accreditation authority in 1992
The decrease in the number of requests for the verification could be due to the aging of the population that this function covers. Fewer persons from this age group are seeking new employ-ment, hence there are fewer requests to verify these “old” results. The office also verifies current results that has not been certified yet
No verifications were received or processed during December 2019 due to the closure of verification agencies for the holidays
SAQA in process of scanning all records prior to 1992 and the project is not yet completed. WCED is therefore not in possession of all documents yet to verify all request immediately

280 Annual Report 2019/2020
Annual Report for 2019/20 Financial YearVote 5: Department of Education
Province of the Western Cape
�Main Services Beneficiaries Current/actual standard of
service Desired standard of service Actual achievement
3 907 requests for re-mark of subjects/matric results were concluded This was the first fully automated application process, and this may have contributed to the decreased number of applications received
5 200 requests for re-mark of subjects/matric results are estimated
4 663 requests for re-mark of subjects/matric results: � 4 417 NSC 2019/11 re-
mark requests were processed, and candidates were resulted
� 246 SC 2019/11 re-mark requests were processed, and candidates were resulted
The reduced number of requests for re-mark (against the desired standard), could be due to the compulsory closure of the WCED offices from 19 March 2020 due to the COVID-19 situation. The Walk-in Centre did not attend to face-to-face clients but a drop off box for completed applications were processed daily. Service delivery continued in the absence of face-to-face clients

281 Annual Report 2019/2020
Annual Report for 2019/20 Financial YearVote 5: Department of Education
Province of the Western Cape
�Main Services Beneficiaries Current/actual standard of
service Desired standard of service Actual achievement
147 278 persons accessed the WCED NSC Results webpage. Increased website hits were directly linked to the increased matric examination opportunities
83 606 persons accessed the WCED NSC Results webpage
The WCED online exams landing page was accessed 288 110 times during this period. The exam webpage contains registration information for both the SC and NSC examinations as well as links to resources, tuition centres and copies of admission letters and results Year on year with the increased access to cellphones and technology, the access to retrieve NSC results via the website should increase
44 880 Individual NSC Results were accessed on the WCED NSC Results webpage
21 850 Individual NSC Results were accessed on the WCED NSC Results webpage
37 338 Individual NSC Results were accessed on the WCED NSC Results webpage Year on year with the increased access to cellphones and technology, the access to retrieve NSC results via the website should increase

282 Annual Report 2019/2020
Annual Report for 2019/20 Financial YearVote 5: Department of Education
Province of the Western Cape
�Main Services Beneficiaries Current/actual standard of
service Desired standard of service Actual achievement
Communication to Parents and Citizens
� Parents � Learners � General public � Journalists � Learners � Educators � Public Service staff � Officials from other
National and Provincial Government departments
� Officials from Local municipalities
� Staff members of NGO’s
� Citizens
WCED maximised its resources and improved communication with parents and citizens with the focus on at least 4 major media campaigns linked to the strategic priorities
WCED wishes to maximise its resources and improve communication with parents and citizens with the focus on at least 4 major media campaigns linked to the strategic priorities
The WCED is investigating means to improve communication with parents at a direct level. The development of WCED news and its distribution has proved successful in getting positive news out to parents and communities. The filling of a social media post has also improved communication on various social media platforms - expanding our reach.
Communication: 4 Annual Major campaigns to support WCED strategic objectives concluded
4 Annual Major campaigns to support WCED strategic objectives
4 Annual Major campaigns to support WCED strategic objectives were achieved, as well as, additional campaigns
Media services: 92 media statements of key activities and developments relevant to key strategic objectives were published, mainly due to additional examination opportunities
80 media statements on key activities and developments relevant to key strategic objectives
62 media statements were released The Minister’s spokesperson was on extended leave and subsequently resigned during quarter 3 of the reporting period, which contributed to the underachievement

283 Annual Report 2019/2020
Annual Report for 2019/20 Financial YearVote 5: Department of Education
Province of the Western Cape
�Main Services Beneficiaries Current/actual standard of
service Desired standard of service Actual achievement
Media services: 49% proactive media
coverage relevant to key strategic objectives was achieved
50% positive media coverage relevant to key strategic objectives
45% positive media coverage relevant to key strategic objectives was achieved for April and May 2019 Statistics was not available for the rest of the financial year. The Department of the Premier’s Strategic Communication stopped compiling statistics per department. We believe alternative arrangements will be made in future
Language services: Editing and Translation concluded: � 3 108 documents � 11 641 pages
Language services: Editing and Translation: � 1 450 documents � 5 369 pages
Language services: Editing and Translation concluded: � 1 270 documents � 4 521 pages
5 981 Edumedia services requested (incl. DTP, Maintenance of the WCED on-line website; http://wcedon-line.westerncape.gov.za; CD/DVD duplication, printing, audio & video production)
2 616 Edumedia services requested (incl. DTP, Maintenance of the WCED on-line website; http://wcedon-line.westerncape.gov.za; CD/DVD duplication, printing, audio & video production)
4 228 Edumedia services requested (incl. DTP, Maintenance of the WCED on-line website; http://wcedon-line.westerncape.gov.za; CD/DVD duplication, printing, audio & video production)

284 Annual Report 2019/2020
Annual Report for 2019/20 Financial YearVote 5: Department of Education
Province of the Western Cape
�Main Services Beneficiaries Current/actual standard of
service Desired standard of service Actual achievement
Marketing services: The number of impacts varied per campaign and per year, depending on the medium chosen to deliver the campaign. The 2018/19 impacts achieved:
Number of impacts planned:
Number of impacts achieved
Early Enrolment Campaign: 9 290 posters and 134 100 pamphlets distributed to 1 066 schools and to Head Office and 8 District offices in January 2019 Paid for campaigns which ran from 11 February 2019 to 15 March 2019 enabled the Department to reach the target audience through: � Print: Newspapers –
300 261 � Digital/social media –
Impression 900 666 � Radio: Umhlobo
Wenene, KFM, Heart – 806 960 listeners
Early Enrolment Campaign: 21 830 posters and 265 000 pamphlets distributed to 1 086 schools and 8 District offices (these totals are estimated at the 2017/18 totals as numbers depend on actual enrolment in Grade R & 6)
Early Enrolment Campaign: The digital campaign targeted specific audiences via Facebook, Twitter and Google ads. � 6 346 posters and 196
920 pamphlets were distributed to 1 449 schools (including ECD centres) and to Head
� Office and the 8 district offices in January 2020. The paid for campaign ran from 11 February 2020 to 17 March 2020.
� The targeted reach was over 5,7 million listeners on various radio stations, like Umhlobo Wenene, KFM and Heart FM.

285 Annual Report 2019/2020
Annual Report for 2019/20 Financial YearVote 5: Department of Education
Province of the Western Cape
�Main Services Beneficiaries Current/actual standard of
service Desired standard of service Actual achievement
Early Enrolment Campaign:
� Out of home advertising reaching 31,2 million people via foot traffic and more than 300 000 readers reached through print media during the campaign period.
� Social media paid for advertising: � Facebook: 1 898 260
impressions, i.e. number of times it was posted and shared on timelines
� Twitter: reached 267 220 feeds on twitter
� Google ads: reached 636 671 individual feeds

286 Annual Report 2019/2020
Annual Report for 2019/20 Financial YearVote 5: Department of Education
Province of the Western Cape
�Main Services Beneficiaries Current/actual standard of
service Desired standard of service Actual achievement
Matric Support Campaign: 53 000 booklets distributed to Grade 12 learners enrolled at Secondary and Special Schools (total depends on actual Grade 12 enrolment confirmed by June)
Matric Support Campaign: 55 500 booklets distributed to Grade 12 learners enrolled at Secondary and Special schools (total depend on actual Grade 12 enrolment confirmed by June)
Matric Support Campaign: 53 800 booklets distributed to Grade 12 learners enrolled at 450 Secondary and Special Schools (total depends on actual Grade 12 enrolment confirmed by June)
Mathematics and Language Campaign: The campaign was postponed to 2019/20 financial year, due to amongst others, the ELearning System development delays
Mathematics and Language Campaign: Traditional marketing campaign using radio, digital and out of home channels reaching our target audience of about 321 000 foundation phase learners
Mathematics and Language Campaign: Story Stars essay competition: � Booklets and Story Stars
cut-outs were distributed to all Grade 4 learners in January 2020
� Website and video were completed and launched. Video available in all 3 official languages
� Deadline for entries was 20 March 2020. Campaign to be completed in the 2020/21 Financial Year - as planned.

287 Annual Report 2019/2020
Annual Report for 2019/20 Financial YearVote 5: Department of Education
Province of the Western Cape
�Main Services Beneficiaries Current/actual standard of
service Desired standard of service Actual achievement
Anti-Bullying Campaign: Launched in August 2019 and promoted via Social Media in March 2019: � Produced 2 videos and a
mobi site –promoted organically and via a paid for digital marketing campaign
� In November 2019, the campaign targeted Facebook with 16 000 views, Twitter and YouTube with 44 000 views
� In the March 2019 campaign, there were 255 823 views on Facebook, Twitter and YouTube
Anti-Bullying Campaign: Annual campaign to promote anti-bullying, physical and cyber bullying in schools.
Anti-Bullying Campaign Groundwork for the campaign was done, but the campaign could not be finalised because of the Covid19 pandemic. Materials for schools which was at the centre of this year’s concept, could not be manufactured or procured because of the import ban caused by the Covid-19 pandemic.

288 Annual Report 2019/2020
Annual Report for 2019/20 Financial YearVote 5: Department of Education
Province of the Western Cape
�Main Services Beneficiaries Current/actual standard of
service Desired standard of service Actual achievement
Additonal achievement: Ad-hoc campaigns during the reporting period included: � The Values Campaign
(21 250 posters)
� Safe Schools Poster Campaign (3 800 posters)
� The eLearning Poster
Campaign (14 610 posters). This campaign was also supported by a social media campaign via Facebook and Twitter during February and March 2019
The abovementioned posters were distributed to 1 906 WCED institutions, including, primary, high, special schools and ECD centres, Head Office and the 8 District offices
Additional achievement: � Values, Themes
Campaign: posters distributed to High and Primary Schools - actual statistics not available at this stage
� Bathroom Project in support of WCEDs T2O and Growth Mindset: posters with inspirational quotes by celebrities for High School learners and Growth Mindset quotes to inspire primary school learners were distributed to schools at the beginning of 2020

289 Annual Report 2019/2020
Annual Report for 2019/20 Financial YearVote 5: Department of Education
Province of the Western Cape
�Main Services Beneficiaries Current/actual standard of
service Desired standard of service Actual achievement
83% compliance with brand requirements achieved
100% compliance with brand requirements achieved
84,55% brand compliance achieved
On-line services: Visits to website:
� Quarter 1 = No analytics
available � Quarter 2 = 7 604 070 hits � Quarter 3 = 4 827 801 hits � Quarter 4 = New website
launched on 24 January 2019. Used Google analytics to track behaviour. The statistics for the period 24 January 2019 till 31 March 2019 was 147 173 users and 850 324 pages viewed
1 million visits to website Google analytics shows that there were more than 5.5 million views on the website, with the most visited landing pages being: � Admissions site: 1 million
views; � Vacancies: 770 000
views; � Examinations site:
almost 500 000 views; � Support to Grade 12s in
the form of exam papers and memos: more than 250 000 views.
876 673 EPortal users. Increased access due to the popularity of the site and its benefits to users
250 000 EPortal users 2 273 071 EPortal users The page views were not consistently tracked throughout the year
98% satisfied visitors to Walk-in Centre
100% satisfied visitors to Walk-in Centre
100% satisfied visitors to Walk-in Centre. Breakdown: � Client queries: 9 304; � Clients at visitor’s
entrance: 2 804 � Documents received:
5 910.

290 Annual Report 2019/2020
Annual Report for 2019/20 Financial YearVote 5: Department of Education
Province of the Western Cape
�Main Services Beneficiaries Current/actual standard of
service Desired standard of service Actual achievement
88% for the Call Centre (Customer Survey feedback)
92% for the Call Centre (Customer Survey feedback)
97% for the Call Centre (Customer Survey feedback) Call Centre Stats for 1st, 2nd and 4th quarter only. 3rd quarter statistics were not available because of a systems error that could not be resolved. - Calls Received: 56 712 - Callbacks: 207 - Emails: 259
83% compliance with brand identity on website achieved
100% compliance with brand identity
84,55 % brand compliance for the reporting period
Batho Pele arrangements with beneficiaries (Consultation, access, etc.)
Current/actual arrangements Desired arrangements Actual achievements Examinations Registrations and Client Service Support
Consultation: Consultation: Consultation: Clients were consulted through: Clients were consulted through: Clients were consulted through: a) 4 x Assessment Coordinators’ Forum
meetings held a) Quarterly Assessment Coordinators’ Forum
meetings held per annum a) Quarterly Assessment Coordinators’ Forum
meetings held b) 4 x Exam Coordinators’ Forum meetings
held per annum b) 4 Exam Coordinators’ Forum meetings
held per annum b) 4 x Exam Coordinators’ Forum meetings
held c) 4 x Provincial Principals’ Forum meetings
held per annum (1 per quarter) c) 4 x Provincial Principals’ Forum meetings
held quarterly c) 4 x Provincial Principals’ Forum meetings
held quarterly (1 per quarter) d) 4 x Provincial Education Labour Relations
Council (PELRC) meetings held per annum (1 per quarter)
d) 4 x Provincial Education Labour Relations Council (PELRC) meetings held quarterly
d) 4 x Provincial Education Labour Relations Council (PELRC) meetings held quarterly (1 per quarter)

291 Annual Report 2019/2020
Annual Report for 2019/20 Financial YearVote 5: Department of Education
Province of the Western Cape
�Current/actual arrangements Desired arrangements Actual achievements
e) Annual Customer Satisfaction Survey Report was concluded The 2018 Customer Satisfaction Survey Report recorded the following written feedback for Examination and Assessment support: i. General comments = 25 ii. Complaints = 12 iii. Compliments = 27
e) Annual Customer Satisfaction Survey Report concluded by end September
e) Annual Customer Satisfaction Survey Report was concluded by end October 2019: The 2019 Customer Satisfaction Survey Report recorded the following written feedback for Examination and Assessment support: i. General comments = 16 ii. Complaints = 6 iii. Compliments = 21
These will be investigated, addressed and the feasible suggestions will be incorporated
The 2019 Customer Satisfaction Survey Report recorded the following written feedback for Communications to schools: i. General comments = 77 ii. Complaints = 29 iii. Compliments = 73
The compliments for both services outweigh the complaints by more than 50%. All complaints (anonymous) will be investigated and addressed as feasible learning opportunities.

292 Annual Report 2019/2020
Annual Report for 2019/20 Financial YearVote 5: Department of Education
Province of the Western Cape
�Current/actual arrangements Desired arrangements Actual achievements
f) Suggestion box within the Exams Client Service Centre during operating times: i. One of the suggestions – to conduct
information sessions in communities has been considered and has been implemented to a limited extent through information sessions at Chrysalis Youth Centre career days and at Second Chance Programme information sessions (St Frances, Gugulethu)
ii. In 2019, information sessions at Community Learning Centres (CLCs) providing tuition to adult learners will be implemented as part of the advocacy for the SC June 2020 examination
f) Manage the suggestion box and feedback mechanism during the financial year
f) Suggestion box within the Exams Walk-in Client Service Centre during operating times: Comments ranged from compliments to the effective and friendly service delivered. At the other spectrum, the Exams Walk-in Centre encountered livid clients who were unhappy about the small, cramped Walk-in Centre with only 4 consultants.
�
Current/actual arrangements Desired arrangements Actual achievements Access: Access: Access: The service was accessible: The service is accessible: The service was accessible: a) Via the Walk-in Centre: 2nd Floor, Grand
Central Towers (weekdays from 07:30 – 16:00). (January until 17:00)
a) Via the Walk-in Centre: 2nd Floor, Grand Central Towers (weekdays from 07:30 – 16:00). (January until 17:00)
a) Via the Walk-in Centre: 2nd Floor, Grand Central Towers (weekdays from 07:30 – 16:00). (January until 17:00) Compulsory closure of the WCED offices from 19 March 2020 due to the COVID-19 situation. The Walk-in Centre did not attend to face-to-face clients but a drop off box for completed applications were processed daily. Service delivery continued in the absence of face-to-face clients.

293 Annual Report 2019/2020
Annual Report for 2019/20 Financial YearVote 5: Department of Education
Province of the Western Cape
�Current/actual arrangements Desired arrangements Actual achievements
b) During January, District offices were used as drop-off points for candidates to submit applications for the NSC 201906 supplementary exam. A pilot study at two district offices in support of the work study investigation testing the feasibility to decentralise this function to all districts was initiated. The project plan was extended beyond 2018/19 financial year
b) The outcomes of the work study report will be phased-in during implementation
b) Decentralisation of Exams Services were offered to feasible District offices. However, further decentralisation was halted due to clients’ preference to access services at Head Office.
Additional achievement: Additional achievement: c) Via the Switchboard (0214672300): 5th
floor, Grand Central Towers (weekdays from 07:30 – 16:00)
c) Via the Switchboard (0214672300): 5th floor, Grand Central Towers (weekdays from 07:30 – 16:00)
d) Online – online applications for: i. Duplicate Matric certificates ii. Duplicate Teacher qualifications
d) Online – online applications for: i. Duplicate Matric certificates ii. Duplicate Teacher qualifications
�Current/actual arrangements Desired arrangements Actual achievements
The accessibility of services was also improved through: a) Way-finding and signage boards are
present/visible & in 3 Official languages of the Province
b) Wheelchair accessibility at all physical locations. Disabled access is still a challenge, especially with the Walk-in Centre situated on the 2nd floor. The elevators are used when required
c) Elevator floor numbers are available in braille
d) Extended working hours (during exam registration and resulting periods)

294 Annual Report 2019/2020
Annual Report for 2019/20 Financial YearVote 5: Department of Education
Province of the Western Cape
�Current/actual arrangements Desired arrangements Actual achievements
Courtesy: Courtesy: Courtesy: Courtesy was reported and measured through:
Courtesy was reported and measured through:
Courtesy was reported and measured through:
a) 96% (satisfaction to excellent ratings) to WCED website 2018 CSS report
a) 98% (satisfaction to excellent ratings) to WCED website 2019 CSS report
a) 95% (satisfaction to excellent ratings) to WCED website 2019 CSS report. The CSS report illustrates school-based staff satisfaction to service delivery, while the Exams landing page reported 51% increase of users (staff, learners, parents, etc.) between the previous (2018/19) and reporting (2019/20) financial year. Not all above-mentioned clients were surveyed
b) 84% (satisfaction to excellent ratings) to responses to telephone enquiries within the 2018 CSS report
b) 98% (satisfaction to excellent ratings) to responses to telephone enquiries within the 2019 CSS report
b) 84% (satisfaction to excellent ratings) to responses to telephone enquiries within the 2019 CSS report. The upgrading of the current telephone system was in the process of being implemented, however this will resume after the COVID-19 Lockdown is lifted
c) 78% (satisfaction to excellent ratings) to response to written enquiries within the 2018 CSS report
c) 98% (satisfaction to excellent ratings) to response to written enquiries within the 2019 CSS report
c) 79% (satisfaction to excellent ratings) to responses to written enquiries within the 2019 CSS report. It is agreed that special interventions for both telephone and written queries are required. The challenge is for individual service managers to effectively implement a dedicated intervention which addresses their unique delivery to clients
�

295 Annual Report 2019/2020
Annual Report for 2019/20 Financial YearVote 5: Department of Education
Province of the Western Cape
�Current/actual arrangements Desired arrangements Actual achievements
Additional achievement: a) All telephonic complaints were
investigated and amicably resolved with clients
b) Presidential hotline queries were resolved at 99.4% success rate within prescribed timelines
c) Code of Conduct: Only 548 (1.31%) of 41 906 employees were subjected to recorded Misconduct/disciplinary hearings during the financial year
d) Professional standard/ business rules of the Department: WCED was rated as 92% for the value “Competence” Satisfactory to Excellent within the 2018 Client Satisfaction Survey Report
e) 83% of client rated WCED responses to written communications within 14 days upon receipt, as Satisfactory to Excellent
f) In-house Customer Care Training was provided to staff as part of annual scheduled training programmes
g) Staff and managers could nominate officials in accordance with Performance Management and Developmental needs
h) Informal in-service training was offered to all Walk-in Centre staff on a monthly basis. Only the Interns attended formal training in 2018/19

296 Annual Report 2019/2020
Annual Report for 2019/20 Financial YearVote 5: Department of Education
Province of the Western Cape
�Openness and transparency: Openness and transparency: Openness and transparency: Openness and transparency was achieved through:
Openness and transparency is further achieved through:
Openness and transparency is further achieved through:
a) The following publications (in 3 official languages of the Province and obtainable via the Walk-in Centre and the departmental website): i. Annual Citizen’s Report disseminated
by end January 2019 ii. Annual Performance Plan (APP)
tabled by end February iii. Annual Reports (AR) tabled by end
September
a) The publications (in 3 official languages of the Province and obtainable via the Walk-in Centre and the departmental website): i. Annual Citizen’s Report disseminated
by end November ii. Annual Performance plans (APP)
tabled by end February iii. Annual Reports (AR) tabled by end
September
a) The following publications (in 3 official languages of the Province and obtainable via the Walk-in Centre and the departmental website): i. Annual Citizen’s Report 2018/19 was
disseminated by end January 2020 ii. Annual Performance Plan (APP)
tabled by end February 2020 iii. Annual Reports (AR) 2018/19 tabled
by end September 2019 b) On-line (website) feedback mechanisms
was not available. The SOP for this service was not concluded due to new website and analytics developments
b) Improved on-line (website) feedback mechanism (improve on SOP implementation)
b) Improved on-line (website) feedback mechanisms through the “Give Feedback” function which is visible on each page
Documents above are printed based on legislative quantities required. It is advertised on the WCED’s website that print copies can be provided based on motivational requests
Documents above are printed based on legislative quantities required. It is advertised on the WCED’s website that print copies can be provided based on motivational requests
Documents above are printed based on legislative quantities required. It is advertised on the WCED’s website that print copies can be provided based on motivational requests
c) Due dates for Exams Registrations were shared using the Thusong Programme within the Province
c) Increase information sharing by using the Thusong Programme within the Province (subject to annual revised programme
c) Due dates for Exams Registrations were shared using the Thusong Programme within the Province
d) Client Satisfaction Surveys: The 2018 Customer Satisfaction Report revealed that 84.7%, 76.0% and 96% client satisfaction were recorded in respect of telephone, written communication and the website

297 Annual Report 2019/2020
Annual Report for 2019/20 Financial YearVote 5: Department of Education
Province of the Western Cape
Value for Money: Value for Money: Value for Money: a) The costs for replacement matric
certificates, education qualifications, etc. were kept to a minimum
a) The costs for replacement matric certificates, education qualifications, etc. are kept to a minimum
a) The costs for replacement matric certificates, education qualifications, etc. were kept to a minimum
b) Cost for confirmation of results: R47 b) Cost for confirmation of results: R46 b) Cost for confirmation of results: R50 c) Cost for combined certificates: R118 c) Cost for combined certificates: R118 c) Cost for combined certificates: R130 d) Cost for duplicate copies of certificates:
R118 d) Cost for duplicate copies of certificates:
R118 d) Cost for duplicate copies of certificates:
R130 e) Cost for Duplicate Teacher diplomas:
R118 e) Cost for Duplicate Teacher diplomas:
R118 e) Cost for Duplicate Teacher diplomas:
R130 f) Cost for application for re-mark: R112 f) Cost for application for re-mark: fees not
available yet f) Cost for application for re-mark: R112
g) Cost for application for re-check: R27 g) Cost for application for re-check: fees not available yet
g) Cost for application for re-check: R50
h) Cost for application to view a script: R219 h) Cost for application to view a script: fees not available yet
h) Cost for application to view a script: R219
Costs indicated above are national tariffs which are revised on an annual basis. Bank card facilities were available at the WCED cashier’s offices for clients’ convenience and EFT payments were encouraged
Costs indicated above are national tariffs which are revised on an annual basis
Costs indicated above are national tariffs which are revised on an annual basis
Communication to Parents and Citizens Consultation:
Consultation:
Consultation:
Clients were consulted through: Clients are consulted through: Clients are consulted through: a) 2018 Annual Customer Satisfaction Report
concluded a) 2019 Annual Customer Satisfaction Report
concluded and uploaded on the WCED website
a) 2019 Annual Customer Satisfaction Report concluded and uploaded on the WCED website
b) On-line feedback mechanism was affected by new website development
b) 1 452 items recorded using the on-line feedback mechanism
b) Statistics for the recording of the on-line feedback was not available
c) 4 x Principals Forums held c) 4 x Principals Forums held c) 4 x Principals Forums held d) 4 x PELRC meetings held d) 4 x PELRC meetings held d) 4 x PELRC meetings held

298 Annual Report 2019/2020
Annual Report for 2019/20 Financial YearVote 5: Department of Education
Province of the Western Cape
�Current/actual arrangements Desired arrangements Actual achievements
e) Quarterly analysis of media publications concluded and reported upon: i. Quarter 1: 1 525 media hits, of which
814 were proactive ii. Quarter 2: 1 735 media hits, of which
889 were proactive
e) Quarterly analysis of media publications concluded and reported upon
e) Quarterly analysis of media publications concluded and reported upon for only 2 of the 4 quarters during the financial year. The Department of the Premier stopped with the assessment and collation
iii. Quarter 3: 1 549 media hits, of which 817 were proactive
iv. Quarter 4: 3 167 media hits, of which 1 391 were proactive
v. Total: 7 976 media hits, of which 3 911 were proactive
f) The 2019 Customer Satisfaction Survey Report recorded the following written feedback for Communication to schools: i. General comments = 77 ii. Complaints = 29 iii. Compliments = 73
The compliments for both services outweigh the complaints by more than 50%. All complaints (anonymous) will be investigated and addressed as feasible learning opportunities
Access: The service was accessible-:
Access: The service is accessible-:
Access: The service was accessible-:
a) At WCED Head Office, 2nd Floor, Grand Central Towers, Lower Parliament Street, Private Bag X9114, Cape Town 8000
a) At WCED Head Office, 2nd Floor, Grand Central Towers, Lower Parliament Street, Private Bag X9114, Cape Town 8000
a) At WCED Head Office, 2nd Floor, Grand Central Towers, Lower Parliament Street, Private Bag X9114, Cape Town 8000
b) Operating times: Mon - Fri, 07:30 – 16:00 (Extended hours for Client services 07:00 – 17:00)
b) Operating times: Mon - Fri, 07:30 – 16:00 (Extended hours for Client services 07:00 – 17:00)
b) Operating times: Mon - Fri, 07:30 – 16:00 (Extended hours for Client services 07:00 – 17:00)
c) WCED website https://wcedonline.westerncape.gov.za/
d) , operational 24/7 and Multi-channel client service interaction (in addition to website, WCED Education Portal wcedeportal.co.za)
c) WCED website https://wcedonline.westerncape.gov.za/ operational 24/7 and Multi-channel client service interaction (in addition to website, WCED Education Portal wcedeportal.co.za)
c) WCED website https://wcedonline.westerncape.gov.za/, operational 24/7 and Multi-channel client service interaction (in addition to website, WCED Education Portal wcedeportal.co.za)

299 Annual Report 2019/2020
Annual Report for 2019/20 Financial YearVote 5: Department of Education
Province of the Western Cape
�Current/actual arrangements Desired arrangements Actual achievements
d) 8 x District offices (See quarterly updated Service Charter: Access list on Website)
d) 8 x District offices (See quarterly updated Service Access list on Website)
c) 8 x District offices (See quarterly updated Service Charter: Access list on Website)
e) Provincial Thusong Programme included as distribution points to campaign items (subject to annual revised programme)
e) Provincial Thusong Programme included as distribution points to campaign items (subject to annual revised programme)
e) Provincial Thusong Programme included as distribution points to campaign items (subject to annual revised programme)
Courtesy: Courtesy is reported and measured through:
Courtesy: Courtesy is reported and measured through:
Courtesy: Courtesy was reported and measured through:
a) 96% (satisfaction to excellent ratings) to WCED website
a) 98% (satisfaction to excellent ratings) to WCED website
a) 95% (satisfaction to excellent ratings) to WCED website. The CSS report illustrates school-based staff satisfaction to service delivery. The changes to the website would take time for clients to get use to the new features
b) 84% (satisfaction to excellent ratings) to responses to telephone enquiries
b) 88% (satisfaction to excellent ratings) to responses to telephone enquiries
b) 84% (satisfaction to excellent ratings) to responses to telephone enquiries. The upgrading of the current telephone system was in the process of being implemented, however this will resume after the COVID-19 Lockdown is lifted
c) 78% (satisfaction to excellent ratings) to response to written enquiries
c) 79% (satisfaction to excellent ratings) to response to written enquiries
c) 79% (satisfaction to excellent ratings) to response to written enquiries
d) 49% positive media coverage relevant to key strategic objectives
d) 50% positive media coverage relevant to key strategic objectives
d) 45% positive media coverage relevant to key strategic objective was achieved for April and May 2019. Statistics was not available for the rest of the financial year. The Department of the Premier’s Strategic Communication stopped compiling statistics per department. We believe alternative arrangements will be made in future. We await their feedback.

300 Annual Report 2019/2020
Annual Report for 2019/20 Financial YearVote 5: Department of Education
Province of the Western Cape
�Current/actual arrangements Desired arrangements Actual achievements
Openness and transparency: Openness and transparency were achieved through:
Openness and transparency: Openness and transparency are achieved through:
Openness and transparency: Openness and transparency were achieved through:
a) The following publications (in 3 official languages of the Province and obtainable via the Walk-in Centre and the departmental website): i. Annual Citizen’s Report disseminated
by end January 2019 ii. Annual Performance Plan (APP)
tabled by end February iii. Annual Reports (AR) tabled by end
September
a) The following publications (in 3 official languages of the Province and obtainable via the Walk-in Centre and the departmental website): i. Annual Citizen’s Report disseminated
by end November ii. Annual Performance Plan (APP)
tabled by end February iii. Annual Reports (AR) tabled by end
September
a) The following publications, obtainable via the Walk-in Centre and the departmental website, were in English and available in Afrikaans and isiXhosa, on request i. Annual Citizen’s Report 2018/19 was
disseminated by end January 2020 ii. Annual Performance Plan (APP)
tabled by end February 2020 iii. Annual Reports (AR) 2018/19 tabled
by end September 2019 b) “Give us your feedback” replaced
“Contact the WCED” in new improved website. Online feedback was not disrupted at all during the reporting period and during the development phase of the new website.
b) Improved on-line (website) feedback mechanisms
b) Improved on-line (website) feedback mechanisms through the “Give Feedback” function which is visible on each page
Openness and transparency were further achieved through: The publication/distribution (in 3 Official languages of the Province and obtainable via the Client Service Centre and the departmental website) of the: i. Department’s Annual Citizen’s Report
(4 760 printed copies) ii. Service Access Booklet (on website) iii. Service Charter (on display and on
website)

301 Annual Report 2019/2020
Annual Report for 2019/20 Financial YearVote 5: Department of Education
Province of the Western Cape
�Current/actual arrangements Desired arrangements Actual achievements
iv. Service Standard Schedule (on website)
v. Limited printed copies of the above-mentioned documents were disseminated
Value for Money: a) WCED website http://wcedon-
line.westerncape.gov.za operational 24/7 and Multi-channel client service interaction (in addition to website, WCED E Portal http://wcedeportal.co.za/ offers curriculum content)
Value for Money: a) WCED website http://wcedon-
line.westerncape.gov.za operational 24/7 and Multi-channel client service interaction (in addition to website, WCED Education Portal http://wcedeportal.co.za/)
Value for Money: a) WCED website http://wcedon-
line.westerncape.gov.za, operational 24/7 and Multi-channel client service interaction (in addition to website, WCED Education Portal http://wcedeportal.co.za/)
b) Edumedia produced publications and reprographic services of limited amounts less than market related costs to WCED internal components
b) Edumedia produce publications and reprographic services of limited amounts less than market related costs to WCED internal components
b) Edumedia produced publications and reprographic services of limited amounts less than market related costs to WCED internal components
Additional achievement: Early Enrolment Campaign:
The digital campaign targeted specific audiences via Facebook, Twitter and Google ads. � 6 346 posters and 196 920 pamphlets
were distributed to 1 449 schools (including ECD centres) and to Head

302 Annual Report 2019/2020
Annual Report for 2019/20 Financial YearVote 5: Department of Education
Province of the Western Cape
�Current/actual arrangements Desired arrangements Actual achievements
� Office and the 8 district offices in January 2020. The paid for campaign ran from 11 February 2020 to 17 March 2020.
� The targeted reach was over 5,7 million listeners on various radio stations, like Umhlobo Wenene, KFM and Heart FM.
� Out of home advertising reaching 31,2 million people via foot traffic and more than 300 000 readers reached through print media during the campaign period.
� Social media paid for advertising: � Facebook: 1 898 260 impressions, i.e.
number of times it was posted and shared on timelines
� Twitter: reached 267 220 feeds on twitter
� Google ads: reached 636 671 individual feeds
Matric Support Campaign: � 53 800 booklets distributed to Grade 12
learners enrolled at 450 Secondary and Special Schools. (total depends on actual Grade 12 enrolment confirmed by June)

303 Annual Report 2019/2020
Annual Report for 2019/20 Financial YearVote 5: Department of Education
Province of the Western Cape
�Service delivery information tool:
Examinations Registrations and Client Service Support Information is communicated through:
a) 500 000 bulk sms sent to clients and stakeholders. The bulk sms service is used for the following purposes: � To confirm candidates’ registration
and inform them of their exam centre (all part time candidates with valid cell numbers)
� To inform candidates of centre changes, due to community protests (Overberg, West Coast and Eden Central Karoo – George, in 2018 exam)
� To inform candidates of the date and time of results release
� To direct candidates to the WCED online website to access admission letters and results
a) 500 000 bulk sms sent to clients and stakeholders. Individual emails are also sent to clients (influenced by no. of registrations)
a) 500 000 (estimated due to unavailable statistics) bulk sms’ sent to clients and stakeholders. Individual emails are also sent to candidates (influenced by no. of registrations) � To confirm their registration and inform
them of their exam centre (all part time candidates with valid cell numbers)
� To inform them of the date and time of results release
� To direct them to the WCED online website to access admission letters and results
� To inform them to collect their certificates from Head Office (Walk-in Centre) & the Post Office with a tracking number
For SmartLock: � Chief Invigilators receive a sms to
remind them to download their exam schedules to their Glam Keys
� Remind Chief Invigilators that they have not yet downloaded their schedules or opened their SmartLock bags
For SmartLock: � Chief Invigilators receive a sms to
remind them to download their exam schedules to their Glam Keys
� Remind Chief Invigilators that they have not yet downloaded their schedules or opened their SmartLock bags

304 Annual Report 2019/2020
Annual Report for 2019/20 Financial YearVote 5: Department of Education
Province of the Western Cape
�Examinations Registrations and Client Service Support Information is communicated through:
b) Pamphlets were developed to share information with service beneficiaries leading up to registration peak times. The Walk-in Centre printed and distributed pamphlets with information regarding: � Admission Criteria for the June 2019
Senior Certificate (adult) Matric exam � Admission criteria for the NSC
Supplementary exam � Combination of Results from different
exam sittings
b) Develop pamphlets to share information with service beneficiaries leading up to registration peak times
b) Pamphlets were developed to share information with service beneficiaries leading up to registration peak times � Admission Criteria for the June 2019
Senior Certificate (adult) Matric exam � Admission criteria for the NSC
Supplementary exam Combination of Results from different exam sittings
c) Stakeholder platforms: i. 8 x Examination Administration
Minutes; 4 x Examination Notices distributed to schools
ii. 15 Exams and Matric related media statements were released
Shared information using the Thusong Programme within the Province (subject to annual revised programme). Media releases in respect of NSC and other results were sufficiently used. Accessible from: https://wcedonline.westerncape.gov.za/comms/press/2017/indexpress.html
c) Stakeholder platforms: i. No. of Circulars and communique via
schools ii. No. of Media briefings Share information using the Thusong Programme within the Province (subject to annual revised programme)
c) Stakeholder platforms: i. 5 Circulars via schools ii. 19 Media briefings Shared information using the Thusong Programme within the Province (subject to annual revised programme)

305 Annual Report 2019/2020
Annual Report for 2019/20 Financial YearVote 5: Department of Education
Province of the Western Cape
�Additional achievement: Additional achievement: a) The NSC National- and Provincial Award
ceremonies were substantively publicised a) The NSC National- and Provincial Award
ceremonies were substantively publicised b) Substantial reports on exam related
analysis were generated for different users b) Substantial reports on exam related
analysis were generated for different users c) NSC results specific publications were
released c) NSC results specific publications were
released d) Information brochures were updated and
were available at the Walk-in Centre d) Information brochures were updated and
were available at the Walk-in Centre e) Information flyers were available at the
Walk-in Centre e) Information flyers were available at the
Walk-in Centre f) WCED website:
https://wcedonline.westerncape.gov.za/ f) WCED website:
https://wcedonline.westerncape.gov.za/ g) Formal request for Access to Information
(PAIA) is well communicated and accessible from the WCED website
g) Formal request for Access to Information (PAIA) is well communicated and accessible from the WCED website
�Communication to Parents and Citizens Information was communicated through:
Early Enrolment Campaign: 9 290 posters and 134 100 pamphlets distributed to 1 066 schools and to Head Office and 8 District offices in January 2019 Paid for campaigns which ran from 11 February 2019 to 15 March 2019 enabled the Department to reach the target audience through: � Print: Newspapers – 300 261 � Digital/social media – Impression 900 666 � Radio: Umhlobo Wenene, KFM, Heart –
806 960 listeners
Early Enrolment Campaign: 21 830 posters and 265 000 pamphlets distributed to 1 086 schools and 8 District offices (these totals are estimated at the 2017/18 totals as numbers depend on actual enrolment in Grade R & 6)
Early Enrolment Campaign: The digital campaign targeted specific audiences via Facebook, Twitter and Google ads. � 6 346 posters and 196 920 pamphlets
were distributed to 1 449 schools (including ECD centres) and to Head
� Office and the 8 district offices in January 2020. The paid for campaign ran from 11 February 2020 to 17 March 2020.
� The targeted reach was over 5,7 million listeners on various radio stations, like Umhlobo Wenene, KFM and Heart FM.
�

306 Annual Report 2019/2020
Annual Report for 2019/20 Financial YearVote 5: Department of Education
Province of the Western Cape
�Communication to Parents and Citizens Information was communicated through:
Early Enrolment Campaign: � Out of home advertising reaching 31,2
million people via foot traffic and more than 300 000 readers reached through print media during the campaign period.
� Social media paid for advertising: � Facebook: 1 898 260 impressions, i.e.
number of times it was posted and shared on timelines
� Twitter: reached 267 220 feeds on twitter
� Google ads: reached 636 671 individual feeds
Matric Support Campaign: 53 000 booklets distributed to Grade 12 learners enrolled at Secondary and Special Schools. (total depends on actual Grade 12 enrolment confirmed by June)
Matric Support Campaign: 55 500 booklets distributed to Grade 12 learners enrolled at Secondary and Special schools (total depends on actual Grade 12 enrolment confirmed by June)
Matric Support Campaign: 53 800 booklets distributed to Grade 12 learners enrolled at 450 Secondary and Special Schools (total depends on actual Grade 12 enrolment confirmed by June)
Mathematics and Language Campaign: The campaign was postponed to 2019/20 financial year, due to amongst others, the ELearning System development delays
Mathematics and Language Campaign: Traditional marketing campaign using radio, digital and out of home channels reaching our target audience of about 321 000 foundation phase learners
Mathematics and Language Campaign: Story Stars essay competition: � Booklets and Story Stars cut-outs were
distributed to all Grade 4 learners in January 2020
� Website and video were completed and launched. Video available in all 3 official languages
� Deadline for entries was 20 March 2020 Campaign to be completed in the 2020/21 Financial Year - as planned

307 Annual Report 2019/2020
Annual Report for 2019/20 Financial YearVote 5: Department of Education
Province of the Western Cape
�Communication to Parents and Citizens Information was communicated through: Anti-Bullying Campaign: Campaign was launched in August 2019 and promoted via Social Media in March 2019: � No pamphlets distributed during
2018/2019, as a different approach was implemented
� Produced 2 videos and a mobi site – promoted organically and via a paid for digital marketing campaign
� In November 2019, the campaign targeted Facebook with 16 000 views, Twitter and YouTube with 44 000 views
� In the March 2019 campaign, there were 255 823 views on Facebook, Twitter and YouTube
Anti-Bullying Campaign � Distribution of 1 096 000 pamphlets and
22 530 to 1 083 000 learners in 1 083 schools to reach parents of learners
� Language services marketing � Document flow of service requests Target numbers are dependent on learner enrolment and no. of schools
Anti-Bullying Campaign: Campaign could not be concluded in the 4th Quarter because of the COVID-19 pandemic. Materials for distribution could not be manufactured or procured because of the pandemic
Additional achievement: Information was also communicated through
a) Ad-hoc campaigns during the reporting period included:
� The Values Campaign: 21 250 posters � Safe Schools Poster Campaign: 3 800
posters b) The eLearning Poster Campaign: 14 610
posters. This campaign was also supported by a social media campaign via Facebook and Twitter during February and March 2019
The abovementioned posters were distributed to 1 906 WCED institutions, including, primary, high, special schools and ECD centres, Head Office and the 8 District offices

308 Annual Report 2019/2020
Annual Report for 2019/20 Financial YearVote 5: Department of Education
Province of the Western Cape
�Communication to Parents and Citizens Information was communicated through: c) Web services:
https://wcedonline.westerncape.gov.za/
d) Social media: https://wcedonline.westerncape.gov.za/western-cape-education-department
e) Publications: https://wcedonline.westerncape.gov.za/z-index
f) Annual Report: https://wcedonline.westerncape.gov.za/wced-annual-report
g) Annual Citizens’ Report: https://wcedonline.westerncape.gov.za/wced-report-citizens.
h) Media reports: https://wcedonline.westerncape.gov.za/media-releases
i) WCED-News: https://wcedonline.westerncape.gov.za/wced-news
j) Circulars: https://wcedonline.westerncape.gov.za/wced-circulars-and-minutes

309 Annual Report 2019/2020
Annual Report for 2019/20 Financial YearVote 5: Department of Education
Province of the Western Cape
Complaints mechanism
Current/actual complaints mechanism Desired complaints mechanism Actual achievements Examinations Registrations and Client Service Support Complaints/ Suggestions/ Compliments/ Queries are registered and monitored through:
Complaints/ Suggestions/ Compliments/ Queries are registered and monitored through:
Complaints/ Suggestions/ Compliments/ Queries were registered and monitored through:
a) Contact and Walk-in centres a) Contact and Walk-in centres a) Contact and Walk-in centres b) 3 907 requests for re-mark of
subjects/matric results
b) 5 200 requests for re-mark of subjects/matric results
b) 4 663 requests for re-mark of subjects/matric results: i. 4 417 NSC Nov 2019 re-mark requests
were processed and candidates were resulted
ii. 246 SC Nov 2019 re-mark requests were processed and candidates were resulted
The decrease in the number of requests for re-mark (against the desired standard), could be due to the compulsory closure of the WCED offices from 19 March 2020 due to the COVID-19 situation. The Walk-in Centre did not attend to face-to-face clients but a drop off box for completed applications were processed daily. Service delivery continued in the absence of face-to-face clients

310 Annual Report 2019/2020
Annual Report for 2019/20 Financial YearVote 5: Department of Education
Province of the Western Cape
�Current/actual complaints mechanism Desired complaints mechanism Actual achievements
c) 147 278 persons accessed the WCED NSC Results webpage
c) 83 606 persons accessed the WCED NSC Results webpage
c) The WCED online exams landing page was accessed 288 110 times during this period. The exam webpage contains registration information for both the SC and NSC examinations as well as links to resources, tuition centres and copies of admission letters and results Year on year with the increased access to cellphones and technology, the access to retrieve NSC results via the website should increase
d) 44 880 Individual NSC Results were accessed on the WCED NSC results webpage
d) 21 850 Individual NSC Results were accessed on the WCED NSC Results webpage
d) 37 338 Individual NSC Results were accessed on the WCED NSC Results webpage
Year on year with the increased access to cellphones and technology, the access to retrieve NSC results via the website should increase
Communication to Parents and Citizens Redress is offered via responses to the following channels:
Redress is offered via responses to the following channels:
Redress was offered via responses to the following channels:
a) Management of Social media a) Management of Social media a) Management of Social media: The Directorate filled an ASD post which manages Social media platforms for the WCED, improving the volume of content on sites

311 Annual Report 2019/2020
Annual Report for 2019/20 Financial YearVote 5: Department of Education
Province of the Western Cape
�Current/actual complaints mechanism Desired complaints mechanism Actual achievements
b) Improved turnaround time to written feedback (Contact and Walk-in centres)
b) Improve turnaround time to written feedback (Contact and Walk-in centres)
b) Improved turnaround time to written feedback (Contact and Walk-in centres): i. Two email addresses have been
advertised for use to encourage written communication for employees contacting Client Services to reduce having to take physical transport
ii. 24-hour turnaround time c) Managed on-line (website) feedback
mechanisms: https://wcedonline.westerncape.gov.za/give-us-your-feedback
c) Managed on-line (website) feedback mechanisms
c) Managed on-line (website) feedback mechanisms: well managed feedback via the “Give feedback” forms located on website. Numbers not accessible currently
Additional achievement: a) Phone, fax and email – See Access list on WCED
website: https://wcedonline.westerncape.gov.za/wced-services-access-schedule
b) Social media: https://wcedonline.westerncape.gov.za/western-cape-education-department
Written feedback (Contact and Walk-in centres) on WCED website: https://wcedonline.westerncape.gov.za/give-us-your-feedback
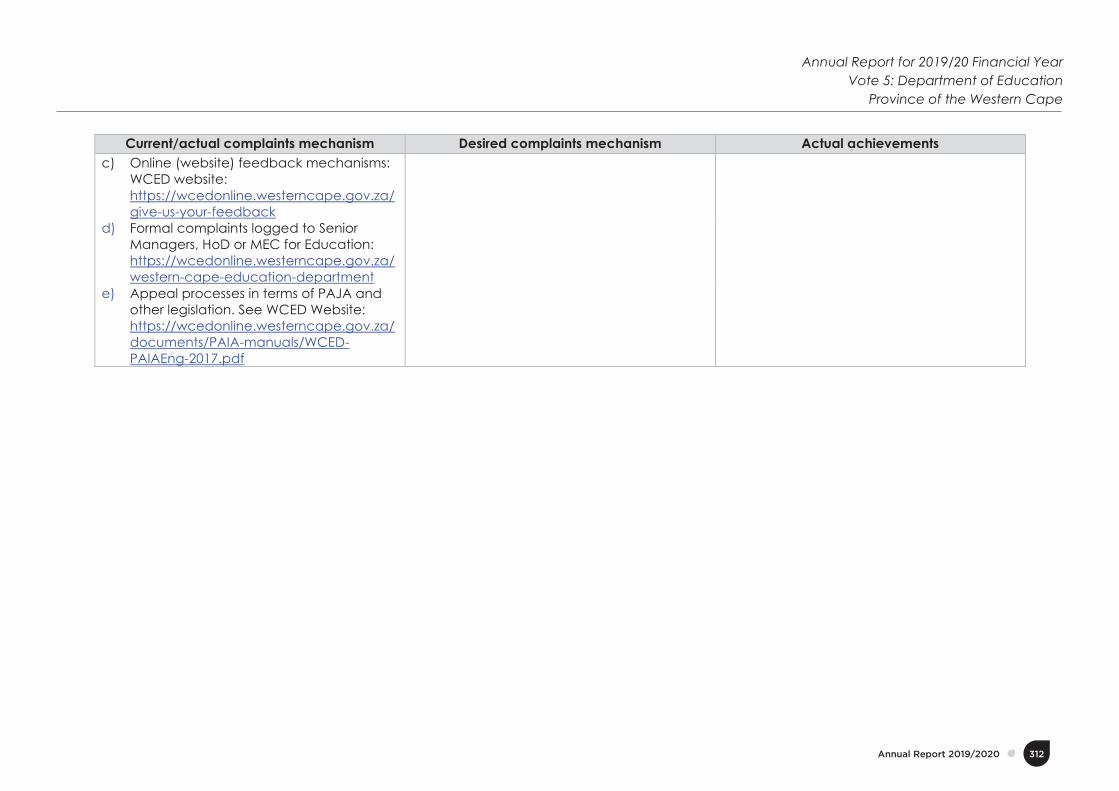
Annual R
epo
rt 2019/20
20
312 Annual Report 2019/2020
Annual Report for 2019/20 Financial YearVote 5: Department of Education
Province of the Western Cape
�Current/actual complaints mechanism Desired complaints mechanism Actual achievements
c) Online (website) feedback mechanisms: WCED website: https://wcedonline.westerncape.gov.za/give-us-your-feedback
d) Formal complaints logged to Senior Managers, HoD or MEC for Education: https://wcedonline.westerncape.gov.za/western-cape-education-department
e) Appeal processes in terms of PAJA and other legislation. See WCED Website: https://wcedonline.westerncape.gov.za/documents/PAIA-manuals/WCED-PAIAEng-2017.pdf

313Annual Report 2019/2020
Annual Report for 2019/20 Financial YearVote 5: Department of Education
Province of the Western Cape
p�
Appendix B: Dictionary of terms
Classes: are defined as “Register Class” Classrooms: refers to rooms where teaching and learning occurs, but
which are not designed for special instructional activities Education Expenditure: refers to all government non-personnel education
expenditure (inclusive of all sub-sectors of education including special schools, independent schools and conditional grants
Filled: is defined as having a permanent/ temporary teacher appointed in the post
Hospital Schools: refers to schools catering to learners who have been registered at other schools but, for medical reasons, receive access to learning at medical institutions. All projections will exclude hospital schools as the learners are registered at other public schools
LSEN Schools: refers to schools catering to learners with special needs. Placed: is defined as, securing appointment at a school in a
permanent capacity Professional non educator:
refers to personnel who are classified as paramedics, social workers, therapists, nurses but are not educators
Public Ordinary Schools: refers to ordinary schools only and excludes LSEN schools and excludes independent schools
Public schools: refers to public ordinary schools and LSEN schools but excluding independent schools i.e. a combined total
Sanitation facility: refers to all kinds of toilets such as pit latrine with ventilated pipe at the back of toilets, Septic Flush, Municipal Flush, Enviro Loo, Pit latrine and Chemical
SA SAMS: refers to a product specific school administration and management system. This version of SA SAMS is off-line. The WCED uses an automated, on-line system and is able to provide real time data namely Centralised Educational Management Information System (CEMIS)
Schools with electricity: refers to schools that have any source of electricity including Eskom Grid, solar panels and generators.
Smart classrooms: refers to a classroom with Wifi connectivity to broadband as well as a digital projector, whiteboard and teacher computing device as the minimum technological resources – all interlinked through Wifi
Special School: refer to schools resourced to deliver education to learners requiring high intensity educational and other support on either a full-time or a part-time basis.
Specialist room: is defined as a room equipped according to the requirements of the curriculum