part 2: category summaries reducing the environmental and ... ep priority products part2 cat... ·...
TRANSCRIPT

Part 2: Category Summaries
Reducing the environmental and
cost impacts of electrical products
Category summaries identifying environmental hotspots and reduction opportunities for 23 electrical product categories, resulting from research for the Product Sustainability Forum to identify, quantify and understand the environmental impacts of electrical products sold on the UK market.
Project code: RNF200-001 Research date: July – October 2011 Date: November 2012

The PSF is a collaboration of 80+ organisations made up of grocery and home improvement retailers and suppliers, academics, NGOs and UK Government representatives. It’s a platform for these organisations to measure, reduce and communicate the environmental performance of the grocery and home improvement products bought in the UK. Further information about the Forum can be found at www.wrap.org.uk/psf. Document reference: [e.g. WRAP, 2006, Report Name (WRAP Project TYR009-19. Report prepared by…..Banbury, WRAP]
Written by: Will Schreiber, Richard Sheane, Leigh Holloway
Analysis by: Kevin Lewis, Aida Cierco, Dr. Andrew Bodey, Xana Villa Garcia, Sam Matthews
Edited by: Justin French-Brooks and Anthea Carter
Front cover photography: [Add description or title of image.]
While we have tried to make sure this [report] is accurate, we cannot accept responsibility or be held legally responsible for any loss or damage arising out of or in
connection with this information being inaccurate, incomplete or misleading. This material is copyrighted. You can copy it free of charge as long as the material is
accurate and not used in a misleading context. You must identify the source of the material and acknowledge our copyright. You must not use material to endorse or
suggest we have endorsed a commercial product or service. For more details please see our terms and conditions on our website at www.wrap.org.uk.

Reducing the environmental and cost impacts of electrical products 3
Contents
Category 1 Televisions/monitors .................................................................................................................... 6
Category 2 Laptops .................................................................................................................................... 10
Category 3 Other display-based electronics .................................................................................................. 14
Category 4 Complex processing electronics .................................................................................................. 18
Categories 5 & 6 Simple processing electronics ............................................................................................. 22
Category 7 External power supplies ............................................................................................................. 25
Categories 9 & 10 Single function pumps and motors .................................................................................... 27
Category 11 Battery-powered pumps and motors ......................................................................................... 30
Category 12 Spatial cooling ......................................................................................................................... 33
Category 13 Spatial heating ........................................................................................................................ 37
Categories 14 & 15 Multi-function heating and cooling appliances .................................................................. 40
Categories 16 & 17 Heating and cooling other appliances .............................................................................. 43
Category 18 Microwaves ............................................................................................................................. 46
Categories 19 to 22 Lighting ....................................................................................................................... 49
Category 23 Solar PV ................................................................................................................................. 53
Category 24 Household wind turbines .......................................................................................................... 57
Acronyms and abbreviations
B2B business-to-business
CCFL cold-cathode fluorescent lamp
CE consumer electronics
CFL compact fluorescent lamp
CHP combined heat and power
CRT cathode ray tube
EP electrical product
EPA United States Environmental Protection Agency
EPEAT electronic product environmental assessment tool
ErP energy-related products
EST Energy Saving Trust
EuP energy-using product
FIT feed-in tariff
GHG greenhouse gas
GWP global warming potential
HVAC heating, ventilation and air conditioning
ICT information and communications technology
LCA lifecycle assessment
LCD liquid crystal display
LED light emitting diode
lm/W lumens per Watt
MCS Microgeneration Certification Scheme
MTP Market Transformation Programme
OLED organic light emitting diode
PC personal computer
PC-ABS polycarbonate-acrylonitrile butadiene styrene
PCB printed circuit board
PCBA printed circuit board assembly
PDP plasma display panel
PHB polyhydroxybutyrate
PLA polylactic acid
PV photovoltaic
RoHS restriction of hazardous substances
STB set-top box

Reducing the environmental and cost impacts of electrical products 4
USB universal serial bus (flash drive)
VSD variable speed drive
WEEE waste electrical and electronic equipment
Acknowledgements
Stakeholders contributed from a range of industry sectors, including manufacturers, facility managers and e-
waste handlers. The following organisations supported the project by providing their knowledge, guidance and
data to improve the analysis and recommendations presented in this document:
B&Q
Computer Aid
Inman
Interserve
ISE
Morphy Richards
MITIE
Panasonic
Reliance FM
Panasonic
Sainsbury’s
Skanska
Sony

Reducing the environmental and cost impacts of electrical products 5
Category Summaries
Summary documents have been produced for each of the electrical product (EP) categories used for the purposes
of this research. Further information can be found in Part 1, which presents the research results, and Part 3,
which explains the methodology behind the research.
The brief overviews in this document have been designed to engage both expert and non-expert audiences in
understanding the impacts associated with EPs, and to highlight potential environmental reduction opportunities.
Each summary has been produced at the technology group-level to facilitate the sharing of information between
product types that may have not historically been associated with one another (e.g. hair dryers and irons).
The following EP categories have a summary:
Category 1 – Televisions/monitors;
Category 2 – Laptops;
Category 3 – Other display-based electronics;
Category 4 – Complex processing electronics;
Categories 5 & 6 – Simple processing electronics;
Category 7 – External power supplies;
Categories 9 & 10 – Single function pumps and motors;
Category 11 – Battery-powered pumps and motors;
Category 12 – Spatial cooling;
Category 13 – Spatial heating;
Categories 14 & 15 – Multi-function appliances;
Categories 16 & 17 – Other appliances;
Category 18 – Microwaves;
Categories 19 to 22 – Lighting;
Category 23 – Solar PV; and
Category 24 – Household wind turbines.
A summary document was not produced for Category 8, multi-function pumps and motors (e.g. aquariums), due
to limited data availability.

Reducing the environmental and cost impacts of electrical products 6
Category 1 Televisions/monitors
Products
Data found PDP, LCD, CRT televisions
WEEE Category 3 – ICT, 4 – Consumer Electronics, 11 – Display equipment (UK only)
No/limited studies LED screens
Industry info
Relevant environmental
regulations
ErP Eco-design Directive
Requirements for power consumption in standby and off-mode. Additional targeting
of external power supplies will have an impact on this category.
RoHS Directive
Limits the presence of heavy metals and certain flame retardants.
WEEE Directive
Covers the financing and disposal of end-of-life electrical products.
EU Energy Efficiency Minimum Standards
All TVs to comply with mandatory energy efficiency standards by mid-2012.
Use-phase initiatives From December 2011 all televisions will be required to show energy efficiency
labels at the point of sale using the A+ to G rating system.
Product category
environmental initiatives
Version 5.0 of the ENERGY STAR Display specification was finalised in March 2009
with tier I requirements implemented in October 2009 and tier II requirements
implemented in October 2011.
The Energy Saving Trust endorses a range of energy efficient TVs & ICT products
under their Energy Saving Trust Recommended (ESTR) label.
Summary
A TV or monitor is generally made up of a power supply (transformer), power control board, picture control board,
the screen, backlights to illuminate the screen and the casing/stand. Standard backlights are mercury containing
cold-cathode fluorescent tubes whilst newer models have more efficient, longer lasting and less hazardous light
emitting diode (LED) backlights. An organic LED (OLED) display functions without a backlight. It can display deep
black levels and can be thinner and lighter than liquid crystal displays (LCD). In low ambient light conditions such
as darkened rooms, an OLED screen can achieve a higher contrast ratio than an LCD - whether the LCD uses either
tubes or LED backlights. OLED is currently only used on small devices such as some mobile phones but is likely to
become the norm for all displays.1 Televisions account for the largest share of the energy used by the consumer electronics (CE) group of products (40% of total CE consumption in 2009). The number of televisions in households is expected to rise from 59.5 million to 72.2 million (21%) between 2009 and 2020. Average on-time for the main television in the home is expected to decrease from 4.9 hr/day to 4.2 hr/day, due to improvements in auto power down.2 In addition, there is an increasing demand for larger screens, which are made possible by improvements in picture quality (such as high definition) and are gradually becoming more affordable. The increase in energy consumption resulting from larger screens and more stock, is offset by improvements in screen efficiencies and shorter on-times. Over the next few years, new backlighting technologies, such as LED, and variable brightness control are expected to double efficiency of LCD televisions. This will also result in further material savings as television weight continues to decline, year-on-year, as technology improves. For example, a 2006 mid-range LCD TV from Sony weighed approximately 27kg while a comparable model today weighs roughly 45% less than this.
1 Defra: Saving Energy Through Better Products and Appliances 2 Also see http://www.tvlicensing.co.uk/resources/library/BBC/MEDIA_CENTRE/TeleScope_report.pdf for usage patterns and assumptions surrounding the migration of programme watching from TVs to other devices (e.g. computers).

Reducing the environmental and cost impacts of electrical products 7
Hotspots
The most significant stage of the lifecycle for these products is the use phase, followed by materials and
production phase. Consumer behaviour has a large influence on the environmental impact of these products. In
terms of materials, the display is one of the major contributors to environmental impact.
The table below shows the main hotspots for this category. The table reflects the impacts for the five
environmental indicators by lifecycle stage. The primary hotspot for each metric is colour coded red and indicates
that the impact is greater than 30% of the total footprint. The secondary hotspot is colour coded orange and
ranges between 10% and 29% of total impact. Low level contributions are colour coded green and indicate the
impact is less than 9% of the total impacts. Lack of data availability for a metric is indicated by a blank white
space.
High waste and water impacts during the use phase are associated with energy generation.
GHG Energy Materials Waste Water
Materials 11% 10% 100% 46% 30%
Production 4% 3% - 2% 1%
Use 85% 88% - 44% 73%
Waste 0% 0% - 8% -4%
Material Risk
The traffic indicator to the right indicates the
material risk associated with the production of
products within this category for selected materials.
The table below shows the location and type of
material risk:
High Medium Low
Ma
teri
al
Pri
ma
ry
Pro
du
cti
on
Lo
ca
tio
n
Re
cycli
ng
Ra
te
Ma
teri
al
Pri
ma
ry
Pro
du
cti
on
Lo
ca
tio
n
Re
cycli
ng
Ra
te
Ma
teri
al
Pri
ma
ry
Pro
du
cti
on
Lo
ca
tio
n
Re
cycli
ng
Ra
te
Gold China 27% Tin China 30-
40% Iron China 22%
Palladium
(Platinum) Russia 35 % Antimony China 11% Copper Chile 20%
Silver Peru 16% Nickel Russia 32%
Steel China 22%
Plastics Saudi Arabia 25%
Aluminium Australia 35%
Indium China 0%
Tantalum Australia 4%
Gallium Germany 0%
Rare Earths China 1%
Cobalt Congo 16%
High 13%
Medium 81%
Low 6%
Material Risk

Reducing the environmental and cost impacts of electrical products 8
Reduction Opportunities
Product
design &
specification
Production
Process
In-use End of life
The opportunities below are in order of savings potential and opportunity point:
Opportunity Lifecycle Stage Decision Maker Environmental
Savings Potential Cost Implications
Widen use of
dynamic dimming
displays
Manufacturer 5% to 10% power
saving in on-mode
Increase production
costs
Widen use of LED
backlights for LCD
displays
Manufacturer
10% to 20%
weight reduction
30% to 50% on
mode power
saving
Increase production
costs; however,
manufacturing
efficiencies are
rapidly lowering
these
Reduced cooling
Manufacturer Limited Expected decrease
Reduced amounts
of steel + high
recycled content
Manufacturer General weight
reduction Expected decrease
Recycled content in
plastic (PC-ABS) Manufacturer Limited
Potential 13% cost
savings
Bio-plastics (PLA or
PHB derivatives) Manufacturer
Fujitsu suggest
40% reduction in
embodied energy
of case materials
Neutral, or slight
increase
Reduced fasteners
/ components Manufacturer
5-10% weight
reduction Variable
Design for recycling
Manufacturer - -
Design for repair/
upgrade Manufacturer - -
Low energy chips
Manufacturer 50% energy
reduction Unknown
Greater PCB
integration Manufacturer
30% reduced PCB
size
Unquantified
savings
Printed electronics
Manufacturer 80% weight
reduction
Unquantified
savings
Low energy
memory Manufacturer Zero standby power Unknown
Adopt multi-thread
processing units Manufacturer Variable Unknown
Thermal bump for
temperature contol Manufacturer Variable Unknown

Reducing the environmental and cost impacts of electrical products 9
Potential areas for research/follow-up
Good quality coverage exists for GHG and energy footprints throughout category lifecycle stages. Limited
information is currently available on the full material, waste and water impacts and further research is
recommended. Particular emphasis should be placed on the manufacturing stage due to production process
complexities.
GHG Energy Materials Waste Water
Materials
Production
Use
Waste
Key
No data available
Some data available (1 study)
Enough data available (2 or more studies)
Sources of information
Reference Publication Date Confidentiality
CHI MEI OPTOELECTRONICS CORP., 2006. Environmental Product
Declaration N154 series, CCFL Backlight. Available at:
http://gryphon.environdec.com/data/files/6/7625/ENG_TFT_LCD_
EPD.pdf [Accessed august 2011]
2006 Public
Fraunhofer IZM, 2007. Consumer electronics: televisions.
Preparatory Study EuP Lot 5
2007 Public
Hischier, R. & Baudin, I., 2010. LCA study of a plasma television
device. International Journal of Lifecycle Assessment (2010)
15:428–438
2010 Public
WRAP, 2010. Appendix 5 Product Summary Sheets - Electrical
goods LCA
2010 Public
WRAP, 2010. Bills of Materials - Electrical goods 2010 Public
Summary history
Last updated by Will Schreiber
Last updated 1 November 2011
Contributors Will Schreiber, Aida Cierco, Mark Hilton (SKM)
Reducing the environmental and cost impacts of electrical products 10
Category 2 Laptops
Products
Data found Laptops
WEEE Category 3 – ICT Equipment
No/limited studies -
Industry info
Relevant environmental
regulations
ErP Eco-design Directive
Laptops, computing equipment and digital photo frames (Lot 3)
Draft regulation out for consultation.
RoHS Directive
Limits the presence of heavy metals and certain flame retardants.
WEEE Directive
Covers the financing and disposal of end-of-life electrical products.
Batteries Directive
Requires user-replaceable batteries and restricts heavy metal use.
Use-phase initiatives -
Product category
environmental initiatives
EPEAT and Energy Star programmes.
Summary
This product category is typically composed of portable products that come with a range of components including:
external power supply, rechargeable battery, flat panel display (LCD or OLED), processing board, hard-drive and/or
SD memory card, CD/DVD drive, cooling fan, keyboard.
Products in this category are usually purchased and/or upgraded by users approximately every two to three years
for technology or style reasons. However, the devices often physically last longer in practice (five years or more).
Laptops have been fairly stable in terms of technological advancement. Over the past few years there has been a
move towards multi-threaded processing chips to improve battery power management for these portable products.
Recently, the development of tablet computers has begun to steer consumers towards lower impact products that
offer more limited functionality. Whilst this transition can support low impact consumption, the way the technology
is rolled out and marketed to consumers has the potential to significantly increase them at the same time. For
example, selling tablet computers as ‘style’ devices that can be treated like mobile phones may drastically reduce
the consumer lifespan expectation of the device.
Hotspots
The most significant stage of the lifecycle for these products is the use phase, followed by materials and
production phases. Consumer behaviour has a large influence on the environmental impact of these products. In
terms of materials, the display is one of the major contributors to the materials environmental impact.
The table below shows the main hotspots for this category. The table reflects the impacts for the five
environmental indicators by lifecycle stage. The primary hotspot for each metric is colour coded red and indicates
that the impact is greater than 30% of the total footprint. The secondary hotspot is colour coded orange and
ranges between 10% and 29% of the total impact. Low level contributions are colour coded green and indicate
the impact is less than 9% of the total impacts. Lack of data availability for a metric is indicated by a blank white
space.

Reducing the environmental and cost impacts of electrical products 11
GHG Energy Materials Waste Water
Materials 28% 22% 100% 44% 72%
Production 8% 5% - 3% 1%
Use 65% 73% - 41% 33%
Waste 0% 0% - 12% -6%
Material Risk
The traffic indicator to the right indicates the material
risk associated with the production of products within
this category for selected materials.
The table below shows the location and type of
material risk:
High Medium Low
Ma
teri
al
Pri
ma
ry
Pro
du
cti
on
Lo
ca
tio
n
Re
cycli
ng
Ra
te
Ma
teri
al
Pri
ma
ry
Pro
du
cti
on
Lo
ca
tio
n
Re
cycli
ng
Ra
te
Ma
teri
al
Pri
ma
ry
Pro
du
cti
on
Lo
ca
tio
n
Re
cycli
ng
Ra
te
Gold China 27% Tin China 30-
40% Iron China 22%
Palladium
(Platinum) Russia 35 % Antimony China 11% Copper Chile 20%
Silver Peru 16% Nickel Russia 32%
Steel China 22%
Plastics Saudi Arabia 25%
Aluminium Australia 35%
Tantalum Australia 4%
Gallium Germany 0%
Magnesium China 14%
Rare Earths China 1%
Lithium Chile 0%
High 12%
Medium 69%
Low 19%
Material Risk

Reducing the environmental and cost impacts of electrical products 12
Reduction Opportunities
Product
design &
specification
Production
Process
In-use End of life
The opportunities below are in order of savings potential and opportunity point:
Opportunity Lifecycle Stage Decision Maker Environmental
Savings Potential Cost Implications
Widen use of
dynamic dimming
displays
Manufacturer 5% to 10% power
saving
Increase production
costs
Widen use of LED
backlights for LCD
displays
Manufacturer
10% to 20%
weight reduction
30% to 50% on
mode power
saving.
Increase production
costs
Reduced cooling
Manufacturer Limited Expected decrease
Reduced amounts
of steel + high
recycled content
Manufacturer General weight
reduction Expected decrease
Recycled content in
plastic (PC-ABS) Manufacturer Limited
Potential 13% cost
savings
Bio-plastics (PLA or
PHB derivatives) Manufacturer
Fujitsu suggest
40% reduction in
embodied energy
of case materials
Neutral, or slight
increase
Reduced fasteners
/ components Manufacturer
5-10% weight
reduction Variable
Design for recycling
Manufacturer - -
Design for repair/
upgrade Manufacturer - -
Low energy chips
Manufacturer 50% energy
reduction Unknown
Greater PCB
integration Manufacturer
30% reduced PCB
size
Unquantified
savings
Printed electronics
Manufacturer 80% weight
reduction
Unquantified
savings
Low energy
memory Manufacturer Zero standby power Unknown
Adopt multi-thread
processing units Manufacturer Variable Unknown
Thermal bump for
temperature control Manufacturer Variable Unknown
Potential areas for research/follow-up
Good quality coverage exists for GHG and energy footprints throughout category lifecycle stages. Limited
information is currently available on the full material, waste and water impacts and further research is
recommended. Particular emphasis should be placed on the manufacturing stage due to production process

Reducing the environmental and cost impacts of electrical products 13
complexities.
GHG Energy Materials Waste Water
Materials
Production
Use
Waste
Key
No data available
Some data available (1 study)
Enough data available (2 or more studies)
Sources of information
Reference Publication Date Confidentiality
IVF Industrial Research and Development Corporation, 2005.
Personal Computers (desktops and laptops) and computer
monitors, Preparatory Study EuP Lot 3
2005 Public
WRAP, 2010. Appendix 5 Product Summary Sheets - Electrical
goods LCA
2010 Public
WRAP, 2010. Bills of Materials - Electrical goods 2010 Public
Summary history
Last updated by Will Schreiber
Last updated 1 November 2011
Contributors Will Schreiber, Mark Hilton (SKM), Celena Fernandez (SKM), Aida Cierco

Reducing the environmental and cost impacts of electrical products 14
Category 3 Other display-based electronics Products
Data found Mobiles, MP3 players, tablet
WEEE Category 3 – ICT Equipment
No/limited studies Satellite navigation units
Industry info
Relevant environmental
regulations
ErP Directive
External Power Supplies standby and off-mode losses (Lot 7).
RoHS Directive
Limits the presence of heavy metals and certain flame retardants.
WEEE Directive
Covers the financing and disposal of end-of-life electrical products.
Batteries Directive
Requires user-replaceable batteries and restricts heavy metal use.
Use-phase initiatives -
Product category
environmental initiatives
Blue Angel eco-labels for computers (RAL-UZ 78) and mobile phones.
Summary
This product category is typically composed of portable products that come with a range of components including:
external power supply, rechargeable battery, flat panel display (LCD or OLED), processing board, hard-drive and/or
SD memory card, sim card (phones/3G devices only), keyboard (some phones).
Products in this category are usually purchased and/or upgraded by users approximately every two to three years
(technology/style led). However, the devices often physically last longer in practice (five years or more) and can
have second lives, often overseas (e.g. mobile phones). There are currently many developments taking place in
this category to investigate the use of renewable and ‘off grid’ power by these products.
Significant convergence is taking place across these products. Many of the underlying technologies are being
incorporated into new multi-use devices that are slowly making the single-use ones redundant (e.g. mobiles are
replacing satellite navigation devices). At the same time, existing multi-use technologies (e.g. laptops) are
beginning to be replaced with new technologies that have the potential to significantly reduce in-use impacts (e.g.
tablets). Whilst this transition can support low impact consumption, the way the technology is rolled out and
marketed to consumers has the potential to significantly increase them at the same time.
In terms of the mainstream market, reducing hazardous substances, conflict minerals and compliance with environmental regulations are three of the main focus areas for the likes of Sony-Ericsson, Nokia, Samsung, LG etc.
Recycled Content
Several phones now contain recycled content plastics (e.g. Sony Ericsson Greenheart series
including the Elm; Samsung Blue Earth). Some, including Blue Earth, have solar panel chargers,
although, given that ~60% of a phone’s carbon impact is in manufacture and upstream
impacts and only ~30% is in the use phase, the lifecycle benefits have been questioned by
some manufacturers. Recyclability is not a great issue in the sense that small WEEE gets
shredded and precious metals are recovered through PCB smelting.

Reducing the environmental and cost impacts of electrical products 15
Hotspots
This category covers a wide range of products. The lifecycle GHG and energy impacts of this group of products
are reasonably well studied; however, there are no studies available for lifecycle material, waste and water
impacts.
The main impacts of this category are in the material composition of the product, followed by the use phase.
Unlike many electrical products, the use phase is not a dominant part of the product footprint due to minimal
processing power and efficient use of battery technology.
The main materials that are used in these products vary, ranging from aluminium to other metals and plastics.
The table below shows the main hotspots for this category. The table reflects the impacts for the five
environmental indicators by lifecycle stage. The primary hotspot for each metric is colour coded red and indicates
that the impact is greater than 30% of the total footprint. The secondary hotspot is colour coded orange and
ranges between 10% and 29% of the total impact. Low level contributions are colour coded green and indicate
the impact is less than 9% of the total impact. Lack of data availability for a metric is indicated by a blank white
space.
GHG Energy Materials Waste Water
Materials 62% 66% 100% - -
Production 8% 14% - - -
Use 29% 19% - - -
Waste 1% 1% - - -
Material Risk
The traffic indicator to the right indicates the material risk
associated with the production of products within this category
for selected materials.
The table below shows the location and type of material risk:
High Medium Low
Ma
teri
al
Pri
ma
ry
Pro
du
cti
on
Lo
ca
tio
n
Re
cycli
ng
Ra
te
Ma
teri
al
Pri
ma
ry
Pro
du
cti
on
Lo
ca
tio
n
Re
cycli
ng
Ra
te
Ma
teri
al
Pri
ma
ry
Pro
du
cti
on
Lo
ca
tio
n
Re
cycli
ng
Ra
te
Gold China 27% Tin China 30-
40% Iron China 22%
Palladium
(Platinum) Russia 35 % Antimony China 11% Copper Chile 20%
Silver Peru 16% Nickel Russia 32%
Steel China 22%
Plastics Saudi
Arabia 25%
Aluminium Australia 35%
Cobalt Congo 16%
Tantalum Australia 4%
Gallium Germany 0%
Magnesium China 14%
Rare Earths China 1%
Lithium Chile 0%
High 12%
Medium 70%
Low 18%
Material Risk

Reducing the environmental and cost impacts of electrical products 16
Reduction Opportunities
Product
design &
specification
Production
Process
In-use End of life
The opportunities below are in order of savings potential and opportunity point:
Opportunity Lifecycle Stage Decision Maker Environmental
Savings Potential Cost Implications
Widen use of
dynamic dimming
displays
Manufacturer 5% to 10% power
saving
Increase production
costs
Widen use of LED
backlights for LCD
displays
Manufacturer
10% to 20%
weight reduction
30% to 50% on
mode power
saving.
Increase production
costs
Wider use of OLED
displays Manufacturer
~80% weight
reduction on
screen
40% energy
reduction
Increase production
costs
Reduced cooling
Manufacturer Limited Expected decrease
Reduced amounts
of steel + high
recycled content
Manufacturer General weight
reduction Expected decrease
Recycled content in
plastic (PC-ABS) Manufacturer Limited
Potential 13% cost
savings
Bio-plastics (PLA or
PHB derivatives) Manufacturer
Fujitsu suggest
40% reduction in
embodied energy
of case materials
Neutral, or slight
increase
Reduced fasteners
/ components Manufacturer
5-10% weight
reduction Variable
Design for recycling
Manufacturer - -
Design for repair/
upgrade Manufacturer - -
Low energy chips
Manufacturer 50% energy
reduction Unknown
Greater PCB
integration Manufacturer
30% reduced PCB
size
Unquantified
savings
Printed electronics
Manufacturer 80% weight
reduction
Unquantified
savings
Low energy
memory Manufacturer Zero standby power Unknown
Adopt multi-thread
processing units Manufacturer Variable Unknown
Thermal bump for
temperature control Manufacturer Variable Unknown

Reducing the environmental and cost impacts of electrical products 17
Potential areas for research/follow-up
Mobile phones have a good level of GHG and energy lifecycle coverage through a range of studies that have
taken place as part of the European Commission’s Eco-design review, as well as discrete manufacturer studies.
Limited information is available for other products within this group.
Material, waste and water information was not available for review.
GHG Energy Materials Waste Water
Materials
Production
Use
Waste
No data available
Some data available (1 study)
Enough data available (2 or more studies)
Sources of information
Reference Publication Date Confidentiality
Apple, 2010. iPhone 4 Environmental Report. Available at:
http://images.apple.com/environment/reports/docs/iPhone_4_Pro
duct_Environmental_Report.pdf. [Accessed August 2011]
2010 Public
Apple, 2010. ipod touch Environmental Report. Available at:
http://images.apple.com/environment/reports/docs/iPodtouch_Pro
duct_Environmental_Report_2010.pdf. [Accessed August 2011]
2010 Public
Apple, 2011. MacBook Environmental Report. Available at:
http://images.apple.com/environment/reports/docs/MacBook-Pro-
15-inch-Environmental-Report-Feb2011.pdf . [Accessed
September 2011]
2011 Public
Apple, 2011. iPad Environmental Report. Available at:
http://images.apple.com/environment/reports/docs/iPad_2_Enviro
nmental_Report.pdf [Accessed September 2011]
2011 Public
Nokia, 2011. Nokia product declaration X7-00.1. Available at:
http://nds1.nokia.com/eco_declaration/files/eco_declaration_phon
es/X7-00.1_Eco_profile.pdf [Accessed 15th September]
2011 Public
WRAP, 2010. Appendix 5 Product Summary Sheets - Electrical
goods LCA
2010 Public
WRAP, 2010. Bills of Materials - Electrical goods 2010 Public
Summary history
Last updated by Will Schreiber
Last updated 1 November 2011
Contributors Will Schreiber, Mark Hilton (SKM), Celena Fernandez (SKM), Aida Cierco
Reducing the environmental and cost impacts of electrical products 18
Category 4 Complex processing electronics Products
Data found Set-top box, desktop, camera
WEEE Category 3 – ICT Equipment, 4 – Consumer electronics
No/limited studies
Industry info
Relevant environmental
regulations
ErP Eco-design Directive
Implementing directive on eco-design requirements for Computers and Servers in
consultation (Lot 3).
Implementing directive on eco-design requirements for standby and off modes in
force (Lot 6).
Implementing directive on eco-design requirements for battery chargers and
external power supplies in force (Lot 7).
Voluntary agreement for complex set top boxes in consultation (Lot 18).
Implementing directive on eco-design requirements for simple set top boxes in
force (Lot 18a).
RoHS Directive
Limits the presence of heavy metals and certain flame retardants.
WEEE Directive
Covers the financing and disposal of end of life electrical products.
Use-phase initiatives -
Product category
environmental initiatives
Energy Star 5.0 and EPEAT
Summary
Complex processing electronics typically include external power supplies, densely packed PCBs, low power motor
and gear assemblies (e.g. DVD drive) and a variety of input-output ports/devices packaged in a rigid plastic outer
casing. These products are typically permanently plugged into mains sockets and are increasingly becoming the
subject of standby regulations to limit the amount of consumption whilst not in use.
The lifespan for this category is estimated to be around five years. One of the primary drivers for replacement is
the rapid technological and product development taking place in the industry. It is therefore common for these
products to have premature end of life when manufacturers upgrade their products. There is a mixed second-life
scenario available for these products, depending on how much the technology has advanced and consumer attitude
to change, with most of the re-usable products being sent to overseas markets. Facility Management companies
responsible for disposal are far more likely, compared to consumers, to investigate these opportunities.
Due to the increasing incorporation of web-based
technology into these products some of the power
management functionality has been overlooked to
provide an 'always on' experience for the user.
Although individual product use patterns will vary,
high processing demand products (e.g. digital set-
top recorders) are quickly becoming areas of
concern for consumer consumption patterns. In the
U.S. these products are, in some cases, consuming
more energy than refrigerators.3
3 Natural Resources Defense Council, 2011, Better viewing, lower energy bills, and less pollution: improving the efficiency of
television set-top boxes. Available at: http://www.nrdc.org/energy/settopboxes.asp Accessed 20 September 2011.
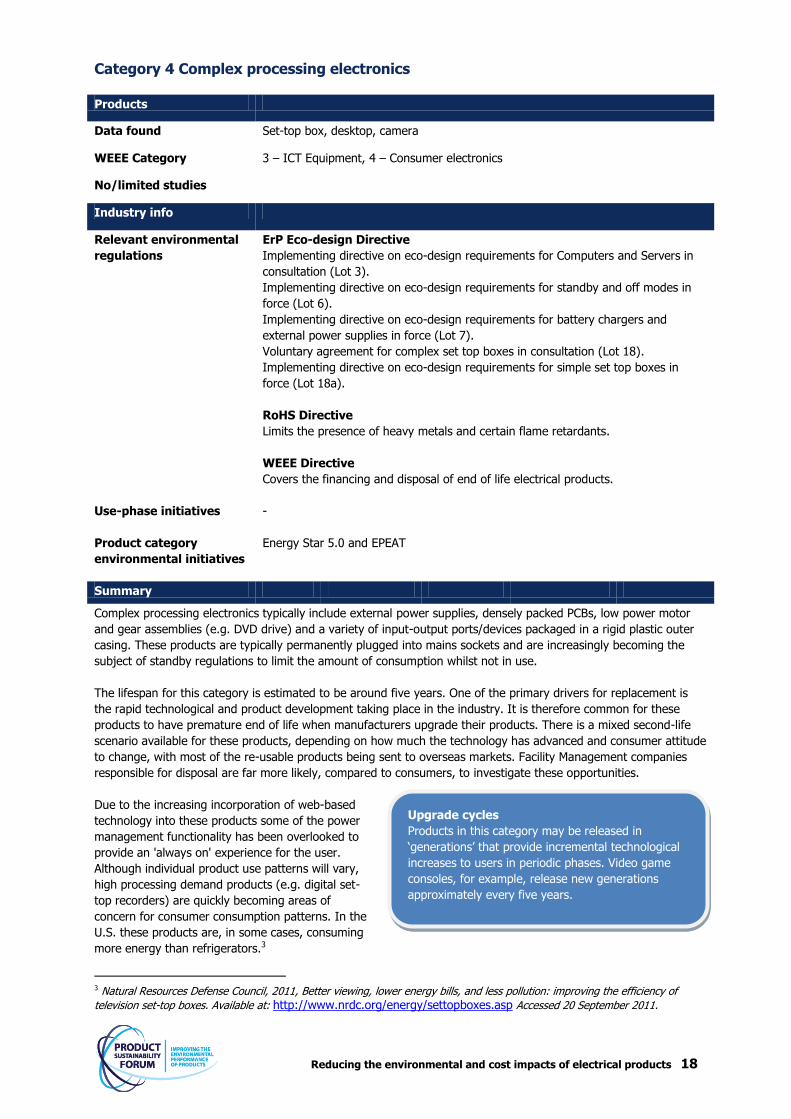
Upgrade cycles
Products in this category may be released in
‘generations’ that provide incremental technological
increases to users in periodic phases. Video game
consoles, for example, release new generations
approximately every five years.

Reducing the environmental and cost impacts of electrical products 19
Hotspots
In terms of data coverage, lifecycle GHG impacts are well studied for this product group which includes both
stationary (set-top box (STB), desktop computer) and mobile (digital camera) processing-based electronics. STBs
have data across all five impact metrics. Two desktop PC LCAs have been sourced which are product-specific.
Given the broad range of PC specifications, this is a slight cause for concern.
The use phase appears to be the dominant impact area for this product group. Materials impact is also apparent
from the data. Materials hotspots vary by product and include stainless steel coating, plastic housing and
aluminium. There is a research gap for game consoles. However, based on data from similar products within the
category, it is likely that the use phase is again the dominant impact area.
The table below shows the main hotspots of this category. The table reflects the impacts for the five
environmental indicators by lifecycle stage. The primary hotspot for each metric is colour coded red and indicates
that the impact is greater than 30% of the total footprint. The secondary hotspot is colour coded orange and
ranges between 10% and 29% of the total impact. Low level contributions are colour coded green and indicate
the impact is less than 9% of the total impact. Lack of data availability for a metric is indicated by a blank white
space.
GHG Energy Materials Waste Water
Materials 14% 11% 100% 55% 47%
Production 7% 4% - 1% 1%
Use 79% 84% - 37% 56%
Waste 0% 0% - 5% -4%
Material Risk
The traffic indicator to the right indicates the material risk
associated with the production of products within this category
for selected materials.
The table below shows the location and type of material risk:
High Medium Low
Ma
teri
al
Pri
ma
ry
Pro
du
cti
on
Lo
ca
tio
n
Re
cycli
ng
Ra
te
Ma
teri
al
Pri
ma
ry
Pro
du
cti
on
Lo
ca
tio
n
Re
cycli
ng
Ra
te
Ma
teri
al
Pri
ma
ry
Pro
du
cti
on
Lo
ca
tio
n
Re
cycli
ng
Ra
te
Gold China 27% Tin China 30-
40% Iron China 22%
Palladium
(Platinum) Russia 35 % Antimony China 11% Copper Chile 20%
Silver Peru 16% Nickel Russia 32%
Steel China 22%
Plastics Saudi Arabia 25%
Aluminium Australia 35%
Cobalt Congo 16%
Tantalum Australia 4%
Gallium Germany 0%
Magnesium China 14%
Rare Earths China 1%
Lithium Chile 0%
High 12%
Medium 70%
Low 18%
Material Risk

Reducing the environmental and cost impacts of electrical products 20
Reduction Opportunities
Product
design &
specification
Production
Process
In-use End of life
The opportunities below are in order of savings potential and opportunity point:
Opportunity Lifecycle Stage Decision Maker Environmental
Savings Potential Cost Implications
Reduced cooling
Manufacturer Limited Expected decrease
Reduced amounts
of steel + high
recycled content
Manufacturer General weight
reduction Expected decrease
Recycled content in
plastic (PC-ABS) Manufacturer Limited
Potential 13% cost
savings
Bio-plastics (PLA or
PHB derivatives) Manufacturer
Fujitsu suggest
40% reduction in
embodied energy
of case materials
Neutral, or slight
increase
Reduced fasteners
/ components Manufacturer
5-10% weight
reduction
Design for recycling
Manufacturer -
Design for repair/
upgrade Manufacturer -
Low energy chips
Manufacturer 50% energy
reduction Unknown
Greater PCB
integration Manufacturer
30% reduced PCB
size
Unquantified
savings
Printed electronics
Manufacturer 80% weight
reduction
Unquantified
savings
Low energy
memory Manufacturer Zero standby power Unknown
Adopt multi-thread
processing units Manufacturer Variable Unknown
Thermal bump for
temperature control Manufacturer Variable Unknown
Potential areas for research/follow-up
Good quality information is available for most products represented in this category. Future research should focus
on end-of-life material handling and recovery.
GHG Energy Materials Waste Water
Materials
Production
Use
Waste
No data available
Some data available (1 study)
Enough data available (2 or more studies)

Reducing the environmental and cost impacts of electrical products 21
Sources of information
Reference Publication Date Confidentiality
BFF, 2006. An Ecological Footprint and Carbon Audit of CD player
BB-01- DAB Intempo Digital
2006 Private
Fujitsu, 2010. White Paper Lifecycle Assessment and Product
Carbon Footprint – Fujitsu ESPRIMO E9900 Desktop PC. (Accessed
September 2011)
2010 Public
IVF Industrial Research and Development Corporation, 2005.
Work on Preparatory Studies for Eco-Design Requirements of
EuPs: Lot 3 Personal Computers (desktops and laptops) and
computer monitors (Accessed September 2011)
2005 Public
MVV Consulting GmbH, 2007. Work on Preparatory Studies for
Eco-Design Requirements of EuPs: Simple Digital TV Converters
(Simple Set Top Boxes)Report to European Commission (Accessed
September 2011)
2007 Public
WRAP, 2010. Appendix 5 Product Summary Sheets - Electrical
goods LCA
2010 Public
WRAP, 2010. Bills of Materials - Electrical goods 2010 Public
Summary history
Last updated by Will Schreiber
Last updated 1 November 2011
Contributors Will Schreiber, Mark Hilton (SKM), Aida Cierco, Sam Matthews

Reducing the environmental and cost impacts of electrical products 22
Categories 5 & 6 Simple processing electronics
Products
Data found Printers
WEEE Category 3 – IT Equipment, 4 – Consumer electronics, 8 Monitoring and Control Equipment
No/limited studies Telephones, calculators, thermostatic kits
Industry info
Relevant environmental
regulations
ErP Eco-design Directive
Imaging equipment: Copiers, faxes, printers, scanners, multi-functional devices (Lot
4).
RoHS Directive
Limits the presence of heavy metals and certain flame retardants.
WEEE Directive
Covers the financing and disposal of end of life electrical products.
Use-phase initiatives -
Product category
environmental initiatives
-
Summary
Products within this category are typically composed of:
1) rigid plastic casing;
2) key pad or button interface that allows the user to complete a function; and
3) a simple circuit board.
Depending on the product, additional parts may be included to differentiate the consumer benefit. For example,
a radio may add small speakers and signal processing components, while a home alert system may add an LCD
panel. Although these additional components change the fundamental use of the technology, the majority
material makeup remains unchanged.
Simple processing electronics require little power consumption during their operation and therefore may be
powered by batteries, mains or alternative power sources (e.g. solar photovoltaic cells, USB). Life expectation is
highly dependent on the nature and frequency of use, but can be estimated to be as high as 10 years across the
product category. These are not items that would be necessarily affected by new technologies, as essentially the
function and design has remained the same over the years. Therefore, the likely reason for replacement of
products within this category would be due to failure of the button circuitry or print fading on the input
mechanisms. Both of these failure properties are typically due to high repetitive use.
For most products within this category, the aesthetic design has remained the same and, in some cases, resulted
in smaller sized products fulfilling the same function. In some product groups, such as keyboards and computer
mice, wireless technology has been added to the core functional makeup.
Hotspots
This category is mainly composed of printers. There was a good level of available data for the studied impacts.
The highest impact profile of this category is in the use phase for GHG, energy and water, closely followed by
materials impact. Some products in this category, such as printers, will have in-use material requirements, but
as these are inconsistent across all categories the table below does not include them.
The table shows the main hotspots for this category, reflecting the impacts for the five environmental indicators
by lifecycle stage. The primary hotspot for each metric is colour coded red and indicates that the impact
is greater than 30% of the total footprint. The secondary hotspot is colour coded orange and ranges between
10% and 29% of total impact. Low-level contributions are colour coded green and indicate the impact is less

Reducing the environmental and cost impacts of electrical products 23
than 9% of the total. Lack of data availability for a metric is indicated by a blank white space.
GHG Energy Materials Waste Water
Materials 16% 15% 100% 65% 40%
Production 7% 6% - 0% 1%
Use 75% 79% - 19% 62%
Waste 2% 1% - 13% -2%
Material Risk
The traffic indicator to the right indicates the material risk
associated with the production of products within this
category for selected materials.
The table below shows the location and type of material
risk:
High Medium Low
Ma
teri
al
Pri
ma
ry
Pro
du
cti
on
Lo
ca
tio
n
Re
cycli
ng
Ra
te
Ma
teri
al
Pri
ma
ry
Pro
du
cti
on
Lo
ca
tio
n
Re
cycli
ng
Ra
te
Ma
teri
al
Pri
ma
ry
Pro
du
cti
on
Lo
ca
tio
n
Re
cycli
ng
Ra
te
Gold China 27% Tin China 30-
40% Iron China 22%
Palladium
(Platinum) Russia 35 % Antimony China 11% Copper Chile 20%
Silver Peru 16% Nickel Russia 32%
Steel China 22%
Plastics Saudi Arabia 25%
Aluminium Australia 35%
Cobalt Congo 16%
Tantalum Australia 4%
Gallium Germany 0%
Rare Earths China 1%
Reduction Opportunities
Product
design &
specification
Production
Process
In-use End of life
The opportunities below are in order of savings potential and opportunity point:
High 13%
Medium 67%
Low 20%
Material Risk

Reducing the environmental and cost impacts of electrical products 24
Opportunity Lifecycle Stage Decision Maker Environmental
Savings Potential Cost Implications
Reduced amounts
of steel + high
recycled content
Manufacturer General weight
reduction Expected decrease
Recycled content in
plastic (PC-ABS) Manufacturer Limited
Potential 13% cost
savings
Bio-plastics (PLA or
PHB derivatives) Manufacturer
Fujitsu suggest
40% reduction in
embodied energy
of case materials
Neutral, or slight
increase
Reduced fasteners
/ components Manufacturer
5-10% weight
reduction
Design for recycling
Manufacturer -
Design for repair/
upgrade Manufacturer -
Greater PCB
integration Manufacturer
30% reduced PCB
size
Unquantified
savings
Printed electronics
Manufacturer 80% weight
reduction
Unquantified
savings
Potential areas for research/follow-up
Good quality information is available throughout most metrics and lifecycle stages for printers. Further research
should be directed towards other products in this group, particularly CCTV systems and alarm equipment.
GHG Energy Materials Waste Water
Materials
Production
Use
Waste
No data available
Some data available. (1 study)
Enough data available (2 or more studies)
Sources of information
Reference Publication Date Confidentiality
IZM and PE Europe, 2007. Work on Preparatory Studies for Eco-
Design Requirements of EuPs (II): Lot 4 “Imaging Equipment”.
Report to European Commission. Accessed September 2011
2007 Public
Kyocera Mita, unknown. Implementation of LCA. Available at:
http://www.kyoceramita.com/environment/product/lca.html
Accessed September 2011
Unknown Public
Summary history
Last updated by Will Schreiber
Last updated 1 November 2011
Contributors Aida Cierco, Sam Matthews

Reducing the environmental and cost impacts of electrical products 25
Category 7 External power supplies
Products
Data found AC adaptors
WEEE Category 3 – ICT Equipment
No/limited studies Uninterrupted power sources
Industry info
Relevant environmental
regulations
ErP Eco-design Directive
Standby and off mode power consumption (Implementing Measure 278/2009).
RoHS Directive
Limits the presence of heavy metals and certain flame retardants.
WEEE Directive
Covers the financing and disposal of end of life electrical products.
Batteries and Accumulators and Waste Batteries and Accumulators Directive
2006/66/EC may apply.
Use-phase initiatives -
Product category
environmental initiatives
-
Summary
The main compounds found in an adaptor are: the case, wire and cables, PCBA and packaging materials.
Hotspots
The table below shows the main hotspots for this category. The table reflects the impacts for the five
environmental indicators by lifecycle stage. The primary hotspot for each metric is colour coded red and indicates
that the impact is greater than 30% of the total footprint. The secondary hotspot is colour coded orange and
ranges between 10% and 29% of the total impact. Low level contributions are colour coded green and indicate
the impact is less than 9% of the total impact. Lack of data availability for a metric is indicated by a blank white
space.
GHG Energy Materials Waste Water
Materials 11% 10% 100% 46% 30%
Production 4% 3% - 2% 1%
Use 85% 88% - 44% 73%
Waste 0% 0% - 8% -4%
Reduction Opportunities
Product
design &
specification
Production
Process
In-use End of life

Reducing the environmental and cost impacts of electrical products 26
The opportunities below are in order of savings potential and opportunity point:
Opportunity Lifecycle Stage Decision Maker Environmental
Savings Potential Cost Implications
Better Power
Supply Unit design
+ better Back Light
polarisers /
reflectors + fewer
backlights
Manufacturer
15% to 30%
on-mode power
reduction
5% to 10%
weight
reduction
Cost neutral
Reduced standby
power use Buyer
Switch Mode Power
Supply Manufacturer
~75% weight
reduction
~60% power
reduction
Cost savings
Potential areas for research/follow-up
Limited information is available on the full lifecycle impacts of external power supplies. Despite being targeted by
a range of environmental regulations, this remains a relatively unstudied area across a range of metrics.
GHG Energy Materials Waste Water
Materials
Production
Use
Waste
No data available
Some data available (1 study)
Enough data available (2 or more studies)
Sources of information
Reference Publication Date Confidentiality
UMEC, 2008. Environmental Product Declaration AC DC Adapter 2008 Public
Summary history
Last updated by Will Schreiber
Last updated 1 November 2011
Contributors Celena Fernandez (SKM), Aida Cierco

Reducing the environmental and cost impacts of electrical products 27
Categories 9 & 10 Single function pumps and motors
Products
Data found Vacuum cleaner, blender, lawn mower/strimmer
WEEE Category 2 (Small household appliances), 6 (Electrical and electronic tools)
No/limited studies Bench tools, ceiling, extraction and desk fans
Industry info
Relevant environmental
regulations
ErP Eco-design Directive
Proposed EuP regulation for vacuum cleaners has been delayed until 2012.
Future EuP preparatory study will cover air compressors (ENER LOT 31)
RoHS Directive
Limits the presence of heavy metals and certain flame retardants
WEEE Directive
Covers the financing and disposal of end of life electrical products
Use-phase initiatives Future energy in use labelling requirements
Product category
environmental initiatives
-
Summary
Products within this category all feature medium to high mains-powered motors and pumps. Motor materials are
mainly copper (windings) iron, steels, aluminium and paint. Windings are insulated with resins/varnish. Whilst
lawnmowers and bench/hand tools comprise a reasonable amount of steel and other metals for the cutting heads,
the body of these and the bulk of other products will be moulded plastic.
Asset life for the products ranges from 5 -10 years for electric lawnmowers, vacuum cleaners and bench tools, and
10 – 15 years for portable air compressors and ceiling and desk fans.
There is a distinction in the market between domestic and commercial/industrial applications, and machine design
and quality reflect this, as well as the scaled hotspots and energy use requirements.
The EU is currently considering a report produced by a panel of experts which suggests that vacuum cleaner power
consumption has increased significantly over the years but efficiency has dropped. The EU is considering proposals
to introduce a limit to vacuum cleaner power consumption.
Hotspots
The table below shows the main hotspots of this category. The table reflects the impacts for the five
environmental indicators by lifecycle stage. The primary hotspot for each metric is colour coded red and indicates
that the impact is greater than 30% of the total footprint. The secondary hotspot is colour coded orange and
ranges between 10% and 29% of the total impact. Low level contributions are colour coded green and indicate
the impact is less than 9% of the total impact. Lack of data availability for a metric is indicated by a blank white
space.
GHG Energy Materials Waste Water
Materials 5% 6% 100% 38% 8%
Production 5% 4% - 3% 0.2%
Use 87% 89% - 43% 93%
Waste 3% 2% - 16% -0.2%

Reducing the environmental and cost impacts of electrical products 28
Material Risk
The traffic indicator to the right indicates the material risk
associated with the production of products within this category
for selected materials.
The table below shows the location and type of material risk:
High Medium Low
Ma
teri
al
Pri
ma
ry
Pro
du
cti
on
Lo
ca
tio
n
Re
cycli
ng
Ra
te
Ma
teri
al
Pri
ma
ry
Pro
du
cti
on
Lo
ca
tio
n
Re
cycli
ng
Ra
te
Ma
teri
al
Pri
ma
ry
Pro
du
cti
on
Lo
ca
tio
n
Re
cycli
ng
Ra
te
Gold China 27% Tin China 30-
40% Iron China 22%
Palladium
(Platinum) Russia 35 % Antimony China 11% Copper Chile 20%
Silver Peru 16% Nickel Russia 32%
Steel China 22%
Plastics
Saudi
Arabia 25%
Aluminium Australia 35%
Cobalt Congo 16%
Reduction Opportunities
Product
design &
specification
Production
Process
In-use End of life
The opportunities below are in order of savings potential and opportunity point:
Opportunity Lifecycle Stage Decision Maker Environmental
Savings Potential
Cost Implications
Develop products
with higher efficiency
motors
Designer
Develop light weight
models Designer 1.9kg/product Cost savings
Design for reliability
and reparability into
products
Designer
Develop buying
standards that specify
higher efficiency
motors and fans in
product purchasing
specifications
Manufacturer
High 17%
Medium 58%
Low 25%
Material Risk

Reducing the environmental and cost impacts of electrical products 29
Base procurement
decisions on lifecycle
costing principles
Buyer
Only purchase 'A'
rated devices (once
labelling scheme
comes into effect)
Buyer
Potential areas for research/follow-up
This category covers a wide range of products from vacuum cleaners to bench tools. The lifecycle GHG and
energy impacts of this group of products are reasonably well studied; however, there are a limited number of
studies for the lifecycle waste, water and material impacts.
As is common with many electrical products, the use phase clearly dominates the lifecycle impacts across the
majority of products and indicators for this category. For most products, only GHG and energy information exists
and shows consistently that the use phase is the dominant impact. The exception is for food blenders where
materials and manufacture stages are also hotspots.
Data exist for all impact indicators for vacuum cleaners, which show the use phase to be the dominant hotspot
for GHG, energy and water impacts. Unsurprisingly, materials data highlights the materials phase, of which plastic
is the biggest hotspot, followed by metals. However, waste data shows a mixed picture of materials, use and
end-of-life stages as hotspots.
GHG Energy Materials Waste Water
Materials
Production
Use
Waste
No data available
Some data available (1 study)
Enough data available (2 or more studies)
Sources of information
Reference Publication Date Confidentiality
AEA Energy and Environment, 2009. Work on Preparatory Studies
for Eco-Design Requirements of EuPs (II): Lot 17 Vacuum
Cleaners Final Report. Report to European Commission (Accessed
September 2011)
2009 Public
WRAP, 2010. Appendix 5 Product Summary Sheets - Electrical
goods LCA
2010 Public
WRAP, 2010. Bills of Materials - Electrical goods 2010 Public
Summary history
Last updated by Will Schreiber
Last updated 1 November 2011
Contributors Charles Gaisford (SKM), Kevin Lewis, Aida Cierco, Charlotte Dickinson

Reducing the environmental and cost impacts of electrical products 30
Category 11 Battery-powered pumps and motors
Products
Data found Electric toothbrush, electric drill, toys and batteries
WEEE Category 2 - Small household appliances, 6 - Electrical and electronic tools
No/limited studies Garden tools, power tools
Industry info
Relevant environmental
regulations
ErP Eco-design Directive
Future EuP preparatory study will cover air compressors (ENER LOT 31).
RoHS Directive
Limits the presence of heavy metals and certain flame retardants.
WEEE Directive
Covers the financing and disposal of end-of-life electrical products.
Batteries Directive
Requires user-replaceable batteries and restricts heavy metal use.
Use-phase initiatives The main use-phase initiative is the European Eco-design Directive. However, some
products might not be caught by these requirements as they only apply to certain
sizes of pumps and motors. The ErP implementing measure for motors only applies
above 750w up to 375kw and for pumps it is between 1 W and 2 500 W.
Implementing measure on power supplies (which includes battery chargers) may
also apply.
Product category
environmental initiatives
Product stewardship programme from Bosch shown here:
http://www.pprc.org/pubs/epr/cases.cfm. There does not seem to be anything
across the sector as a whole that is outside the WEE/RoHS/ErP regime.
Summary
General product category description: Mainly plastic (but some metal) casings containing simple electronics and motors / pumps or a fairly small
power. (Maybe a maximum of 1 kw in most cases). Life expectancy will depend on the product category specifically but it could be as low as 12 months and
as high as 10 years across the whole range of products described in this category. There is a move towards more complex casing design to improve aesthetics in many of these products
with the inclusion of twin shot moulded ‘soft touch’ materials. This which makes recycling very difficult if
not impossible. There is also increasing use of electronics to allow ‘added features’. WEEE figures for category 2 and 6 are: (Jan-Dec 2010)
o small household – 141k Household and 7.5k B2B (tonnes); and o electrical and electronic tools – 58.5k household and 21.2k B2B.
Hotspots
Lifecycle impacts can vary widely across this category of products. Some may use a small amount of energy but
be used very frequently and therefore use could be the biggest environmental issue. However some products
(such as garden tools) may only be used once a week for less than half of the year, and therefore materials,
processing, transport and disposal may become more important.
The table below shows the main hotspots of this category. The table reflects the impacts for the five
environmental indicators by lifecycle stage. The primary hotspot for each metric is colour coded red and indicates
that the impact is greater than 30% of the total footprint. The secondary hotspot is colour coded orange and
ranges between 10% and 29% of the total impact. Low level contributions are colour coded green and indicate
the impact is less than 9% of the total impact. Lack of data availability for a metric is indicated by a blank white
space.
Reducing the environmental and cost impacts of electrical products 31
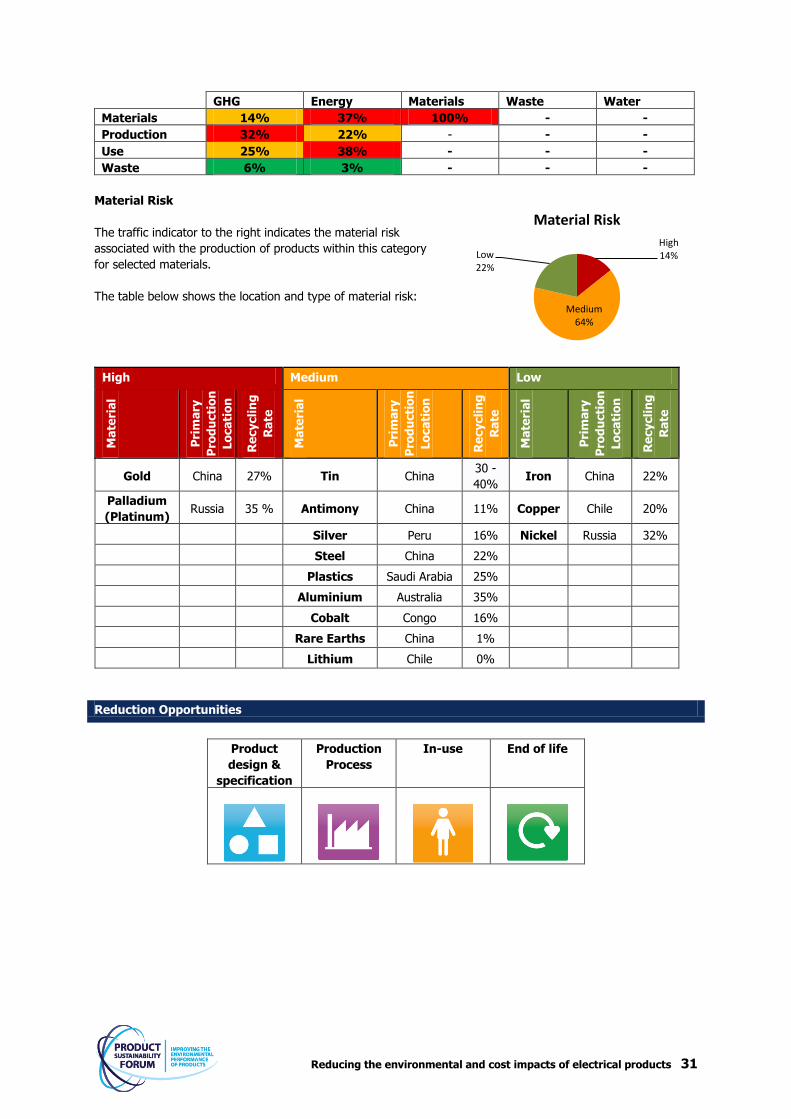
GHG Energy Materials Waste Water
Materials 14% 37% 100% - -
Production 32% 22% - - -
Use 25% 38% - - -
Waste 6% 3% - - -
Material Risk
The traffic indicator to the right indicates the material risk
associated with the production of products within this category
for selected materials.
The table below shows the location and type of material risk:
High Medium Low
Ma
teri
al
Pri
ma
ry
Pro
du
cti
on
Lo
ca
tio
n
Re
cycli
ng
Ra
te
Ma
teri
al
Pri
ma
ry
Pro
du
cti
on
Lo
ca
tio
n
Re
cycli
ng
Ra
te
Ma
teri
al
Pri
ma
ry
Pro
du
cti
on
Lo
ca
tio
n
Re
cycli
ng
Ra
te
Gold China 27% Tin China 30 -
40% Iron China 22%
Palladium
(Platinum) Russia 35 % Antimony China 11% Copper Chile 20%
Silver Peru 16% Nickel Russia 32%
Steel China 22%
Plastics Saudi Arabia 25%
Aluminium Australia 35%
Cobalt Congo 16%
Rare Earths China 1%
Lithium Chile 0%
Reduction Opportunities
Product
design &
specification
Production
Process
In-use End of life
High 14%
Medium 64%
Low 22%
Material Risk

Reducing the environmental and cost impacts of electrical products 32
The opportunities below are in order of savings potential and opportunity point:
Opportunity Lifecycle Stage Decision Maker Environmental
Savings Potential Cost Implications
Design for reliability
and reparability
into products to
achieve extended
product life
expectancy
Designer
Design products to
allow for easier
recycling
Designer
Potential areas for research/follow-up
GHG Energy Materials Waste Water
Materials
Production
Use
Waste
No data available
Some data available (1 study)
Enough data available (2 or more studies)
Sources of information
Reference Publication Date Confidentiality
Climatop, 2010. CO2 Balance: Batteries ( A translation from
original German text)
2010 Public
Hawkins,T, Majeau-Bettez, G., Gaussen, O. And Strømman, AH.,
2010. Lifecycle Assessment of NiMH and Li Ion Battery Electric
Vehicles
2010 Public
McDowall, J. and Siret, C. 2009. Energy - saving batteries - Green
or greenwash?
2009 Public
Öko-Institut e.V., 2010. Lifecycle Assessment (LCA) of Nickel
Metal Hydride Batteries for HEV Application
2010 Public
WRAP, 2010. Appendix 5 Product Summary Sheets - Electrical
goods LCA
2010 Public
WRAP, 2010. Bills of Materials - Electrical goods 2010 Public
Summary history
Last updated by Will Schreiber
Last updated 1 November 2011
Contributors Charles Gaisford (SKM), Kevin Lewis, Aida Cierco

Reducing the environmental and cost impacts of electrical products 33
Category 12 Spatial cooling
Products
Data found Refrigerators, freezers
WEEE Category 1 (Large household appliances)
No/limited studies HVAC, air coolers
Industry info
Relevant environmental
regulations
ErP Eco-design Directive
ENTR Lot 1 preparatory study on refrigerating and freezing equipment in the
context of the Ecodesign Directive.
Commission Regulation (EC) No 643/2009 of 22 July 2009 implementing Directive
2005/32/EC of the European Parliament and of the Council with regard to
ecodesign requirements for household refrigerating appliances.
RoHS Directive
Limits the presence of heavy metals and certain flame retardants.
WEEE Directive
Covers the financing and disposal of end of life electrical products.
Ozone Regulations
EC Regulation 842/2006 on certain fluorinated GHGes (F gases).
EC Regulation 1005/2009 on substances that deplete the ozone layer.
Use-phase initiatives All refrigerators and freezers are required to show energy efficiency labels at the
point of sale using the A+ to G rating system.
Product category
environmental initiatives
Numerous large retailers and brands (e.g. M&S and Coca Cola) are making
commitments to improving the efficiency of cooling equipment, and reducing GHG
emissions produced by this equipment.
USA - GreenChill is an EPA Partnership with food retailers to reduce refrigerant
emissions and decrease their impact on the ozone layer and climate change
Summary
Domestic refrigerators and freezers are appliances designed to chill and freeze food respectively. They use a
compressor to remove heat from the inside of the appliance and transfer it to the external surroundings. They are
highly insulated in order to minimise the transfer of heat through the walls of the appliance. The compressor works
on a thermodynamic cycle known as a vapour compression cycle. The vapour compression cycle uses a fluid called
a refrigerant as it has a low boiling point, enabling it to change from a liquid to vapour state at a convenient range
of temperatures for cooling. More recently, domestic refrigerators and freezers have tended to use the refrigerant
R134a, although due to its high GWP is now being phased out to be replaced by CFC and HFC-free naturally
occurring or relatively inert substances such as R-600a (isobutene).
These appliances are made in a variety of designs. Refrigerators can be either stand alone or as a combined fridge-
freezer and will always be front opening. Stand alone freezers can either be front opening or top opening chest
freezers. The size of these appliances has increased significantly in recent years due to improvements in energy
efficiency, which demands more insulation but without compromising internal capacity.
Air Conditioning Systems
Commercial HVAC systems tend to use a similar vapour compression cycle to refrigerators and freezers, although
absorption chillers can also be utilised in some instances where large amounts of waste or low cost heat is
available.
Absorption chillers utilise a heat source to drive the cooling cycle. Ideally, this heat source will be residual heat

Reducing the environmental and cost impacts of electrical products 34
from another system. Absorption chillers are often recommended with CHP systems where the generated heat
cannot be fully utilised.
Cooling circuits normally have a pump, compressor and heat exchanger. HVAC systems also have a heating circuit
and centralised (e.g. roof mounted) air handling units or integral fans. Commercial systems generally reject heat
via an externally located condenser with the evaporator located in a centralised plant room thereby connected to
the cooling circuit. Alternative decentralised direct exchange (DX) split systems have the condenser located on a
external wall adjacent to the space that requires cooling, e.g. IT Server Hub rooms, with the refrigerant then fed
direct to the cooling unit. These decentralised units are often used where the majority of the building is naturally
ventilated and hence there is no requirement for extensive cooling plant.
A centralised plant would normally be expected to last > 15 years. Through-wall, portable and mini-split units may
only last 8 to 12 years. The latest trend in HVAC is towards mini-split and fan-coil units in more decentralised units
that do not rely so heavily on centralised air handling plant.
Energy efficiency relies on the use of standard techniques, including the use of variable speed drives (VSD) on
cooling circuit pumps, VSD chiller screw or multi scroll compressor units, improved heat exchanger designs (larger
surface areas allowing for higher cooling flow temperatures) and heat recovery where there is as demand. For
example, waste heat from refrigeration compressors/heat exchangers is used sometimes to pre-heat boiler feed
water for central heating.
Hotspots
The lifecycle energy and GHG impacts of this group of products are reasonably well studied. The main lifecycle
impacts for this category are use phase for all metrics and materials for waste and water impacts. Little
information was found on water impacts.
The table below shows the main hotspots for this category. The table reflects the impacts for the five
environmental indicators by lifecycle stage. The primary hotspot for each metric is colour coded red and indicates
that the impact is greater than 30% of the total footprint. The secondary hotspot is colour coded orange and
ranges between 10% and 29% of the total impact. Low level contributions are colour coded green and indicate
the impact is less than 9% of the total impact. Lack of data availability for a metric is indicated by a blank white
space.
GHG Energy Materials Waste Water
Materials 8% 7% 100% 56% 28%
Production 5% 4% - 3% 0%
Use 86% 90% - 37% 73%
Waste 0% -1% - 4% -1%
Material Risk
The traffic indicator to the right indicates the material risk
associated with the production of products within this category
for selected materials.
The table below shows the location and type of material risk:
High Medium Low
Ma
teri
al
Pri
ma
ry
Pro
du
cti
o
n L
oca
tio
n
Re
cycli
ng
Ra
te
Ma
teri
al
Pri
ma
ry
Pro
du
cti
o
n L
oca
tio
n
Re
cycli
ng
Ra
te
Ma
teri
al
Pri
ma
ry
Pro
du
cti
o
n L
oca
tio
n
Re
cycli
ng
Ra
te
Steel China 22% Iron China 22%
Plastics Saudi Arabia 25% Copper Chile 20%
Aluminium Australia 35%
High 0%
Medium 60%
Low 40%
Material Risk
Reducing the environmental and cost impacts of electrical products 35
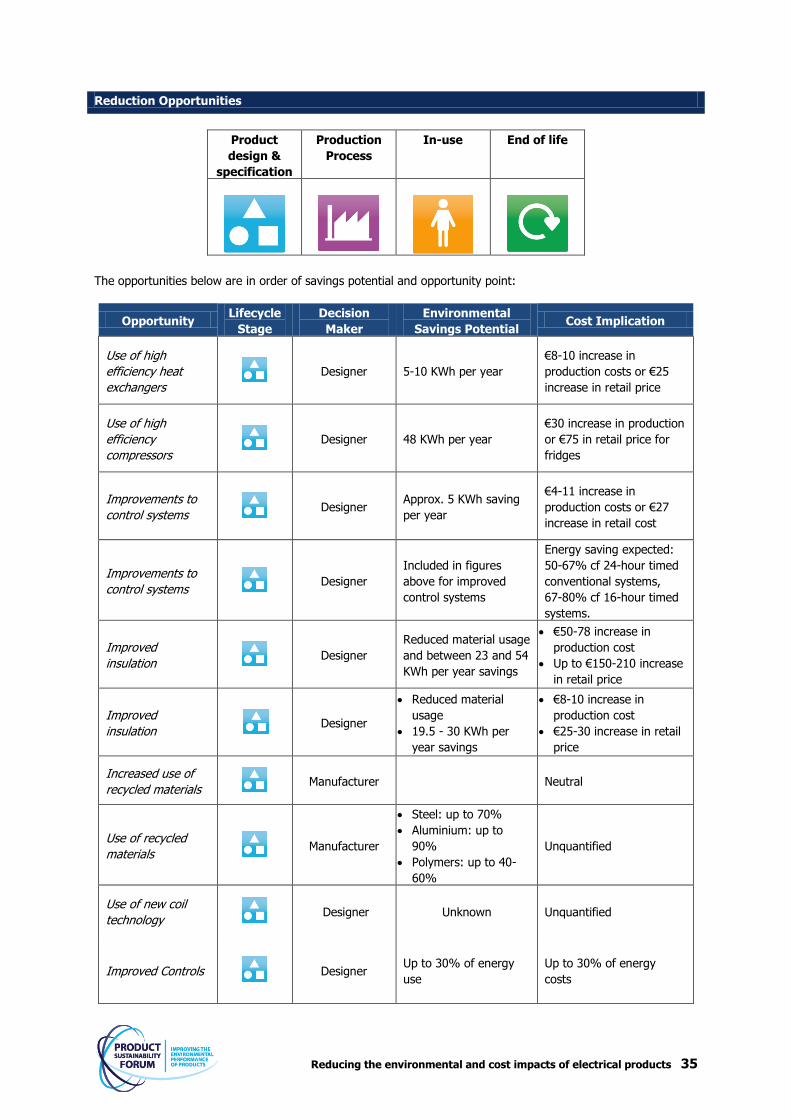
Reduction Opportunities
Product
design &
specification
Production
Process
In-use End of life
The opportunities below are in order of savings potential and opportunity point:
Opportunity Lifecycle
Stage
Decision
Maker
Environmental
Savings Potential Cost Implication
Use of high
efficiency heat
exchangers
Designer 5-10 KWh per year
€8-10 increase in
production costs or €25
increase in retail price
Use of high
efficiency
compressors
Designer 48 KWh per year
€30 increase in production
or €75 in retail price for
fridges
Improvements to
control systems Designer
Approx. 5 KWh saving
per year
€4-11 increase in
production costs or €27
increase in retail cost
Improvements to
control systems Designer
Included in figures
above for improved
control systems
Energy saving expected:
50-67% cf 24-hour timed
conventional systems,
67-80% cf 16-hour timed
systems.
Improved
insulation Designer
Reduced material usage
and between 23 and 54
KWh per year savings
€50-78 increase in
production cost
Up to €150-210 increase
in retail price
Improved
insulation Designer
Reduced material
usage
19.5 - 30 KWh per
year savings
€8-10 increase in
production cost
€25-30 increase in retail
price
Increased use of
recycled materials Manufacturer Neutral
Use of recycled
materials Manufacturer
Steel: up to 70%
Aluminium: up to
90%
Polymers: up to 40-
60%
Unquantified
Use of new coil
technology Designer Unknown Unquantified
Improved Controls
Designer Up to 30% of energy
use
Up to 30% of energy
costs

Reducing the environmental and cost impacts of electrical products 36
Potential areas for research/follow-up
These products have a good level of data coverage across the majority of impact areas.
GHG Energy Materials Waste Water
Materials
Production
Use
Waste
No data available
Some data available (1 study)
Enough data available (2 or more studies)
Sources of information
Reference Publication Date Confidentiality
Electrolux, 2000. Certified Environmental Product Declaration for
ER 8199B. [Online EPD] Available at: http://www.leonardo-
energy.org/webfm_send/612. (Accessed 16th May 2011)
2000 Public
ISIS, 2007. Work on Preparatory Studies for Eco-Design
Requirements of EuPs: Lot 13 Domestic Refrigerators and
Freezers. Report to European Commission (Accessed September
2011)
2007 Public
Öko-Institut e.V.., 2007. Environmental and economic evaluation
of the accelerated replacement of domestic appliances. (Accessed
September 2011)
2007 Public
WRAP, 2010. Appendix 5 Product Summary Sheets - Electrical
goods LCA
2010 Public
WRAP, 2010. Bills of Materials - Electrical goods 2010 Public
Summary history
Last updated by Will Schreiber
Last updated 1 November 2011
Contributors Leigh Holloway (eco3), Aida Cierco, Charlotte Dickinson, Xana Villa Garcia

Reducing the environmental and cost impacts of electrical products 37
Category 13 Spatial heating
Products
Data found Electric hob, fan heater, hand dryer
WEEE Category 1 - Large household appliances
No/limited studies Electric oven
Industry info
Relevant environmental
regulations
ErP Eco-design Directive
Central heating products – Lot 21
Possibly water heaters – Lot 2
RoHS Directive
Limits the presence of heavy metals and certain flame retardants.
WEEE Directive
Covers the financing and disposal of end of life electrical products.
Use-phase initiatives None found
Product category
environmental initiatives
None found
Summary
All heaters contain a heat source. Modern electric space heaters may have ceramic or nichrome heating elements,
and may be fan-forced with a blower or a squirrel-cage fan to improve heat transfer. The user can usually control
the temperature using a built in thermostat.
There are essentially three types of heaters:
Convection heaters
Uses power to heat a heating element. Used to heat the air within an enclosed area. Hot air rises to the ceiling
and causes the cooler air to fall causing circulation. These can be fan-assisted (forced convection) and in some
cases are oil-filled, rather than just an electric element.
Radiant heaters
Converts power into directional infrared waves. Used to heat localised areas very quickly, rather than heating
the air. The heat is absorbed into clothes or skin. Examples include halogen heaters, electric fireplace.
Combination heaters
Use a fan to distribute heat. These are not as efficient as other heaters but are robust and more suitable for
everyday use.
Although there are many different types, most heaters will have the following common components: power source; the heating element; and heat distributor.
Hotspots
This category contains spatial convection and radiant heating products. Publicly available data was found for a
cooker hood, hand dryers, electric oven, fan heater and a boiler.
Available data showed that the highest impact phases are use and materials. For hand dryers, this is mainly due
to the use of electricity in the use phase and the control assembly in the material phase.
Lifecycle data was only available for GHG and water, with the majority of studies focusing on GHG emissions and
water for hand dryers. Studies on other lifecycle indicators (energy, materials and waste) were poor or even non-

Reducing the environmental and cost impacts of electrical products 38
existent, with good energy data only available for the manufacturing and use phases. No lifecycle data was found
for central heating or space heater. The main materials hotspot was due to the use of steel in the boiler case and
the control assembly in the hand dryer system.
The table below shows the main hotspots for this category. The table reflects the impacts for the five
environmental indicators by lifecycle stage. The primary hotspot for each metric is colour coded red and indicates
that the impact is greater than 30% of the total footprint. The secondary hotspot is colour coded orange and
ranges between 10% and 29% of the total impact. Low level contributions are colour coded green and indicate
the impact is less than 9% of the total. Lack of data availability for a metric is indicated by a blank white space.
GHG Energy Materials Waste Water
Materials 3% 2% 100% 22% 13%
Production 1% 1% - 1% 0%
Use 95% 97% - 69% 87%
Waste 1% 1% - 9% 0%
Material Risk
The traffic indicator to the right indicates the material risk
associated with the production of products within this category
for selected materials.
The table below shows the location and type of material risk:
High Medium Low
Ma
teri
al
Pri
ma
ry
Pro
du
cti
on
Lo
ca
tio
n
Re
cycli
ng
Ra
te
Ma
teri
al
Pri
ma
ry
Pro
du
cti
on
Lo
ca
tio
n
Re
cycli
ng
Ra
te
Ma
teri
al
Pri
ma
ry
Pro
du
cti
on
Lo
ca
tio
n
Re
cycli
ng
Ra
te
Gold China 27% Tin China 30-
40% Iron China 22%
Palladium
(Platinum) Russia 35 % Antimony China 11% Copper Chile 20%
Silver Peru 16% Nickel Russia 32%
Steel China 22%
Plastics Saudi Arabia 25%
Aluminium Australia 35%
Reduction Opportunities
Product
design &
specification
Production
Process
In-use End of life
The opportunities below are in order of savings potential and opportunity point:
High 18%
Medium 55%
Low 27%
Material Risk

Reducing the environmental and cost impacts of electrical products 39
Opportunity Lifecycle
Stage
Decision
Maker
Environmental Savings
Potential Cost Implications
Improved
insulation Manufacturer
Reduction of 1.39KWh per year
Additional 2.6kg of material
(glass and steel)
€2 euro increase in
production price
Improved
Insulation Manufacturer
Reduction of 3.7 KWh per year
Increase in material weight of
up to 400g
€8 increase in
product price
Improved
insulation Manufacturer
Reduction of 1.85 KWh per
year
€10 increase in
product price
Improved
Controls Manufacturer
Reduction of 1.85 KWh per
year
Increase in product weight due
to extra electronics - 300g
Up to €100
increase in product
price
Potential areas for research/follow-up
Specific areas that are known to be gaps for further research and project data collection:
GHG Energy Materials Waste Water
Materials
Production
Use
Waste
Sources of information
Reference Publication Date Confidentiality
Baxi S.p.A. 2009. EPD BAXI WALL HUNG CONDENSING BOILER
LUNA 4
2009 Public
Bevilacqua, M., Caresana, F., Comodi, G., and Venella, P., 2010.
Lifecycle assessment of a domestic cooker hood
2010 Public
Bio Intelligence Service, 2011.Work on Preparatory Studies for
Ecodesign Requirements of EuPs (III). Lot 20 Local room heating
products. Task 5. (draft report, version 1)
2011 Public
Bio Intelligence Service, 2011. Work on Preparatory Studies for
Ecodesign Requirements of EuPs (III). Lot 23 Domestic and
commercial hobs and grills included when incorporated into
cookers.
2011 Public
Dettling, J. and Margni, M., 2009. Comparative Environmental
Lifecycle Assessment of Hand Drying Systems: The XLERATOR
Hand Dryer, Conventional Hand Dryers and Paper Towel Systems
2009 Public
Summary history
Last updated by Will Schreiber
Last updated 1 November 2011
Contributors Leigh Holloway (eco3), Aida Cierco, Xana Villa Garcia
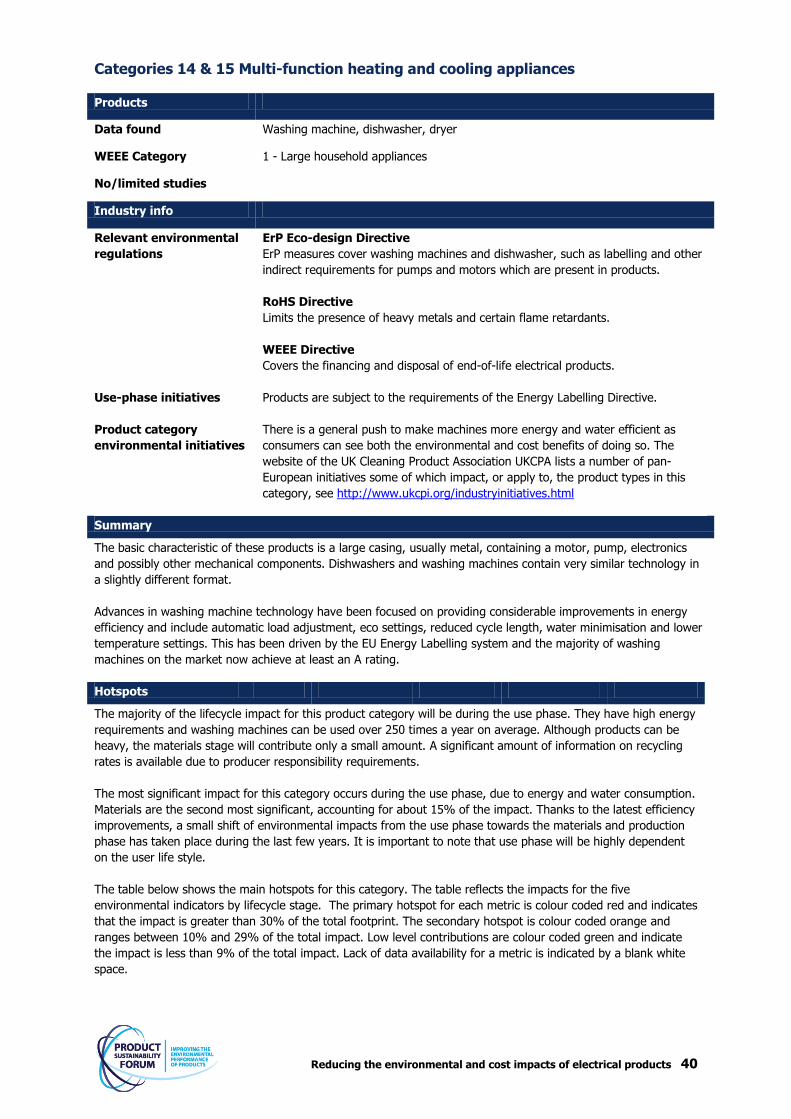
Reducing the environmental and cost impacts of electrical products 40
Categories 14 & 15 Multi-function heating and cooling appliances
Products
Data found Washing machine, dishwasher, dryer
WEEE Category 1 - Large household appliances
No/limited studies
Industry info
Relevant environmental
regulations
ErP Eco-design Directive
ErP measures cover washing machines and dishwasher, such as labelling and other
indirect requirements for pumps and motors which are present in products.
RoHS Directive
Limits the presence of heavy metals and certain flame retardants.
WEEE Directive
Covers the financing and disposal of end-of-life electrical products.
Use-phase initiatives Products are subject to the requirements of the Energy Labelling Directive.
Product category
environmental initiatives
There is a general push to make machines more energy and water efficient as
consumers can see both the environmental and cost benefits of doing so. The
website of the UK Cleaning Product Association UKCPA lists a number of pan-
European initiatives some of which impact, or apply to, the product types in this
category, see http://www.ukcpi.org/industryinitiatives.html
Summary
The basic characteristic of these products is a large casing, usually metal, containing a motor, pump, electronics
and possibly other mechanical components. Dishwashers and washing machines contain very similar technology in
a slightly different format.
Advances in washing machine technology have been focused on providing considerable improvements in energy
efficiency and include automatic load adjustment, eco settings, reduced cycle length, water minimisation and lower
temperature settings. This has been driven by the EU Energy Labelling system and the majority of washing
machines on the market now achieve at least an A rating.
Hotspots
The majority of the lifecycle impact for this product category will be during the use phase. They have high energy
requirements and washing machines can be used over 250 times a year on average. Although products can be
heavy, the materials stage will contribute only a small amount. A significant amount of information on recycling
rates is available due to producer responsibility requirements.
The most significant impact for this category occurs during the use phase, due to energy and water consumption.
Materials are the second most significant, accounting for about 15% of the impact. Thanks to the latest efficiency
improvements, a small shift of environmental impacts from the use phase towards the materials and production
phase has taken place during the last few years. It is important to note that use phase will be highly dependent
on the user life style.
The table below shows the main hotspots for this category. The table reflects the impacts for the five
environmental indicators by lifecycle stage. The primary hotspot for each metric is colour coded red and indicates
that the impact is greater than 30% of the total footprint. The secondary hotspot is colour coded orange and
ranges between 10% and 29% of the total impact. Low level contributions are colour coded green and indicate
the impact is less than 9% of the total impact. Lack of data availability for a metric is indicated by a blank white
space.

Reducing the environmental and cost impacts of electrical products 41
GHG Energy Materials Waste Water
Materials 10% 7% 100% 54% 2%
Production 4% 3% - 3% 0%
Use 86% 91% - 41% 98%
Waste 0% -1% - 2% 0%
Material Risk
The traffic indicator to the right indicates the material risk
associated with the production of products within this category
for selected materials.
The table below shows the location and type of material risk:
High Medium Low
Ma
teri
al
Pri
ma
ry
Pro
du
cti
on
Lo
ca
tio
n
Re
cycli
ng
Ra
te
Ma
teri
al
Pri
ma
ry
Pro
du
cti
on
Lo
ca
tio
n
Re
cycli
ng
Ra
te
Ma
teri
al
Pri
ma
ry
Pro
du
cti
on
Lo
ca
tio
n
Re
cycli
ng
Ra
te
Gold China 27% Tin China 30-
40% Iron China 22%
Palladium
(Platinum) Russia 35 % Antimony China 11% Copper Chile 20%
Silver Peru 16% Nickel Russia 32%
Steel China 22%
Plastics Saudi Arabia 25%
Aluminium Australia 35%
Reduction Opportunities
Product
design &
specification
Production
Process
In-use End of life
The opportunities below are in order of savings potential and opportunity point:
Opportunity Lifecycle
Stage
Decision
Maker
Environmental Savings
Potential Cost Implications
Increased
motor
efficiency
Designer
30Wh/cycle (chopped) to 50
Wh/cycle (brushless DC or
Switched Reluctance)
Reduction of the sud volume
From €60 to €195 increase
depending on technology
Materials
optimisation in
motors
Designer
5% less material can be used at
present with no modification of
the other motor characteristics.
€3 savings per machine
High 18%
Medium 55%
Low 27%
Material Risk

Reducing the environmental and cost impacts of electrical products 42
Materials
optimisation in
castings /
drums
Designer
As above reduction could be 5%
less materials use
€10 to €20 savings per
machine
Full electronic
control Designer
Reduction of energy use by
0.1% per cycle
Reduce water use by 5 litres
per cycle.
€20-€40 increase in
machine retail cost
Larger loads
Buyer
For 5 - 6kg shift:
0.1% reduction in energy/cycle
Reduction of 3 litres of
water/cycle
Increase in costs of €0.3 in
consumer price
Increased
durability / life Designer
Reduction in materials used 'per
cycle' of washer. If a machine was
guaranteed for 8000 the weight of
materials per cycle could be
reduced by over 80% compared
with an 800 cycle machine
Increase in purchase cost
can be considerable. For
example a machine with a
10 year guarantee could
cost €800-1000 compared
with an entry level
machine of €250.
Potential areas for research/follow-up
Specific areas that are known to be gaps for further research and project data collection:
GHG Energy Materials Waste Water
Materials
Production
Use
Waste
Sources of information
Reference Publication Date Confidentiality
Ecobilan and PriceWaterhouseCoopers, 2008. Ecodesign of
Laundry Dryers: Preparatory studies for Ecodesign requirements
of Energy using-Products (EuP) – Lot 16. European Commission of
the European Communities, Directorate General for Energy and
Transport
2008 Public
European Confederation of Iron and Steel Industries,2002. Eco
Design Package, Consumer Product Dishwasher Casing. Brussels,
Belgium
2002 Public
ISIS, 2007. Work on Preparatory Studies for Ecodesign
Requirements of EuPs:. Lot 14 Domestic Washing Machines and
Dishwashers. (Accessed September 2011)
2007 Public
WRAP, 2010. Appendix 5 Product Summary Sheets - Electrical
goods LCA
2010 Public
WRAP, 2010. Bills of Materials - Electrical goods 2010 Public
Summary history
Last updated by Will Schreiber
Last updated 1 November 2011
Contributors Leigh Holloway (eco3), Aida Cierco, Xana Villa Garcia

Reducing the environmental and cost impacts of electrical products 43
Categories 16 & 17 Heating and cooling other appliances
Products
Data found Kettle, coffee machines, hair dryer
WEEE Category 2 - Small household appliances
No/limited studies Irons, grills, instant hot water
Industry info
Relevant environmental
regulations
ErP Eco-design Directive
Food preparation equipment
RoHS Directive
Limits the presence of heavy metals and certain flame retardants
WEEE Directive
Covers the financing and disposal of end of life electrical products
Use-phase initiatives Products are subject to the requirements of the Energy Labelling Directive.
Product category
environmental initiatives
‘Temperature selection’ kettles are now appearing on the market allowing users the
ability to select lower temperatures (below boiling point) for use with coffee and
herbal tea. Some irons now have ‘intelligent’ switches that turn the iron off after a
given time of standing.
Summary
These products generally consist of some form of plastic or metal casing which contains a heating element and
auxiliary control electronics. It is difficult to reduce the power required by this type of product but some advanced
settings are being introduced e.g. kettles with temperature selection functions and irons with an automatic ‘off’
function which is activated after a given time of standing.
MTP projections estimate kettle lifespan of 4.4 years and it is expected an iron will be similar.
The introduction of ‘added value’ features is leading to the increasing use of electronics within these products. In
addition, a focus on improving the aesthetic appeal of products is causing greater use of colours and different
materials in casings, which could have a negative effect on recyclability.
Hotspots
Publicly available data for the lifecycle energy and GHG impacts of this category was sourced. It showed that the
highest impact is in the use phase due to energy requirements. This impact may change depending on the user.
Material extraction is the second highest impact but with less intensity. The materials hotspot is due to the use of
plastic.
The table below shows the main hotspots for this category. The table reflects the impacts for the five
environmental indicators by lifecycle stage. The primary hotspot for each metric is colour coded red and indicates
that the impact is greater than 30% of the total footprint. The secondary hotspot is colour coded orange and
ranges between 10% and 29% of the total impact. Low level contributions are colour coded green and indicate
the impact is less than 9% of the total. Lack of data availability for a metric is indicated by a blank white space.
GHG Energy Materials Waste Water
Materials 3% 3% 100% 22% 3%
Production 3% 2% - 2% 0%
Use 94% 95% - 64% 97%
Waste 1% 0% - 12% 0%

Reducing the environmental and cost impacts of electrical products 44
Material Risk
The traffic indicator to the right indicates the material risk
associated with the production of products within this
category for selected materials.
The table below shows the location and type of material risk:
High Medium Low
Ma
teri
al
Pri
ma
ry
Pro
du
cti
on
Lo
ca
tio
n
Re
cycli
ng
Ra
te
Ma
teri
al
Lo
ca
tio
n
Re
cycli
ng
Ra
te
Ma
teri
al
Pri
ma
ry
Pro
du
cti
on
Lo
ca
tio
n
Re
cycli
ng
Ra
te
Gold China 27% Tin China 30-
40% Iron China 22%
Palladium
(Platinum) Russia 35 % Antimony China 11% Copper Chile 20%
Silver Peru 16% Nickel Russia 32%
Steel China 22%
Plastics Saudi Arabia 25%
Aluminium Australia 35%
Cobalt Congo 16%
Reduction Opportunities
Product
design &
specification
Production
Process
In-use End of life
The opportunities below are in order of savings potential and opportunity point:
Opportunity Lifecycle Stage Decision Maker Environmental
Savings Potential Cost Implications
Reduction in
materials used Designer
Estimated 5%
material reduction Estimated reduction
Use of recycled
materials Designer
Reduction in
embodied carbon
will vary depending
on materials used a
% recycled
content. Main
materials would be
ABS.
Neutral
Increased energy
efficiency Designer
In use energy
savings
Reduced consumer
lifecycle cost
Efficient heating
elements Designer
Up to 50% in use
energy savings
Reduced consumer
lifecycle cost
High 17%
Medium 58%
Low 25%
Material Risk
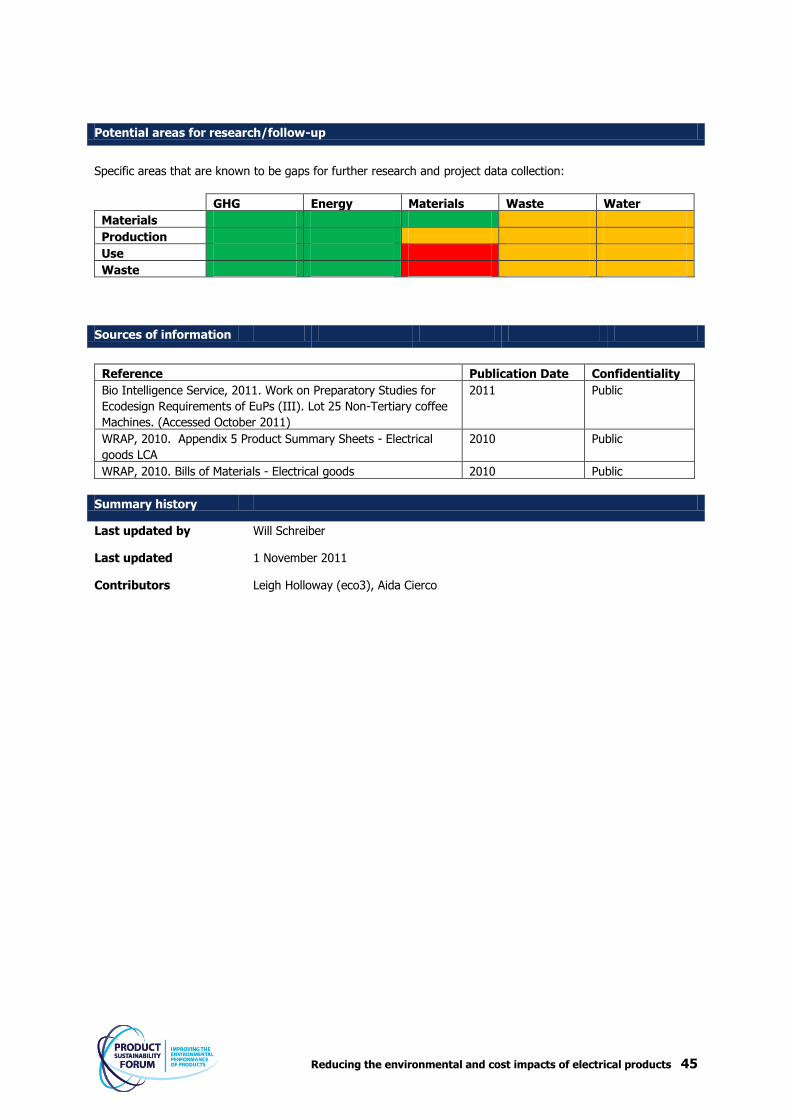
Reducing the environmental and cost impacts of electrical products 45
Potential areas for research/follow-up
Specific areas that are known to be gaps for further research and project data collection:
GHG Energy Materials Waste Water
Materials
Production
Use
Waste
Sources of information
Reference Publication Date Confidentiality
Bio Intelligence Service, 2011. Work on Preparatory Studies for
Ecodesign Requirements of EuPs (III). Lot 25 Non-Tertiary coffee
Machines. (Accessed October 2011)
2011 Public
WRAP, 2010. Appendix 5 Product Summary Sheets - Electrical
goods LCA
2010 Public
WRAP, 2010. Bills of Materials - Electrical goods 2010 Public
Summary history
Last updated by Will Schreiber
Last updated 1 November 2011
Contributors Leigh Holloway (eco3), Aida Cierco

Reducing the environmental and cost impacts of electrical products 46
Category 18 Microwaves
Products
Data found Microwave
WEEE Category 1 - Large household appliances
No/limited studies
Industry info
Relevant environmental
regulations
ErP Eco-design Directive
Food-preparing equipment.
RoHS Directive
Limits the presence of heavy metals and certain flame retardants.
WEEE Directive
Covers the financing and disposal of end-of-life electrical products.
Use-phase initiatives Microwaves are part of the European energy labelling scheme.
Product category
environmental initiatives
Energy efficiency appears not to play a great part in this product category as the
power requirement is related directly to the cooking function. Lower power means
longer cooking times and therefore no savings in overall energy.
Summary
All products within this sector show very similar characteristics in terms of physical size and basic functionality.
Differences are mainly aesthetics, advanced functionality and features, capacity and power rating. The products
range from a very basic model with dials rather than electronic controls costing from £30, to advanced combination
ovens costing up to £1,000.
Microwave ovens have not undergone any significant advances in recent years. The majority of developments tend
to be in the advanced functions, combining microwaves with other oven technologies and designing built-in kitchen
products.
Microwave ovens are very durable appliances with few moving parts. One American website suggests that microwaves have an average lifetime of 10 years: http://www.lendingtree.com/smartborrower/buying-a-home/finding-a-home/kitchen-appliances/.
Hotspots
This category has the profile of a typical mains-fed electronic product, having its highest impact in the use phase.
Materials and production phases are equal second.
All microwaves contain a cavity magnetron and a large induction motor, which are extremely material intensive,
representing 48% of the energy burden during the materials phase.
The table below shows the main hotspots of this category. The table reflects the impacts for the five
environmental indicators by lifecycle stage. The primary hotspot for each metric is colour coded red and indicates
that the impact is greater than 30% of the total footprint. The secondary hotspot is colour coded orange and
ranges between 10% and 29% of the total impact. Low level contributions are colour coded green and indicate
the impact is less than 9% of the total. Lack of data availability for a metric is indicated by a blank white space.
GHG Energy Materials Waste Water
Materials 13% 10% 100% 80% 41%
Production 10% 7% - 1% 0%
Use 75% 82% - 14% 60%
Waste 2% 1% - 5% -2%

Reducing the environmental and cost impacts of electrical products 47
Material Risk
The traffic indicator to the right indicates the material risk
associated with the production of products within this category
for selected materials.
The table below shows the location and type of material risk:
High Medium Low
Ma
teri
al
Pri
ma
ry
Pro
du
cti
on
Lo
ca
tio
n
Re
cycli
ng
Ra
te
Ma
teri
al
Pri
ma
ry
Pro
du
cti
on
Lo
ca
tio
n
Re
cycli
ng
Ra
te
Ma
teri
al
Pri
ma
ry
Pro
du
cti
on
Lo
ca
tio
n
Re
cycli
ng
Ra
te
Gold China 27% Tin China 30-
40% Iron China 22%
Palladium Russia 35 % Antimony China 11% Copper Chile 20%
Silver Peru 16% Nickel Russia 32%
Steel China 22%
Plastics Saudi Arabia 25%
Aluminium Australia 35%
Cobalt Congo 16%
Reduction Opportunities
Product
design &
specification
Production
Process
In-use End of life
The opportunities below are in order of savings potential and opportunity point:
Opportunity Lifecycle Stage Decision Maker Environmental
Savings Potential Cost Implications
Paint the inner
cavity Designer 0.7 KWh per year
€3 increase in
product cost
Inverter power
supply Designer/ Specifier
1 KWh per year but
would also reduce
embodied carbon
as these power
supplies are lighter
€5 increase in
product cost
General
engineering to
increase energy
efficiency
Designer/ Specifier 2.5 KWh per year
€7 increase in
product price
Reduction of
materials in casings Designer / Specifier
10% reduction in
outer casing weight
Reduced material
costs
High 18%
Medium 55%
Low 27%
Material Risk

Reducing the environmental and cost impacts of electrical products 48
Use of recycled
materials in casings Designer / Specifier Variable Neutral
Potential areas for research/follow-up
Specific areas that are known to be gaps for further research and project data collection:
GHG Energy Materials Waste Water
Materials
Production
Use
Waste
Sources of information
Reference Publication Date Confidentiality
Bio Intelligence Service, 2011. Work on Preparatory Studies for
Ecodesign Requirements of EuPs (III). Lot 22 Domestic and
commercial ovens, including when incorporated in cookers.
(Accessed September 2011)
2011 Public
WRAP, 2010. Appendix 5 Product Summary Sheets - Electrical
goods LCA
2010 Public
WRAP, 2010. Bills of Materials - Electrical goods 2010 Public
Summary history
Last updated by Will Schreiber
Last updated 1 November 2011
Contributors Leigh Holloway (eco3), Aida Cierco, Charlotte Dickinson
Reducing the environmental and cost impacts of electrical products 49
Categories 19 to 22 Lighting
Products
Data found Incandescent, Compact Fluorescent Lamps (CFL), LED
WEEE Category 5 (Lighting)
No/limited studies High intensity discharge, halogen
Industry info
Relevant environmental
regulations
ErP Eco-design Directive
EuP Lots 8,9,19.
RoHS Directive
Limits the presence of heavy metals and certain flame retardants.
WEEE Directive
Covers the financing and disposal of end of life electrical products.
Use-phase initiatives -
Product category
environmental initiatives
-
Summary
There are various forms of lamps available on the market:
traditional incandescent tungsten filament (60W, 100W bulb etc. now being phased out);
tungsten halogen (filament but in halogen gas instead of air);
high intensity discharge (sodium or mercury vapour; mainly for street lighting and industrial high-bay lighting);
fluorescent (mercury gas vapour filled, phosphor coated tubes);
light emitting diode (LED); and
more unusual types such as microwave plasma types (industrial high-bay lighting).
Luminaires are usually just a lamp housing but they sometimes have an electrical ballast (if not part of the lamp)
and/or power supply (if a transformer is required to reduce supply voltage). They can take a wide variety of forms
to suit different situations from free standing units, recessed and surface mounted units to outdoor units and
architectural features.
Fluorescent lamps typically have a rated lifespan of 6,000 to 15,000 hours, whereas incandescent lamps are usually
manufactured to have a lifespan of 750 hours to 1,000 hours. LEDs have an expected lifetime of around 30,000 to
50,000 hours – almost ‘fit and forget’.
The halogen GU10 downlighter has become ubiquitous but is not very efficient, typically being 50W to generate a
quite narrow beam of light, hence requiring many units in a ceiling. Their efficiency is low by modern standards
(10–30 lumens per W) but they are cheap to make and compact.
The gas-filled lamps have an electrical ballast. The old type were magnetic but most now have an electronic ballast,
which has eliminated flicker when starting and has reduced energy use. CFLs and fluorescent tubes use around
20% of the energy of equivalent tungsten filament and tungsten halogen lights (e.g. 11W instead of 50W). In
tubes, the T12 has been largely replaced by the more efficient and now standard T8 slimline tube which is now
being replaced by the even more efficient T5 style using a triphosphor coating and electronic ballast. CFLs and T5
tubes generally have efficiencies of 70 to 100 lm/W. Tubes remain the standard form of lighting in commercial
office applications.
The cold-cathode fluorescent lamp (CCFL) is a newer form of CFL. CCFLs use electrodes without a filament. The
voltage of CCFLs is about five times higher than CFLs, and the current is about 10 times lower. CCFLs have a
diameter of only about 3 millimetres. CCFLs were initially used for document scanners and also for back-lighting
LCD displays, and later manufactured for use as lamps. The efficiency (lm/W) is about half that of standard CFLs.

Reducing the environmental and cost impacts of electrical products 50
Their advantages are that they are instant-on, like incandescent bulbs, they are compatible with timers, photocells,
and dimmers, and they have a long life. CCFLs are an effective and efficient replacement for lighting that is turned
on and off frequently with little extended use.
Another type of fluorescent lamp is the electrodeless lamp, known as magnetic induction lamp, radiofluorescent
lamp or fluorescent induction lamp. As of 2011, this type of light source was struggling with high production costs,
stability of the products produced by domestic manufacturers in China, establishing an internationally recognised
standard and problems with electromagnetic compatibility, electromagnetic interference.
An LED lamp uses light-emitting diodes (LEDs) as the source of light. Unlike CFLs they contain no mercury or other
hazardous chemicals. Since the light output of individual light-emitting diodes is small compared to incandescent
bulbs and CFLs, multiple diodes are often used together. Diodes use direct current (DC) electrical power; thus
require internal or external rectifier circuits. LEDs are damaged by operating at high temperatures, so LED lamps
typically include heat management elements such as heat sinks and cooling fins. Until recently, LED lights were
only used for novelty and niche applications, such as retail displays, as they suffered from not generating enough
light in standard formats such as strips and GU10 downlighter formats. In recent years, as diode technology has
improved, high power LEDs with higher lumen output are making it possible to replace other lamps with LED
lamps. Efficiency is similar to CFLs at around 75 lm/W but LEDs last longer and come on instantly. They are being
improved constantly and now are being used quite widely in hotels, retail etc., often in 5W GU10 format. LED
lighting will no doubt be the future for many domestic/commercial applications.
Hotspots
Lighting products have the most environmental impact during use - up to 90% depending on the lamp type.
The table below shows the main hotspots for this category. The table reflects the impacts for the five
environmental indicators by lifecycle stage. The primary hotspot for each metric is colour coded red and indicates
that the impact is greater than 30% of the total footprint. The secondary hotspot is colour coded orange and
ranges between 10% and 29% of the total impact. Low level contributions are colour coded green and indicate
the impact is less than 9% of the total. Lack of data availability for a metric is indicated by a blank white space.
GHG Energy Materials Waste Water
Materials 8% 8% 100% 2% 3%
Production 9% 5% - 4% 0%
Use 90% 95% - 86% 97%
Waste 1% 1% - 7% 0%
Material Risk
The traffic indicator to the right indicates the material risk
associated with the production of products within this category
for selected materials.
The table below shows the location and type of material risk:
High Medium Low
Ma
teri
al
Pri
ma
ry
Pro
du
cti
on
Lo
ca
tio
n
Re
cycli
ng
Ra
te
Ma
teri
al
Pri
ma
ry
Pro
du
cti
on
Lo
ca
tio
n
Re
cycli
ng
Ra
te
Ma
teri
al
Pri
ma
ry
Pro
du
cti
on
Lo
ca
tio
n
Re
cycli
ng
Ra
te
Gold China 27% Tin China 30-40% Iron China 22%
Palladium
(Platinum) Russia 35 % Antimony China 11% Copper Chile 20%
Silver Peru 16% Nickel Russia 32%
Steel China 22%
Plastics Saudi Arabia 25%
Aluminium Australia 35%
High 18%
Medium 55%
Low 27%
Material Risk

Reducing the environmental and cost impacts of electrical products 51
Reduction Opportunities
Product
design &
specification
Production
Process
In-use End of life
The opportunities below are in order of savings potential and opportunity point:
Opportunity Lifecycle
Stage
Decision
Maker
Environmental
Savings Potential Cost Implications
Use of recycled
aluminium should
be possible, which
would reduce
embodied impacts
of materials
Designer Variable by bulb type Unquantified
Switch to LED
lighting technology Buyer
A CFL version of the
same type of lamp can
be twice the weight (of
not more) and the
materials include glass,
plastic, electronics etc.
Reduced lifetime costs of
ownership through energy
savings, but will have higher
investment cost
Replace T12
(35mm diameter)
and T8 (25mm
diameter)
fluorescent tubes
with T5 (16mm
diameter) tubes
Buyer
For every 100 T8 tubes
replaced, assuming that
lights are on for 12 hours
per day on average, you
will save ~12kWh per
day or 4380 kWh
Annual energy savings of
£3.5 per bulb.
The adaptor kits would cost
£1,500 for 100 lights,
however the T5 tubes also
last much longer than T8s
(and far longer than T12s)
reducing replacement costs
and maintenance costs.
Overall payback is generally
under 2 years.
Replace CFLs with
Cold-cathode
fluorescent lamp
(CCFL)
Buyer
Reduced thickness of
the glass tube = less
material use
Half the amount of
mercury required for
conventional CFL
bulbs
Unquantified

Reducing the environmental and cost impacts of electrical products 52
Replace halogen
downlighters with
LED lightbulbs in
standard GU10
fittings (standard
down-lighter
mains-voltage
fitting)
Buyer
90% reduction in use
phase energy
consumption
Reduced lifetime costs of
ownership through energy
savings, but will have higher
investment cost
Replace traditional
electric fluorescent
bulbs with
electrodeless lamps
(known as
magnetic induction
/ radiofluorescent /
fluorescent
induction lamps)
Buyer Unquantified Unquantified
Potential areas for research/follow-up
Specific areas that are known to be gaps for further research and project data collection:
GHG Energy Materials Waste Water
Materials
Production
Use
Waste
Sources of information
Reference Publication Date Confidentiality
Gydesen, A. and Maimann, D., 1991 Lifecycle Analyses of
Integral Compact Fluorescent Lamps versus Incandescent Lamps
1991 Public
NTNU, 2009. Environmental Declaration ISO 14025, Memo,
Calypso, Movero and Vision. Available at: http://www.epd-
norge.no/getfile.php/PDF/EPD/Energi/NEPD%20129E%20asy%2
0lamper.pdf. [Accessed August 2011]
2009 Public
OSRAM Opto Semiconductors GmbH and Siemens Corporate
Technology, 2009. Lifecycle Assessment of Illuminants A
Comparison of Light Bulbs, Compact Fluorescent Lamps and LED
Lamps
2009 Public
Vito, 2009. Work on Preparatory Studies for Ecodesign
Requirements of EuPs: Final report Lot 19: Domestic lighting.
(Accessed September 2011)
2009 Public
Summary history
Last updated by Will Schreiber
Last updated 1 November 2011
Contributors Leigh Holloway (eco3), Aida Cierco, Charlotte Dickinson
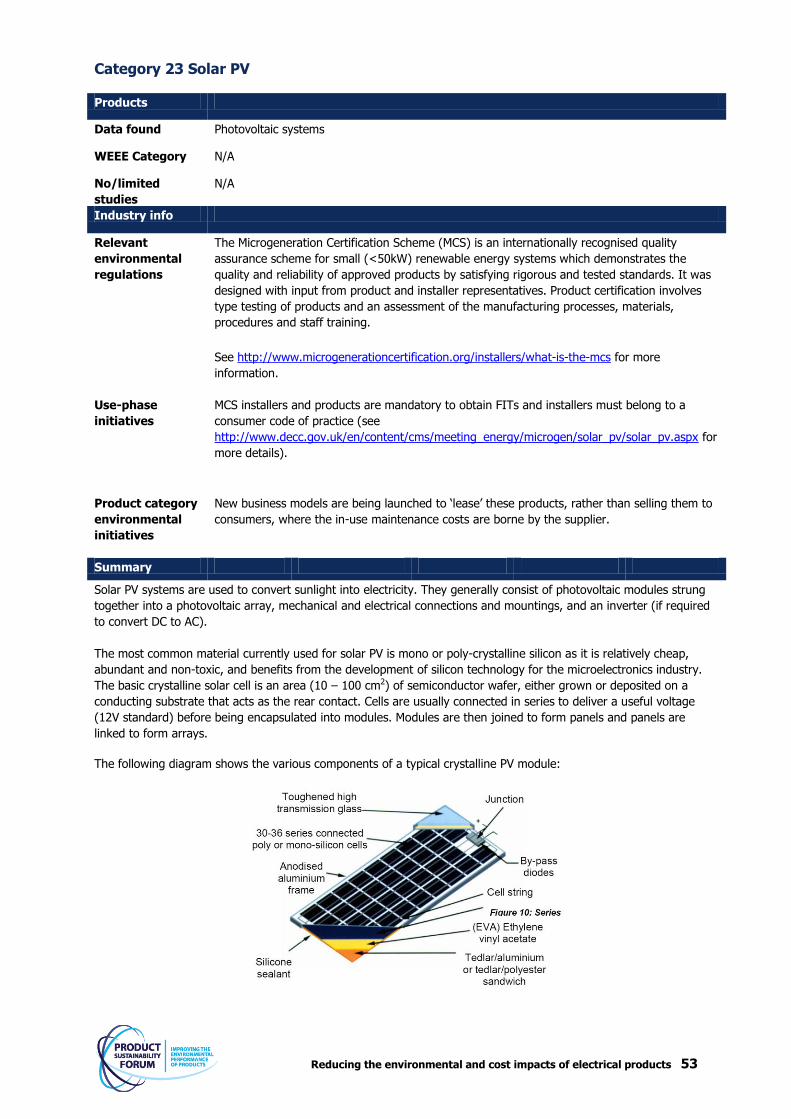
Reducing the environmental and cost impacts of electrical products 53
Category 23 Solar PV
Products
Data found Photovoltaic systems
WEEE Category N/A
No/limited
studies
N/A
Industry info
Relevant
environmental
regulations
The Microgeneration Certification Scheme (MCS) is an internationally recognised quality
assurance scheme for small (<50kW) renewable energy systems which demonstrates the
quality and reliability of approved products by satisfying rigorous and tested standards. It was
designed with input from product and installer representatives. Product certification involves
type testing of products and an assessment of the manufacturing processes, materials,
procedures and staff training.
See http://www.microgenerationcertification.org/installers/what-is-the-mcs for more
information.
Use-phase
initiatives
MCS installers and products are mandatory to obtain FITs and installers must belong to a
consumer code of practice (see
http://www.decc.gov.uk/en/content/cms/meeting_energy/microgen/solar_pv/solar_pv.aspx for
more details).
Product category
environmental
initiatives
New business models are being launched to ‘lease’ these products, rather than selling them to
consumers, where the in-use maintenance costs are borne by the supplier.
Summary
Solar PV systems are used to convert sunlight into electricity. They generally consist of photovoltaic modules strung
together into a photovoltaic array, mechanical and electrical connections and mountings, and an inverter (if required
to convert DC to AC).
The most common material currently used for solar PV is mono or poly-crystalline silicon as it is relatively cheap,
abundant and non-toxic, and benefits from the development of silicon technology for the microelectronics industry.
The basic crystalline solar cell is an area (10 – 100 cm2) of semiconductor wafer, either grown or deposited on a
conducting substrate that acts as the rear contact. Cells are usually connected in series to deliver a useful voltage
(12V standard) before being encapsulated into modules. Modules are then joined to form panels and panels are
linked to form arrays.
The following diagram shows the various components of a typical crystalline PV module:

Reducing the environmental and cost impacts of electrical products 54
Solar PV panels can be mounted in a variety of ways to suit the situation. These include:
1. on-roof (most cost-effective as most standard panels are supplied with aluminium frames);
2. in-roof (aesthetically pleasing flush finish);
3. ground mounting (requires outside spaces available and limited shading); and
4. building integrated (integrated into slates / roof membranes).
PV panels themselves have a long life (most have a warranty of 25 years) and so very few PV panels have reached
the end of their useful life in the UK.
The warranty conditions for PV panels typically guarantee that panels can still produce at least 80% of their initial
rated peak output after 25 years. Anecdotal evidence indicates that panels installed in the 1960s are still producing
80% of their rated value. The generated electricity can be either stored, used directly (island/standalone plant) or fed
into the electricity grid (grid-connected) or combined with one or many domestic electricity generators to feed into a
small grid.
Global solar PV capacity has been increasing at an average annual growth rate of more than 40% since 2002 and has significant potential for growth over the next few decades, due largely to developments in the technology, national government incentives and more competitive technology costs. The PV industry is a relatively new sector in the UK, although the sector is increasing following the introduction of FITs in the UK from April 2010. A study for UK Trade & Investment indicates that the market could grow to be one of the largest in Europe by 2020.
Hotspots
There are a number of lifecycle assessments detailing the manufacturing process of solar panels from raw
materials through to installation and use. These studies consider the main solar cell technologies of mono, poly
and amorphous crystalline and the thin film cells. As solar PV is not an EuP, the majority of the impacts and the
focus of these studies is on the manufacturing, distribution and installation phases. However, there are impacts
associated with the use phase that are not well documented as in most cases these are considered to be small, if
not negligible. These are the use of water for cleaning the panels, the inverter which will have an efficiency in the
region of 94% resulting in the loss of some of the solar energy in the conversion from DC to AC, and which will
have a lifetime of approximately 15 years compared to a solar panel which will have a minimum of 25 years.
A further area that is often discussed but not quantified is the disposal of the solar panels. Approved disposal
methods will be based on the presence of any toxic substances usually associated with the semi-conductor used.
However, silicon can be recycled in addition to any metal and glass in the panel.
The table below shows the main hotspots of this category. The table reflects the impacts for the five
environmental indicators by lifecycle stage. The primary hotspot for each metric is colour coded red and indicates
that the impact is greater than 30% of the total footprint. The secondary hotspot is colour coded orange and
ranges between 10% and 29% of the total impact. Low level contributions are colour coded green and indicate
the impact is less than 9% of the total. Lack of data availability for a metric is indicated by a blank white space.
GHG Energy Materials Waste Water
Materials 80% - 100% - -
Production 20% 100% - - -
Use - - - - -
Waste - - - - -
Material Risk
The traffic indicator to the right indicates the material risk
associated with the production of products within this category
for selected materials.
The table below shows the location and type of material risk:
High 0%
Medium 70%
Low 30%
Material Risk

Reducing the environmental and cost impacts of electrical products 55
High Medium Low M
ate
ria
l
Pri
ma
ry
Pro
du
cti
on
Lo
ca
tio
n
Re
cycli
ng
Ra
te
Ma
teri
al
Pri
ma
ry
Pro
du
cti
on
Lo
ca
tio
n
Re
cycli
ng
Ra
te
Ma
teri
al
Pri
ma
ry
Pro
du
cti
on
Lo
ca
tio
n
Re
cycli
ng
Ra
te
Silicon China Iron China 22%
Tin China 30-
40% Copper Chile 20%
Silver Peru 16% Nickel Russia 32%
Plastics Saudi Arabia 25%
Aluminium Australia 35%
Gallium Germany 0%
Tellurium Canada <10%
Reduction Opportunities
Product
design &
specification
Production
Process
In-use End of life
The opportunities below are in order of savings potential and opportunity point:
Opportunity Lifecycle Stage Decision Maker Environmental
Savings Potential Cost Implications
Use cheaper and
reduced embedded
carbon thin film PV
panels rather than
crystalline
Manufacturer ~500kgCO2/KWp)
Average about
£700 per KWp
manufactured
Improved product
life and durability Designer
Less tonnage of
panels need to be
recycled
Cost savings with
longer life, panels
don't need to be
replaced as often
Integrate PV panels
in building - to act
as dual purpose,
e.g. tiles, blinds
etc.
Buyer
Blinds etc. help to
reduce energy use
within the building
Costs higher,
though some cost
saved through
integrating in
construction rather
than bolt-on
Potential areas for research/follow-up
Specific areas that are known to be gaps for further research and project data collection:
GHG Energy Materials Waste Water
Materials
Production

Reducing the environmental and cost impacts of electrical products 56
Use
Waste
Sources of information
Reference Publication Date Confidentiality
Alsema, E.A. and Wild-Scholten, M.J. 2004. Environmental lifecycle
assessment of advanced silicon solar cell technologies. Presented
at the 19th European Photovoltaic Solar Energy Conference, 7-11
June 2004, Paris
2004 Public
BFF, 2007. An Ecological Footprint and Carbon Audit of Sharp
Solar’s Llay Plant
2007 Confidential
Centre for Remanufacturing and Reuse, 2008. The Potential for
Remanufacturing of Photovoltaic Solar Cells
2008 Public
Fthenakis, V, Chul Kim, H, and Alsema, E., 2008. Emissions from
photovoltaic lifecycles. Environ. Sci. Technolo. 42, p. 2168-2174
2008 Public
Raugei, M., Bargigli, S. and Ulgiati, S. Energy and lifecycle
assessment of thin film CdTe photovoltaic modules
Public
Stopatto, A. 2008. Lifecycle assessment of photovoltaic electricity
generation. Energy 33, p. 224-232
2008 Public
Summary history
Last updated by Will Schreiber
Last updated 1 November 2011
Contributors Charlotte Dickinson, Sam Matthews, Kevin Lewis, Aida Cierco

Reducing the environmental and cost impacts of electrical products 57
Category 24 Household wind turbines
Products
Data found Small wind turbine
WEEE Category N/A
No/limited studies N/A
Industry info
Relevant environmental
regulations
The Microgeneration Certification Scheme (MCS) is an internationally recognised
quality assurance scheme for small (<50kW) systems which demonstrates the
quality and reliability of approved products by satisfying rigorous and tested
standards. It was designed with input from product and installer representatives.
Product certification involves type testing of products and an assessment of the
manufacturing processes, materials, procedures and staff training.
See http://www.microgenerationcertification.org/installers/what-is-the-mcs for
more information.
Use-phase initiatives MCS installers and products are mandatory to obtain FITs and installers must
belong to a consumer code of practice (see:
http://www.decc.gov.uk/en/content/cms/meeting_energy/microgen/micro_turbine
s/micro_turbines.aspx for more details).
Product category
environmental initiatives
There are no government grant-funded initiatives.
Summary
This category summary focuses on small wind (domestic-type) installations only – used for homes, small farms or
a small business, with a capacity of 50kW or less.
There are two ways to mount a domestic-sized wind turbine:
mast: these are free standing and are erected in a suitably exposed position, often around 2.5kW to 6kW; and
roof: these are smaller than mast mounted systems and can be installed on the roof of a home where there is a suitable wind resource. Often these are around 1kW to 2kW in size.
Wind turbines fall into two technology types:
horizontal axis – most common type which has a tail vane to turn it to face the direction of the wind; and
vertical axis – these turbines are less common but are well suited to building mounting/integration.
The general components are: rotors (usually made from glass reinforced plastic); generator (converts rotational movement to electrical energy); inverter (to convert the generated DC electricity to AC for grid connection); battery (storage of electrical energy for off-grid applications); and mast (structural support – usually steel).
Annual servicing is usually recommended by installers and equipment providers and in some cases it is necessary
to ensure the warranty is valid. The majority of turbines have a design life of 20 – 25 years. Other ancillary
equipment may have shorter lifetimes, for example battery life is typically 6 – 10 years and inverters are
approximately 15 years.
The Energy Saving Trust report, ‘Location, location, location; Domestic small scale wind field trial report’ (July
2009), showed that micro-wind installations could produce energy and carbon savings but only when located in
appropriate areas with an undisturbed wind resource.
Wind energy output is determined by something known as the cube rule. The cube rule states that each time the wind speed doubles, the output from the turbine increases eight times. By doubling the diameter of the blade,

Reducing the environmental and cost impacts of electrical products 58
you increase the electricity output by four. The larger the turbine, the larger the rotor, which is the single largest factor in determining the amount of power that is generated by a turbine.
Hotspots
Micro wind generation is a relatively new technology and until recently was primarily marketed to the off-grid
markets such as yachting, caravanning and rural locations. More recently, with the launch of the Windsave
turbine at B&Q stores, the general public has taken an interest in this technology. As such there are only a few
LCA studies available. There is a strong focus in these studies on the manufacturing processes, the raw materials
and the energy generation during the use phase. There is a lack of information related to the waste generation
and disposal throughout the lifetime of the turbines, particularly the end of life of the turbine itself mainly due to
the relative newness of the product. Furthermore, there is little information on the materials and waste generated
during the use phase. It is estimated that the lifetime of the turbines is 20-25 years, however, ancillary
equipment such as batteries and inverters have shorter lifetimes and would need to be disposed of and replaced.
The table below shows the main hotspots for this category. The table reflects the impacts for the five
environmental indicators by lifecycle stage. The primary hotspot for each metric is colour coded red and indicates
that the impact is greater than 30% of the total footprint. The secondary hotspot is colour coded orange and
ranges between 10% and 29% of the total impact. Low level contributions are colour coded green and indicate
the impact is less than 9% of the total. Lack of data availability for a metric is indicated by a blank white space.
GHG Energy Materials Waste Water
Materials - - 100% - -
Production 7% 7% - - -
Use -107% -107% - - -
Waste - - - - -
Material Risk
The traffic indicator to the right indicates the material risk
associated with the production of products within this
category for selected materials.
The table below shows the location and type of material risk:
High Medium Low
Ma
teri
al
Lo
ca
tio
n
Re
cycli
ng
Ra
te
Ma
teri
al
Lo
ca
tio
n
Re
cycli
ng
Ra
te
Ma
teri
al
Lo
ca
tio
n
Re
cycli
ng
Ra
te
Steel China 22% Copper Chile 20%
Plastics Saudi Arabia 25%
Aluminium Australia 35%
Rare Earths China 1%
Potential areas for research/follow-up
Significant gaps are present throughout the lifecycle of a wind turbine in all environmental metrics. Further
research should focus on small scale turbine material impacts, which are expected to be much different from
larger scale turbines that have been studied to a far greater extent.
High 0%
Medium 80%
Low 20%
Material Risk

Reducing the environmental and cost impacts of electrical products 59
GHG Energy Materials Waste Water
Materials
Production
Use
Waste
Sources of information
Reference Publication Date Confidentiality
Allen, S.R., Hammond, G.P., McManus, M.C.,2008 . Energy
Analysis and Environmental Lifecycle Assessment of a Micro-Wind
Turbine
2008 Public
Rankine, R.K., Chick, J.P., Harrison, G.P., 2006. Energy and
carbon audit of a rooftop wind turbine. Proceedings of the
IMechE, Part A: Journal of Power and Energy 2006 220:643
2006 Public
Tremeac, B. and Meunier, F., 2009. Lifecycle analysis of 4.4MW
and 250MW wind turbines. Renewable and Sustainable Energy
Reviews. Vol. 13, pp. 2104-2110
2009 Public
Summary history
Last updated by Will Schreiber
Last updated 1 November 2011
Contributors Charlotte Dickinson, Sam Matthews, Kevin Lewis, Aida Cierco

www.wrap.org.uk/psf