parle agro pvt. ltd., brand an empirical study …icmrr.org/dec_2015/ijmrr/151202010.pdf · parle...
TRANSCRIPT

PARLE AGRO PVT. LTD., BRAND – AN EMPIRICAL STUDY ON
CUSTOMER PERCEPTION TIRUPATI CITY
G. RADHA KRISHNA MURTHY 1 B.G.V PHANI MADHAV
2 Dr. V. MURALI KRISHNA
3
1Research scholar, Bharathiyar University, Coimbator, TN. India
2Research scholar, Bharathiyar University, Coimbator, TN, India
3 Assistant Professor, SITAMS, Chittoor, Andhra Pradesh, India
ABSTRACT
One thing we have in common is that we all are customers. In fact everybody in this world is a
customer. Every day of our life we are perceived something about a product or service in different
way. We buy and consuming an incredible variety of goods. However, as we all are having difference
tastes and preferences, likes and dislikes and own beliefs, to adopt different behaviour patterns while
we making our Purchase decisions. The study of customer perception refers to the process by which
we select, organize, and interpret the information and its inputs to create a meaningful picture of the
world. It depends not only on our Physical motivation, but also on the stimuli’s relationship to their
surrounding environment and on Conditions within each of us. Individual person might perceive a
fast-talking salesperson as aggressive and dishonest; another, as intelligent and supportive. Each will
respond to the sales person differently. The main aim of the study is to analyse the perception of
customers towards Parle Agro Pvt. Ltd., Pvt. Ltd. and to know the customer taste, beliefs, attitude and
preferences of a Parle Agro Pvt. Ltd., brands.
Key words: Perception, Agro, motivation, customers.
INTRODUCTION
Parle Products Company was established in 1929 in British India. The company was possessed by the
―Chauhan‖ family of Vile Parle of Mumbai. Parle has began manufacturing biscuits in 1939. In 1947,
when India became independent, the company launched an ad campaign, show casing its Gluco
biscuits as an Indian alternative to the British biscuits. The Parle brand became famous in India
because of the success of products such as the Parle-G biscuits. In February 2008, Parle Products
sued Parle Agro Pvt. Ltd., for using the brand Parle for competing confectionary products. Later,
Parle Agro Pvt. Ltd., launched its confectionery products under a new design which did not include
the Parle brand name. In 2009, the Bombay High Court ruled that Parle Agro Pvt. Ltd., can sell its
confectionery brands under the brand name "Parle" or "Parle Confi" on condition that it clearly
specifies that its products belong to a separate company, which has no relationship with Parle
Products.
Parle Agro Pvt. Ltd., is one of the leading FMCG companies in India. Parle Agro Pvt. Ltd.,
commenced operations in 1984. It started with beverages, and later diversified into Bottled water
(1993), plastic packaging (1996) and confectionary (2007). Frooti, the first product rolled out of Parle
Agro Pvt. Ltd., in 1985, became the largest selling mango drink in India. It owns several popular
brands Including Frooti, Appy, Saint Juice, LMN, Cafe Cuba, Hippo and Bailey.Parle Agro Pvt. Ltd.,
also diversified into production of PET performs (semi-finished bottles) in 1996. Its customers
include companies in the beverages, edible oil, confectionery and pharmaceutical segments.
INTERCONTINENTAL JOURNAL OF MARKETING RESEARCH REVIEWISSN:2321-0346 - ONLINE ISSN:2347-1670 - PRINT -IMPACT FACTOR :0.882VOLUME 3, ISSUE 12, DECEMBER 2015
www.icmrr.org 81 [email protected]
www.icm
rr.or
g

REVIEW OF LITERATURE
A literature review is a body of text that aims to review the critical points of current knowledge.
Literature review are secondary sources and as such, do not report any new experimental work.
DilberUlas, H. Bader Arslan (2006) The purpose of this study is to present a brand view and
analysis of brand switching of cola consumers in Turkish cola market. Cola turka. The new cola
brand, has captured almost one-quarter of the market. It has the potential to create loyal consumers.
Despite Coca-Cola preserving its dominance, Pepsi-cola has been surpassed by this new product.
Gunne Grankvist, Hans Lekedal, Maarit Marmendal (2007), Gupta & Gupta (2008) ―fruit
drinks: how healthy and safe‖ discussed that fruit drinks are popularly used in most urban households
today markets are flooded with large variety of juices.
Charles (2009) ― Market news service: fruit juices report‖ in his studies discussed that the fruit juice
market is presently relatively quiet, provided one ignores the continued collapse in the price of FCOJ.
MarianelaFornerino, Francoisd’Hauteville (2010) This experimental research seeks to offer a
method for measuring the respective product and brand contributions to the global perceived quality
dimension in the case of five brands of orange juices. Results indicate an assimilation effect for the
national brands, particularly strong with the most preferred brand, and a non-significant brand effect
for the retailer’s brand, although both products were rated the same in the blind evaluation.
OBJECTIVES OF THE STUDY
To analyse the perception of customers towards Parle Agro Pvt. Ltd., Pvt. Ltd. in Tirupati, AP
region.
To know the customer taste, beliefs, attitude and preferences of Parle Agro Pvt. Ltd., brands.
To offer suggestions necessary based on the survey.
RESEARCH METHODOLOGY
Research is a systematic design, collection, analysis and reporting of data and findings
relevant to specific situation or problem. The objective of the study is to describe the research
procedure and methods that have been adopted for achievement of the project objectives.
DATA SOURCES
To perform the research study by researcher, the sources of data obtained are:
a. Primary Data: The data is obtained by interacting and interviewing the customers in Tirupati.
b. Secondary Data: This data obtained from company websites, books, newspapers, magazines
published from time to time.
RESEARCH APPROACHES
Survey Research: Surveys are best suited for descriptive research. Companies undertake surveys to
learn about customer knowledge, beliefs, preferences and satisfaction. It requires development of a
survey instrument, usually a questionnaire, which the respondents are asked to fill up.
INTERCONTINENTAL JOURNAL OF MARKETING RESEARCH REVIEWISSN:2321-0346 - ONLINE ISSN:2347-1670 - PRINT -IMPACT FACTOR :0.882VOLUME 3, ISSUE 12, DECEMBER 2015
www.icmrr.org 82 [email protected]
www.icm
rr.or
g

Research Instrument- Questionnaire: This is one of the data collection tool. It is quite popular
particularly in case of big enquires. It is being adopted by private individuals, research worker, private
and public organisation and even government. A questionnaire consists of set of questions presented
to respondents. Because of its flexibility and it is issued to persons concerned with a request to answer
the questions and return the questionnaire. The researcher used the structured questionnaire. It
specifies all possible answers and provides answers to interpret and tabulate.
SAMPLING PROCEDURE
Sampling is simply the process of learning about population on the basis of sample drawn
from it. In this technique, instead of every unit of universe only a part of the universe is studied and
conclusion is drawn on the basis of entire universe.
SAMPLING DESIGN
Present perception and expectation from this brand. The researcher selected the customers of Parle
Agro Pvt. Ltd., Pvt. Ltd., at Tirupati for this research study.
Sampling Plan
Sampling unit: Sampling unit includes all the customers of Parle Agro Pvt. Ltd., products present
in Tirupati.
Sampling size: sample size consists of 120 customers.
Sampling Method: For collecting information from customers convenience sampling method is
used which is under non-probabilistic sampling method.
DATA ANALYSIS TOOLS
Data analysis was conducted on the collected primary data by using statistical techniques and data is
presented with the help of pre-diagrams, bar charts and tables.
DATA ANALYSIS & INTERPRETATION
1. Awareness about Parle Agro Pvt. Ltd., brands:
S.
No Attributes
No. of
respondent
s
per cent of
respondents
1. Electronic
Media
46 38.33
2. Print Media 20 16.66
3. Friends 28 23.33
4. Internet 17 14.16
5. Other 09 7.50
Total 120 100.00
Table: 1 Graph: 1
38.33
16.6623.33
14.167.5
0
10
20
30
40
50
% o
f re
spo
nd
en
ts
Know about Parle agro brands
INTERCONTINENTAL JOURNAL OF MARKETING RESEARCH REVIEWISSN:2321-0346 - ONLINE ISSN:2347-1670 - PRINT -IMPACT FACTOR :0.882VOLUME 3, ISSUE 12, DECEMBER 2015
www.icmrr.org 83 [email protected]
www.icm
rr.or
g

Interpretation: From the above analysis we observe that 38.33 per cent of the customers are known
about Pale brands through electronic media, 23.33 per cent have known through friends and rest will
known by media, internet and others.
2. Brand preference in Parle Agro Pvt. Ltd.,
S. no Attributes No. Of
respondents
per cent of
respondents
1. Mango Frooti 58 48.33
2. Appy 32 26.66
3. Saint Juice 14 11.66
4. Cafe Cuba 04 03.33
5. LMN 12 10.00
120 100.00
Table: 2 Graph: 2
Interpretation: From the above analysis it is observed that 48.33 per cent are customers prefer
Mango frooti as their preference.26.66 customers prefer Appy.
3 Opinions on Quality of Mango Frooti
S.
No Attributes
No. of
respondents
per cent of
respondents
1. Excellent 46 38
2. Good 44 37
3. Average 18 15
4. Poor 08 7
5. Very poor 04 3
Total 120 100
Table: 3 Graph: 3
Interpretation: From the above analysis we observe that 38 per cent of customers feel that Mango
Frooti has excellent quality.
4. Availability of Mango Frooti in Lower Price
S.
no Attributes
No. of
respondents
per cent of
respondents
1. Strongly Agree 60 50
2. Agree 42 35
3. Neutral 9 8
4. Disagree 6 5
5. Strongly
disagree
3 2
Total 120 100
Table: 4 Graph: 4
38 37
157 30
20
40
%o
f re
spo
nd
en
ts
Attributes
Quality of Mango Frooti
48.3326.66
11.66 3.33 100
204060
Mango Frooti
Appy Saint Juice
Cafe Cuba
LMN
%o
f re
spo
nd
en
ts
Attributes
Brand Preference
5035
8 5 20204060
%o
f re
spo
nd
en
ts
Attributes
Availability of Mango frooti in
lower price
INTERCONTINENTAL JOURNAL OF MARKETING RESEARCH REVIEWISSN:2321-0346 - ONLINE ISSN:2347-1670 - PRINT -IMPACT FACTOR :0.882VOLUME 3, ISSUE 12, DECEMBER 2015
www.icmrr.org 84 [email protected]
www.icm
rr.or
g
Interpretation:
From the above analysis we observe that 50 per cent of the customers strongly agreed Mango Frooti is
available in lower price.
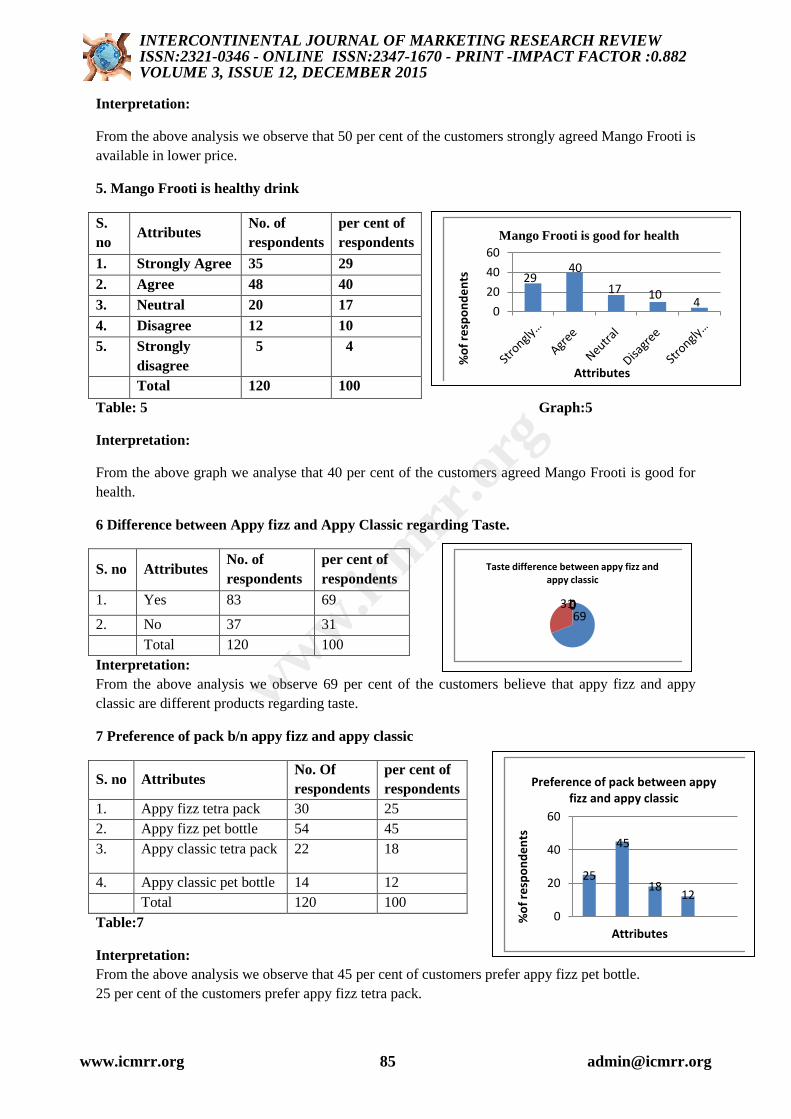
5. Mango Frooti is healthy drink
S.
no Attributes
No. of
respondents
per cent of
respondents
1. Strongly Agree 35 29
2. Agree 48 40
3. Neutral 20 17
4. Disagree 12 10
5. Strongly
disagree
5 4
Total 120 100
Table: 5 Graph:5
Interpretation:
From the above graph we analyse that 40 per cent of the customers agreed Mango Frooti is good for
health.
6 Difference between Appy fizz and Appy Classic regarding Taste.
S. no Attributes No. of
respondents
per cent of
respondents
1. Yes 83 69
2. No 37 31
Total 120 100
Interpretation:
From the above analysis we observe 69 per cent of the customers believe that appy fizz and appy
classic are different products regarding taste.
7 Preference of pack b/n appy fizz and appy classic
S. no Attributes No. Of
respondents
per cent of
respondents
1. Appy fizz tetra pack 30 25
2. Appy fizz pet bottle 54 45
3. Appy classic tetra pack 22 18
4. Appy classic pet bottle 14 12
Total 120 100
Table:7 Graph:7
Interpretation:
From the above analysis we observe that 45 per cent of customers prefer appy fizz pet bottle.
25 per cent of the customers prefer appy fizz tetra pack.
6931000
Taste difference between appy fizz and appy classic
25
45
1812
0
20
40
60
%o
f re
spo
nd
en
ts
Attributes
Preference of pack between appy fizz and appy classic
2940
17 104
0
20
40
60
%o
f re
spo
nd
en
ts
Attributes
Mango Frooti is good for health
INTERCONTINENTAL JOURNAL OF MARKETING RESEARCH REVIEWISSN:2321-0346 - ONLINE ISSN:2347-1670 - PRINT -IMPACT FACTOR :0.882VOLUME 3, ISSUE 12, DECEMBER 2015
www.icmrr.org 85 [email protected]
www.icm
rr.or
g

8. Quantity choose in appy
S.no Attributes No. of
respondents
per cent of
respondents
1. 160ml 42 35
2. 200ml 25 20
3. 250ml 27 23
4. 500ml 16 13
5. 1ltr 10 9
Total 120 100
Table: 8 Graph: 8
Interpretation:
From the above analysis 35 per cent of the customers prefer appy 160ml.
9 Level of satisfaction towards appy advertisement
S. no Attributes No. Of
respondents
per cent of
respondents
1. Highly satisfied 10 8
2. Satisfied 17 14
3. Moderate 14 12
4. Dissatisfied 49 41
5. Highly dissatisfied 30 25
Total 120 100
Table: 9 Graph:9
Interpretation:
From the above analysis we observe that 41 per cent of custoemers are dissatisfied with appy
advertisemernt.
10 Saint juice view
S. no Attributes No.of
respondents
per cent of
respondents
1. As a health drink 64 54
2. As a status symbol 15 12
3. As an put off thirst 41 34
Total 120 100
Table: 10 Graph:10
Interpretation:
From the above analysis we observe that 54 per cent of the customers view saint juice as a health
drink.
35
20 23
139
0
10
20
30
40
160ml 200ml 250ml 500ml 1ltr
%o
f re
spo
nd
en
ts
Attributes
Quantity choose in appy
8 14 1241
250
204060
%o
f re
spo
nd
en
ts
Attributes
Satisfaction with appy
advertisement
54
1234
0204060
As a health drink
As a status symbol
As an put off thirst
%o
f re
spo
nd
en
ts
Attributes
View of saint juice
INTERCONTINENTAL JOURNAL OF MARKETING RESEARCH REVIEWISSN:2321-0346 - ONLINE ISSN:2347-1670 - PRINT -IMPACT FACTOR :0.882VOLUME 3, ISSUE 12, DECEMBER 2015
www.icmrr.org 86 [email protected]
www.icm
rr.or
g

11 Induces deal with Fruit juices
S. no Attributes No. Of
respondents
per cent of
respondents
1. Good nutrition 40 33
2. Quality 20 17
3. Availability 16 13
4. Taste 34 28
5. Quantity 10 9
Total 120 100
Table: 11 Graph:11
Interpretation:
From the above analysis we observe that 33 per cent of the customers deal with saint juice as a good
nutrition.
12 Opinion on price of saint juice
S. no Attributes No. Of
respondents
per cent of
respondents
1. Very high 19 16
2. High 36 30
3. Moderate 28 23
4. Low 21 18
5. Very low 16 13
Total 120 100
Table: 12 Graph:4.12
Interpretation:
From the above analysis we observe that 30 per cent of customers opinion on price of the saint juice is
high.
13 Awareness 0n saint juice with frequent advertisement
S. no Attributes No. Of
respondents
per cent of
respondents
1. Strongly Agree 30 25
2. Agree 49 41
3. Moderate 21 18
4. Disagree 14 11
5. Strongly disagree 6 5
Total 120 100
Table: 13 Graph:13
0204060
% o
f re
spo
nd
en
ts
Attributes
Awareness on saint juice
0
20
40
% o
f re
spo
nd
en
ts
Attributes
Induces deal with saint
juice
010203040
% o
f re
spo
nd
en
ts
Attributes
Opinion on price of saint juice
INTERCONTINENTAL JOURNAL OF MARKETING RESEARCH REVIEWISSN:2321-0346 - ONLINE ISSN:2347-1670 - PRINT -IMPACT FACTOR :0.882VOLUME 3, ISSUE 12, DECEMBER 2015
www.icmrr.org 87 [email protected]
www.icm
rr.or
g

Interpretation:
From the above analysis we observe that 41 per cent of the customers agreed with frequent
advertisement leads to more awareness on saint juice.
14 Overall package appearance of Parle Agro Pvt. Ltd., brands
S.
no Attributes
No. of
respondents
per cent of
respondents
1. Excellent 45 37
2. Good 62 52.
3. Neutral 10 8
4. Poor 3 3
5. Very poor -
Total 120 100
Table 14 Graph:14
Interpretation:
From the above analysis we observe that 52 per cent of the customers feel package of Parle Agro Pvt.
Ltd., brands are good.
15 Overall ratings of Parle Agro Pvt. Ltd., brands
S. no Attributes No. of
respondents
per cent of
respondents
1. Very likely 35 29
2. Somewhat likely 40 33
3. Neutral 24 20
4. Somewhat unlikely 12 10
5. Very unlikely 9 8
Total 120 100
Table: 15 Graph:15
Interpretation:
From the above analysis we observe 33 per cent of the customers agreed with overall ratings of Parle
Agro Pvt. Ltd., brands.
4.16 Satisfaction levels towards promotions of Parle Agro Pvt. Ltd., brands
S. no Attributes No. of
respondents
per cent of
respondents
1. Highly satisfied 20 17
2. Satisfied 45 38
3. Neither satisfied
nor dissatisfied
33 27
4. Dissatisfied 15 12
5. Highly dissatisfied 7 6
Total 120 100
Table: 16 Graph:16
3752
83
0
20
40
60
% o
f re
spo
nd
en
ts
Attributes
29 33
20 10 8
010203040
% o
f re
spo
nd
en
ts
Attributes
17
38
27
12 6
05
10152025303540
% o
f re
spo
nd
en
ts
INTERCONTINENTAL JOURNAL OF MARKETING RESEARCH REVIEWISSN:2321-0346 - ONLINE ISSN:2347-1670 - PRINT -IMPACT FACTOR :0.882VOLUME 3, ISSUE 12, DECEMBER 2015
www.icmrr.org 88 [email protected]
www.icm
rr.or
g

Interpretation:
rom the above analysis we observe that 38 per cent of the customers are satisfied with the promotions
of Parle Agro Pvt. Ltd., brands.
17 Company reaching customers expectations in the market
S. no Attributes No. of
respondents
per cent of
respondents
1. Strongly agree 15 12
2. Agree 38 32
3. Moderate 26 22
4. Disagree 30 25
5. Strongly disagree 11 9
Total 120 100
Table: 17 Graph:17
Interpretation:
From the above analysis we observe that 32 per cent of the customers agree with Parle Agro Pvt.
Ltd., brands reached expectations of the customers in the matket.
CHI-SQUARE TEST
Ho: The age group is independent of perception of customer towards Parle Agro Pvt. Ltd.
Age group Excellent Good Neutral Bad Very bad Total
10-15 6 8 3 2 1 20
15-30 12 30 9 5 4 60
30-40 5 7 6 4 3 25
>40 2 4 5 2 2 15
Total 25 49 23 13 10 120
The table of expected frequency is:
4.16 8.16 4.60 2.16 1.60 20.68
12.50 24.50 11.50 6.50 5.00 60.00
5.20 10.20 4.79 2.70 2.08 24.97
3.12 6.12 2.87 1.62 1.25 14.98
24.98 48.98 23.76 12.98 9.93 120.00
12
32
2225
9
0
10
20
30
40
Strongly agree
Agree Moderate Disagree Strongly disagree
% o
f re
spon
den
ts
Attributes
INTERCONTINENTAL JOURNAL OF MARKETING RESEARCH REVIEWISSN:2321-0346 - ONLINE ISSN:2347-1670 - PRINT -IMPACT FACTOR :0.882VOLUME 3, ISSUE 12, DECEMBER 2015
www.icmrr.org 89 [email protected]
www.icm
rr.or
g

Arranging the observed and expected frequencies in the following order:
Observed
values
Expected
values (O-E)2 (O-E)2/E
6 4.16 3.38 0.8125
12 12.50 0.25 0.0200
5 5.20 0.04 0.0076
2 3.12 1.25 0.4006
8 8.16 0.02 0.0024
30 24.5 42.25 1.7244
7 10.20 10.24 1.0030
4 6.12 4.49 0.7366
3 4.60 2.56 0.5565
9 11.50 6.25 0.5434
6 4.79 1.46 0.3048
5 2.87 4.53 1.5783
2 2.16 0.02 0.0092
5 6.50 2.25 0.3461
4 2.70 1.69 0.6259
2 1.62 0.14 0.0864
1 1.60 0.36 0.2250
4 5.00 1.00 0.2000
3 2.08 0.84 0.4038
2 1.25 0.56 0.4480
120 10.0300
Degree of freedom = (r-1) (c-1)
= (4-1) (5-1)
= 3 * 4
= 12
The value of chi – square for 12 of freedom at 5 per cent level of significance is 21.0
The calculated value of chi – square 10.03 is less than the table value (21.0) at 5 per cent level
of significance with 12 degree of freedom. So that Ho is accepted.
INFERENCE:
The age group is independent of perception of customers towards Parle Agro Pvt. Ltd., brands.
FINDINGS
On the basis of information collected from the users of Parle Agro Pvt. Ltd., products in tirupati city,
some key facts which come as a result of this research as follows
The prime finding is that all the respondents of the research have known about the Parle Agro Pvt.
Ltd., brands, through various sources.
INTERCONTINENTAL JOURNAL OF MARKETING RESEARCH REVIEWISSN:2321-0346 - ONLINE ISSN:2347-1670 - PRINT -IMPACT FACTOR :0.882VOLUME 3, ISSUE 12, DECEMBER 2015
www.icmrr.org 90 [email protected]
www.icm
rr.or
g

This study shows that majority of the customers prefer to drink Mango Frooti and Appy of the
Parle Agro Pvt. Ltd., products.
The respondents strongly accept that Mango frooti is available at lower prices.
Most of the respondents are satisfied with package appearance of Parle Agro Pvt. Ltd., Brands.
The Majority of the respondents have specified the Quality of Frooti is Good and Excellent.
As per the view of respondents they knew about saint juice through advertisement and accept it as
a good health and nutritious drink.
By This analysis we can say the respondents are satisfied with promotional activities of Parle
Agro Pvt. Ltd., Brands.
The Respondents arewell Known about the difference between Appy Fizz and Appy Classic
regarding Quality
SUGGESTIONS
From the Above Discussion, it is concluded that The Parle Agro Pvt. Ltd., Products are well known to
customers. The Customers are Satisfied with the taste and quality of the products. The respondents
have Awareness and consuming all sorts of soft drinks of Parle Agro Pvt. Ltd., Brands. Finally it is
recommended that should have to improve advertisement on overall Parle Agro Pvt. Ltd., products to
create good impression on customers.
REFERENCES
Sumathi.S.(2003). Marketing Research and Consumer Behavior, Vikas Publishing House,
1Edition.
Bakewell, C. and Mitchell, V. W. (2006). Male versus female consumer decision
making.Journal of Business Research, 59, 12971300.
Biplab, S. B. (1998). Hand Book of Marketing Management, Himalaya Publishing
House,Bombay, 1st Edition.
Canabal, M. E. (2001). Decision making styles of young South Indian consumers:
Anexploratory study. College Student Journal, 36(1), 1219.
Fornell, C., S. Mithas, and F.V. Morgeson III (2009). "The Economic and Statistical
Significanceof Stock Returns on Customer Satisfaction," Marketing Science, 28(5), 820825.
Jaishri, N. Jethwaney, (1999). Advertising, Phoenix Publishing House, New Delhi, 1st
Edition.
Jayashree, Y. (1998).Consumer behavior and fashion. Textile trends. 40:3343.
Kamalaveni. D., Kalaiselvi, S. and Rajalakshmi, S. (2008). Brand Loyalty of Women
consumers
with respect to FMCGs. Indian Journal of Marketing, 38(9), PP. 4450.
Kazmi. S.H.H. (2001). Advertising and Sale Promotion, Excel Books, New Delhi, 1st
Edition.
Lalitha. A., Ravikumar, J.andPadmavali, K. (2008). Brand preference of Men Wear. Indian
Journal of Marketing, 38(10), pp.3336
INTERCONTINENTAL JOURNAL OF MARKETING RESEARCH REVIEWISSN:2321-0346 - ONLINE ISSN:2347-1670 - PRINT -IMPACT FACTOR :0.882VOLUME 3, ISSUE 12, DECEMBER 2015
www.icmrr.org 91 [email protected]
www.icm
rr.or
g

Mathur. V.C.(2002). Advertising Management, New Age International Publishers, New
Delhi,
1st edition.
Mishra, Sita (2009).―New Retail Models in India: Strategic Perspective Analysis‖, Journal of
Marketing and Communication, Dec. 2008, Vol 4, No.2,pp. 3947.
Pathak. S.V. and Aditya P. Tripathi., (2009). Consumer shopping behaviour among Modern
Retail Formats: A Study of Delhi & NCR. Indian Journal of Marketing, 39(2), PP. 312.
WEBSITES:
www.google.co.in,
www.parleagro.com,
www.managementparadise.co.in
INTERCONTINENTAL JOURNAL OF MARKETING RESEARCH REVIEWISSN:2321-0346 - ONLINE ISSN:2347-1670 - PRINT -IMPACT FACTOR :0.882VOLUME 3, ISSUE 12, DECEMBER 2015
www.icmrr.org 92 [email protected]
www.icm
rr.or
g