parametric investigation of harnessed power of two …
TRANSCRIPT
Uludağ University Journal of The Faculty of Engineering, Vol. 23, No. 1, 2018 RESEARCH
DOI: 10.17482/uumfd.377444
329
PARAMETRIC INVESTIGATION OF HARNESSED POWER OF
TWO TANDEM CYLINDERS IN FLOW INDUCED VIBRATION
Erinç DOBRUCALI *
Received: 11.01.2018; revised: 03.04.2018; accepted: 05.04.2018
Abstract: In transverse flow, cylinders respond in FIV (Flow Induced Vibrations); particularly VIV
(Vortex Induced Vibrations) and galloping. Typically, in the galloping region, the hydrokinetic power
converted to mechanical in the oscillators increases with increasing flow velocity and Reynolds number.
Flow Induced Vibrations (FIVs) of two tandem, rigid and circular cylinder with end-springs are studied
for 30,000<Re <120,000 with different damping, mass ratio and stiffness as parameters in the Low
Turbulence Free Surface Water (LTFSW) Channel of the Marine Renewable Energy Laboratory
(MRELab). Typical local drops and jumps in harnessed power were observed in the velocity range of
0.9<U<1.2 m/s within the galloping region. The main objective of this paper is to explain the reason for
the presence of these drops and jumps. To achieve this objective, the points of changing in harnessed
power in an extensive set of data with spacing, damping, stiffness, and flow velocity as parameters are
identified. For both up and downstream cylinders, the harnessed power, amplitude-ratio, frequency-ratio
and time history graphs are obtained to define the reason of these drop/jumps. Visualization with high-
resolution camera has been used and the assumption which may affect the phenomena were studied and
presented. Galloping instability disappears at this drops and harnessed power decreases sharply and
amplitude as well. As a conclusion, there is a big interaction between cylinders.
Keywords: Vortex Induced Vibrations, galloping instability, harnessed power.
Akış kaynaklı titreşimde iki ardışık silindirden elde edilen gücün parametrik olarak
incelenmesi
Öz: Enine akışlarda silindirler özellikle çevri kaynaklı titreşim ve hızlı artış (galloping) adı verilen
bölgeden oluşan akış kaynaklı titreşim sergilerler. Hızlı artış bölgesinde, osilatörlerde mekanik enerjiye
çevrilen hidrokinetik enerji akışın hızı ve Re sayısıyla artar. Türbülanslı serbest su yüzeyli kanalda
yapılan deneylerde arkalı önlü bulunan ardışık silindirlerin hareketi 30,000<Re <120,000 aralığında farklı
parametreler için incelenmiş ve özellikle hızlı artış bölgesindeki 0.9<U<1.2 m/s akış hızı aralığında elde
edilen güçte lokal artış ve düşüşler tespit edilmiştir. Bu çalışmanın amacı bu artış/azalışların sebeplerini
açıklamaktır. Bunun için tüm deneyler incelenerek bu ani değişim olan parametreler (Kütle oranı, yay
sabiti, hız oranı vb. gibi) belirlenerek bir matris oluşturulmuştur. Hem öndeki silindir hem de arkasındaki
silindir için elde edilen güç, genlik oranı, frekans oranları ve zamana bağlı hareket grafikleri
oluşturulmuştur. Yüksek çözünürlüklü kamera ile görüntüleme tekniği kullanılmış ve elde edilen sonuçlar
tartışılmıştır. Bu değişimlerin ana sebebinin iki silindir arasındaki etkileşim olduğu tespit edilmiştir. Bu
değişimlerde hızlı artış dengesizliği kaybolmakta ve elde edilen güçte ve genlikte ani düşüşler
oluşmaktadır.
Anahtar Kelimeler: Çevri kaynaklı titreşim, hızlı artış dengesizliği, güç.
* Istanbul Naval Shıpyard, Pendik, 34890, Istanbul, TURKEY. Correspondence Author: Erinç DOBRUCALI
Dobrucalı E.: Parametric Investigation of Harnessed Power of Two Tandem Cylinders in Flow Induced Vibration
330
1. INTRODUCTION
Flow Induced Vibrations (FIVs) present a source of challenge for various structures in
steady flows such as bridges, buildings, heat exchangers, offshore structures, or power
transmission cables. Unlike previous efforts to control the occurrence of Flow Induced
Vibrations (FIV), which is a potential harmful phenomenon for structures subjected in a flow,
VIVACE utilizes and enhances FIV to harnessed power from river and ocean currents. VIV and
galloping are the most well-known phenomenon of FIV with different features. Vortex-induced
vibration (VIV) occurs when shedding vortices (e.g. the Von Karman vortex street) creates
pressure differences and couples with the restoring force (e.g. spring stiffness) on a cylinder in
cross-flow to both flow and structure. It can occur over a large range of Reynolds numbers (Re).
Galloping is an aero/hydro-elastic instability, which is described by high amplitudes and lower
frequencies than VIV and is perpendicular to the flow. It is more robust and destructive than
VIV. Galloping does not depend on vortex formation, occurs above a critical flow velocity, and
has a bigger amplitude of oscillation. Elastic bodies with circular cross section in a flow usually
experience VIV, while galloping occurs on a body with non-circular cross section (Blevins,
1990). Depending on the flow speed, the geometry of the body and the oscillator parameters,
these two FIVs may coexist in a transition part between them, may overlap, or may be separated
(Bernitsas at al., 2007, Chang, 2011, Kinaci et al, 2016, Park et al, 2013a-b).
As mentioned, in many engineering applications, FIVs are suppressed because of their
destructive nature. MRElab managed to convert the kinetic energy of water flows into electricity
by enhancing FIV (Bernitsas at al., 2007, Chang, 2011, Bernitsas and Raghavan 2009,2011,
2014, Raghavan 2007). In MRElab, Flow Induced Vibrations (FIV) is studied to convert marine
hydrokinetic energy, from oceans, tidal and rivers to electricity using the VIVACE energy
harvester. Vortex Induced Vibrations for Aquatic Clean Energy Converter is probably the
closest to commercialization because it has suffered extensive laboratory testing and much field
deployments since its introduction in 2006. The objective of the Marine Renewable Energy Lab
(MRELab) is to investigate FIV of single and multiple cylinders and find different ways to
enhance FIV in order to design VIVACE Converters and optimize the power output for various
flow velocities.
Vortex-induced vibration (VIV) to a cylinder has been studied experimentally (Park et al.
(2013a-b), Park et al. (2012), Kim et al. (2013), Park et al. (2012)) and numerically (Wu (2011),
Wu (2011), Ding et al. (2013, 2015)) by researchers in order to eliminate or at least regulate this
unsteady fluid-structure interaction phenomenon since it has been identified as the cause for
many structural failures. But, it is challenging, and it is still being debated due to the complexity
of the interaction between body dynamics and fluid dynamics. Two cylinders arrangement have
been studied in many types of research as the simplest arrangement. In this research, both
cylinders can oscillate which has not been done very often in previous papers up to now.
Moreover, most of the previous experiments on VIV were conducted in TrSL2 regime which
fluctuating lift coefficient rises as the Re increases. But in this research, experiments placed in
TrSL3 that shear layer becomes fully turbulent, and the fluctuating lift coefficient of a smooth
cylinder reaches its maximum value.
There are many fundamental differences in the flow dynamics past a cylinder between the
TrSL3 and TrSL2 flow regimes as defined by Zdravkovich (1997, 2002). The shear layers on
both side of the cylinder are saturated in TrSL3 transporting more vorticity to the Von Kármán
vortices. Thus, the shear layers have a stronger roll-up much closer to the cylinder. The
circulation in the von Kármán vortices arives shedding strength faster since the Strouhal number
(Nrel (2012)) is about constant over the whole laminar flow regime for 400<Re<300,000. Thus,
the vortex shedding frequency rises proportionally to the flow velocity. Further, the formation
length is shorter. (Unal and Rockwell, 2012) The combination of a shorter formation length
with a strong roll-up and higher circulation closer to the after the cylinder body cross-section
Uludağ University Journal of The Faculty of Engineering, Vol. 23, No. 1, 2018
331
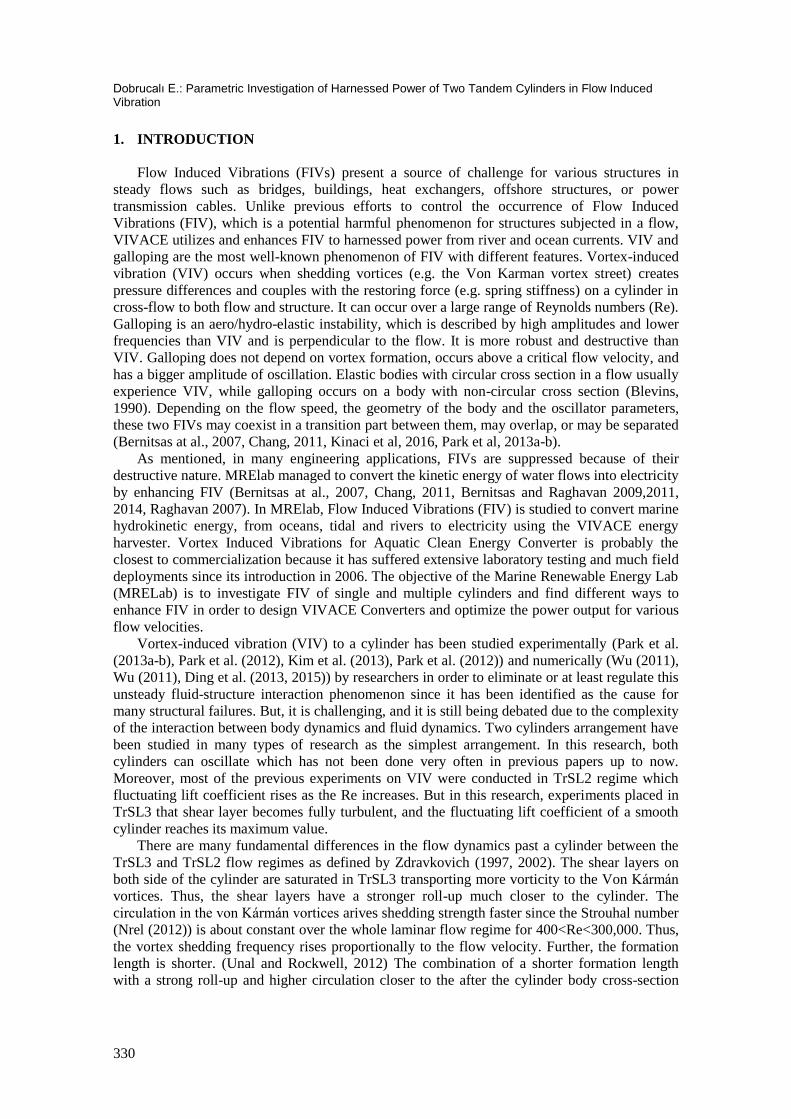
induces higher lift force at the moment of shedding. Thus, as shown in Figure 1a and b. below,
the lift coefficient in TrSL3 is many times higher than that in the TrSL2 part.
a. b.
Figure 1. a) Variation of force coefficients for disturbance-free flow b) Mean lift (CL)
coefficient, fluctuating lift (C’L) and drag (C’D) coefficients and in the TrSL and TrBL regimes
(Reproduced from (Zdravkovich (1997), Bernitsas (2016))
Bokaian and Geoola (1984) considered the case of fixed upstream cylinder and flexible
downstream cylinder. They presented that "depending on the cylinders separation", and
structural damping, the downstream cylinder exhibited 1) a vortex-resonance, 2) a galloping, or
a combined vortex-resonance and galloping, or 3) a separated vortex-resonance and galloping"
response. They found high amplitude responses which they stated "wake-induced galloping".
They also demonstrated that whilst some characteristics of wake-excited galloping were defined
to be the same to those of galloping of sharp-edge cylinder bodies, the others were observed to
be basicly different.
Sun et al. (2015) investigated the fluid-structure coupling between two circular cylinders in
tandem at a different spacing from L/D = 1.2-6.0. Based on the galloping vibrations generated,
four regimes are identified. Regime I (L/D ≤ 1.5) is defined by both cylinders experiencing the
downstream cylinder vibration amplitude and galloping vibrations smaller than the upstream
one. At regime II (1.5 < L/D < 2.5), the galloping vibration is larger for the upstream cylinder
than the downstream one at smaller Ur, but the opposite dominates at larger Ur. At regime III
(2.5 ≤ L/D ≤ 3.0), the downstream cylinder vibration amplitude is larger than the upstream one
and the upstream cylinder shear layer reattachment takes place on the front surface of the
downstream one. Regime IV (L/D > 3.0) features small vibration for the downstream cylinder
induced by convective vortices from the upstream cylinder and no vibration for the upstream
cylinder.
In this paper, variation in harnessed power in the velocity range of 0.9 < U < 1.2 m/s for two
tandem cylinders with PTC (Passive Turbulence Control) were investigated. To achieve this
goal, the data of mechanical energy which converted from hydrokinetic to mechanical as a
function of reduced velocity, Re and the flow speed were used. (Sun et al., 2017) The simulated
Re range for which experiments were done in the MRELab is 30,000< Re < 120,000, which
places in the TrSL3 regime. Critical points, which dramatically drop or jump in power
conversion were chosen and visualized by a high-resolution camera. Harnessed power,
amplitude ratio, frequency ratio and time histories at point of drops and jumps were evaluated
and presented. All the vortices which shed from sides of the upstream cylinder toward
downstream cylinder were observed by regarding captured videos frame by frame. The
experimental set-up is described in Section 2 including the facility, the oscillator, Vck and the
Passive Turbulence Control (PTC). A mathematical model is represented in Section 3, results
and discussions are explained in Section 4.
Dobrucalı E.: Parametric Investigation of Harnessed Power of Two Tandem Cylinders in Flow Induced Vibration
332
2. EXPERIMENTAL DETAILS
In this section, The Low-Turbulence Free Surface Water (LTFSW) channel, cylinders used
in this experiment, virtual damper-spring (Vck) system, flow visualization set-up, data collection
and experimental matrix are presented briefly.
2.1. LTFSW Channel
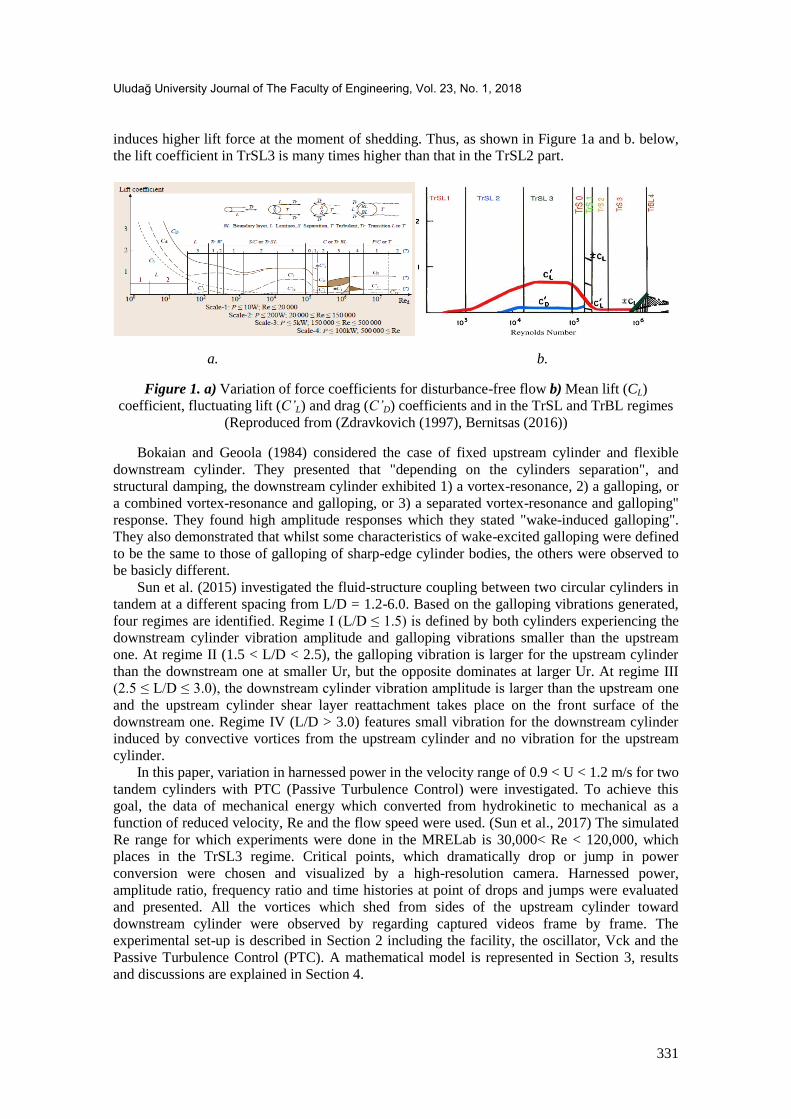
LTFSW channel of the Marine Renewable Energy Laboratory (MRElab) at the University
of Michigan was choosed for the model tests of the VIVACE Converter. The channel has the
potential to re-circulates about 37,854 liters of water at speed up to 1.4 m/s by an impeller
powered by a 20hp induction motor. The test section is 2.44 m long, 1 m wide and 1.52 m deep
and made of transparent flex-glass, thus, allowing for visualization of the VIV and galloping
characteristics. The stoppers were installed to keep safe the bottom flex-glass of the test section
from breaking by the cylinder impact. A schematic of the LTFSW Channel is shown in Figure.
2.
Figure 2. Schematic of the LTFSW channel.(Kim and Bernitsas 2016)
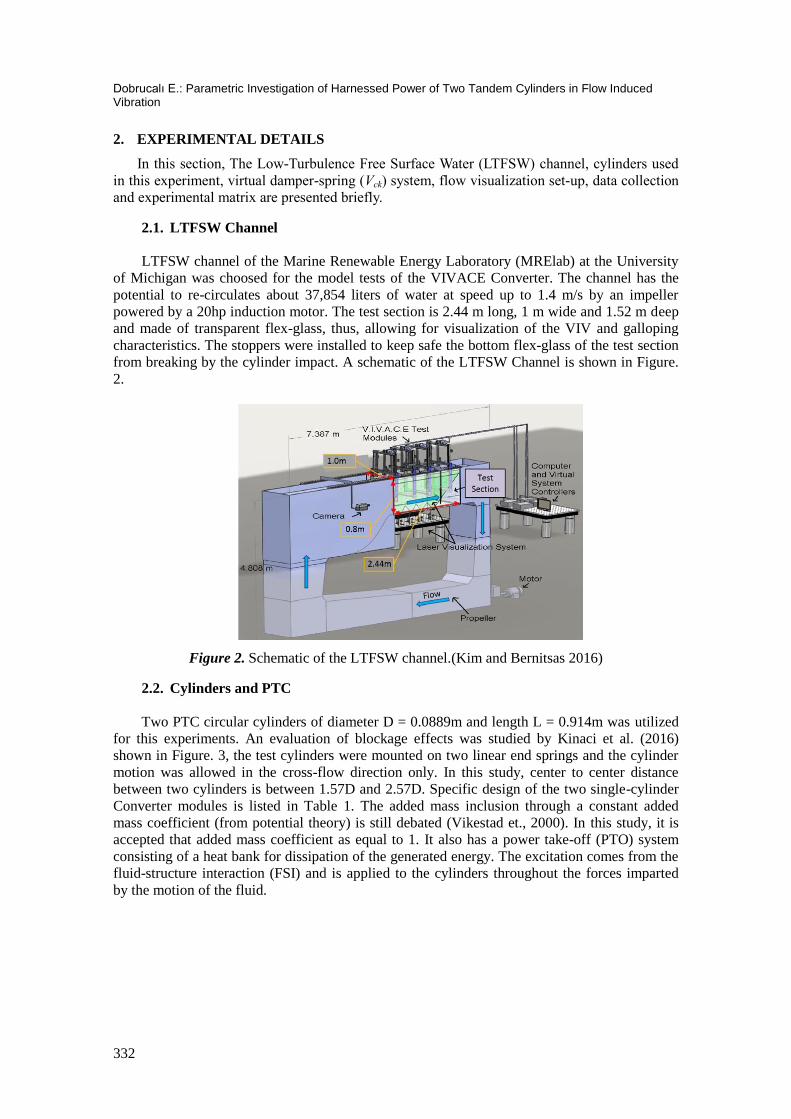
2.2. Cylinders and PTC
Two PTC circular cylinders of diameter D = 0.0889m and length L = 0.914m was utilized
for this experiments. An evaluation of blockage effects was studied by Kinaci et al. (2016)
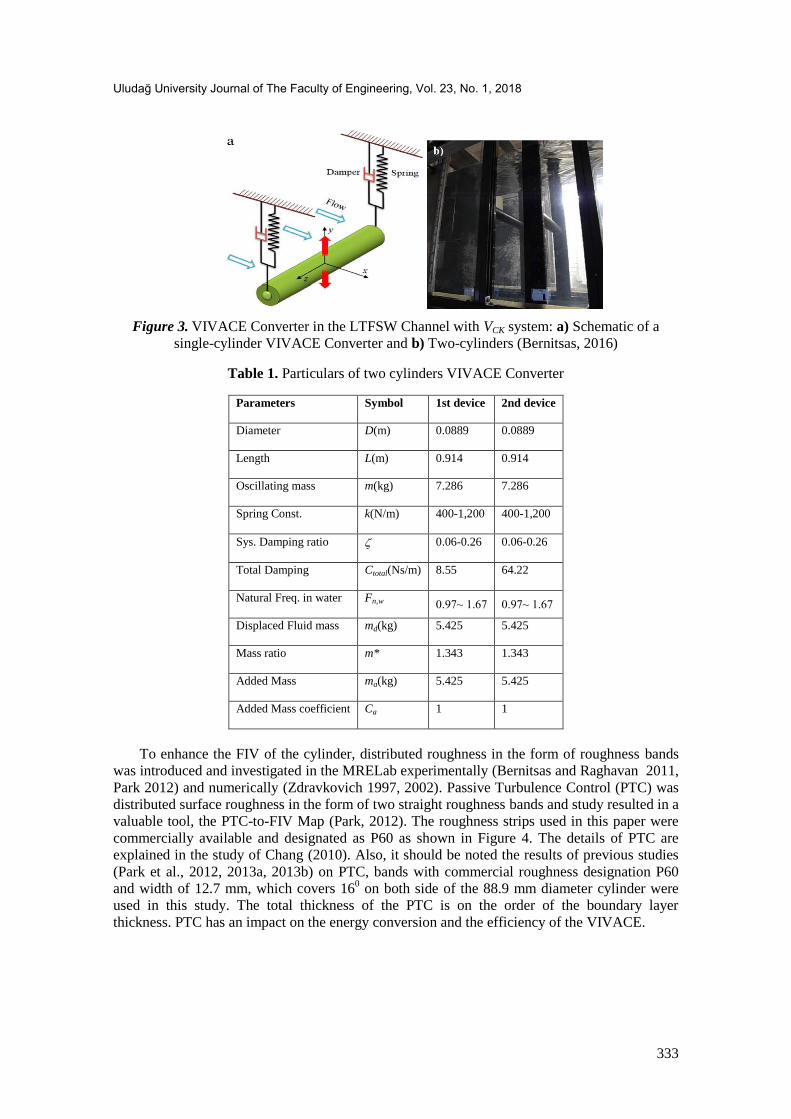
shown in Figure. 3, the test cylinders were mounted on two linear end springs and the cylinder
motion was allowed in the cross-flow direction only. In this study, center to center distance
between two cylinders is between 1.57D and 2.57D. Specific design of the two single-cylinder
Converter modules is listed in Table 1. The added mass inclusion through a constant added
mass coefficient (from potential theory) is still debated (Vikestad et., 2000). In this study, it is
accepted that added mass coefficient as equal to 1. It also has a power take-off (PTO) system
consisting of a heat bank for dissipation of the generated energy. The excitation comes from the
fluid-structure interaction (FSI) and is applied to the cylinders throughout the forces imparted
by the motion of the fluid.
Uludağ University Journal of The Faculty of Engineering, Vol. 23, No. 1, 2018
333
Figure 3. VIVACE Converter in the LTFSW Channel with VCK system: a) Schematic of a
single-cylinder VIVACE Converter and b) Two-cylinders (Bernitsas, 2016)
Table 1. Particulars of two cylinders VIVACE Converter
2nd device 1st device Symbol Parameters
0.0889 0.0889 D(m) Diameter
0.914 0.914 L(m) Length
7.286 7.286 m(kg) Oscillating mass
400-1,200 400-1,200 k(N/m) Spring Const.
0.06-0.26 0.06-0.26 Sys. Damping ratio
64.22 8.55 Ctotal(Ns/m) Total Damping
0.97~ 1.67 0.97~ 1.67 Fn,w Natural Freq. in water
5.425 5.425 md(kg) Displaced Fluid mass
1.343 1.343 m* Mass ratio
5.425 5.425 ma(kg) Added Mass
1 1 Ca Added Mass coefficient
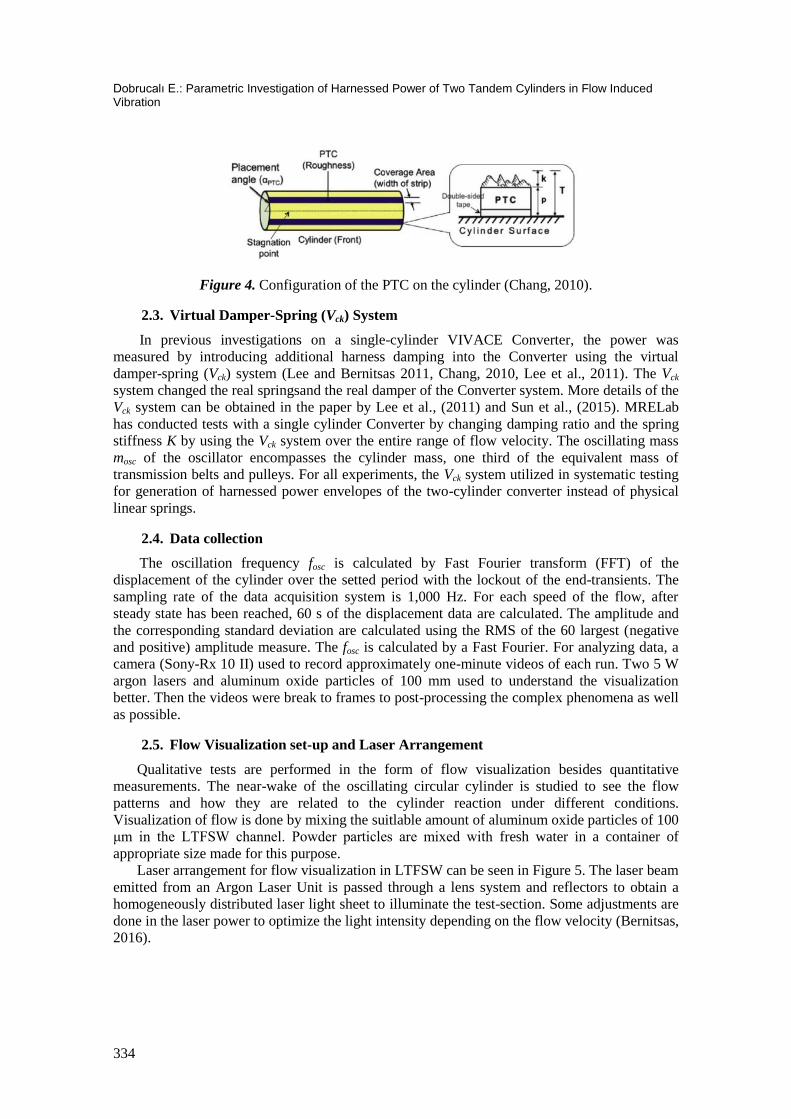
To enhance the FIV of the cylinder, distributed roughness in the form of roughness bands
was introduced and investigated in the MRELab experimentally (Bernitsas and Raghavan 2011,
Park 2012) and numerically (Zdravkovich 1997, 2002). Passive Turbulence Control (PTC) was
distributed surface roughness in the form of two straight roughness bands and study resulted in a
valuable tool, the PTC-to-FIV Map (Park, 2012). The roughness strips used in this paper were
commercially available and designated as P60 as shown in Figure 4. The details of PTC are
explained in the study of Chang (2010). Also, it should be noted the results of previous studies
(Park et al., 2012, 2013a, 2013b) on PTC, bands with commercial roughness designation P60
and width of 12.7 mm, which covers 160 on both side of the 88.9 mm diameter cylinder were
used in this study. The total thickness of the PTC is on the order of the boundary layer
thickness. PTC has an impact on the energy conversion and the efficiency of the VIVACE.
Dobrucalı E.: Parametric Investigation of Harnessed Power of Two Tandem Cylinders in Flow Induced Vibration
334
Figure 4. Configuration of the PTC on the cylinder (Chang, 2010).
2.3. Virtual Damper-Spring (Vck) System
In previous investigations on a single-cylinder VIVACE Converter, the power was
measured by introducing additional harness damping into the Converter using the virtual
damper-spring (Vck) system (Lee and Bernitsas 2011, Chang, 2010, Lee et al., 2011). The Vck
system changed the real springsand the real damper of the Converter system. More details of the
Vck system can be obtained in the paper by Lee et al., (2011) and Sun et al., (2015). MRELab
has conducted tests with a single cylinder Converter by changing damping ratio and the spring
stiffness K by using the Vck system over the entire range of flow velocity. The oscillating mass
mosc of the oscillator encompasses the cylinder mass, one third of the equivalent mass of
transmission belts and pulleys. For all experiments, the Vck system utilized in systematic testing
for generation of harnessed power envelopes of the two-cylinder converter instead of physical
linear springs.
2.4. Data collection
The oscillation frequency fosc is calculated by Fast Fourier transform (FFT) of the
displacement of the cylinder over the setted period with the lockout of the end-transients. The
sampling rate of the data acquisition system is 1,000 Hz. For each speed of the flow, after
steady state has been reached, 60 s of the displacement data are calculated. The amplitude and
the corresponding standard deviation are calculated using the RMS of the 60 largest (negative
and positive) amplitude measure. The fosc is calculated by a Fast Fourier. For analyzing data, a
camera (Sony-Rx 10 II) used to record approximately one-minute videos of each run. Two 5 W
argon lasers and aluminum oxide particles of 100 mm used to understand the visualization
better. Then the videos were break to frames to post-processing the complex phenomena as well
as possible.
2.5. Flow Visualization set-up and Laser Arrangement
Qualitative tests are performed in the form of flow visualization besides quantitative
measurements. The near-wake of the oscillating circular cylinder is studied to see the flow
patterns and how they are related to the cylinder reaction under different conditions.
Visualization of flow is done by mixing the suitlable amount of aluminum oxide particles of 100
μm in the LTFSW channel. Powder particles are mixed with fresh water in a container of
appropriate size made for this purpose.
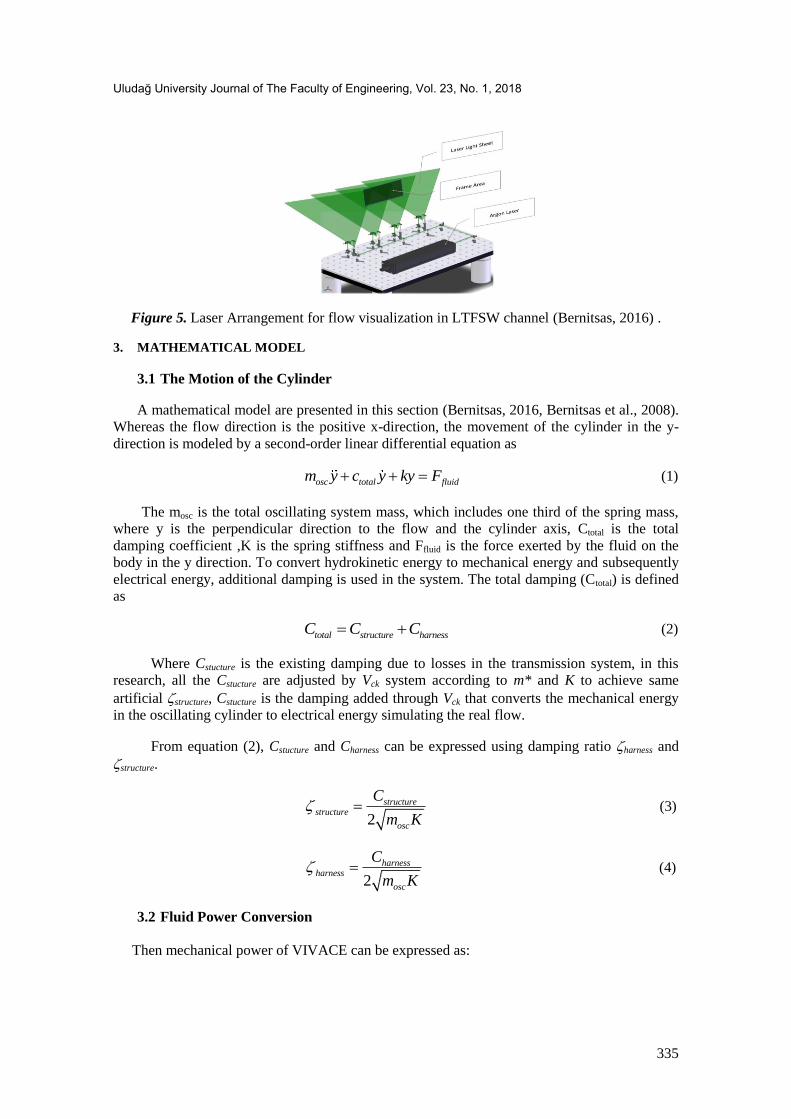
Laser arrangement for flow visualization in LTFSW can be seen in Figure 5. The laser beam
emitted from an Argon Laser Unit is passed through a lens system and reflectors to obtain a
homogeneously distributed laser light sheet to illuminate the test-section. Some adjustments are
done in the laser power to optimize the light intensity depending on the flow velocity (Bernitsas,
2016).
Uludağ University Journal of The Faculty of Engineering, Vol. 23, No. 1, 2018
335
Figure 5. Laser Arrangement for flow visualization in LTFSW channel (Bernitsas, 2016) .
3. MATHEMATICAL MODEL
3.1 The Motion of the Cylinder
A mathematical model are presented in this section (Bernitsas, 2016, Bernitsas et al., 2008).
Whereas the flow direction is the positive x-direction, the movement of the cylinder in the y-
direction is modeled by a second-order linear differential equation as
osc total fluidm y c y ky F (1)
The mosc is the total oscillating system mass, which includes one third of the spring mass,
where y is the perpendicular direction to the flow and the cylinder axis, Ctotal is the total
damping coefficient ,K is the spring stiffness and Ffluid is the force exerted by the fluid on the
body in the y direction. To convert hydrokinetic energy to mechanical energy and subsequently
electrical energy, additional damping is used in the system. The total damping (Ctotal) is defined
as
total structure harnessC C C (2)
Where Cstucture is the existing damping due to losses in the transmission system, in this
research, all the Cstucture are adjusted by Vck system according to m* and K to achieve same
artificial structure, Cstucture is the damping added through Vck that converts the mechanical energy
in the oscillating cylinder to electrical energy simulating the real flow.
From equation (2), Cstucture and Charness can be expressed using damping ratio harness and
structure.
2
structurestructure
osc
C
m K (3)
2
harnessharness
osc
C
m K (4)
3.2 Fluid Power Conversion
Then mechanical power of VIVACE can be expressed as:
Dobrucalı E.: Parametric Investigation of Harnessed Power of Two Tandem Cylinders in Flow Induced Vibration
336
2
,0
14 ( ) dt
oscT
VIVACE Mech osc a total n water
osc
P m m y fT
(5)
(6)
3 2
,8 ( ) ( )VIVACE structure osc a structure osc n waterP m m Af f
Using equation (6), we obtain the harnessed power and the dissipated power as 3 2
,8 ( ) ( )VIVACE structure osc a structure osc n waterP m m Af f (7)
2 21
2VIVACE dissipated structure odcP C A (8)
Since equations (7) and (8) appear to depend explicitly on the added mass ma, it is worth
noting that they can be recast using as follows, respectively.
2 21
2VIVACE dissipated structure oscP C A (9)
and
2 21
2VIVACE harness harness oscP C A (10)
Where, A is the amplitude of the cylinder, ωosc is the angular frequency, which can be measure
using Vck system.
4. RESULTS and DISCUSSION
In order to find the reasons for changes in harnessed power in galloping region, many
experiments were done to calculate the flow induced vibrations of two cylinders in tandem with
different parameters like spring stiffness, damping ratio, center-to-center spacing ratio (L/D) and
the mass ratio (m* = 1.343). The experimental parameters can be shown in Table 1. Absolute
flow velocity (U) was between 0.35 m/s and 1.35 m/s. Re range was 30,000 ≤ Re ≤ 120,000
which locates in the high-lift TrSL3 regime. But while evaluating the power harnessed results,
typical local drops and jumps in harnessed power were observed in the velocity range of 0.9 < U
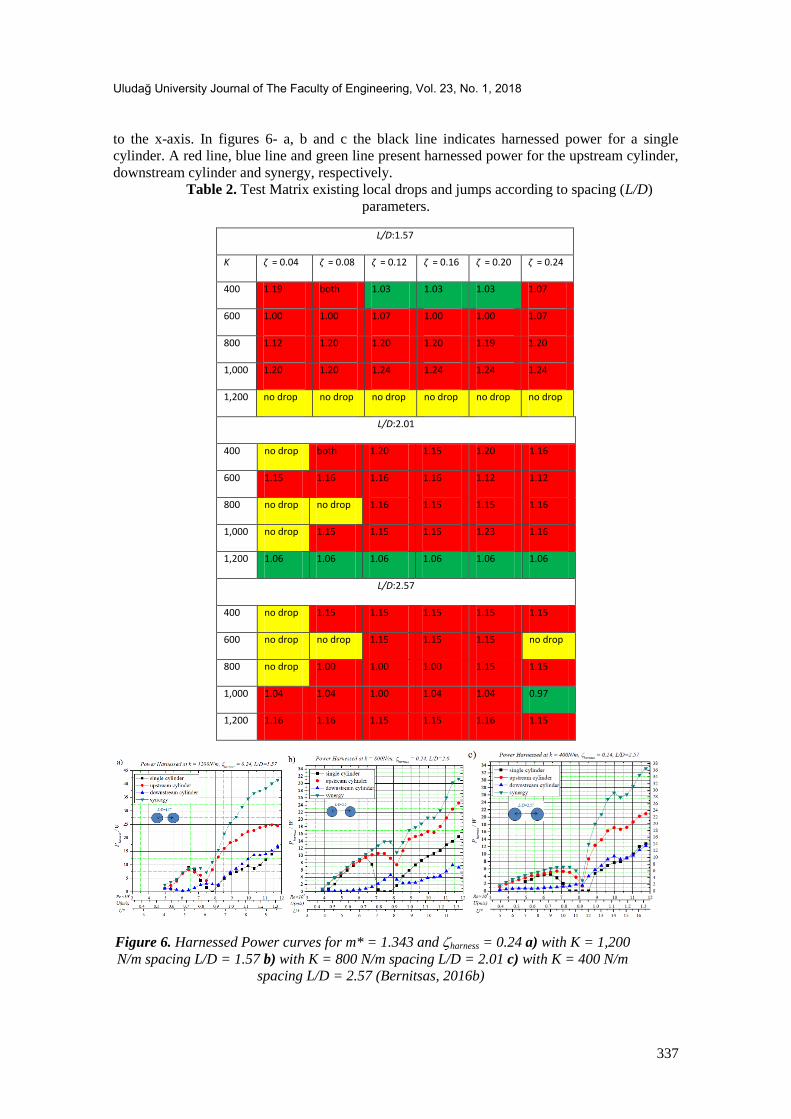
< 1.2 m/s within the galloping region. Table 2 shows the test matrix which exists these local
drops and jumps for different K, damping ratios and spacing. Red, green and yellow boxes
represent drops, jumps and no drop & jump, respectively. The numbers inside the boxes show
the absolute velocity values which occur drop or jump.
In this study, some results are selected and evaluated further to find out the reason for these
drops and jumps. To achieve this objective, the points of fluctuation in power harnessing in an
extensive set of data with spacing, damping, stiffness, and flow velocity as parameters are
identified and the harnessed power, frequency-ratio and amplitude-ratio results for both the up
and downstream cylinders are used to locate the power drop/jump points and visualization with
high-resolution camera have been used and the assumption which may affect the phenomena
were studied and presented.
As mentioned, the main goal of this study is to find out the relationship between drops or
jumps in absolute velocity range of especially 0.9 < U < 1.2 m/s and L/D = 1.57, 2.01 and 2.57,
which happens in the galloping region. As it was explained in previous part, three sets of
experiments with three different spacing and their optimum K have been chosen. Figures 6 a-b-c
show harnessed power as a function of the flow velocity. To facilitate understanding the results,
the absolute velocity and reduced velocity which are proportional to Re, are also shown parallel
Uludağ University Journal of The Faculty of Engineering, Vol. 23, No. 1, 2018
337
to the x-axis. In figures 6- a, b and c the black line indicates harnessed power for a single
cylinder. A red line, blue line and green line present harnessed power for the upstream cylinder,
downstream cylinder and synergy, respectively.
Table 2. Test Matrix existing local drops and jumps according to spacing (L/D)
parameters.
L/D:1.57
K ζ = 0.04 ζ = 0.08 ζ = 0.12 ζ = 0.16 ζ = 0.20 ζ = 0.24
400 1.19 both 1.03 1.03 1.03 1.07
600 1.00 1.00 1.07 1.00 1.00 1.07
800 1.12 1.20 1.20 1.20 1.19 1.20
1,000 1.20 1.20 1.24 1.24 1.24 1.24
1,200 no drop no drop no drop no drop no drop no drop
L/D:2.01
400 no drop both 1.20 1.15 1.20 1.16
600 1.15 1.16 1.16 1.16 1.12 1.12
800 no drop no drop 1.16 1.15 1.15 1.16
1,000 no drop 1.15 1.15 1.15 1.23 1.16
1,200 1.06 1.06 1.06 1.06 1.06 1.06
L/D:2.57
400 no drop 1.15 1.15 1.15 1.15 1.15
600 no drop no drop 1.15 1.15 1.15 no drop
800 no drop 1.00 1.00 1.00 1.15 1.15
1,000 1.04 1.04 1.00 1.04 1.04 0.97
1,200 1.16 1.16 1.15 1.15 1.16 1.15
Figure 6. Harnessed Power curves for m* = 1.343 and harness = 0.24 a) with K = 1,200
N/m spacing L/D = 1.57 b) with K = 800 N/m spacing L/D = 2.01 c) with K = 400 N/m
spacing L/D = 2.57 (Bernitsas, 2016b)
Dobrucalı E.: Parametric Investigation of Harnessed Power of Two Tandem Cylinders in Flow Induced Vibration
338
As it shows in Figure 6 for L/D = 1.57 with K = 1,200, which is the optimal K and harness
= 0.24, there are no drops in power graph for mentioned range. With increasing in L/D the drops
and jumps, immediately after, will show up. So, the hypothesis will be that with increasing
distance between two tandem cylinders, fluctuations will appear in the region of galloping and
become stronger even more with increasing in distance. It means that for small pitch ratios
(approx. 1 < L/D < 1.2–1.8 (Zdravkovich, 1987) or 1 < L/D < 2 (Zhou and Yiu, 2006),
depending on the Re range) the two cylinders behave as a single body or „„extended-body‟‟. It
can be cliamed that close spacing yields the highest harnessed power and converted power
because of the behaviour of two cylinders as a single body. The downstream sits inside the
vortex formation region of the upstream cylinder (Zhou and Yiu, 2006) and the separated shear
layers from the upstream one are forced to enclose or wrap around the downstream one, without
any reattachment onto its surface, before rolling up alternately into Kármán vortices behind the
downstream cylinder. For intermediate pitch ratios (approx. 1.2–1.8 < L/D < 3.4–3.8
(Zdravkovich, 1987) or 2 < L/D < 5 (Zhou and Yiu, 2006), depending on the range of Re, the
cylinders are placed sufficiently far apart that the shear layers from the upstream cylinder can no
longer enclose the downstream cylinder, but instead reattach onto the downstream cylinder. The
downstream sits inside the vortex formation region of the upstream cylinder (Ishigai et al.,
1972) and the separated shear layers from the upstream cylinder are forced to enclose or wrap
around the downstream cylinder, without any reattachment onto its surface, before rolling up
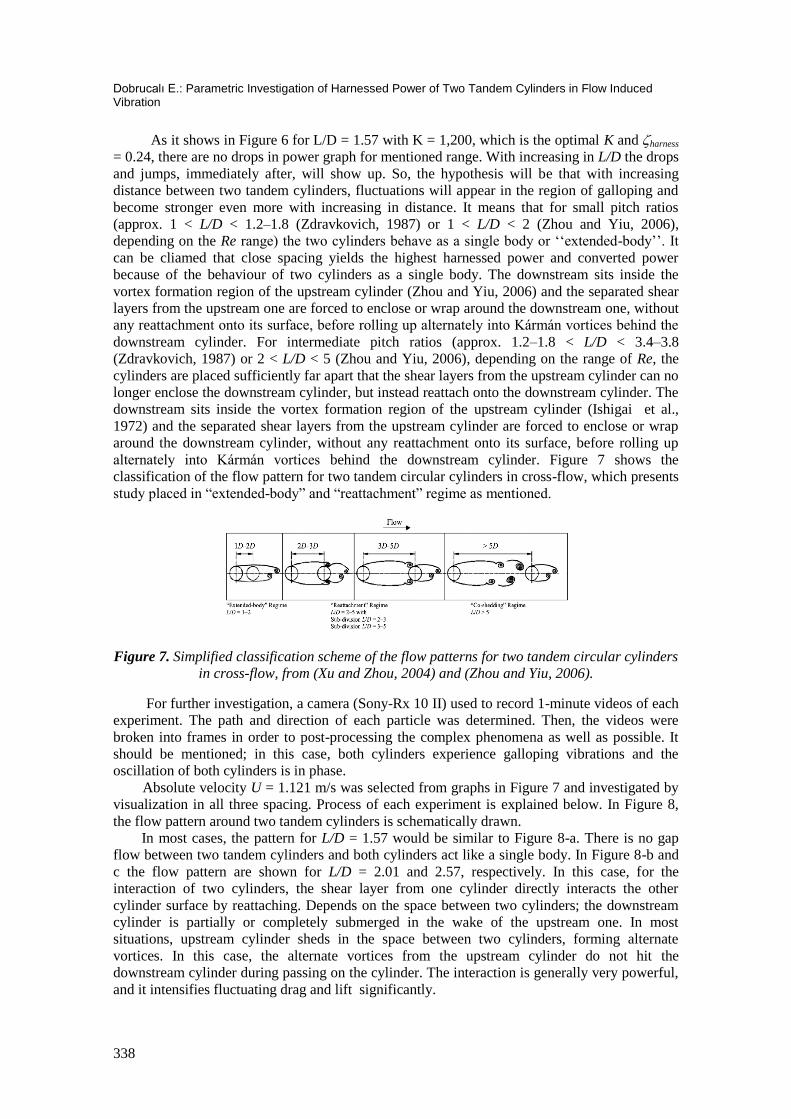
alternately into Kármán vortices behind the downstream cylinder. Figure 7 shows the
classification of the flow pattern for two tandem circular cylinders in cross-flow, which presents
study placed in “extended-body” and “reattachment” regime as mentioned.
Figure 7. Simplified classification scheme of the flow patterns for two tandem circular cylinders
in cross-flow, from (Xu and Zhou, 2004) and (Zhou and Yiu, 2006).
For further investigation, a camera (Sony-Rx 10 II) used to record 1-minute videos of each
experiment. The path and direction of each particle was determined. Then, the videos were
broken into frames in order to post-processing the complex phenomena as well as possible. It
should be mentioned; in this case, both cylinders experience galloping vibrations and the
oscillation of both cylinders is in phase.
Absolute velocity U = 1.121 m/s was selected from graphs in Figure 7 and investigated by
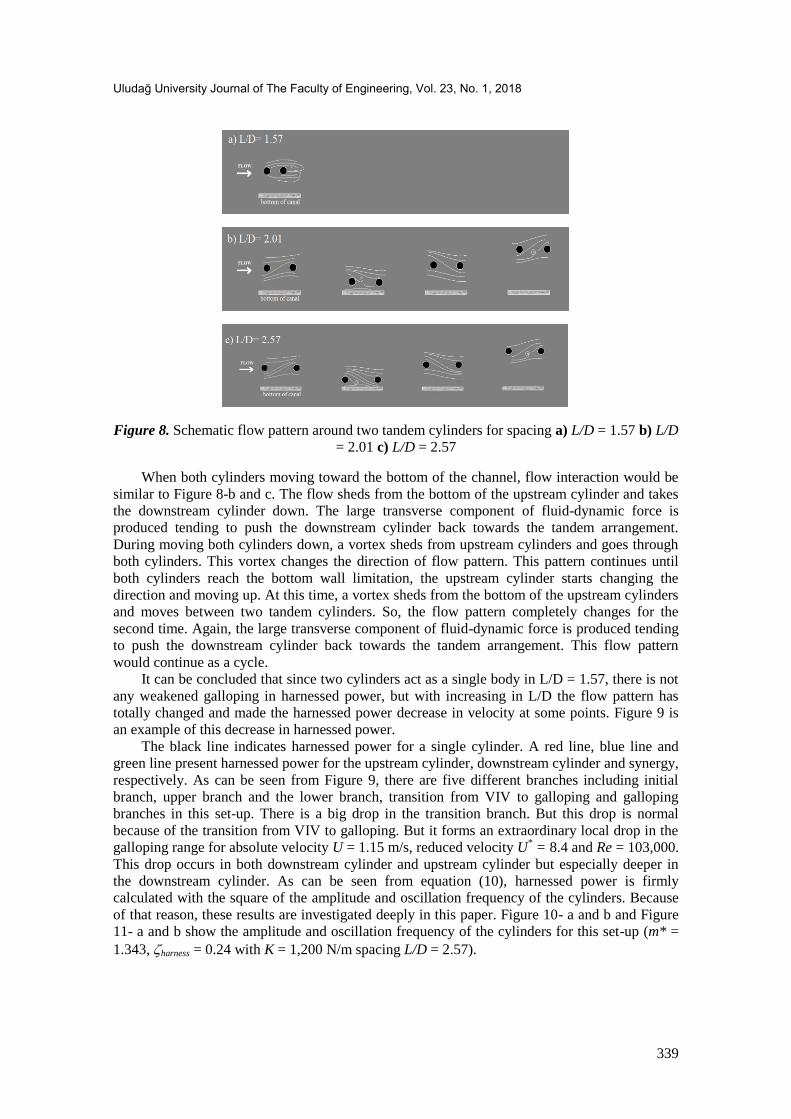
visualization in all three spacing. Process of each experiment is explained below. In Figure 8,
the flow pattern around two tandem cylinders is schematically drawn.
In most cases, the pattern for L/D = 1.57 would be similar to Figure 8-a. There is no gap
flow between two tandem cylinders and both cylinders act like a single body. In Figure 8-b and
c the flow pattern are shown for L/D = 2.01 and 2.57, respectively. In this case, for the
interaction of two cylinders, the shear layer from one cylinder directly interacts the other
cylinder surface by reattaching. Depends on the space between two cylinders; the downstream
cylinder is partially or completely submerged in the wake of the upstream one. In most
situations, upstream cylinder sheds in the space between two cylinders, forming alternate
vortices. In this case, the alternate vortices from the upstream cylinder do not hit the
downstream cylinder during passing on the cylinder. The interaction is generally very powerful,
and it intensifies fluctuating drag and lift significantly.
Uludağ University Journal of The Faculty of Engineering, Vol. 23, No. 1, 2018
339
Figure 8. Schematic flow pattern around two tandem cylinders for spacing a) L/D = 1.57 b) L/D
= 2.01 c) L/D = 2.57
When both cylinders moving toward the bottom of the channel, flow interaction would be
similar to Figure 8-b and c. The flow sheds from the bottom of the upstream cylinder and takes
the downstream cylinder down. The large transverse component of fluid-dynamic force is
produced tending to push the downstream cylinder back towards the tandem arrangement.
During moving both cylinders down, a vortex sheds from upstream cylinders and goes through
both cylinders. This vortex changes the direction of flow pattern. This pattern continues until
both cylinders reach the bottom wall limitation, the upstream cylinder starts changing the
direction and moving up. At this time, a vortex sheds from the bottom of the upstream cylinders
and moves between two tandem cylinders. So, the flow pattern completely changes for the
second time. Again, the large transverse component of fluid-dynamic force is produced tending
to push the downstream cylinder back towards the tandem arrangement. This flow pattern
would continue as a cycle.
It can be concluded that since two cylinders act as a single body in L/D = 1.57, there is not
any weakened galloping in harnessed power, but with increasing in L/D the flow pattern has
totally changed and made the harnessed power decrease in velocity at some points. Figure 9 is
an example of this decrease in harnessed power.
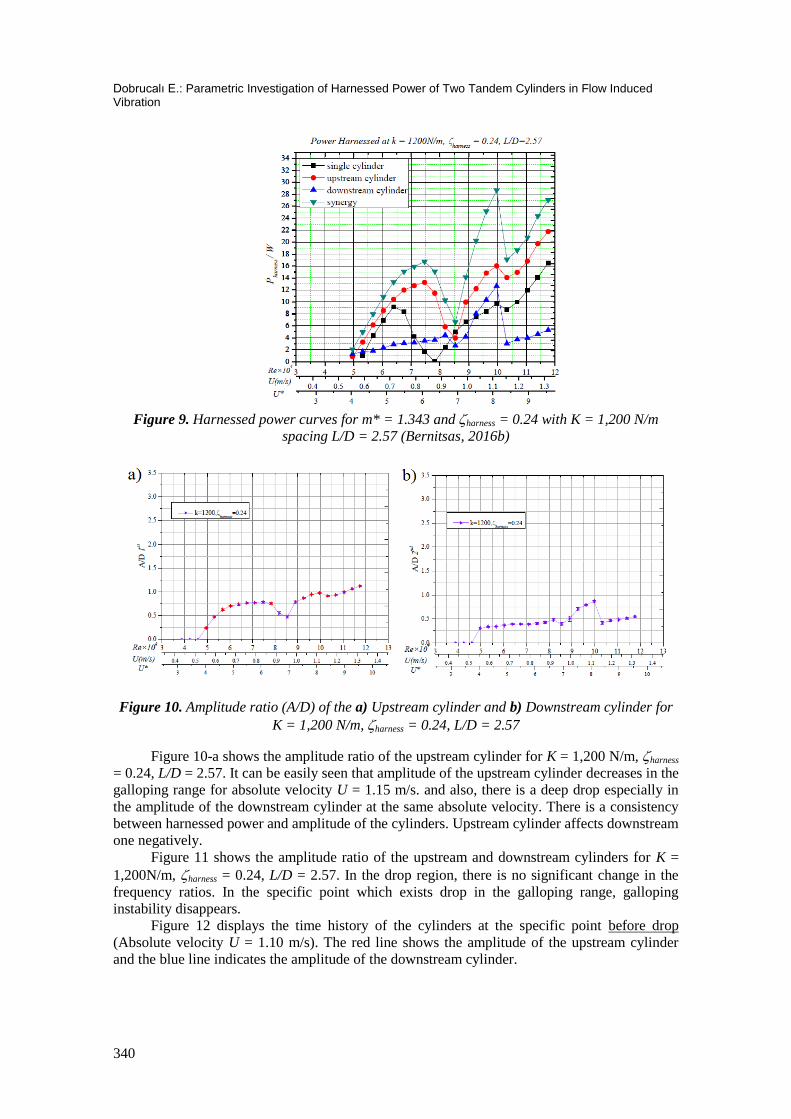
The black line indicates harnessed power for a single cylinder. A red line, blue line and
green line present harnessed power for the upstream cylinder, downstream cylinder and synergy,
respectively. As can be seen from Figure 9, there are five different branches including initial
branch, upper branch and the lower branch, transition from VIV to galloping and galloping
branches in this set-up. There is a big drop in the transition branch. But this drop is normal
because of the transition from VIV to galloping. But it forms an extraordinary local drop in the
galloping range for absolute velocity U = 1.15 m/s, reduced velocity U* = 8.4 and Re = 103,000.
This drop occurs in both downstream cylinder and upstream cylinder but especially deeper in
the downstream cylinder. As can be seen from equation (10), harnessed power is firmly
calculated with the square of the amplitude and oscillation frequency of the cylinders. Because
of that reason, these results are investigated deeply in this paper. Figure 10- a and b and Figure
11- a and b show the amplitude and oscillation frequency of the cylinders for this set-up (m* =
1.343, harness = 0.24 with K = 1,200 N/m spacing L/D = 2.57).
Dobrucalı E.: Parametric Investigation of Harnessed Power of Two Tandem Cylinders in Flow Induced Vibration
340
Figure 9. Harnessed power curves for m* = 1.343 and harness = 0.24 with K = 1,200 N/m
spacing L/D = 2.57 (Bernitsas, 2016b)
Figure 10. Amplitude ratio (A/D) of the a) Upstream cylinder and b) Downstream cylinder for
K = 1,200 N/m, harness = 0.24, L/D = 2.57
Figure 10-a shows the amplitude ratio of the upstream cylinder for K = 1,200 N/m, harness
= 0.24, L/D = 2.57. It can be easily seen that amplitude of the upstream cylinder decreases in the
galloping range for absolute velocity U = 1.15 m/s. and also, there is a deep drop especially in
the amplitude of the downstream cylinder at the same absolute velocity. There is a consistency
between harnessed power and amplitude of the cylinders. Upstream cylinder affects downstream
one negatively.
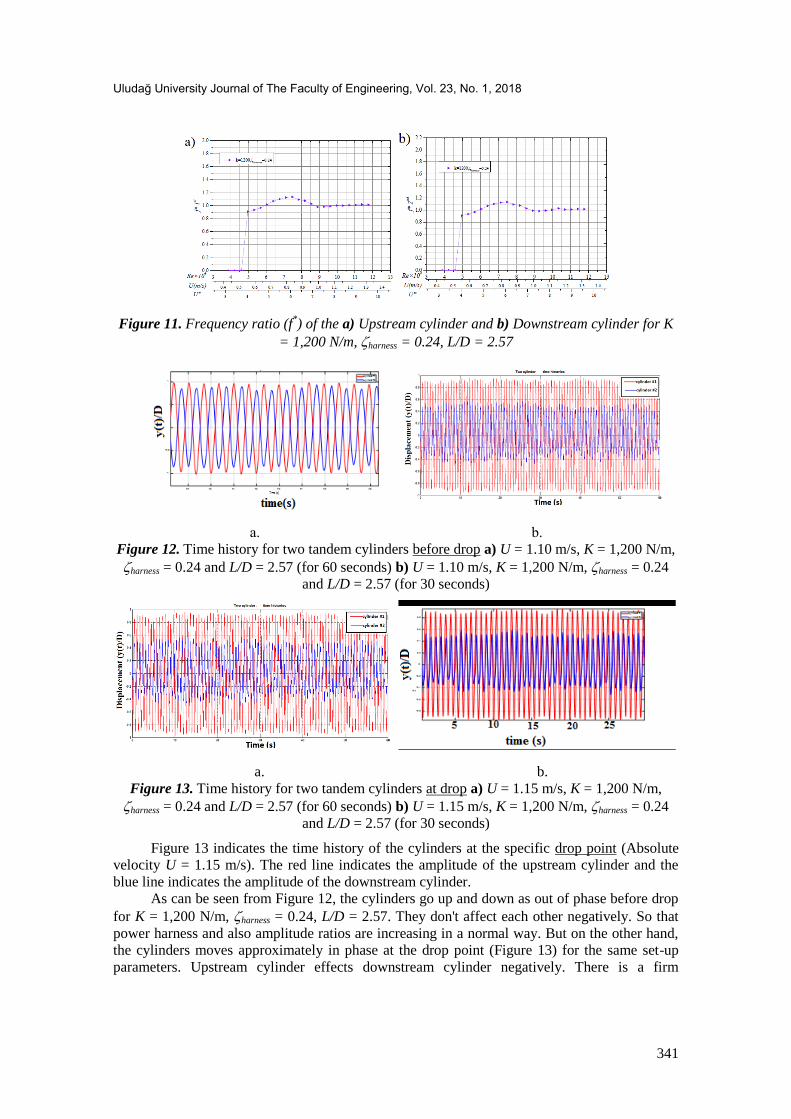
Figure 11 shows the amplitude ratio of the upstream and downstream cylinders for K =
1,200N/m, harness = 0.24, L/D = 2.57. In the drop region, there is no significant change in the
frequency ratios. In the specific point which exists drop in the galloping range, galloping
instability disappears.
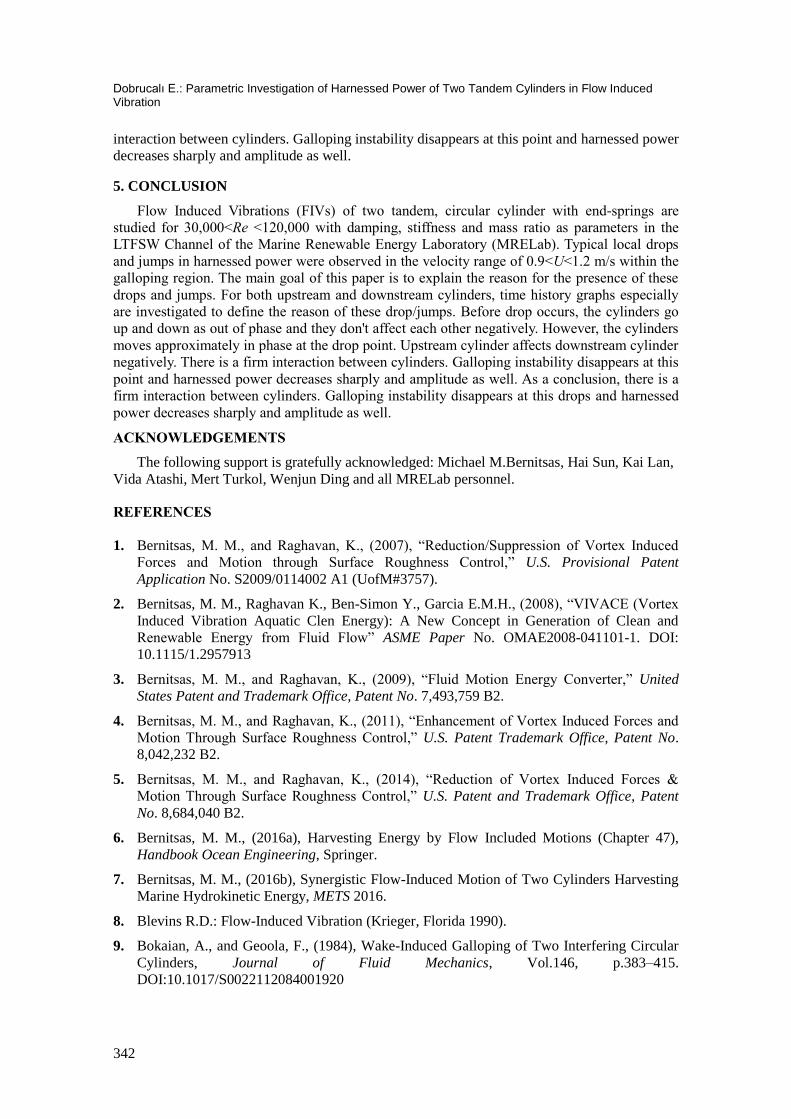
Figure 12 displays the time history of the cylinders at the specific point before drop
(Absolute velocity U = 1.10 m/s). The red line shows the amplitude of the upstream cylinder
and the blue line indicates the amplitude of the downstream cylinder.
Uludağ University Journal of The Faculty of Engineering, Vol. 23, No. 1, 2018
341
Figure 11. Frequency ratio (f*) of the a) Upstream cylinder and b) Downstream cylinder for K
= 1,200 N/m, harness = 0.24, L/D = 2.57
.b .a Figure 12. Time history for two tandem cylinders before drop a) U = 1.10 m/s, K = 1,200 N/m,
harness = 0.24 and L/D = 2.57 (for 60 seconds) b) U = 1.10 m/s, K = 1,200 N/m, harness = 0.24
and L/D = 2.57 (for 30 seconds)
a. b.
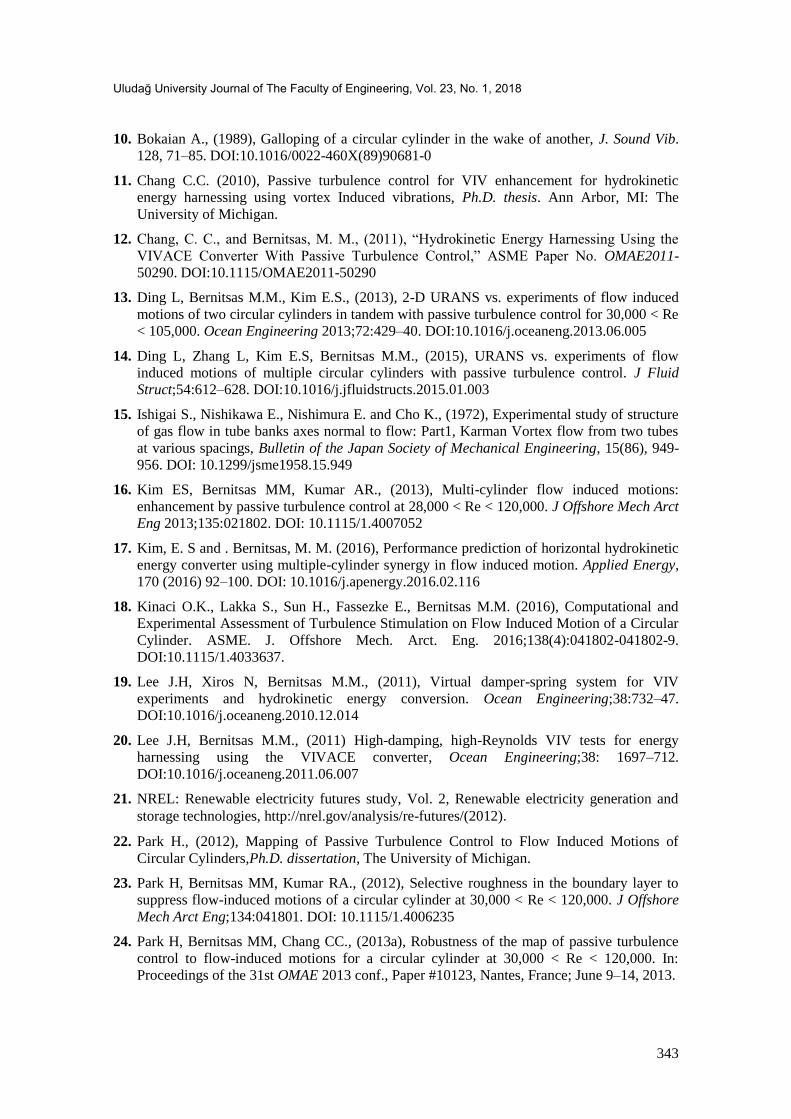
Figure 13. Time history for two tandem cylinders at drop a) U = 1.15 m/s, K = 1,200 N/m,
harness = 0.24 and L/D = 2.57 (for 60 seconds) b) U = 1.15 m/s, K = 1,200 N/m, harness = 0.24
and L/D = 2.57 (for 30 seconds)
Figure 13 indicates the time history of the cylinders at the specific drop point (Absolute
velocity U = 1.15 m/s). The red line indicates the amplitude of the upstream cylinder and the
blue line indicates the amplitude of the downstream cylinder.
As can be seen from Figure 12, the cylinders go up and down as out of phase before drop
for K = 1,200 N/m, harness = 0.24, L/D = 2.57. They don't affect each other negatively. So that
power harness and also amplitude ratios are increasing in a normal way. But on the other hand,
the cylinders moves approximately in phase at the drop point (Figure 13) for the same set-up
parameters. Upstream cylinder effects downstream cylinder negatively. There is a firm
Dobrucalı E.: Parametric Investigation of Harnessed Power of Two Tandem Cylinders in Flow Induced Vibration
342
interaction between cylinders. Galloping instability disappears at this point and harnessed power
decreases sharply and amplitude as well.
5. CONCLUSION
Flow Induced Vibrations (FIVs) of two tandem, circular cylinder with end-springs are
studied for 30,000<Re <120,000 with damping, stiffness and mass ratio as parameters in the
LTFSW Channel of the Marine Renewable Energy Laboratory (MRELab). Typical local drops
and jumps in harnessed power were observed in the velocity range of 0.9<U<1.2 m/s within the
galloping region. The main goal of this paper is to explain the reason for the presence of these
drops and jumps. For both upstream and downstream cylinders, time history graphs especially
are investigated to define the reason of these drop/jumps. Before drop occurs, the cylinders go
up and down as out of phase and they don't affect each other negatively. However, the cylinders
moves approximately in phase at the drop point. Upstream cylinder affects downstream cylinder
negatively. There is a firm interaction between cylinders. Galloping instability disappears at this
point and harnessed power decreases sharply and amplitude as well. As a conclusion, there is a
firm interaction between cylinders. Galloping instability disappears at this drops and harnessed
power decreases sharply and amplitude as well.
ACKNOWLEDGEMENTS
The following support is gratefully acknowledged: Michael M.Bernitsas, Hai Sun, Kai Lan,
Vida Atashi, Mert Turkol, Wenjun Ding and all MRELab personnel.
REFERENCES
1. Bernitsas, M. M., and Raghavan, K., (2007), “Reduction/Suppression of Vortex Induced
Forces and Motion through Surface Roughness Control,” U.S. Provisional Patent
Application No. S2009/0114002 A1 (UofM#3757).
2. Bernitsas, M. M., Raghavan K., Ben-Simon Y., Garcia E.M.H., (2008), “VIVACE (Vortex
Induced Vibration Aquatic Clen Energy): A New Concept in Generation of Clean and
Renewable Energy from Fluid Flow” ASME Paper No. OMAE2008-041101-1. DOI:
10.1115/1.2957913
3. Bernitsas, M. M., and Raghavan, K., (2009), “Fluid Motion Energy Converter,” United
States Patent and Trademark Office, Patent No. 7,493,759 B2.
4. Bernitsas, M. M., and Raghavan, K., (2011), “Enhancement of Vortex Induced Forces and
Motion Through Surface Roughness Control,” U.S. Patent Trademark Office, Patent No.
8,042,232 B2.
5. Bernitsas, M. M., and Raghavan, K., (2014), “Reduction of Vortex Induced Forces &
Motion Through Surface Roughness Control,” U.S. Patent and Trademark Office, Patent
No. 8,684,040 B2.
6. Bernitsas, M. M., (2016a), Harvesting Energy by Flow Included Motions (Chapter 47),
Handbook Ocean Engineering, Springer.
7. Bernitsas, M. M., (2016b), Synergistic Flow-Induced Motion of Two Cylinders Harvesting
Marine Hydrokinetic Energy, METS 2016.
8. Blevins R.D.: Flow-Induced Vibration (Krieger, Florida 1990).
9. Bokaian, A., and Geoola, F., (1984), Wake-Induced Galloping of Two Interfering Circular
Cylinders, Journal of Fluid Mechanics, Vol.146, p.383–415. DOI:10.1017/S0022112084001920
Uludağ University Journal of The Faculty of Engineering, Vol. 23, No. 1, 2018
343
10. Bokaian A., (1989), Galloping of a circular cylinder in the wake of another, J. Sound Vib.
128, 71–85. DOI:10.1016/0022-460X(89)90681-0
11. Chang C.C. (2010), Passive turbulence control for VIV enhancement for hydrokinetic
energy harnessing using vortex Induced vibrations, Ph.D. thesis. Ann Arbor, MI: The
University of Michigan.
12. Chang, C. C., and Bernitsas, M. M., (2011), “Hydrokinetic Energy Harnessing Using the
VIVACE Converter With Passive Turbulence Control,” ASME Paper No. OMAE2011-
50290. DOI:10.1115/OMAE2011-50290
13. Ding L, Bernitsas M.M., Kim E.S., (2013), 2-D URANS vs. experiments of flow induced
motions of two circular cylinders in tandem with passive turbulence control for 30,000 < Re
< 105,000. Ocean Engineering 2013;72:429–40. DOI:10.1016/j.oceaneng.2013.06.005
14. Ding L, Zhang L, Kim E.S, Bernitsas M.M., (2015), URANS vs. experiments of flow
induced motions of multiple circular cylinders with passive turbulence control. J Fluid
Struct;54:612–628. DOI:10.1016/j.jfluidstructs.2015.01.003
15. Ishigai S., Nishikawa E., Nishimura E. and Cho K., (1972), Experimental study of structure
of gas flow in tube banks axes normal to flow: Part1, Karman Vortex flow from two tubes
at various spacings, Bulletin of the Japan Society of Mechanical Engineering, 15(86), 949-
956. DOI: 10.1299/jsme1958.15.949
16. Kim ES, Bernitsas MM, Kumar AR., (2013), Multi-cylinder flow induced motions:
enhancement by passive turbulence control at 28,000 < Re < 120,000. J Offshore Mech Arct
Eng 2013;135:021802. DOI: 10.1115/1.4007052
17. Kim, E. S and . Bernitsas, M. M. (2016), Performance prediction of horizontal hydrokinetic
energy converter using multiple-cylinder synergy in flow induced motion. Applied Energy,
170 (2016) 92–100. DOI: 10.1016/j.apenergy.2016.02.116
18. Kinaci O.K., Lakka S., Sun H., Fassezke E., Bernitsas M.M. (2016), Computational and
Experimental Assessment of Turbulence Stimulation on Flow Induced Motion of a Circular
Cylinder. ASME. J. Offshore Mech. Arct. Eng. 2016;138(4):041802-041802-9.
DOI:10.1115/1.4033637.
19. Lee J.H, Xiros N, Bernitsas M.M., (2011), Virtual damper-spring system for VIV
experiments and hydrokinetic energy conversion. Ocean Engineering;38:732–47.
DOI:10.1016/j.oceaneng.2010.12.014
20. Lee J.H, Bernitsas M.M., (2011) High-damping, high-Reynolds VIV tests for energy
harnessing using the VIVACE converter, Ocean Engineering;38: 1697–712.
DOI:10.1016/j.oceaneng.2011.06.007
21. NREL: Renewable electricity futures study, Vol. 2, Renewable electricity generation and
storage technologies, http://nrel.gov/analysis/re-futures/(2012).
22. Park H., (2012), Mapping of Passive Turbulence Control to Flow Induced Motions of
Circular Cylinders,Ph.D. dissertation, The University of Michigan.
23. Park H, Bernitsas MM, Kumar RA., (2012), Selective roughness in the boundary layer to
suppress flow-induced motions of a circular cylinder at 30,000 < Re < 120,000. J Offshore
Mech Arct Eng;134:041801. DOI: 10.1115/1.4006235
24. Park H, Bernitsas MM, Chang CC., (2013a), Robustness of the map of passive turbulence
control to flow-induced motions for a circular cylinder at 30,000 < Re < 120,000. In:
Proceedings of the 31st OMAE 2013 conf., Paper #10123, Nantes, France; June 9–14, 2013.
Dobrucalı E.: Parametric Investigation of Harnessed Power of Two Tandem Cylinders in Flow Induced Vibration
344
25. Park H., Bernitsas M.M., Kumar R.A., (2013b), Enhancement of flow-induced motion of
rigid circular cylinder on springs by localized surface roughness at 3.0x10⁴ <Re<1.2x 10
5.
Ocean Engineering; 72:403–15. DOI:10.1016/j.oceaneng.2013.06.026
26. Park H, Bernitsas MM, Kim ES., (2013c), Selective surface roughness to suppress flow
induced motions of two circular cylinders at 30,000 < Re < 120,000, OMAE2013 10125,
June 9-14, 2013, Nantes, France.
27. Raghavan, K.,(2007), Energy Extraction From a Steady Flow Using Vortex Induced
Vibration, Ph.D. thesis, The University of Michigan, Ann Arbor, MI.
28. Richardson A.S., Martucelli J.R., Price W.S., (1965) Research study on galloping of electric
power transmission lines, Proc. 1st Int. Conf. Wind Eff. Build. Struct.'65: pp. 612–686.
29. Sun, Q., Alam, Md. M., Zhou, Y., (2015a), Fluid-Structure Coupling between Two Tandem
Elastic Cylinders, Procedia Engineering, Vol. 126, p.564-568.
DOI:10.1016/j.proeng.2015.11.306
30. Sun H, Kim E.S, Bernitsas P.M., Bernitsas M.M., (2015b), Virtual spring-damping system
for flow-induced motion experiments. J Offshore Mech Arct Eng; 137:061801.
DOI:10.1115/1.4031327
31. Sun, H., Ma, Ch., Kim, E. S., Nowakowski, G., Mauer, E., Bernitsas, M. M., (2017),
Hydrokinetic energy conversion by two rough tandem-cylinders in flow induced motions:
Effect of spacing and stiffness, Renewable Energy, 107,61-80.
DOI:10.1016/j.renene.2017.01.043
32. Unal M.F, Rockwell D., (1988), On vortex formation from a cylinder, Part 1: The initial
instability, J. Fluid Mech. 190, 491–512. DOI:10.1017/S0022112088001429
33. Wu W, Bernitsas MM, Maki K., (2011), RANS simulation vs. experiments of flow induced
motion of circular cylinder with passive turbulence control at 35,000 < Re < 130,000. In:
ASME 2011 30th International conference on ocean, offshore and arctic engineering,
Rotterdam, The Netherlands. DOI: 10.1115/1.4027895
34. Wu W., (2011), Two-dimensional RANS simulation of flow-induced motion of circular
cylinder with passive turbulence control. Ph.D. thesis, University of Michigan.
35. Xu G., Zhou Y., (2004), Strouhal numbers in the wake of two inline cylinders, Experiments
in Fluids 37, 248-256. DOI:10.1007/s00348-004-0808-0
36. Zhou Y., Yiu M.W., (2006), Flow structure, momentum and heat transport in a two tandem
cylinder wake. Journal of Fluid Mechanics 548, 17-48. DOI:10.1017/S002211200500738X
37. Zdravkovich, M.M., (1987), The effects of interference between circular cylinders in cross-
flow, Journal of Fluids and structures, 239-261. DOI:10.1016/S0889-9746(87)90355-0
38. Zdravkovich M.M.: Flow Around Circular Cylinders, Vol. 1 (Oxford Univ. Press, Oxford
1997)
39. Zdravkovich M.M.: Flow Around Circular Cylinders, Vol. 2 (Oxford Univ. Press, Oxford
2002)
40. Vikestad K., Vandiver J.K., and Larsen C.M., (2000), Added Mass and Oscillation
Frequency for a Circular Cylinder Subjected to Vortex-Induced Vibrations and External
Disturbance, J. Fluids Struct., 14(7), pp. 1071–1088. DOI:10.1006/j#s.2000.0308