paper quantifying the suitability of reference signals for ... · paper quantifying the suitability...
TRANSCRIPT
Paper
Quantifying the Suitability
of Reference Signals for the Video
Streaming Analysis for IPTV
Christian Hoppe1, Robert Manzke1, Marcus Rompf1, and Tadeus Uhl2
1 Kiel University of Applied Sciences, Kiel, Germany2 Maritime University of Szczecin, Szczecin, Poland
Abstract—IP networks are indispensable nowadays and they
are some of the most efficient platforms. The constantly grow-
ing number of users and new services in these networks –
the largest being the Internet – require a satisfactory qual-
ity of service from any application they use. So, determining
the QoS in real-time services is particularly important. This
work shows how to quantify the suitability of reference sig-
nals for analyzing the quality of video streaming in IPTV.
The assessment relies on two different algorithms: PEVQ and
VQuad-HD. Three different reference signals – two real ones
and an artificial one – are used in this study, and a numer-
ical measurement system is used, which simulates mean net-
work impairments. These measurements provide valuable in-
formation for determining the QoS of actual IPTV services in
practice.
Keywords—communication network, IPVT service, ITU-T
J.247, measurement tool, PEVQ, QoS/QoE determination,
reference signals, Triple Play Services, VQuad-HD, ITU-T
J.341.
1. Introduction
3G and Triple play networks are expanding day by day.
Their new applications and services include video tele-
phony, video conferencing, video streaming and video pod-
casts. Although networks have never been as powerful and
reliable as they are today, IPTV, mobile TV and others
call for new fixed and mobile applications. A major factor
for their increasing success will be their ability to satisfy
their customers’ high expectations while keeping down the
costs. Operators and service providers achieve this by em-
ploying new powerful technology for their setups as well as
new measurement tools that help to maintain a satisfactory
level of Quality of Experience (QoE).
One of the major uses of next-generation networks is si-
mulcast streaming (or broadcasting) of identical contents
in various formats for different applications. Also re-
ferred to as the “Triple Screen” scenario, video content
will typically be transmitted in high quality over cable or
satellite HDTV networks. Medium quality will be avail-
able over the Internet for streaming to clients on PCs and
laptops while the lowest quality will be offered on mo-
bile multimedia devices such as mobile phones, smart-
phones and tablets. Triple Screen scenarios involve many
steps of signal post-processing, including reformatting (e.g.
16:9 to 4:3), rescaling (e.g. from HD to VGA or CIF),
reframing (e.g. from 50 f/s to 25 f/s), transcoding, and
retransmission over IP-based networks. The issue for the
test engineer is to maintain the best QoE possible across
the various formats, given the system-bound limitations
of each.
Three important measurement techniques [1] are used to
assess QoE and Quality of Service (QoS). The “Full Refer-
ence Model”, the “Reduced Reference Model” and the “No
Reference Model” are shown in Fig. 1. These measurement
techniques are also to be found in standard QoE/QoS mea-
surement models, as described in [2] and [3]. The short
texts contained in Fig. 1 explain briefly the procedure used
in each of the measurement techniques and list the typical
application scenarios of each.
The Full Reference Model technique was used in conjunc-
tion with two algorithms, PEVQ (ITU-T J.247) [4] and
VQuad-HD (ITU-T J.341) [5], for the bulk of this study.
Using these algorithms means using suitable reference sig-
nals that satisfy a number of requirements not the least of
which are format and length. However, selecting suitable
reference signals is not as easy as it might at first seem, as
this paper will show.
First of all, PEVQ, the algorithm primarily used for this
study, will be explained briefly. The chief requirements on
reference signals according to international recommenda-
tions are then presented. The paper goes on to describe
the selection of suitable reference signals. The investiga-
tion’s goal is to find reference signals which, on the one
hand, fulfill the main requirements laid out in the inter-
national recommendations and, on the other hand, deliver
the best QoS/QoE values on the MOS scale. The follow-
ing Section 2 will then present the analysis architecture
and the scenarios chosen. A further Section 3 presents
graphically several examples, the analysis results, and their
interpretation. The concluding series of analyses in Sec-
tion 4 presents a comparison of the algorithms PEVQ and
VQuad-HD. The paper closes with a summary and an out-
look on future areas of study in Section 5.
29

Christian Hoppe, Robert Manzke, Marcus Rompf, and Tadeus Uhl
Doublestimulus
Singlestimulus
Evaluation model Application scenarios Accuracy
Laboratorybenchmarks
Verify quality ofdelivered content
Assess quality ofcodec/serverperformance
Broadcast loopbacktest
High
Low
Full Reference (FR) model
Evaluation of video quality by means of a comparison between a source videoand a processed video.
Reduce Reference (RR) model
Evaluation of video quality using both a processed video and a small amount ofinformation extracted from a source video.
No Reference (NR) model
Evaluation of video quality on the basis on processed video alone.
Source video
Source video
Source video
Encoder
Encoder
Encoder
Network
Network
Network
Decoder
Decoder
Decoder
Test video
Test video
Test video
Measuring device
Measuring device
Measuring device
Featureextraction
Benchmarksbetween remotelocations
Assess networkquality
Assess quality atreceived side
Continuous qualitymonitoring
Continuous qualitymonitoring
Fig. 1. Overview of QoE/QoS measurement techniques. (See color pictures online at www.nit.eu/publications/journal-jtit)
2. The PEVQ Algorithm
PEVQ is designed to predict the effects of transmission
impairments on the video quality as perceived by a test
person. Its main application areas are mobile multimedia
applications and IPTV. It fulfills the ITU-T Recommenda-
tion J.247 [4] for full reference quality measurements. The
key features of PEVQ (Fig. 2):
• temporal alignment of the input sequences based on
multi-dimensional feature correlation analysis with
limits that reach far beyond those tested by the Video
Quality Experts Group (VQEG), especially with re-
gard to the amount of time clipping, frame freezing
and frame skipping which can be handled;
• full frame spatial alignment;
• color alignment algorithm based on cumulative his-
tograms;
• enhanced frame rate estimation and rating;
• detection and perceptually compliant weighting of
frame freezes and frame skips;
• only four indicators are used to detect the video
quality. Those indicators operate in different do-
mains (temporal, spatial, chrominance) and are mo-
tivated by the Human Visual System (HVS). Percep-
tual masking properties of the HVS are modeled at
several stages of the algorithm. These indicators are
integrated using a sophisticated spatial and temporal
integration algorithm.
Apart from the MOS value, which is the ultimate yardstick
of quality, PEVQ offers several other indicators that are
used to analyse the reasons for quality impairments such
as:
• distortion,
• delay,
30

Quantifying the Suitability of Reference Signals for the Video Streaming Analysis for IPTV
Temporaland spatialalignment
Distortionclassification
Perceptualdifference(Y, Cr, Cb)
-
Distortionindicator
integration
+
Y
Cr
Cb
Time
Time
Temporal indicators
PEVQ Score
Indicatorsfor causeanalysis
Reference signal
Impaired signal
Fig. 2. Sequence diagram of PEVQ score calculation.
• luminance,
• contrast,
• peak signal to noise ratio,
• jerking,
• blurring,
• block constriction,
• frame freezing and frame skipping,
• effective picture rate,
• time and areal activity.
The PEVQ algorithm is the tool used for the bulk of the
analyses described in this paper. For the sake of compar-
ison a second algorithm, VQuad-HD, is introduced. The
two algorithms necessitate the use of specifically formatted
reference signals. That is the theme of the next chapter.
3. Requirements on Reference Signals
Many factors need to be taken into consideration when se-
lecting reference signals. These factors can be found in the
ITU-T Tutorial [6] and in publications of the VQEG [7].
The video format requirements and recommendations of
the algorithms and tools used state that the best results will
be obtained if the reference file is an uncompressed AVI
(Audio Video Interleaving) file in the YUV 4:2:0 color
space. A short video sequence of around 10 s is ideal
since the algorithms would take far too long to process
longer sequences whilst the influence of network impair-
ments in shorter sequences would hardly coax sufficiently
meaningful responses from the algorithms. In Europe full
HD videos are usually in 1080i50, which means a resolu-
tion of 1920×1080 pixels at 25 full frames per second are
ideal parameters for the reference signals. The reference
signals should of course be free from distortions, errors
and coding artifacts to preclude influences above and be-
yond network impairments.
The sequences selected for the comparison described here
differ with regard to spatial details, motion and color in-
tensity. A selection of reference files can be found in the
consumer digital video library [8] or from the license hold-
ers of the two measurement algorithms (Opticom [9] and
SwissQual [10]).
Fig. 3. Sunflower images (name: Sunflower) [9].
Fig. 4. Tractor images (name: Tractor) [9].
Fig. 5. Videotoms images (name: Artificial) [11].
31
Christian Hoppe, Robert Manzke, Marcus Rompf, and Tadeus Uhl
Reference Encoder Packetizer Error() Decoder Analyser
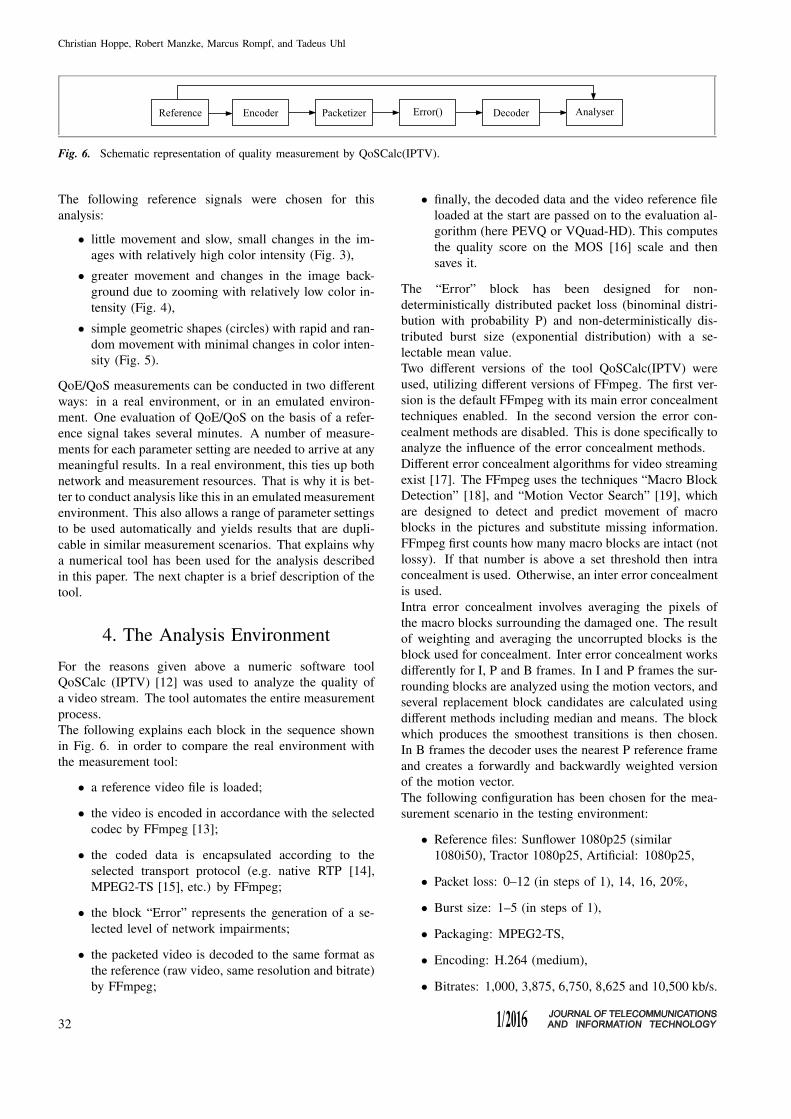
Fig. 6. Schematic representation of quality measurement by QoSCalc(IPTV).
The following reference signals were chosen for this
analysis:
• little movement and slow, small changes in the im-
ages with relatively high color intensity (Fig. 3),
• greater movement and changes in the image back-
ground due to zooming with relatively low color in-
tensity (Fig. 4),
• simple geometric shapes (circles) with rapid and ran-
dom movement with minimal changes in color inten-
sity (Fig. 5).
QoE/QoS measurements can be conducted in two different
ways: in a real environment, or in an emulated environ-
ment. One evaluation of QoE/QoS on the basis of a refer-
ence signal takes several minutes. A number of measure-
ments for each parameter setting are needed to arrive at any
meaningful results. In a real environment, this ties up both
network and measurement resources. That is why it is bet-
ter to conduct analysis like this in an emulated measurement
environment. This also allows a range of parameter settings
to be used automatically and yields results that are dupli-
cable in similar measurement scenarios. That explains why
a numerical tool has been used for the analysis described
in this paper. The next chapter is a brief description of the
tool.
4. The Analysis Environment
For the reasons given above a numeric software tool
QoSCalc (IPTV) [12] was used to analyze the quality of
a video stream. The tool automates the entire measurement
process.
The following explains each block in the sequence shown
in Fig. 6. in order to compare the real environment with
the measurement tool:
• a reference video file is loaded;
• the video is encoded in accordance with the selected
codec by FFmpeg [13];
• the coded data is encapsulated according to the
selected transport protocol (e.g. native RTP [14],
MPEG2-TS [15], etc.) by FFmpeg;
• the block “Error” represents the generation of a se-
lected level of network impairments;
• the packeted video is decoded to the same format as
the reference (raw video, same resolution and bitrate)
by FFmpeg;
• finally, the decoded data and the video reference file
loaded at the start are passed on to the evaluation al-
gorithm (here PEVQ or VQuad-HD). This computes
the quality score on the MOS [16] scale and then
saves it.
The “Error” block has been designed for non-
deterministically distributed packet loss (binominal distri-
bution with probability P) and non-deterministically dis-
tributed burst size (exponential distribution) with a se-
lectable mean value.
Two different versions of the tool QoSCalc(IPTV) were
used, utilizing different versions of FFmpeg. The first ver-
sion is the default FFmpeg with its main error concealment
techniques enabled. In the second version the error con-
cealment methods are disabled. This is done specifically to
analyze the influence of the error concealment methods.
Different error concealment algorithms for video streaming
exist [17]. The FFmpeg uses the techniques “Macro Block
Detection” [18], and “Motion Vector Search” [19], which
are designed to detect and predict movement of macro
blocks in the pictures and substitute missing information.
FFmpeg first counts how many macro blocks are intact (not
lossy). If that number is above a set threshold then intra
concealment is used. Otherwise, an inter error concealment
is used.
Intra error concealment involves averaging the pixels of
the macro blocks surrounding the damaged one. The result
of weighting and averaging the uncorrupted blocks is the
block used for concealment. Inter error concealment works
differently for I, P and B frames. In I and P frames the sur-
rounding blocks are analyzed using the motion vectors, and
several replacement block candidates are calculated using
different methods including median and means. The block
which produces the smoothest transitions is then chosen.
In B frames the decoder uses the nearest P reference frame
and creates a forwardly and backwardly weighted version
of the motion vector.
The following configuration has been chosen for the mea-
surement scenario in the testing environment:
• Reference files: Sunflower 1080p25 (similar
1080i50), Tractor 1080p25, Artificial: 1080p25,
• Packet loss: 0–12 (in steps of 1), 14, 16, 20%,
• Burst size: 1–5 (in steps of 1),
• Packaging: MPEG2-TS,
• Encoding: H.264 (medium),
• Bitrates: 1,000, 3,875, 6,750, 8,625 and 10,500 kb/s.
32

Quantifying the Suitability of Reference Signals for the Video Streaming Analysis for IPTV
Using the numerical tool described above several analysis
were conducted over several days for each scenario. The
most significant results of the measurement scenario are
presented and interpreted in the following section.
5. Quantitative Comparison of the
Reference Signals
First of all it is necessary to describe the expectations which
might be had. Due to network impairments, in this case
packet loss, the expectation is that higher packet loss would
result in a lower MOS value. Regarding the video content
at one test point, e.g. 1% packet loss, and assuming that at
this test point information is missing in scenes with a large
degree of motion or rapid changes in color intensity the
expectation would be a lower MOS value.
Given the nature of the test results from the configuration
described in Section 4 a representations of the following
configurations have been selected:
• Reference files: Sunflower.avi, Tractor.avi and Arti-
ficial.avi video content,
• Packet loss: 0–12 (in steps of 1), 14, 16, 20%,
• Burst size: 1 and 2,
• Packaging: MPEG2-TS,
• Encoding: H.264 (medium),
• Bitrates: 3,875 kb/s and 10,500 kb/s,
• Evaluation algorithm: PEVQ.
Figures 7–10 represent the results, starting with 3,875 kb/s
and burst size 1.
5.0
4.0
3.0
2.0
1.0
00 1 2 3 4 5 6 7 8 9 10 11 12 14 16 20
Packet loss [%]
MO
S v
alu
e
Sunflower
Tractor
Artificial
Fig. 7. Comparison of all three reference signals at 3,875 kb/s
and burst size 1.
From these results, it is obvious that the MOS values for
all bit rates and bursts are very close to each other. These
results differ widely from the expectations, which led to
two assumptions: either the video content does not affect
the MOS value at all, or the functionality of FFmpeg de-
coding techniques is fully able to cope, or both. So the
FFmpeg decoding techniques had to be examined in greater
depth.
Two techniques, called “Macro Block Detection” and “Mo-
tion Vector Search”, are used to conceal errors. They
5.0
4.0
3.0
2.0
1.0
00 1 2 3 4 5 6 7 8 9 10 11 12 14 16 19
Packet loss [%]
MO
S v
alue
Sunflower
Tractor
Artificial
Fig. 8. Comparison of all three reference signals at 10,500 kb/s
and burst size 1.
5.0
4.0
3.0
2.0
1.0
00 1 2 3 4 5 6 7 8 9 10 11 12 14 16 20
Packet loss [%]
MO
S v
alu
e
Sunflower
Tractor
Artificial
Fig. 9. Comparison of all three reference signals at 3,875 kb/s
and burst size 2.
5.0
4.0
3.0
2.0
1.0
00 1 2 3 4 5 6 7 8 9 10 11 12 14 16 19
Packet loss [%]
MO
S v
alu
e
Sunflower
Tractor
Artificial
Fig. 10. Comparison of all three reference signals at 10,500 kb/s
and burst size 2.
obviously do a good job. They were the subject of the next
series of tests with the expectation being a lower MOS
value when error concealment techniques are disabled.
Figures 11–14 represent the results; they include the repre-
sentation to allow a comparison of the Tractor.avi reference
signal with and without error concealment.
In conclusion, it can be said that the expectation was jus-
tified, at least as far as lower packet losses as the network
impairment are concerned. When error concealment is en-
abled, the MOS value is indeed higher. With regard to the
second point of intersection of all diagrams and curves the
following observations can be made:
33

Christian Hoppe, Robert Manzke, Marcus Rompf, and Tadeus Uhl
Tractor EC off
Tractor EC on
5.0
4.0
3.0
2.0
1.0
00 1 2 3 4 5 6 7 8 9 10 11 12 14 16 20
Packet loss [%]
MO
S v
alu
e
Fig. 11. Comparison Tractor with and without EC at 3,875 kb/s
and burst size 1.
5.0
4.0
3.0
2.0
1.0
00 1 2 3 4 5 6 7 8 9 10 11 12 14 15 21
Packet loss [%]
MO
S v
alu
e
Tractor EC off
Tractor EC on
Fig. 12. Comparison Tractor with and without EC at 10,500 kb/s
and burst 1.
Tractor EC off
Tractor EC on
5.0
4.0
3.0
2.0
1.0
00 1 2 3 4 5 6 7 8 9 10 11 12 14 16 20
Packet loss [%]
MO
S v
alu
e
Fig. 13. Comparison Tractor with and without EC at 3,875 kb/s
and burst size 2.
First, at some points with high packet losses, the MOS
value obtained when error concealment is disabled is actu-
ally higher than that obtained when it is enabled. The video
quality, with a MOS value of less than 2, is really poor
nonetheless. The reason for that could be that these tech-
niques substitute wrong video content. In severely lossy
networks it might be better to disable error concealment
techniques.
Second, the second point of intersection of both curves can
be shifted in the direction of higher packet loss by increas-
ing either the bit rate or the burstiness, so that the resulting
higher MOS value, with error concealment enabled, would
lead to improved video quality. These observations could
5.0
4.0
3.0
2.0
1.0
00 1 2 3 4 5 6 7 8 9 10 11 12 14 16 19
Packet loss [%]
MO
S v
alu
e
Tractor EC off
Tractor EC on
Fig. 14. Comparison Tractor with and without EC at 10,500 kb/s
and burst size 2.
lead to useful implementations which improve video qual-
ity by artificially increasing network burstiness, which is
already present anyway, whenever packet losses occur.
As far as reliability is concerned Figs. 15–16 represent re-
sults using both PEVQ (ITU-T J.247 [4]) and VQuad-HD
(ITU-T J.341 [5]) prediction algorithms for video content
of the reference signals Tractor.avi and Artificial.avi, the
expectation being that these algorithms should yield only
slightly differing respective MOS values.
J.341 - Tractor
PEVQ - Tractor
5.0
4.0
3.0
2.0
1.0
00 1 2 3 4 5 6 7 8 9 10 11 12 13 16 20
Packet loss [%]
MO
S v
alu
e
Fig. 15. Comparison of J.341 and PEVQ for Tractor at
10,500 kb/s and burst size 2, with EC.
J.341 - Artificial
PEVQ - Artificial
5.0
4.0
3.0
2.0
1.0
00 1 2 3 4 5 6 7 8 9 10 11 12 13 16 20
Packet loss [%]
MO
S v
alu
e
Fig. 16. Comparison of J.341 and PEVQ for Artificial at
10,500 kb/s and burst size 2, with EC.
Again, it can be said that the expectation was justified,
which leads to the following two final conclusions. First,
both algorithms are suitable for the perceptual evaluation
34

Quantifying the Suitability of Reference Signals for the Video Streaming Analysis for IPTV
and measurement of HD video quality and second, artificial
video content is suitable as a reference signal: its use leads
to simpler realization of initial scenario criteria.
6. Summary and Outlook
This paper has assessed the suitability of video reference
signals for the PEVQ (ITU-T J.247) and the VQuad-HD
(ITU-T J.341) algorithms for evaluating the video quality
in IPTV. To that end numerical software tool was used that
had been developed previously on the basis of FFmpeg to
provide encoding, packaging, degrading (packet loss, burst)
and decoding techniques. Both algorithms are full reference
models, that is: they necessitate the use of two signals –
the original signal on the one hand, and a degraded signal
on the other. Research on the topic of suitability has shown
that there are recommendations regarding the composition
of reference files with regard to, for example, changes in
movement, color and luminescence. Accordingly, two refer-
ence files provided by “Opticom” and one provided by [11]
were selected and the analysis environment was set up to
implement the files and initiate the measurements. The re-
sults obtained for the video quality under evaluation differed
from the expectations, one of them having been, for exam-
ple, better video quality for the reference file that contained
less movement when video content information loss occurs.
There were, however, hardly any differences. That led di-
rectly to an investigation of FFmpeg’s “Decoder”, which
showed that the existing error concealment techniques pro-
vide very good functionality in repairing and concealing
issues. Nevertheless, as was expected, increasing packet
loss caused an exponential decrease in the resulting MOS
value for the video quality of a reference file examined in
isolation. One surprising result must be spotlighted: the
“artificial” signal Artificial.avi proved to be just as suitable
for use in QoE/QoS measurements as the very complex
reference signals recommended by the license holder Opti-
com [9]. Further analysis, which cannot be described here
owing to lack of space, confirm the good functionally of
the EC techniques implemented in FFmpeg.
The results obtained in the course of the work described
here could serve as a basis on which to develop parameter-
ized QoE/QoS models, that are widely known to be sim-
ple and easy to implement in practice, yet provide reliable
meaning results. It is therefore very worthwhile develop-
ing such QoE/QoS models. Further work in this direction
is already being planned.
References
[1] Network Technology Laboratories, Objective Video Quality Assess-
ment Methods [Online]. Available: http://www.ntt.co.jp/qos/qoe/
eng/technology/visual/02 3.html (accessed Nov. 2015).
[2] A. Raake, Speech Quality of VoIP. Chichester: Wiley, 2006.
[3] T. Uhl, “E-model and PESQ in the VoIP environment: A compar-
ison study”, in Proc. 5th Polish-German Teletraffic Symp., Berlin,
Germany, 2008, pp. 207–216.
[4] ITU-T Recommendation J.247: Objective perceptual multimedia
video quality measurement in the presence of a full reference [On-
line]. Available: http://www.itu.int/rec/T-REC-J.247-200808-I (ac-
cessed Nov. 2015)
[5] ITU-T Recommendation J.341: Objective perceptual multimedia
video quality measurement of HDTV for digital cable television in
the presence of a full reference [Online]. Available:
http://www.itu.int/rec/T-REC-J.341-201101-I/en (accesed
Nov. 2015).
[6] ITU-T Tutorial, Objective perceptual assessment of video quality:
Full reference television [Online]. Available:
http://www.itu.int/ITU-T/studygroups/com09/docs/tutorial opavc.pdf
(accesed Nov. 2015).
[7] Video Quality Experts Group (VQEG), HDTV quality determination
[Online]. Available: http://www.its.bldrdoc.gov/vqeg/projects/hdtv/
hdtv.aspx (accessed Jul. 2015)
[8] The consumer digital video library, reference file collection [Online].
Available: http://www.cdvl.org/login.php (accesed Nov. 2015).
[9] Company Opticom website [Online]. Available:
http://www.opticom.de (accesed Nov. 2015).
[10] Company SwissQual AG – A Rohde & Schwarz Company [Online].
Available: http://www.swissqual.com (accesed Nov. 2015).
[11] Videotoms samples [Online]. Available: https://drive.google.com/
folderview?id=0B4qqvf83yCxtTHBWZGtZd3R6Y2M&usp=sharing
(accesed Nov. 2015).
[12] T. Uhl and H. Jürgensen, “New tool for examining QoS in the IPTV
service”, in Proc. World Telecommun. Congr. WTC 2014, Berlin,
Germany, 2014.
[13] Zeranoe FFmpeg software (current Windows builds) [Online]. Avail-
able: http://FFmpeg.zeranoe.com/builds (accesed Nov. 2015).
[14] S. Wenger, M. Hannuksela, T. Stockhammer, M. Westerlund, and
D. Singer, “RTP Payload Format for H.264 Video”, RFC 3984, Feb.
2005.
[15] MPEG-2 Transport Stream, Electronics Research Group (ERG) [On-
line]. Available: http://erg.abdn.ac.uk/research/future-net/
digital-video/mpeg2-trans.html (accesed Nov. 2015).
[16] ITU-T Recommendation P.800: MOS-Scale [Online]. Available:
http://www.itu.int/T-REC-P.800/en (accesed Nov. 2015).
[17] M. J. Bustamante, “Comparison of algorithms for concealing packet
losses in the transmission of compressed video”, Master Thesis, Uni-
versity of California, San Diego, CA, USA, 2010.
[18] FFmpeg, Macroblocks and Motion Vectors [Online]. Available:
https://trac.FFmpeg.org/wiki/Debug/MacroblocksAndMotionVectors
(accesed Nov. 2015).
[19] D. Marshall, “Motion vector search” [Online]. Available:
https://www.cs.cf.ac.uk/Dave/Multimedia/node252.html
(accesed Nov. 2015).
Christian Hoppe received
his B.Eng. in Communications
Technology from the Flensburg
University of Applied Sciences
(Germany) in 2010. Today he
is student for Master’s degree
in Information Technology at
Kiel University of Applied
Sciences (Germany). His main
activities cover the following
areas: quality assurance for
Triple Play Services and medical imaging solutions.
E-mail: [email protected]
Kiel University of Applied Sciences
Grenzstraße 5
D 24149 Kiel, Germany
35

Christian Hoppe, Robert Manzke, Marcus Rompf, and Tadeus Uhl
Robert Manzke received his
M.Sc. in Electrical Engineering
from Kiel University of Applied
Sciences, Germany in 2001. He
finished his Ph.D. at King’s
College London, University of
London, UK in 2004 working
on image reconstruction algo-
rithms. Subsequently, he gath-
ered multiple years of indus-
trial experience with Philips Re-
search in the field of interventional guidance techniques in
medicine with focus on real-time data visualization. He
authored about 80 publications, 2 book chapters and over
60 patents. In 2012 he joined the Faculty of Computer
Science and Electrical Engineering at Kiel University of
Applied Sciences as tenured Professor with focus on ubiq-
uitous and mobile computing and is currently the managing
director of the Institute of Applied Computer Science.
E-mail: [email protected]
Kiel University of Applied Sciences
Grenzstraße 5
D 24149 Kiel, Germany
Marcus Rompf received his
B.Eng. in Computer Engi-
neering from the Flensburg
University of Applied Sciences
(Germany) in 2014. Today he is
student for Master’s degree in
Information Technology at Kiel
University of Applied Sciences,
(Germany). His main activi-
ties cover the following areas:
quality assurance for Triple Play Services and medical
imaging solutions.
E-mail: [email protected]
Kiel University of Applied Sciences
Grenzstraße 5
D 24149 Kiel, Germany
Tadeus Uhl received his M.Sc.
in Telecommunications from
Academy of Technology and
Agriculture in Bydgoszcz in
1975, Ph.D. from Gdańsk Uni-
versity of Technology in 1982
and D.Sc. from University at
Dortmund (Germany) in 1990.
Since 1992 he works as Pro-
fessor at the Institute of Com-
munications Technology, Flens-
burg University of Applied Sciences (Germany) and ad-
ditionally since 2013 as Professor at the Institute of
Transport Engineering, Maritime University of Szczecin,
Poland. His main activities cover the following areas: traf-
fic engineering, performance analysis of communications
systems, measurement and evaluation of communication
protocols, QoS and QoE by Triple Play Services, Ether-
net and IP technology. He is author or co-author of three
books and about 130 papers on the subjects LAN, WAN
and NGN.
E-mail: [email protected]
Maritime University of Szczecin
Henryka Pobożnego st 11
PL 70-507 Szczecin, Poland
36