pan atlantic sms group november 2013 omnibus poll result
DESCRIPTION
Poll results on Maine economic and public policy issues. Conducted with a randomly selected stratified sample of 400 “likely” Maine voters between November 25th and November 30th. The overall margin of error for this poll is ± 4.9% at the 95% confidence level.TRANSCRIPT

6 City Center, Suite 200, Portland, Maine 04101• 207-871-8622
www.panatlanticsmsgroup.com
PAN ATLANTIC SMS GROUP 52nd
OMNIBUS POLL
“The Benchmark of Maine Public Opinion”
Issued December 10th, 2013
“Most Accurate Pollster on Maine’s 2010
Gubernatorial Race”
“Closest in predicting the actual results
of the Governor’s race and the 1st
Congressional District race in 2010”
“Maine’s Best Pollster 2008”2012 Elections:
“Most accurate polls on Presidential
and CD1 and CD2 elections.”

Table of Contents
2
I. Background…………………………...…………………………………………………………………….. 3
II. Methodology…………...…………………………………………...……………………………………… 4
III. Poll Results …………………………………...………...…………………………………………...…... 6
IV. Demographic Profile of Sample..……………………………………………………………………….. 29
The 52nd Pan Atlantic SMS Group Omnibus Poll
2

• Pan Atlantic SMS Group is a Maine based, independent marketing research and consulting firm which is
currently in its 29th year of successful operation.
• This Omnibus Poll is the 52nd poll in a series conducted by Pan Atlantic SMS Group on public policy,
business, economic, technology, and lifestyle issues. Because we have conducted this poll on a frequent
basis over a long time period (since 1996), we are in a unique position to provide reliable benchmarking
on a range of important issues.
• Media use of the information contained in the Pan Atlantic SMS Group Omnibus Poll must identify the
source of information.
• All questions reported on herein are non-proprietary and were not commissioned by any party other
than Pan Atlantic SMS Group.
• For further information, please contact Patrick O. Murphy, President of Pan Atlantic SMS Group, at
(207) 871-8622 or by email at [email protected].
I. Background PA
N A
TLA
NTI
C S
MS G
RO
UP
3
The 52nd Pan Atlantic SMS Group Omnibus Poll

• The 52nd Pan Atlantic SMS Group Omnibus Poll was conducted between November 25th and November 30th,
2013. This independent survey data is being released to the Maine media in the public interest.
• A randomly selected, stratified statewide sample of 400 Maine residents was interviewed by telephone. Each of
Maine’s two Congressional Districts are represented by approximately half of the sample.
• To ensure a highly representative sample, a 20% cell phone sample was used.
• The survey was administered only to those who fulfilled the following criteria:
Are ages 18 and older
Do not, nor does anyone in their household, work for a market research, advertising or media firm
Are registered to vote in Maine and who said they are likely to vote in the November, 2014 elections.
• This independent poll was conducted by telephone, at our in-house interviewing center, by Pan Atlantic’s team of
experienced interviewers. No outside interviewer sources were used. The sample used comprised a mix of land
and cell phones, and responses were weighted according to respondent age to better represent Maine’s age
segment distribution.
II. Methodology
4
PAN
ATL
AN
TIC
SM
S G
RO
UP
The 52nd Pan Atlantic SMS Group Omnibus Poll

• It should be noted that figures may not always equal 100.0 percent due to the rounding of decimals.
• The sample was stratified statewide based on the 2012 U.S. Census of Population and Housing data. The
sample size has statistical significance of ± 4.9 percent at the 95 percent confidence level. This means that
if the survey were to be repeated, 95 times out of 100 the results would reflect the results of this survey
within the ± 4.9 percent margin of error.
• The results are broken out by various demographic subsamples, including Congressional District, political
party affiliation, age, and gender. The margins of error for each of the two CDs is ± 6.98 percent at the
95 percent confidence level.
• Finally, we note that as with all surveys, these results are indicative of public opinion at a singular point in
time.
II. Methodology
5
PAN
ATL
AN
TIC
SM
S G
RO
UP
The 52nd Pan Atlantic SMS Group Omnibus Poll

POLL RESULTS 6
The 52nd Pan Atlantic SMS Group Omnibus Poll

ECONOMY 7
The 52nd Pan Atlantic SMS Group Omnibus Poll

[Options were rotated; n=400] 8
Mainers are showing the highest level of confidence in the
direction of the State since 2006 (38.9% “Right direction”)
The 52nd Pan Atlantic SMS Group Omnibus Poll
Aug. '05 Mar. '06 July '06 May '07 Sept. '07 June '08 Apr. '09 Oct. '09 May '10 May '11 Mar. '13 Nov. '13
Right Direction 21.5% 41.1% 40.4% 31.0% 37.3% 23.0% 32.0% 34.2% 28.3% 29.4% 37.7% 38.9%
Wrong Direction 60.0% 41.6% 41.6% 51.0% 48.3% 59.8% 49.8% 51.1% 50.8% 57.1% 46.9% 48.5%
Don't know 18.5% 17.2% 18.0% 18.0% 14.5% 17.3% 18.3% 14.7% 21.0% 13.5% 15.4% 12.6%
0%
10%
20%
30%
40%
50%
60%
70%
Male respondents are much more
likely to feel that the state is
headed in the right direction
(45.0% of male respondents versus
33.2% of female respondents)
Mainers with lower levels of
household income have a less
favorable view of the State’s
direction (<$50k, 30.8% right
direction vs. 45.0% of those
earning $50k+)
Republicans (59.3%) are more
favorable regarding the direction
of the State than Democrats
(27.6%) and Independents
(31.5%).
In general, do you think that the State of Maine is headed in the right direction or the wrong direction?

What do you think is the most important issue facing the State of Maine today?
Jobs/Unemployment is far and away the most pressing
issue for Mainers. [Unaided; n=400] 9
The 52nd Pan Atlantic SMS Group Omnibus Poll
3.1%
13.0%
1.6%
4.2%
5.3%
2.5%
2.7%
5.4%
12.7%
13.3%
36.2%
Unsure
Other
Cost of living
High level of taxes
Balancing the state budget
Crime/drugs/violence
Need for tax reform
Education
Economy in general
Accessibility/Cost of health care
Jobs/Unemployment
The importance of Jobs/Unemployment
as an issue has increased since Spring
2013 from 27.0% to 36.2%.
Accessibility/Cost of health care has
become the top issue for 13.3% of
Mainers, up from 7.0% in March, 2013.
Balancing the state budget has declined
from being the top issue of 11.0% of Mainers
in March to 5.3% in November, 2013.

[n=400] 10
More than half of Mainers expect that their household
economic situation will stay stagnant in 2014.
The 52nd Pan Atlantic SMS Group Omnibus Poll
Compared to 2013, for the year 2014, do you believe that your household economic situation will:
Improve, 20.6%
Stay the same, 52.9% Worsen, 24.5%
Unsure/ Other, 2.1%
Republicans and Independents are
more pessimistic than Democrats
about their household economic
situation in 2014. A third (33.4%) of
Republicans and 27.3% of
Independents expect their household
economic situation to worsen,
compared to 13.6% of Democrats.

[n=400] 11
The 52nd Pan Atlantic SMS Group Omnibus Poll
In 2013, 42.0% of Mainers plan to spend “less” on holiday gifts
than in 2012, while 5.4% intend to spend “more” and 51.9%
will spend “about the same.”
More, 5.4%
About the same, 51.9%
Less, 42.0%
Don't know, 0.7%
Thinking about the upcoming holiday season, do you plan to spend more, less or about the same as you did last year on holiday gifts?
Younger respondents are less likely to report plans to cut back on Christmas spending. Only 32.8% of respondents ages 18-34 plan on spending less on holiday gifts this year, compared to 45.1% of those ages 35 and up.

NATIONAL PUBLIC POLICY 12
The 52nd Pan Atlantic SMS Group Omnibus Poll

[Options rotated; n=400] 13
The 52nd Pan Atlantic SMS Group Omnibus Poll
Do you approve or disapprove of the way President Obama is handling his job?
59.8% of Mainers disapprove of President Obama’s job performance, a
7.3 point increase in disapproval levels since March, 2013, while 36.2%
approve.
Disapprove59.8% Approve
36.2%
Unsure/No answer
4.0%
9.6%, Republicans (Decline from 16.8% in March)
58.9%, Democrats (Decline from 73.5% in March)
37.2%, Independents (Decline from 40.3% in March)
Approval by Political Affiliation

[n=400] 14
The 52nd Pan Atlantic SMS Group Omnibus Poll
Did you support or oppose Congress recently shutting down major activities of the Federal Government as a way to stop the health care law from being put into place?
Mainers overwhelmingly oppose October’s
Federal Government shutdown.
18.6% 74.3% 7.2%
Support
Oppose
Don't Know
Although the shutdown was unpopular among all demographics tested, only 54.5% of Republicans
opposed the shutdown, compared to 86.0% of Democrats and 80.4% of Independents.

Statement A45.4%
Statement B50.3%
Don't know4.3%
[Options rotated; n=400] 15
The 52nd Pan Atlantic SMS Group Omnibus Poll
I am going to read you two statements about the role of government, and I’d like to know which one comes closer to your point of view…
A slight majority (50.3%) of Mainers feel that
government is doing too many things that are better
left to business and individuals.
Statement A: Federal, State, and Local Government should do more to solve problems and help meet the needs of regular people. Statement B: Government is doing too many things that are better left to businesses and individuals.
There is a sizeable gap on this question
between the responses of those with and
those without children under 18 living in the
household. Those with children support
Statement B by a margin of 55.1%-39.8%,
while those without children support
Statement A by 49.1%-47.1%.

MAINE PUBLIC POLICY ISSUES 16
The 52nd Pan Atlantic SMS Group Omnibus Poll

[n=400] 17
The 52nd Pan Atlantic SMS Group Omnibus Poll
“I’m going to read you the names of some people involved in the public life of Maine… For each person, please tell me if you have a very favorable, somewhat favorable, somewhat unfavorable, or very unfavorable opinion of them. If you aren’t familiar with that person, just say so…”
Senator Susan Collins continues to have the highest favorability level
among several major Maine politicians / political figures (tested).
Senator Susan CollinsCongressman Mike
MichaudGovernor Paul Lepage
Candidate for Governor Eliot Cutler
Favorable 78.5% 55.0% 43.1% 38.5%
Unfavorable 19.0% 30.0% 54.5% 27.3%
Unsure/Not familiar 2.5% 15.0% 2.4% 34.2%
0%
25%
50%
75%
100%
March:
74.7%
March:
60.8%
March:
46.9% March:
42.4%

[n=400] 18
Highlights
• Senator Collins has an overall favorability level of 78.5%.
• Although both have declined in favorability levels, Representative Mike Michaud (55.0%)
continues to hold a strong lead in favorability over Governor Paul LePage (43.1%), and also
Eliot Cutler (38.5%).
• Rep. Michaud’s favorability is higher in his own district – 57.9% in CD2 vs. 52.2% in CD1, though
this 5.7 percentage point gap is much smaller than the gap of 18.1 percentage points recorded
in the Pan Atlantic March 2013 Omnibus Poll™.
• Seven in ten Republicans (71.2%) have a favorable opinion of Gov. Paul LePage, compared to
20.3% of Democrats and 40.1% of Independents. Gov. LePage’s support among Republicans
has increased since March, while his support among Democrats and Independents has decreased.
• Gov. LePage has a higher favorability level in District 2 than in District 1 (48.4% vs. 37.9%).
Males (50.9%) also view him more favorably than females (35.7%).
• Eliot Cutler (I) has an overall favorability level of 38.5%. However, 34.2% are not familiar with
or are unsure of their opinion of gubernatorial candidate Cutler.
The 52nd Pan Atlantic SMS Group Omnibus Poll

35.0% 34.2%
16.8%
6.8%
2.3% 1.8%
1.5%
0%
10%
20%
30%
40%
Would vote for Are leaning towards voting for
Mike
Michaud
Paul
LePage
Eliot
Cutler
Don’t Know /
Refused
22.8%
33.5%
25.6%
18.1%
[Options rotated; n=400] 19
The 52nd Pan Atlantic SMS Group Omnibus Poll
Mainers will vote for Governor in the November, 2014 elections. Assuming the candidates were Independent Eliot Cutler, Republican Paul LePage, and Democrat Mike Michaud, who would you vote for? Among those candidates, which one are you leaning towards voting for if the elections were today? (Choices were rotated.) A follow up question was asked of those who said “don’t know”—”Which candidate are you leaning towards voting for if the elections were held today?”
Among likely candidates for the 2014 gubernatorial election, Mike
Michaud holds a small advantage of 1.3 percentage points over Paul
LePage
37.3% Totals: 36.0% 18.3% 8.5%
Maine Voter Preferences Among Mike Michaud, Paul LePage and Eliot Cutler
Spring,
2013
Spring,
2013
Spring,
2013
Spring,
2013
*Mike Michaud had not announced his candidacy at the time of our Spring poll.
Total Vote Spring ‘13

[n=400] 20
Highlights
• At the time of the Pan Atlantic Spring 2013 Omnibus Poll™, Mike Michaud (22.8%) had not yet
announced his candidacy.
• Since Mike Michaud’s announcement that he is a candidate, his polling numbers have increased
by 14.5 percentage points, while Eliot Cutler’s have declined by 7.3 percentage points. Michaud
has also picked up significant support from the “undecided” segment (was 18.1% in March
2013, and is now 8.4%)
The 52nd Pan Atlantic SMS Group Omnibus Poll

Michaud
36.9%
[Options rotated; n=400] 21
The 52nd Pan Atlantic SMS Group Omnibus Poll
Among the likely candidates for the 2014 gubernatorial election,
Mike Michaud holds a small advantage over Paul LePage
Michaud
36.2%
Respondents of French or
French-Canadian Descent
N=58
LePage
50.0%
Cutler
13.8%
Michaud
37.7%
Respondents of Non-French or
Non-French-Canadian Descent
N=342
LePage
33.6%
Cutler
19.0%
Don’t
Know
9.6%
Congressional District 1
N=203
LePage
33.5%
Cutler
18.7%
Michaud
37.6%
Congressional District 2
N=197
LePage
39.1%
Cutler
17.3%
Don’t
Know
6.1%
Don’t
Know
10.8%
Michaud
43.7%
Female Respondents
N=206
LePage
28.2%
Cutler
18.4%
Michaud
30.4%
Male Respondents
N=194
LePage
44.3%
Cutler
18.6%
Don’t
Know
6.7%
Don’t
Know
9.7%
Mainers will vote for Governor in the November, 2014 elections. Assuming the candidates were Independent Eliot Cutler, Republican Paul LePage, and Democrat Mike Michaud, who would you vote for? Among those candidates, which one are you leaning towards voting for if the elections were today? (Choices were rotated.) A follow up question was asked of those who said “don’t know”—”Which candidate are you leaning towards voting for if the elections were held today?”

[Options rotated; n=400] 22
The 52nd Pan Atlantic SMS Group Omnibus Poll
Mainers will vote for Governor in the November, 2014 elections. Assuming the candidates were Independent Eliot Cutler, Republican Paul LePage, and Democrat Mike Michaud, who would you vote for? Among those candidates, which one are you leaning towards voting for if the elections were today? (Choices were rotated.) A follow up question was asked of those who said “don’t know”—”Which candidate are you leaning towards voting for if the elections were held today?”
Mike Michaud is polling strongest among Independent voters
(34.7% vs. 26.4% - LePage and 23.6% - Cutler).
Michaud
56.4%
Democrat
N=133
LePage
17.3%
Cutler
21.1%
Don’t
Know
5.3%
Michaud
34.7%
Independent
N=144
LePage
26.4%
Cutler
23.6%
Don’t
Know
15.3% Michaud
19.0%
Republican
N=116
LePage
67.2%
Cutler
10.3%
Don’t
Know
3.4%

23
46.7%
22.1%
15.6%
5.8%
10.4%
13.7%
6.9%
20.8%
34.1%
12.0%
17.7%
14.7%
26.4%
24.1%
9.9%
2.2%
4.9%
12.1%
0% 10% 20% 30% 40% 50% 60% 70% 80% 90% 100%
Paul LePage
Mike Michaud
Eliot Cutler
Likelihood to Consider Voting for Gubernatorial Candidates
Highly unlikely Somewhat unlikely Neither likely nor unlikely Somewhat likely Very likely Don't know
Gov. Paul LePage appears to be the most polarizing figure of the three
candidates in the gubernatorial election – 52.5% would not consider voting
for him vs. 32.5% (Mike Michaud) and 29.2% (Eliot Cutler).
Now, I’d like to ask you a slightly different question. Regardless of who you are now supporting in
the general election for Governor, I’d like you to tell me whether you would or would not consider
voting for each of the following candidates on a scale of 1-5, where 1=Highly Unlikely and 5=Very
Likely.
The 52nd Pan Atlantic SMS Group Omnibus Poll
[Options rotated; n=400]
• Of the 52.5% unlikely to consider voting for Governor LePage, 46.7% said “highly unlikely.”
I

[Options rotated; n=400] 24
The 52nd Pan Atlantic SMS Group Omnibus Poll
Recently, Congressman Mike Michaud, who is running for Governor, came out as a gay man. In selecting your choice of candidate for Governor in the 2014 elections, will his sexual orientation factor into your decision in a positive way, negative way, or does it not matter?
The vast majority of respondents indicate that Mike Michaud’s recent announcement
regarding his sexual orientation will not influence their vote in the 2014 gubernatorial
elections – only 9.3% said it would influence them in a negative way.
Positive way, 3.9%
Negative
way, 9.3%
Does not matter, 86.2%
Don't know, 0.6%
20.6% of Republicans and 13.6% of
respondents of French or French-
Canadian descent indicate that Rep.
Michaud’s sexuality would factor into
their decision in an negative way.
Respondents from Congressional
District 2 are more likely to view
Rep. Michaud’s announcement as a
negative factor – 13.5% vs. 5.3%
of respondents in District 1.
25
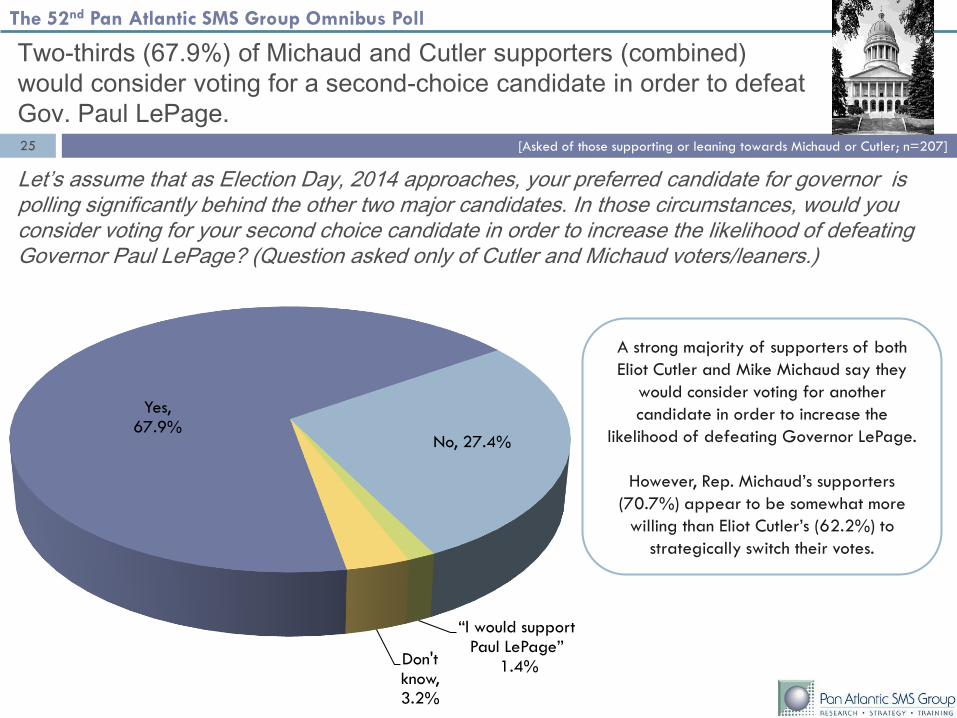
Two-thirds (67.9%) of Michaud and Cutler supporters (combined)
would consider voting for a second-choice candidate in order to defeat
Gov. Paul LePage.
Let’s assume that as Election Day, 2014 approaches, your preferred candidate for governor is polling significantly behind the other two major candidates. In those circumstances, would you consider voting for your second choice candidate in order to increase the likelihood of defeating Governor Paul LePage? (Question asked only of Cutler and Michaud voters/leaners.)
The 52nd Pan Atlantic SMS Group Omnibus Poll
[Asked of those supporting or leaning towards Michaud or Cutler; n=207]
Yes, 67.9%
No, 27.4%
“I would support Paul LePage”
1.4% Don't know, 3.2%
A strong majority of supporters of both
Eliot Cutler and Mike Michaud say they
would consider voting for another
candidate in order to increase the
likelihood of defeating Governor LePage.
However, Rep. Michaud’s supporters
(70.7%) appear to be somewhat more
willing than Eliot Cutler’s (62.2%) to
strategically switch their votes.

Somewhat
15.0%
Somewhat
26.5%
Strongly 36.8%
Strongly 17.3%
0%
10%
20%
30%
40%
50%
60%
Disapprove overall
Approve overall Don't know / Refused
Somewhat
21.1%
Somewhat
28.3%
Strongly31.8%
Strongly15.1%
0%
10%
20%
30%
40%
50%
60%
Disapprove overall
Approve overall Don't know / Refused
Somewhat
15.0%
Somewhat
26.5%
Strongly36.8%
Strongly 17.3%
0%
10%
20%
30%
40%
50%
60%
Disapprove overall
Approve overall
Don't know / Refused
[Options rotated; n=400] 26
The 52nd Pan Atlantic SMS Group Omnibus Poll
Governor Paul LePage has been in office for almost three years. Do you approve or disapprove of his job performance? Is that strongly or somewhat?
Governor LePage’s job approval ratings – 46.6% approve and
52.2% disapprove – have remained very consistent since 2012.
Approval of Job Performance of
Governor LePage – March 2013
51.8%
Approval of Job Performance of
Governor LePage – Oct. 2012
4.5%
52.9%
43.4%
1.2%
43.8%
52.2%
46.6%
3.7%
Approval of Job Performance of
Governor LePage – November 2013
• 70.9% of Republicans approve, 45.0% of Independents, and 24.8% of Democrats.

50.4%
15.3%8.3% 7.4% 6.9% 6.6% 5.1%
0%
10%
20%
30%
40%
50%
60%
Don't Know / Other
Peter Vigue, CEO of Cianbro
Peter Mills, Director, Maine
Turnpike Authority
Phil Harriman, Former State
Senator
Carol Weston, Fomer State
Senator
Bruce Poliquin, Fomer State
Treasurer
Roger Katz, State Senator
27
The 52nd Pan Atlantic SMS Group Omnibus Poll
If a Republican were going to challenge Governor LePage in a primary, which of the following would you most like to see? (Question asked of Republican and Independent voters only – n=261)
Peter Vigue would be the top choice among potential challengers to Governor Paul
LePage in the event of a Republican primary. However, Republicans have not unified
behind any single alternate candidate. (Candidate choices were provided.)
Peter Vigue’s support is strongest among male respondents (22.0% vs. 8.6% of
females) and among those whose household income is over $50,000 (20.5% vs.
12.2% of those earning less than $50,000).

28
Mainers are divided on the question of which of their elected set of
representatives is doing the most to help the state get ahead.
The 52nd Pan Atlantic SMS Group Omnibus Poll
From a policy perspective, who do you think is doing the most to help the state get ahead?
Legislative leaders in the state capital,
23.1%
Governor Paul LePage, 32.8%
Our congressional delegation (US Senators and members of Congress),
26.6%
Don't know, 17.5%
Republicans are more likely to feel
that Gov. Paul LePage is doing the
most to help the state (54.9%,
compared to 17.3% of Democrats
and 28.0% of Independents.
Democrats feel that legislative
leaders in the state capital (30.3%)
and the state’s congressional
delegation (33.3%) are doing the
most, compared to Republicans
(16.3%, 16.9%) and Independents
(22.3%, 28.9%).
[Options rotated; n=400]

Statement A
45.3%
[Options rotated; n=400] 29
The 52nd Pan Atlantic SMS Group Omnibus Poll
The most recent legislature passed a bill to expand MaineCare to 70,000 Maine families that do not have health care coverage. The Governor, in turn, vetoed the bill, saying that we couldn’t afford the expense. Whose position aligns more closely to your own?
A small majority of Mainers (5.3% margin) feel that the legislature
was correct to attempt to expand MaineCare coverage.
Statement B: The legislature was correct that MaineCare coverage should be provided to 70,000 additional families.
Statement B
50.6%
Don’t know
4.1%
Statement A: The governor was correct to veto because we cannot afford the expense.
Responses to this question broke
down along party lines—73.2% of
Republicans agree with Statement
A, while 76.1% of Democrats agree
with Statement B.
By a margin of 57.2% to
37.2%, female respondents
were much more likely to agree
with Statement B than male
respondents.

Access to Dental Care in Maine
HEALTHCARE

31
A very strong majority of Mainers (84.5%) support the authorization
of mid-level dental providers. Only 11.4% oppose this measure.
The 52nd Pan Atlantic SMS Group Omnibus Poll
The state legislature is currently considering a law that would authorize a dental provider, similar to a physician’s assistant. Under the supervision of a dentist, the provider could provide quality care in places like schools and nursing homes, as well as allow dentists to care for more people in rural areas. Would you support or oppose authorizing this kind of provider?
Support, 84.5%
Oppose, 11.4%
Don't know, 4.1%
Support is particularly strong among
younger respondents (93.8% of
those ages 18-34 vs. 81.4% of those
ages 35 and older).
[Options rotated; n=400]
*Please note – Pan Atlantic SMS Group has conducted research work in the past for the Pew Trusts
on this issue. These two questions were not commissioned by Pew Trusts or any other source.

32
The 52nd Pan Atlantic SMS Group Omnibus Poll
[Options rotated; n=400]
When the issue is framed as a reduction in government regulation,
eliminating the prohibition on mid-level dental providers is supported
by 83.8% of Mainers.
Support 83.8%
Oppose 12.1%
Don’t know 4.0%
Currently, state regulations prohibit dentists from hiring providers similar to a physician’s assistant or a nurse practitioner. Some dentists don’t want to lift these regulations because they feel that it would hurt their business. Other dentists think doing so will allow them to treat more low-income patients. Do you oppose or support eliminating these government regulations, leaving it to individual dentists whether to hire this kind of provider?
Support for eliminating the government prohibition on mid-level dental providers is strong across all three political groups—Democrats 79.8%, Republicans 83.5%, and Independents 88.2%.
*Please note – Pan Atlantic SMS Group has conducted research work in the past for the Pew Trusts
on this issue. These two questions were not commissioned by Pew Trusts or any other source.

POLL DEMOGRAPHIC DATA 33
The 52nd Pan Atlantic SMS Group Omnibus Poll

34
Poll Demographic Data
The 52nd Pan Atlantic SMS Group Omnibus Poll
CONGRESSIONAL DISTRICT
CD1 50.0%
CD2 50.0%
POLITICAL AFFILIATION
Democrats 32.5%
Republicans 29.5%
Independents / Unenrolled 36.3%
Other 1.3%
Refused 0.5%
AGE
18 to 34 16.0%
35 to 54 47.5%
55+ 36.5%
GENDER
Female 51.0%
Male 49.0%
2012 HOUSEHOLD INCOME
$50,000 or less 41.5%
$50,000 to <$75,000 20.8%
$75,000 or more 29.5%
Prefer not to answer 8.3%
Note: The above figures show the sample demographics prior to weighting. Survey
responses were weighted to better represent Maine’s age distribution.

6 City Center, Suite 200, Portland, Maine www.panatlanticsmsgroup.com
207.871.8622
“Most Accurate Pollster on Maine’s 2010
Gubernatorial Race”
“Closest in predicting the actual results
of the Governor’s race and the 1st
Congressional District race in 2010”
“Maine’s Best Pollster 2008”2012 Elections:
“Most accurate polls on Presidential
and CD1 and CD2 elections.”