page 1 using sequential art (usa) comic book project – pdea
TRANSCRIPT

Page 1
Using Sequential Art (USA) Comic Book Project – PDEA - Imperial County Office of Education, Award # U351C080031 / United States Department of Education
Supplemental Report on Student Performance Data November 2009
The first Annual Performance Report was submitted in June of 2009 and reported on the first year of the Comic Book Project implementation. At that time student impact data for the Comic Book Project objectives for year 1 were not yet available, thus reporting was differed to this supplemental report. All of the project performance indicators reported on in the Annual Performance Report revealed that the Comic Book Project had met or exceeded its objectives.
This supplemental report will complete the Annual Performance data on the Comic Book Project for the 2008-2009 school year. The data in year 1 shows that students in participating classrooms made academic gains greater than those in nonparticipating classrooms. Academic performance indicators were developed using the scores from the California Standards Tests (CST), a statewide standards based assessment system. CST data were available for the students of 15 of the 23 teacher participants, a total of 382 – 3rd through 8th grade students. Of the remaining classrooms, 5 were Kindergarten or First grade which is not assessed using the CST, 2 were Second grade which is the first year for CST assessment, thus no previous year scores are available for comparison, and one classroom was Special Education. The target for Project performance measure 2.A, was a 5% increase in CST scores when compared to the previous year. CST scores for students entering Comic Book Project classrooms in 2008 (baseline) were compared to their 2009 results. As the graphs show, the percent of students scoring proficient or above in ELA and Math exceeded the 5%.* A gain of 7 percentage points was made in ELA with a 9 percentage point gain in Math.
CST Note: * It is important to note that the CST is based on grade level standards. The assessments have not been vertically scaled, thus year to year or longitudinal
N= 382 N= 382

Page 2
comparisons for the same group of students are not encouraged. The California Department of Education has indicated that the most appropriate way to determine growth for a given subject and aggregated grades is to look at the percentage of students scoring at proficient and above.
For Performance Measure 2.B, a comparison group was made up of students from non-participant teachers teaching the same grade levels at the same schools. As can be seen in the performance measures, the target was to increase CST scores in the core subjects of ELA and math by 5% when compared to a comparison group. The Comic Book Project data on the students in 15 classrooms, grade 3 through 6, were examined alongside 15 control classrooms with students’ grades 3 through 6. Again, this performance measure was exceeded.* Comic Book Project classrooms had 5% more students scoring proficient or advanced in ELA and 15% more scoring proficient or advanced in math. The average increase for ELA and math is 10%. The chart below provides the combined total averages of students scoring at or above proficient on the 2009 CST in ELA and Math for both Comic Book Project and comparison group classrooms.
The graph
below provides a visual of the five proficiency levels and the difference between participant and non-participant student scores.
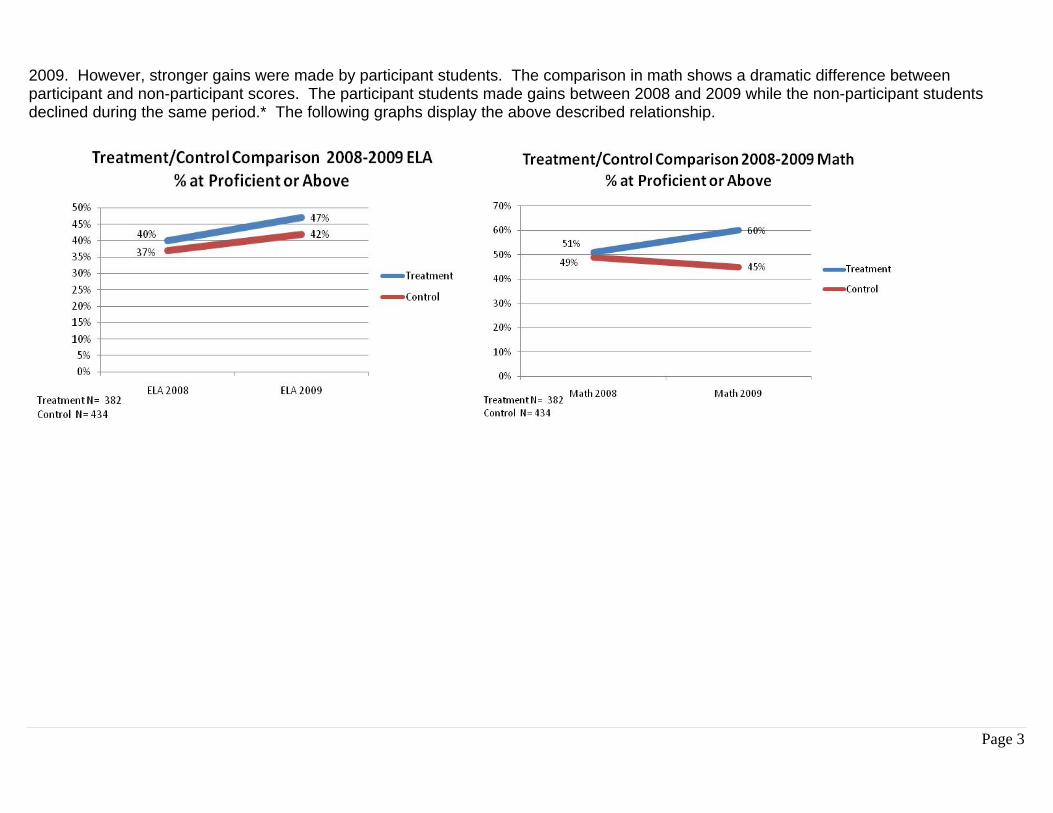
To gain an additional perspective, the data was disaggregated to show the relationship between 2008 and 2009 scores for the participant and non-participant classrooms. The comparison reveals gains made by both participant and non-participant students in ELA from 2008 to
Non Comic Book Project Comparison group
Comic Book Project Treatment group
Difference
CST 2009 ELA Total Proficient and above 42% 47% +5% CST 08‐09 Math Total Proficient and above 45% 60% +15%
Page 3
2009. However, stronger gains were made by participant students. The comparison in math shows a dramatic difference between participant and non-participant scores. The participant students made gains between 2008 and 2009 while the non-participant students declined during the same period.* The following graphs display the above described relationship.