page: 1 masters of science in renewable energy … · 2017-03-14 · page: 1 masters of science in...
TRANSCRIPT

Page: 1 MASTERS OF SCIENCE IN RENEWABLE ENERGY DISSERTATION
MURDOCH UNIVERSITY
Title: INVESTIGATION OF ENERGY
EFFICIENCY OPPORTUNITIES AND
ASSESSMENT OF RENEWABLE ENERGY
TECHNOLOGIES FOR A COLLEGE IN
THE RURAL AREA OF PAKISTAN
A Case study of Namal College.
By
Fahad Saleem
A dissertation submitted to School of Engineering and Information Technology of Murdoch
University in fulfillment of requirements for the degree of Master of Science in Renewable Energy.
September 2016

Page: 2 MASTERS OF SCIENCE IN RENEWABLE ENERGY DISSERTATION
MURDOCH UNIVERSITY
KEYWORDS Energy efficiency, Energy audit, Renewable Energy, Rural area, Energy Simulation, Commercial
building, HOMER, RET screen, Building Standards, Electrical consumption, room activities, Solar
PV, Building occupancy.

Page: 3 MASTERS OF SCIENCE IN RENEWABLE ENERGY DISSERTATION
MURDOCH UNIVERSITY
DECLARATION OF AUTHORSHIP
I at this moment declare that this dissertation is my original piece of work. To my best knowledge,
this dissertation contains no material previously published except where due reference has been
made.
Fahad Saleem
Date:
2-september-2016

Page: 4 MASTERS OF SCIENCE IN RENEWABLE ENERGY DISSERTATION
MURDOCH UNIVERSITY
ABSTRACT
Energy efficiency of buildings has lately become a major issue because of growing concerns about
CO2, greenhouse gas emissions and scarcity of fossil fuels (Pérez-Lombard, Ortiz and Pout 2008).
Buildings worldwide account for high 40% of global energy consumption (Krarti, 2012; Bribian et al.,
2009). If the energy consumed in manufacturing steel, aluminum, cement and glass used in the
construction of buildings is measured, the consumption would be more than 50% (WBCSD 2009).
Energy efficiency of buildings plays an essential role in designing a new facility, assessing its energy
consumption as per design and application of energy efficient technologies during construction and
operation of the building.
Pakistan is facing the worst energy crises. The gap between energy supply and demand is increasing
day by day. A large number of remotely located villages in Pakistan are without electricity. The
energy issue has reached its peak because neither the new generation plants have been installed nor
the energy conservation has been focused, so Identification of new power generation sources is
important. Similarly, the more important issue is to conserve the energy and to use energy efficient
appliances. Besides, reducing the amount of energy demand is a good way to save money, there are
several other benefits to reducing power consumption. The burden on the national grid can be
decreased substantially by using the less power consuming appliances, hence Small changes can lead
to a significant difference in our overall energy consumption.
A pilot study was undertaken to inspect the energy-efficient approaches and how they relate to
energy efficiency improvement of one of leading colleges of Pakistan, has been proposed in the first
phase whereas the second phase includes the same load electrified by utilizing the solar resource.
The building of Namal College selected for the detailed study of energy auditing, consumption and
conservation is located in a rural area of Pakistan, near the city of Mianwali. The aim of this project is
to recommend the best approach to investigate the energy usage, to reduce power consumption
and wholly or partly divert the contribution of expensive diesel to a renewable power source.
Initially, data has been obtained followed by the nomination of high energy consuming sectors for
energy conservation task.
An analysis of electricity generation using renewable energy source was also conducted by using two
simulation software which is HOMER and RET screen. Here RETScreen is used to estimate the
numbers of units of solar panels and the area required to install them while Homer is used for
technical and financial aspects.

Page: 5 MASTERS OF SCIENCE IN RENEWABLE ENERGY DISSERTATION
MURDOCH UNIVERSITY
ACKNOWLEDGMENTS
I would like to avail this opportunity, to express my sincere gratitude and appreciation to everyone
who helped me to finish this work. This dissertation could not have come together without the
support from many people. I am very thankful to my supervisor Dr. Tania Urmee for assisting me in
building academic understanding aswell as some useful suggestions, comments and
recommendation. I sincerely thank her for giving me this opportunity to be part of this research and
for her consistent support and understanding. I am also grateful to Dr. Trevor Pryor, Dr. Jonathan
Whale, Dr. Sinisa Djordjevic, Dr. Manickam Minakshi, Dr. Xianpeng Gao, Dr. Almantas Pivrikas for
their contribution during my study period at Murdoch University.
My heartfelt gratitude goes to NAMAL College staff for helping me in collection of necessary data
and information regarding building auditing and energy consumptions.
In the end, I would like to thank my parents, friends and colleagues for their support, motivation,
commitment and sacrifices. Their encouragement has allowed me to fulfill my dreams and live life to
the fullest. Thank you to all!
Page: 6 MASTERS OF SCIENCE IN RENEWABLE ENERGY DISSERTATION
MURDOCH UNIVERSITY
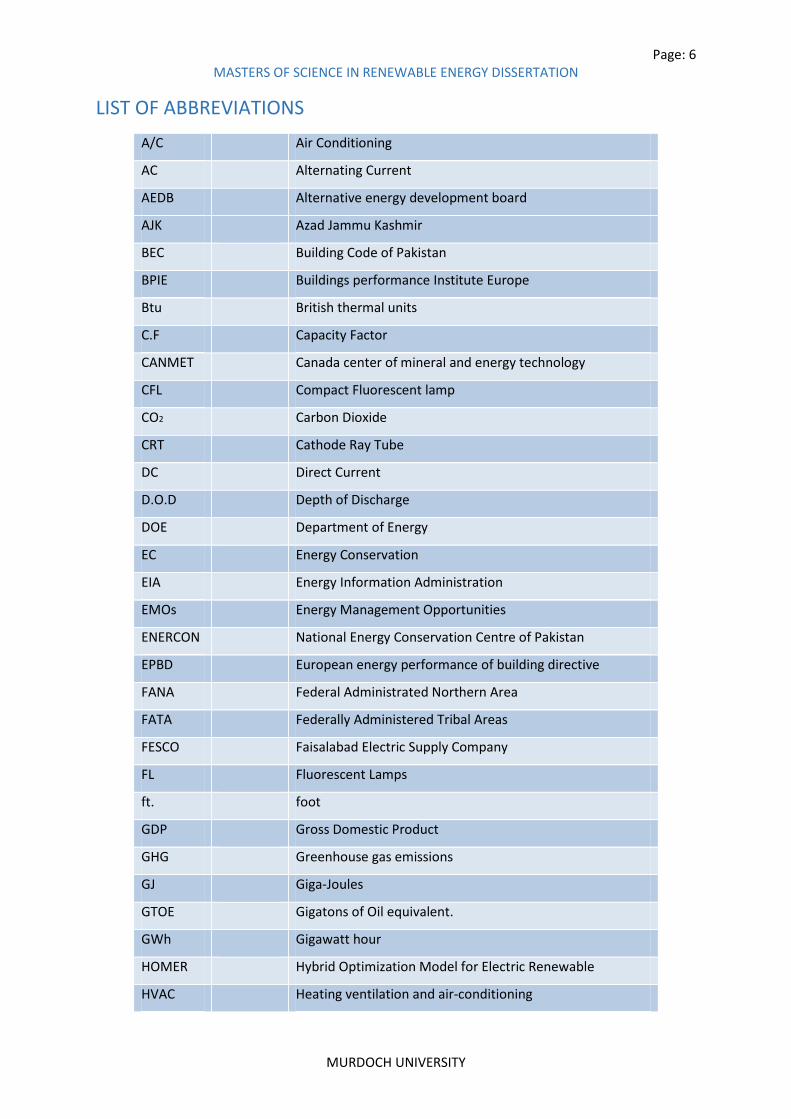
LIST OF ABBREVIATIONS
A/C
Air Conditioning
AC
Alternating Current
AEDB
Alternative energy development board
AJK
Azad Jammu Kashmir
BEC
Building Code of Pakistan
BPIE
Buildings performance Institute Europe
Btu
British thermal units
C.F
Capacity Factor
CANMET
Canada center of mineral and energy technology
CFL
Compact Fluorescent lamp
CO2
Carbon Dioxide
CRT
Cathode Ray Tube
DC
Direct Current
D.O.D
Depth of Discharge
DOE
Department of Energy
EC
Energy Conservation
EIA
Energy Information Administration
EMOs
Energy Management Opportunities
ENERCON
National Energy Conservation Centre of Pakistan
EPBD
European energy performance of building directive
FANA
Federal Administrated Northern Area
FATA
Federally Administered Tribal Areas
FESCO
Faisalabad Electric Supply Company
FL
Fluorescent Lamps
ft.
foot
GDP
Gross Domestic Product
GHG
Greenhouse gas emissions
GJ
Giga-Joules
GTOE
Gigatons of Oil equivalent.
GWh
Gigawatt hour
HOMER
Hybrid Optimization Model for Electric Renewable
HVAC
Heating ventilation and air-conditioning

Page: 7 MASTERS OF SCIENCE IN RENEWABLE ENERGY DISSERTATION
MURDOCH UNIVERSITY
IB
Incandescent bulb
IEA
International Energy Agency
IPP
Independent power producer
KESC
Karachi Electric Supply Corporation
km
Kilometre
kVA
kilovolt-ampere
kWh
Kilowatt hour
Kwh/m2
Kilowatts hour per meter square.
LCD
Liquid Crystal Display
LED
Light Emitting Diode
m
meter
MPPT
Maximum-Power-Point Tracker
MTOE
million tons of oil equivalent
MW
Megawatts
MWh
Mega Watts hour
MWh
Megawatt Hour
NASA
National Aeronautics and Space Administration
NEPRA
National Electric Power Regulatory Authority
NPC
Net Present Cost
NPV
Net Present Value
NREL
National Renewable Energy Laboratory
NTDC
National Transmission and Dispatch Company Limited
NWFP
North-West Frontier Province
O&M
Operation and Maintenance
OECD
organization for economic cooperation and development
OICCI
Overseas Investor Chamber of Commerce & Industry
PAEC
Pakistan Atomic Energy Commission
PBIT
Punjab Board of Investment and Trade
PCAT
Pakistan Council of appropriate technology
PCRET
Pakistan Council of Renewable Energy Technologies
PEC
Pakistan Engineering Council
PEPCO
Pakistan Electric Power Company
PF
power factor

Page: 8 MASTERS OF SCIENCE IN RENEWABLE ENERGY DISSERTATION
MURDOCH UNIVERSITY
PKR/Rs
Pakistani rupee
PMD
Pakistan Meteorological Department
PSH
Peak Sun-Hour
PV
Photovoltaic
PWF
Present Worth Factor
RE
Renewable Energy
RETs
Renewable Energy Technologies
SNGPL
Sui Northern Gas Pipelines Limited
SSGC
Sui Southern Gas Company
TOE
Tonns of Oil Equivalent
UK
United Kingdom
USD
US Dollar
W
Watt
W/m2
watts per square meter
WAPDA
Water and Power Development Authority
WEC
The World Energy Council
NOMENCLATURE Term Meaning Unit
GHI Global Horizontal Irradiance (kW/m2)
𝜑 Density (Kg/m³)
V Wind Speed (m/s)
A Area (m²)
°C degree Celsius

Page: 9 MASTERS OF SCIENCE IN RENEWABLE ENERGY DISSERTATION
MURDOCH UNIVERSITY
LIST OF PUBLICATION
1. "Sustainable Energy Development and Linking Renewable Energy Resources for
Pakistan". Saleem, Fahad, Muhammad Usman Haider, M Sohaib Irshad, Bilal Asad
and M Qamar Raza. 2011. In International Conference On Power Generation
Systems Technologies, 328-332. Islamabad: INIS Repository.
https://inis.iaea.org/search/search.aspx?orig_q=RN:43013974.

Page: 10 MASTERS OF SCIENCE IN RENEWABLE ENERGY DISSERTATION
MURDOCH UNIVERSITY
UNITS OF MEASUREMENTS
All currency values mentioned in this study is in Pakistani Rupee (PKR/Rs) unless otherwise
mentioned.
The following conversion rates have been taken from the website source: XE.com on 12/07/2016
1.00 USD = 104.827 PKR
The currency used for simulation in HOMER and RET Screen is in USD.

Page: 11 MASTERS OF SCIENCE IN RENEWABLE ENERGY DISSERTATION
MURDOCH UNIVERSITY
TABLE OF CONTENTS
KEYWORDS .............................................................................................................................................. 2
DECLARATION OF AUTHORSHIP .............................................................................................................. 3
ABSTRACT ................................................................................................................................................ 4
ACKNOWLEDGMENTS ............................................................................................................................. 5
LIST OF ABBREVIATIONS ......................................................................................................................... 6
NOMENCLATURE ..................................................................................................................................... 8
LIST OF PUBLICATION .............................................................................................................................. 9
UNITS OF MEASUREMENTS .................................................................................................................. 10
TABLE OF CONTENTS ............................................................................................................................. 11
LIST OF TABLES ...................................................................................................................................... 13
LIST OF FIGURES .................................................................................................................................... 14
Chapter 1 INTRODUCTION ................................................................................................................. 16
1.1 Aims and Objectives .................................................................................................................... 16
1.2 Background ................................................................................................................................. 16
1.3 Methodology Adopted ................................................................................................................ 19
1.4 Dissertation Structure ................................................................................................................. 22
Chapter 2 LITERATURE REVIEW ......................................................................................................... 22
2.1 Energy Situation in Pakistan........................................................................................................ 22
2.1.1Pakistan Electricity Current Scenario .................................................................................... 23
2.1.2 Electricity Generation Scenario ............................................................................................ 24
2.1.3 Electricity Generation by Sector and Source ....................................................................... 26
2.1.4 Pakistan Power Demand Analysis By sector ........................................................................ 26
2.1.5 Existing Grid Infrastructure .................................................................................................. 28
2.2 The Importance of Energy Conservation and Energy Efficiency ................................................. 29
2.2.1Pakistan Energy Conservation potential and Efficiency Strategy ......................................... 29
2.2.2 Barriers to Improving Energy Efficiency in Pakistan ............................................................ 30
2.2.3 Options to Meet Future Energy Needs ................................................................................ 31
2.3 Case Study: Namal College .......................................................................................................... 36
2.3.1 College Overview ................................................................................................................. 36
2.3.2 Location and Demography ................................................................................................... 37
2.4 Energy Audit ................................................................................................................................ 38
Chapter 3 RENEWABLE ENERGY RESOURCE ASSESMENT ................................................................. 66
3.1 Renewable Energy Resources of Pakistan .................................................................................. 66
3.1.1Potential of Renewable Energy in Pakistan. ......................................................................... 66

Page: 12 MASTERS OF SCIENCE IN RENEWABLE ENERGY DISSERTATION
MURDOCH UNIVERSITY
3.1.2 Policy Affecting Renewable Energy Development ............................................................... 77
3.2 Renewable Energy Resource at the Case Study Area ................................................................. 78
3.2.1 Solar Energy ......................................................................................................................... 78
3.2.2 Wind ..................................................................................................................................... 81
3.2.3 Namal Dam ........................................................................................................................... 82
Chapter 4 SIMULATION ANALYSIS ..................................................................................................... 83
4.1 RETSCREEN 4 ............................................................................................................................... 83
4.1.1 RET Screen Overview ........................................................................................................... 84
4.1.2 Software Validation.............................................................................................................. 86
4.1.3 Estimation of PV Using RETScreen Model............................................................................ 86
4.2 HOMER (Hybrid Optimization of Multiple Energy Resources) .................................................... 87
4.2.1 HOMER Overview ................................................................................................................. 87
4.2.2 Simulation ............................................................................................................................ 88
CONCLUSION ......................................................................................................................................... 95
REFERENCES .......................................................................................................................................... 97
APPENDICES ........................................................................................................................................ 110
Appendix A ...................................................................................................................................... 110
Electricity bill of Namal College .................................................................................................. 110
Appendix B ...................................................................................................................................... 111
Annual diesel consumption ......................................................................................................... 111
Appendix C ...................................................................................................................................... 120
Annual electricity load shedding hours ....................................................................................... 120
Appendix D ...................................................................................................................................... 129
RET screen Inputs/outputs .......................................................................................................... 129
Appendix E ...................................................................................................................................... 135
HOMER simulation inputs/outputs ............................................................................................. 135
Appendix F ...................................................................................................................................... 137
Building photographs .................................................................................................................. 137
Appendix G ...................................................................................................................................... 139
Renewable resource data at subject site .................................................................................... 139
Appendix H ...................................................................................................................................... 140
Summary of monthly average electricity load ............................................................................ 140

Page: 13 MASTERS OF SCIENCE IN RENEWABLE ENERGY DISSERTATION
MURDOCH UNIVERSITY
LIST OF TABLES
Table 1: Energy conservation potential by sector (Zia, 2011) .............................................................. 29
Table 2: Electricity bill details for the month of May ............................................................................ 44
Table 3: Diesel Generators Specifications ............................................................................................. 44
Table 4: Daily occupancy profile ........................................................................................................... 46
Table 5: Weekly occupancy profile ....................................................................................................... 47
Table 6: Annual occupancy profile ........................................................................................................ 47
Table 7: Floor design of basement area with sizes ............................................................................... 50
Table 8: Floor design of Ground area with sizes and capacity .............................................................. 51
Table 9: Floor design of first level area with sizes and capacity ........................................................... 52
Table 10: Lighting system details .......................................................................................................... 55
Table 11: Lighting saving measures ...................................................................................................... 57
Table 12: Refrigeration detail ............................................................................................................... 57
Table 13: Air-conditions detail .............................................................................................................. 58
Table 14: Fans detail ............................................................................................................................. 59
Table 15: Water pump Detail ................................................................................................................ 60
Table 16: Water pump saving measures ............................................................................................... 60
Table 17: Hot water detail .................................................................................................................... 61
Table 18: IT rooms details ..................................................................................................................... 61
Table 19: Computer saving measures ................................................................................................... 62
Table 20: Room heater details .............................................................................................................. 62
Table 21: Plug load details .................................................................................................................... 64
Table 22: Potential capacity of Renewable Sources of Energy in Pakistan (Mirza 2008) ..................... 67
Table 23: Suitable renewable technologies for Pakistan ...................................................................... 68
Table 24: Monthly average wind speed at Keti Bandar with reference to 30m,50m,60m and 67m
height. ................................................................................................................................................... 69
Table 25: Solar irradiation data from 6 locations (US cents / Kilowatt hour) ....................................... 71
Table 26: Available hydropower Potential River wise (WAPDA, 2013) ............................................... 75
Table 27: Annual crop production in Punjab province ......................................................................... 76
Table 28: Numbers and types of animal in Pakistan (million) .............................................................. 76
Table 29: Electrical production and consumption ................................................................................ 94

Page: 14 MASTERS OF SCIENCE IN RENEWABLE ENERGY DISSERTATION
MURDOCH UNIVERSITY
LIST OF FIGURES
Figure 1: World energy consumption by sectors .................................................................................. 18
Figure 2: Percentage of electricity consumption cost from grid vs. diesel generators ........................ 19
Figure 3: Dissertation Methodology ..................................................................................................... 20
Figure 4: Energy consumption by source in during 2014 in Pakistan (Source: Pakistan Energy
Yearbook 2014) ..................................................................................................................................... 23
Figure 5: Energy supply and demand graph ......................................................................................... 24
Figure 6: Electricity installed capacity ................................................................................................... 25
Figure 7: Primary energy mix of different countries SOURCE (OICCI, 2012) ........................................ 26
Figure 8: Energy Generation by Sector and Source (GWh) (NEPRA 2014) ........................................... 26
Figure 9: Sectoral Energy Consumption of Pakistan during 2014 (Source: Pakistan Energy Yearbook
2014) ..................................................................................................................................................... 27
Figure 10: Sectoral Electricity consumption during 2014 (Source: Pakistan Energy Yearbook 2014) .. 28
Figure 11: Houses existing energy consumption versus energy consumption after implementing
building energy codes in Denmark ....................................................................................................... 34
Figure 12: Namal college building (source: Namal College website) .................................................... 37
Figure 13: Satellite image of total building area of Namal College (Source: Google map)................... 38
Figure 14: Monthly peak load profile from June 2015- May 2016 ....................................................... 43
Figure 15: Daily load profile .................................................................................................................. 43
Figure 16: Diesel generators ................................................................................................................. 44
Figure 17: Diesel consumption by generators per month during June 2015 to may 2016 .................. 45
Figure 18: Diesel Monthly Price (Indexmundi, 2016) ........................................................................... 45
Figure 19: Average daily load shedding hours ...................................................................................... 46
Figure 20: Building floor area covering (source: Google maps) ............................................................ 48
Figure 21: Passive solar design source: Buildinggreen.Com ................................................................. 49
Figure 22: Passive solar design source: Buildinggreen.Com ................................................................. 49
Figure 23: Wall properties .................................................................................................................... 49
Figure 24: Ceiling properties ................................................................................................................. 50
Figure 25: Building roof ......................................................................................................................... 50
Figure 26: Architectural design of basement level ............................................................................... 51
Figure 27: Architectural design of ground level .................................................................................... 52
Figure 28: Architectural design of the first floor................................................................................... 53
Figure 29: Summer electricity consumption breakdown...................................................................... 53
Figure 30: Winter electricity consumption breakdown ........................................................................ 54

Page: 15 MASTERS OF SCIENCE IN RENEWABLE ENERGY DISSERTATION
MURDOCH UNIVERSITY
Figure 31: Air condition outdoor units .................................................................................................. 58
Figure 32: Electric wiring ....................................................................................................................... 65
Figure 33: Wind energy map of Pakistan .............................................................................................. 70
Figure 34: Solar radiation map of Pakistan ........................................................................................... 71
Figure 35: Average hourly irradiation of Sindh on a monthly basis ...................................................... 72
Figure 36: Total Hydropower installed capacity in Pakistan. ................................................................ 73
Figure 37: Cost of electricity from hydro-power.................................................................................. 74
Figure 38: Areas of hydropower potential ............................................................................................ 74
Figure 39: Locations of geothermal resources in Pakistan ................................................................... 77
Figure 40: Solar resource (NASA website) ............................................................................................ 79
Figure 41: Solar sun path(sunearthtools.com) ..................................................................................... 80
Figure 42: Solar elevation ..................................................................................................................... 81
Figure 43: Annual wind speed ............................................................................................................... 82
Figure 44: Namal dam (source: "Panoramio - Photo Explorer" 2008) .................................................. 82
Figure 45: Accuracy of project cost estimates (RETScreen, 2016). ....................................................... 84
Figure 46: RET Screen Model Flow Chart (RETScreen, 2016). .............................................................. 85
Figure 47: Validation test of RET Screen by comparison of PV energy production with HOMER ........ 86
Figure 48: Solar PV size estimation ....................................................................................................... 87
Figure 49: Simulation, Optimization and Sensitivity Analysis ............................................................... 88
Figure 50: HOMER Primary Load Input ................................................................................................. 89
Figure 51: Photovoltaic Input ................................................................................................................ 89
Figure 52: Grid input ............................................................................................................................. 89
Figure 53: Converter detail ................................................................................................................... 90
Figure 54: Battery input details ............................................................................................................ 90
Figure 55: 90kW Diesel Generator inputs ............................................................................................. 91
Figure 56: 40kW Diesel Generator inputs ............................................................................................. 91
Figure 57: Hybrid System design. .......................................................................................................... 92
Figure 58: Homer simulation result ...................................................................................................... 92
Figure 59: Search space result .............................................................................................................. 93
Figure 60: Monthly average electricity production .............................................................................. 93
Figure 61: Grid purchases ..................................................................................................................... 93
Figure 62: Cash flow summary .............................................................................................................. 94
Figure 63: Cash flow by cost type ......................................................................................................... 95
Figure 64: GHG analysis ........................................................................................................................ 95
Page: 16 MASTERS OF SCIENCE IN RENEWABLE ENERGY DISSERTATION
MURDOCH UNIVERSITY
Chapter 1 INTRODUCTION
1.1 Aims and Objectives The aim of this dissertation is to explore the possibility of improving the energy efficiency of
Namal College, which is situated in rural area of Pakistan. It was aimed at obtaining a
comprehensive data about the various end-use energy consumption activities and
enumerating, identifying and estimating the possibilities of energy conservation
opportunities. The main objective is further sub-categorized to the following subtasks:
Selection of suitable rural site for the study such that same research can be applied
to the relevant buildings/sites around the country.
Prepare a questionnaire covering information requirements for pre-auditing.
Collect and review electricity and fuel use records for the facility.
Inspect and record information about all appliances in the facility.
Compile a list of all energy consuming loads in the audit area and measure their
consumption and demand characteristics.
Profile energy uses patterns.
Identify Energy Management Opportunities (EMOs).
Assess the benefits.
Measure potential energy and cost savings opportunities, along with any co-
benefits.
Recommendations for the energy management opportunities to be implemented
should be made, with regard to the energy savings and cost benefits.
Finalization of daily energy requirement based on the audit report.
Collection of social, energy sources available and energy consumption data.
Analysis of data by energy needs.
Analysis of the locally available energy sources. Based on the data collected for
available energy sources, the best possible/ implementable power supply would be
suggested.
System sizing and designing on the basis of the energy requirement and the
available power source would be done.
Rectification and conservation of current misuse of energy pattern.
Economic and financial analysis based on the system design.
1.2 Background
Saving a watt is equivalent to producing a watt of electricity.
Page: 17 MASTERS OF SCIENCE IN RENEWABLE ENERGY DISSERTATION
MURDOCH UNIVERSITY
Energy consumption of the global market is continuously increasing and projected to upswing by
nearly 50 percent from 2009 through 2035. Most of the growth occurring in evolving economies
outside the (OECD) organization for economic cooperation and development, especially in non-OECD
Asia. Total non-OECD energy use risen by 84 percent compared to 14 percent increase in developed
OECD nations over the projected period (EIA, 2011).
Total power consumption can be categorized into four main sectors: industrial, commercial,
transportation and residential. Buildings structure energy consumption has a significant contribution
and its share is the greatest in most regions of the world depending upon the income levels, natural
resources, climate and available energy infrastructure. Buildings are responsible for consuming
almost 30 – 45 percent of global energy demand (Pout, Mackenzie and Bettle 2002).
In recent years, the situation of the electrical shortage is becoming more severe in developing
countries. An immediate action needed to develop energy efficient buildings to reduce fossil fuel
consumption. Buildings represent a very high percentage of power consumption which is 30% to
45% of the global energy demand (Asimakopoulos et al. 2012). This increase in energy use and
carbon dioxide emissions in the built-in environment has made energy conservation strategy a
priority objective for energy policies in several countries (Pérez-Lombard, Ortiz and Pout 2008). In his
research, Chung mentioned that Universities and commercial buildings are classified as the high
energy consuming buildings (Chung and Rhee 2014).
Around the world, there is a vast potential for energy efficiency in buildings that very few countries
have started utilizing. This potential exists for all energy end-use sectors including buildings,
industries and transportation. to reduce costs and lower the environmental impacts, one of the main
challenges of this millennium is to increase the efficiency of production, distribution and
consumption of energy. Therefore, energy efficiency can have beneficial impacts on the economic
competitiveness, the environment and the health.
In several industrialized countries, the power consumption has widely fluctuated in response to
significant changes in oil prices, economic growth rates and environmental concerns especially since
the oil crisis of early 1970’s. For instance, the US energy consumption increased from 66 quadrillion
British thermal units (Btu) in 1970 to 94 quadrillion Btu in 1998 (EIA, 1998). Higher oil prices in the
1970's (oil embargo in 1973 and the Iranian revolution in 1979) have mandated energy conservation
and increased energy efficiency.
Several countries have implemented energy saving policies in buildings, for instance, the Dutch
government has a target of 50% reduction in energy use in the existing housing stock by 2020
Page: 18 MASTERS OF SCIENCE IN RENEWABLE ENERGY DISSERTATION
MURDOCH UNIVERSITY
(Hoppe, Bressers and Lulofs 2011). An example of (EPBD) European energy performance of building
directive which places high demand to produce a building to zero energy usage level(energy
performance of buildings, 2002).
Despite some improvements in energy efficiency over the last two decades, most developing
countries are still energy-intensive in the world. In most countries, commercial and residential
buildings account for a significant portion of the total national energy consumption (almost 40% in
the US and France). Typically, buildings use electricity and a primary power source such as a natural
gas and fuel oil. Electricity is mainly used for appliances, lighting and HVAC equipment.
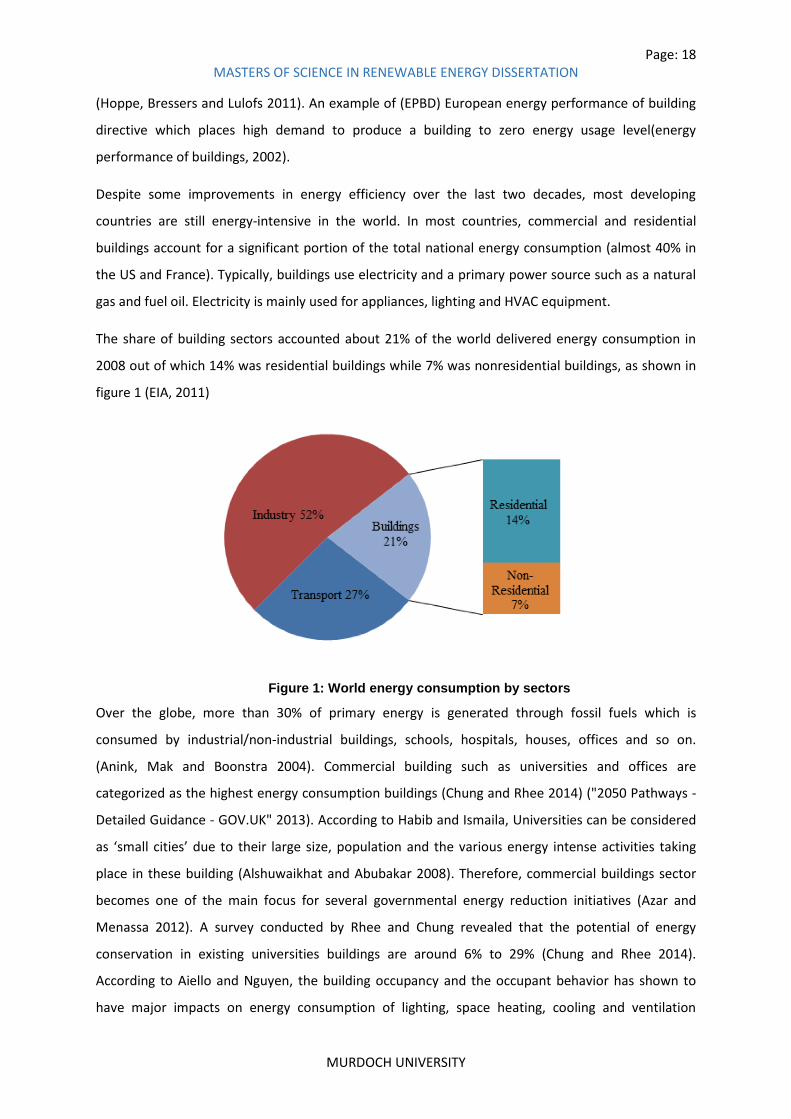
The share of building sectors accounted about 21% of the world delivered energy consumption in
2008 out of which 14% was residential buildings while 7% was nonresidential buildings, as shown in
figure 1 (EIA, 2011)
Figure 1: World energy consumption by sectors
Over the globe, more than 30% of primary energy is generated through fossil fuels which is
consumed by industrial/non-industrial buildings, schools, hospitals, houses, offices and so on.
(Anink, Mak and Boonstra 2004). Commercial building such as universities and offices are
categorized as the highest energy consumption buildings (Chung and Rhee 2014) ("2050 Pathways -
Detailed Guidance - GOV.UK" 2013). According to Habib and Ismaila, Universities can be considered
as ‘small cities’ due to their large size, population and the various energy intense activities taking
place in these building (Alshuwaikhat and Abubakar 2008). Therefore, commercial buildings sector
becomes one of the main focus for several governmental energy reduction initiatives (Azar and
Menassa 2012). A survey conducted by Rhee and Chung revealed that the potential of energy
conservation in existing universities buildings are around 6% to 29% (Chung and Rhee 2014).
According to Aiello and Nguyen, the building occupancy and the occupant behavior has shown to
have major impacts on energy consumption of lighting, space heating, cooling and ventilation

Page: 19 MASTERS OF SCIENCE IN RENEWABLE ENERGY DISSERTATION
MURDOCH UNIVERSITY
demand and building controls, where casual approach can add 1/3rd to a building design energy
performance (Nguyen and Aiello 2013). The major energy consuming end-use in universities or
commercial building is (HVAC) heating ventilation and air-conditioning (Au-Yong, Ali and Ahmad
2014). Without any proper maintenance of HVACs, results in poor indoor air quality, energy wastage
and also environmental damage (Wu et al. 2010). Hence buildings still provide great potential for
energy saving opportunities. For this reason, energy audits are conducted to define how much
energy efficient building is and what improvements can be required to enhance the efficiency.
In this study, an energy audit of Namal College was conducted to replace the high-cost diesel
generated electricity with a renewable resource of electricity. Figure 2 represent the energy
consumption cost of primary electricity sources in Namal college during 2015- 2016. There are two
main sources of electricity which are 1) electricity from grid and 2) power from two diesel
generators. It is apparent that the cost of electricity from diesel is higher with 63% ($15,876) and
electricity from the grid is relatively cheaper with 37% ($9482). So this expensive electricity
generation is a huge burden on the financial budget of this college.
Figure 2: Percentage of electricity consumption cost from grid vs. diesel generators
1.3 Methodology Adopted This research has been performed in two stages. In the first stage, all data related to energy
consumption in College has been collected from different reliable sources while the second phase
proposes the part of load requirement electrification through the solar resource via simulation to
offset the use of diesel generators. The process encompasses following five steps.
37%
63%
Percentage of electricity consumption cost from grid vs. diesel generators during 2015-16
Total Cost Electricity Grid Total Cost of Diesel Use
Page: 20 MASTERS OF SCIENCE IN RENEWABLE ENERGY DISSERTATION
MURDOCH UNIVERSITY
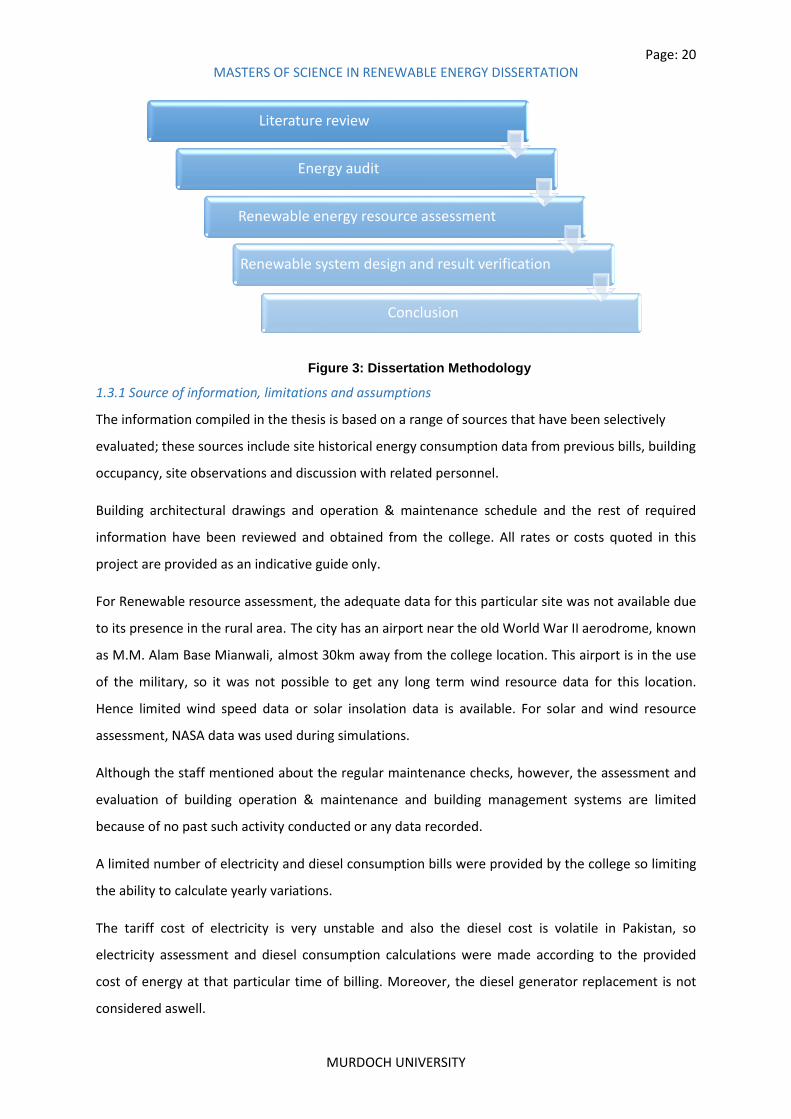
Figure 3: Dissertation Methodology
1.3.1 Source of information, limitations and assumptions
The information compiled in the thesis is based on a range of sources that have been selectively
evaluated; these sources include site historical energy consumption data from previous bills, building
occupancy, site observations and discussion with related personnel.
Building architectural drawings and operation & maintenance schedule and the rest of required
information have been reviewed and obtained from the college. All rates or costs quoted in this
project are provided as an indicative guide only.
For Renewable resource assessment, the adequate data for this particular site was not available due
to its presence in the rural area. The city has an airport near the old World War II aerodrome, known
as M.M. Alam Base Mianwali, almost 30km away from the college location. This airport is in the use
of the military, so it was not possible to get any long term wind resource data for this location.
Hence limited wind speed data or solar insolation data is available. For solar and wind resource
assessment, NASA data was used during simulations.
Although the staff mentioned about the regular maintenance checks, however, the assessment and
evaluation of building operation & maintenance and building management systems are limited
because of no past such activity conducted or any data recorded.
A limited number of electricity and diesel consumption bills were provided by the college so limiting
the ability to calculate yearly variations.
The tariff cost of electricity is very unstable and also the diesel cost is volatile in Pakistan, so
electricity assessment and diesel consumption calculations were made according to the provided
cost of energy at that particular time of billing. Moreover, the diesel generator replacement is not
considered aswell.
Literature review
Energy audit
Renewable energy resource assessment
Renewable system design and result verification
Conclusion

Page: 21 MASTERS OF SCIENCE IN RENEWABLE ENERGY DISSERTATION
MURDOCH UNIVERSITY
Grid electricity is mainly used for the overall requirement of the building except air-conditioning. 24
air-conditions run on diesel while 4 A/Cs run on grid electricity. Also, during electricity load shedding
hours all the load is shifted to the generator and air conditioning is turned off.
Load shedding hours are not constant and are seasonally and annually volatile. Usually, during the
summer season, there are long hours of electricity shortage, while during the winter season, the
electricity shortages are comparatively low. Hence the reliance on diesel generator increases during
summer.
Another weakness of this study is that it only focuses on specific circumstances of one building. By
conducting a survey on more than one building would give more confidence in results.
The simulation programs used in this study have their inherent limitations and it is important to
consider the limitations of these two programs while considering the results.
According to college representative, the college strength increases by 100 students each year so this
factor also resulted in growth in energy consumption each year, which is ignored during calculations.
For this research, the data collection was an essential part and it was an invariably tiring and time-
consuming experience and no previous such energy efficiency activity records were found.
1.3.2 Data collection
In preliminary data collection phase, thorough data collection was made using different techniques,
such as observations, interviewing key persons and measurements.
I visited eachdepartment, laboratories, tuck shop, lecture theaters, library, computer labs
and other areas of the institution.
Information about the electrical appliances was composed by observation and interviewing
the relevant personnel.
A collection of previous electricity use and diesel bills with annual electricity load shedding
details.
The electricity consumption of appliances was measured using power analyzer in some cases
(such as a fan) while rated power was used for some other appliances.
Information collection on redundant energy systems.
The details of usage and operation timings were collected by interviewing the relevant
persons (electricians, lab assistant), etc.
Detailed review of rooftops and areas around the building to look for suitable location for
installation of solar panel
Photographs of relevant appliances, equipment rooms and structure were taken during visits

Page: 22 MASTERS OF SCIENCE IN RENEWABLE ENERGY DISSERTATION
MURDOCH UNIVERSITY
On return from the visit, all the gathered data was consolidated and reviewed and categorized
for various subsequent requirement/actions.
1.3.3 Data Analysis
Comprehensive analysis of data collection was performed. Energy consumption per month
and average hourly consumption were calculated based on each energy consumption
activity.
Electricity from diesel and it cost was reviewed with reference to electricity load shedding
hours
Two simulation software HOMER and RET screen were used for simulation analysis.
1.4 Dissertation Structure This dissertation is composed of 5 chapters. A summary of each chapter is mentioned as follows
Chapter 1 Summarizes the background and importance of study, defines the objectives,
Methodology adopted and system structure of the study.
Chapter 2 Introduces the current scenario of Pakistan energy situation, building codes and standards
of Pakistan, a brief introduction to the case study, information regarding energy auditing with all
audit phases. For this reason, the main areas of power consumption in the college are listed to
evaluate the performance of the building and energy saving potential is suggested at the end.
Chapter 3 Reviews the renewable resource assessment in Pakistan and then at the case study area.
It includes the solar resource, wind resource assessment and the potential of electricity generation
from the nearby Namal dam.
Chapter 4 Covers the overview of two software HOMER and RETscreen and research results of the
simulation and their metric analysis.
Concluding remarks explain the conclusion of the project.
Chapter 2 LITERATURE REVIEW
2.1 Energy Situation in Pakistan
Energy demand increases with the increase in economic growth. Energy is an essential element for
an overall wellbeing of a developing economy. Several analysts in the past mentioned the
relationship between energy consumption and economic growth for different economies, such as
Jakovac in 2013, Shahbaz in 2012, Belke in 2011, Jamil in 2010, Apergis in 2010, Lee in 2008, Soytas
in 2003, Masih in 1996.

Page: 23 MASTERS OF SCIENCE IN RENEWABLE ENERGY DISSERTATION
MURDOCH UNIVERSITY
In the case of Pakistan, the final energy demand recorded in 1990 was 21.58 million tons of oil
equivalent. It was increased to 66.8 million tons of oil equivalent in 2014 with the growth rate of 3.6
% annually (Energy Yearbook, 2014). This increase in total final energy consumption is projected to
reach 142MTOE by the year 2025 (Pakistan Integrated Energy Plan, 2013). Currently oil and natural
gas contribute about 74% of the total fuel mix with the share of 30% and 44 % respectively (Pakistan
economic survey 2014). The contribution of imported energy is around 30% of the total energy used
due to heavy reliance on oil by which 80% of the demand was met through imported crude and
petroleum products. Figure 4 shows electricity consumption during 2014 and it can be seen that
natural gas and oil was the primary source of electricity production.
Figure 4: Energy consumption by source during 2014 in Pakistan (Source: Pakistan
Energy Yearbook 2014)
2.1.1Pakistan Electricity Current Scenario
Pakistan faces chronic electricity shortages due to increasing in energy demand, no addition in
generation capacity, electricity theft, high system losses and seasonal reductions in the availability of
hydel power, circular debt. Etc. (Tahir Masood and Shah 2012). Power outages (load shedding) are
common and many villages are not yet electrified. Moreover, 45% of the population lacks access to
electricity (Javaid et al. 2005). The existing equipment is unable to handle high loads hence it results
in power breakdown. This situation of electricity outages has shaken the confidence of industrialists
in Pakistan because frequent power breakdowns and long hours of load shedding made it difficult
30%
44%
1%
9%
16%
Energy consumption by source during 2014 in Pakistan
Oil Gas LPG Coal Electricity

Page: 24 MASTERS OF SCIENCE IN RENEWABLE ENERGY DISSERTATION
MURDOCH UNIVERSITY
for the industry to remain competitive in international and local markets. There are several
examples where companies got bankrupt due to the energy crisis (Pakistan energy crisis 2013).
Several villages in Pakistan have a lack of access to electricity. Lack of access to sufficient energy
services is one cause of poverty, as energy choices of poor households are influenced by poverty.
Such kind of deprivations majorly impacts on rural households and women in particular (Lorde,
Waithe and Francis 2010). The use of biomass causes indoor pollution and affect human health
directly as management and collection of biomass not only cause health problems in women but
also consume time and energy.
In the past couple of years, 3000 MW of generation was added to the system but due to the large
quantum of suppressed demand which kept increasing every year has outpaced the newly added
capacity. As a result, the gap between supply and demand remain around 4000 MW – 5000 MW for
most of the time of year, please see figure 5. Most of the urban areas experience the load shedding
of up to 12 hours while the rural areas experience load shedding of 18-20 hrs every day (NY times,
2013).
Figure 5: Energy supply and demand graph
2.1.2 Electricity Generation Scenario
The power sector in Pakistan is a blend of thermal, hydro and nuclear power plants. Originally, the
ratio of hydel to thermal installed generation capacity, in the country was about 67% to 33% (1985).
However, with the passage of time, more thermal generation was added and thereby reducing the
share of hydel generation. Presently, this hydel to thermal installed generation capacity ratio turns
to about 29% to 67% (Energy Yearbook, 2014). As on June 30, 2014, The Installed power capacity of
Pakistan was 23,636 MW, of which 15,887 MW (67.22%) was thermal, 6893 MW (29.19%)

Page: 25 MASTERS OF SCIENCE IN RENEWABLE ENERGY DISSERTATION
MURDOCH UNIVERSITY
hydroelectric, 750 MW (3.17%) nuclear and 105.9 MW was the wind (Energy Yearbook, 2014). It is
not viable for a Country where power production dominated by thermal power plants running on oil
and gas. Pakistan heavily relies on the import of oil for its domestic energy requirement due to a
significant amount of oil-fired power plants.
The country meets its energy requirement of 41 percent by domestic gas, 19 percent by oil and 37
percent by hydroelectricity. Coal and nuclear contribution to energy supply are limited to 0.16 % and
3.17 % respectively with a vast potential for growth.
Figure 6: Electricity installed capacity
If this primary energy mix is compared with other peer groups then it is evident that coal does
contribute in filling part of the total energy mix in other countries, which is almost absent in the case
of Pakistan. Please refer to figure 7.
29%
21%
37%
9% 3% 1%
Electricity installed capacity
Hydel - WAPDA Thermal – WAPDA Thermal IPPs
Thermal KESE Nuclear (PAEC) Wind

Page: 26 MASTERS OF SCIENCE IN RENEWABLE ENERGY DISSERTATION
MURDOCH UNIVERSITY
Figure 7: Primary energy mix of different countries SOURCE (OICCI, 2012)
2.1.3 Electricity Generation by Sector and Source
During the fiscal year 2013-14, the total electricity generation in the country was 103,670GWh of
which the contribution of thermal electricity generation was 66,707GWh (64.35%), hydel power
plants were 31,873GWh (30.74%) (Energy Yearbook, 2014). The growing proportion of thermal
electricity generation increased the utilities financial burden, particularly in foreign exchange. It is a
strong need of the time to increase the hydel generation by adding new hydropower plants. The
share of the private sector is growing as compared to the public sector. Electricity generation by
source and sector during fiscal years 2008-09 to 2013-14 is shown in the following figure 8.
Figure 8: Energy Generation by Sector and Source (GWh) (NEPRA 2014)
2.1.4 Pakistan Power Demand Analysis By sector
The statistics show that the national grid electricity is available for the 70% of the population. At
present, 24.7 million consumers in different sectors of the economy are connected to the Power
sector of Pakistan (NEPRA 2014). Domestic sector is the largest consumer of the electricity followed
by the industrial, agricultural, commercial and others. The details regarding the sector-wise number
of consumers connected to national grid and consumption of electricity during the financial year
2013-14 are given in figure 9.
0
10,000
20,000
30,000
40,000
50,000
60,000
2008-09 2009-10 2010-11 2011-12 2012-13 2013-14
Energy Generation by Sector and Source
Public Sector Public (Hydel) Public (Thermal) Public (Nuclear)
Private Sector Private (Hydel) Private (Thermal)

Page: 27 MASTERS OF SCIENCE IN RENEWABLE ENERGY DISSERTATION
MURDOCH UNIVERSITY
Figure 9: Sectoral Energy Consumption of Pakistan during 2014 (Source: Pakistan Energy Yearbook 2014)
In underdeveloped countries, energy consumption of building sector share was recorded as 44% of
final energy consumption in 2006 - 07. Residential and commercial buildings together are the key
contributor to high energy consumption with 55% as shown in Figure 10. The amount of energy
consumption in the commercial and residential sector is projected almost to double in the year 2030
and would be a key contributor to final energy consumption in 2030. However, it may drop to 32% of
total final energy in 2030 (Ministry of planning and development Government of Pakistan 2011).
Figure 10 shows the electricity consumption by sectors in Pakistan. Here the increase in electricity
consumption is due to enhancement of comfort requirement, global climate change, growth in
population and time spent inside buildings (about 90% of our whole life) predicted the increasing
trend of consumption in building sector. Residential energy use is predicted to increase at an
average rate of 1.1 % every year from 2008 to 2035. Similarly, the growth in the commercial sector is
expected to rise at an average rate of 1.1 % annually from 2008 to 2035 (IEA 2012). Therefore, due
to increasing energy demands, environmental issues and energy price, the developed countries are
focusing on buildings sector as the greatest potential for energy savings. (BPIE 2011).
25%
4%
35%
2%
32%
2%
Sectoral Energy Consumption of Pakistan during 2014
Domestic Commercial Industrial Agriculture Transport Other Govt.

Page: 28 MASTERS OF SCIENCE IN RENEWABLE ENERGY DISSERTATION
MURDOCH UNIVERSITY
Figure 10: Sectoral Electricity consumption during 2014 (Source: Pakistan Energy Yearbook 2014)
2.1.5 Existing Grid Infrastructure
In Pakistan, there are two companies which are presently engaged in the business of electric power
transmission. One is National Transmission and Dispatch Company Limited and the other is Karachi
Electric Supply Company Limited. National Transmission and Dispatch Company Limited is the
National Grid Company of Pakistan and is accountable for electric power transmission in the whole
country except for the area functioned by Karachi Electric Supply Company Limited. NTDC is a public
sector company and was established as a result of the restructuring of WAPDA in 1998 and then has
succeeded in obtaining a transmission license by NEPRA in 2002. NTDC is in-charge for reliability,
planning and coordination of the electricity in Pakistan except for the area under Karachi Electric
Supply Company Limited. At present, NTDC owns a network of 500 kV, 200 kV and some 132 kV links
transmission lines and grid stations in its network.
Besides NTDC, the company which is engaged in electricity power transmission business of Pakistan
is Karachi Electric Supply Company Limited. K-Electric is a vertically integrated company operating in
the private sector. Earlier the company was in the public sector and responsible for generation,
transmission and distribution of electric power in its area. Later-on, K-Electric was privatized as a
single vertically integrated electric power utility. KE at present has three separate licenses; one for
their generation business, second for the distribution of electricity in its designated area and third is
for their transmission network. The transmission network of KESC is connected to the national grid
of the country by 220 kV and 132 kV links.
1% 8%
47%
5%
10%
29%
Pakistan Sectoral Electricity usage by type
street light traction other govt. commercial
domestic bulk supplies
agriculture industrial

Page: 29 MASTERS OF SCIENCE IN RENEWABLE ENERGY DISSERTATION
MURDOCH UNIVERSITY
2.2 The Importance of Energy Conservation and Energy Efficiency In the past few decades, the increase in climate change and rise in oil prices impacted the economy
and environmental concerns in Pakistan.
So here is how we define energy efficiency and energy conservation
Energy efficiency means using less energy to achieve the same objective
Energy conservation refers to reducing energy consumption by using less of an energy
service
Energy conservation and energy efficiency are the most valuable, cheapest, fastest and
environment-friendly strategies to reduce the climate change and dependency on other dirty,
polluting sources for energy production.
2.2.1Pakistan Energy Conservation potential and Efficiency Strategy
According to a report by Zia, there is a real potential for energy conservation in different sector of
Pakistan. The highest potential of energy saving is in building sector see Table 1(source: Zia, 2011)
Table 1: Energy conservation potential by sector (Zia, 2011)
The government should promote improvements in energy efficiency by identifying principal
measures by sectors, policy instruments and assigning responsibility for the actions to be taken.
Ministry of energy should focus on two strategies for action. The first strategy includes the
maintaining of energy security of energy supplies and it can be accomplished by reducing demand
and peak load. The second strategy involves the investment in energy efficiency measures which are
cheaper in the longer run than the cost of building extra network and generation capacity.
Every process from paper manufacturing to cloth dyeing to food processing requires a substantial
amount of produced energy. Improving our energy usage reflect the less amount of energy
production but the current energy use in Pakistan is not even near to be efficient. Hence, Pakistan
needs a resilient, reliable and inexpensive energy system. Energy efficiency is important part of
achieving these goals and energy efficiency measure includes:
Enhancing security of supply by decreasing the marginal gap between energy demand and
supply during peak times.
sector conservation potential
Industry 25%
Transport 20%
Agriculture 20%
Building 30%
Average 25%

Page: 30 MASTERS OF SCIENCE IN RENEWABLE ENERGY DISSERTATION
MURDOCH UNIVERSITY
By enabling environmental and economic resources to be used more efficiently.
By reducing greenhouse gas emissions from the production and usage of energy.
By reducing energy cost.
By increasing public awareness of the issues of current unsustainable energy use pattern and
energy efficiency measures.
The present measure of promoting and encouraging energy efficiency in the stationary energy sector
is centered on products, buildings, houses and industries (excluding transport), star rated appliances
and efficient wirings in low-income households.
Enercon should carry out an economic evaluation of the barrier of implementing energy-
efficient technologies in commercial buildings.
Moreover, these energy efficient measures should include replacement of incandescent
lamps to new compact fluorescent lamps (CFL). Also, the mercury pollution after they get
fused should also be considered.
Utility companies should encourage people to use solar water heating to strengthen local
industry by designing finance assistance programs.
The building codes must be reviewed to achieve significant efficiency improvements in the
building.
Ministry of energy should emphasize to enforce minimum energy performance standards
and labeling program which should include appliances and machinery.
Enercon program should provide the energy audit grants and support to the largest energy
consumers in the country.
Market forces, government policies and public acceptance to deploy those technologies
which are especially suited to Pakistan situation, change behavior around technology
investment decision and consumer lifestyle choices, consideration in the upgrade and
design management of building and infrastructure.
ENERCON under the supervision of the Ministry of Energy should analyse potential energy
efficiency measures, which reflect a wider range of benefits. The perspective of co‐benefits,
such as reduced greenhouse gas emissions is significant inputs into the assessment of the
net benefits of government interventions.
2.2.2 Barriers in Improving Energy Efficiency in Pakistan
A nation cannot become energy efficient overnight, it is a slow process that is influenced by a
multitude of social, financial, economic and political consideration. While large numbers of hurdles
have to achieve the drive towards energy efficiency, it is entirely possible to make significant gains in
Page: 31 MASTERS OF SCIENCE IN RENEWABLE ENERGY DISSERTATION
MURDOCH UNIVERSITY
a relatively short time. Barriers which slow down the rate of improvement in energy efficiency in
Pakistan are mentioned as follows
Access to capital for initial investment in energy efficiency
Lack of reliable knowledge on cost and benefits which don’t reflect the actual cost
Weak energy prices signal which don’t significantly encourage some businesses and
households
Absence of any appropriate incentive schemes for landlords, builders and architects
Price distortion and market organization prevent investor from appraising true value of
energy efficiency
Split incentive programs
Dispersed benefits and upfront cost discourage the investor
Perception of risk, complication and high cost
Lack of awareness of financial benefits
2.2.3 Options to Meet Future Energy Needs
With the progress and development in public and private sectors in the country and improvement of
living standards of general public, energy demand has significantly increased. Present energy
scenario manifest that existing power generation capacity of installed projects is not able to meet
the increasing energy demand. Therefore one option is to keep expanding its power generation
capacity and distribution infrastructure by supplementing restricted public resources with
substantial private sector involvement and foreign investments, while at the same time planning a
sustainable continuing strategy that optimizes the use of inexpensive energy choices with minimal
financial and economic impacts. In this respect, technologies that are commercially competitive,
such as gas-fired combined-cycle plants, coal power plants, large and small hydel power stations,
alternative and renewable energy power plants (including the wind and solar), assume increasingly
important roles.
In the case of Pakistan, the renewable resources which are technologically feasible and has
prospects to be exploited commercially include wind energy, micro-hydel, solar energy and
bioenergy. Such availability of diverse power resources not only helps in decreasing dependence on
vulnerable energy resources but also contribute to explore sustainable and secure energy resources.
In this situation government leadership and action from individuals and firms would largely be
needed to improve energy efficiency. People will be able to make more cost-effective choices if they
are given the right information about when and which product to choose and incentive to encourage
people to minimize costs over the life cycles of their assets, rather than just an initial cost, will also

Page: 32 MASTERS OF SCIENCE IN RENEWABLE ENERGY DISSERTATION
MURDOCH UNIVERSITY
improve the energy efficiency. One of many solutions to reduce the burden on Pakistan economy is
to develop national conservation and energy efficiency policy structure. This solution would include
the regulatory framework, demand & supply program and building codes. Several other
consideration includes
Government Leadership Focus
The government can play its role to encourage people to take energy efficiency and
conservation measures to use renewable resources. This program should include
ministries and department whose focus should be on four key areas
o Transport
o Buildings
o Recycling waste
o Office equipment
Information and Labeling
Labeling of existing appliances and home energy rating scheme should help people
to make better energy choices and provide a basis for minimum performance
standards and incentives. For newly constructed buildings and other long-lived
assets where energy is locked in for decades, it is essential that high-quality
information and analysis support design decision. This ongoing review of the
building code and the use of best practice standards will improve design decision at
low transaction cost. The energy industry and equipment supplier can help the
consumer make even better choices in future, provided that they have a clear driver
to do so. The government can also assist the consumer to make a cost-effective
investment by providing independent information and maintaining programs that
demonstrate the importance of new technologies and energy efficient assets.
Government support for information and monitoring initiatives is justified when
initiative also offer significant social and health benefits.
Institutional Issues
Those government agencies that support improved energy efficiency in the
stationary demand sector should include the ministry of environment (ENERCON),
the ministry of power and water(PEPCO) and ministry of natural resources and
petroleum (SNGPL, SSGC). The common objective of the efficiency policy and
national energy conservation would be to promote the use of efficient and
environment sustainable energy production. Ministry of the Environment should be
accountable for delivering the energy efficiency programs and providing the

Page: 33 MASTERS OF SCIENCE IN RENEWABLE ENERGY DISSERTATION
MURDOCH UNIVERSITY
professional advice to government on how to use energy efficiently. Ministry of
energy should be responsible for the implementation of policy programs and
initiatives to ensure the energy production and delivery are efficient reliable and
environmentally sustainable manner. National energy conservation agency should
develop a memorandum of understanding setting out the way it will work and
manage areas that overlap between various ministries and regulators. Private firms
must be applaud and efforts showcased for investing In a measure to help
consumers become more energy efficient. Local government will need to play a
major role in implementing policy and programs which include the administration of
building codes and making a decision on urban form and transport planning.
Pakistan can achieve significant energy saving through simple conservation and
efficiency programs. The cost of such initiatives would be much lower than setting
up new power plants.
Pricing Mechanisms
Accuracy in pricing mechanics is necessary to signal the actual cost of energy supply.
The current pricing strategy of fuel does not consider the cost of (GHG) Greenhouse
gas emissions, however, the energy efficiency initiative set out in the integrated
energy plan can help reduce the impact on power bills. Currently, smaller electricity
consumers households do not have technologies such as smart meters to enable
time of use electricity pricing. The government should propose the ministry of
energy to proved the estimates of future pricing to help individuals and firms to
make a decision on investing in energy-intensive plant and equipment.
Standards
It is the government’s duty to set up minimum standards for the market to deliver a
solution with net public benefits. There are existing minimum energy performance
standards at this point of sale for some appliance and building construction. The
government should empower ministry of environment to implement energy
conservation and efficiency by updating the national energy savings policy which
should also include several new products classes and make compliance levels for
existing products classes more stringent.
Incentives
The government should introduce a direct financial incentive for investment in
energy efficiency that offers significant net public benefits and must not be viable
without government support. The government should actively participate in

Page: 34 MASTERS OF SCIENCE IN RENEWABLE ENERGY DISSERTATION
MURDOCH UNIVERSITY
improving residential energy efficiency by providing interest-free loans and grants
for clean heating, insulation and solar hot water. For businesses, subsidies and grant
programs to upgrade the industrial equipment must be expanded . in the rural
sector distributed hybrid power and bio-energy power generation should be
promoted through the auspices of the ministry of energy.
Building energy codes and standards
One of the many strategies of energy conservation is by building energy
conservation codes and standards (BECC). Several countries around the world have
designed and adopted the energy conservation standard for building, for instance,
Dutch government aim to reduce energy usage by 50% from existing buildings by
2020 (Hoppe, Bressers and Lulofs 2011). Moreover, European Union seeks to reduce
20% from total building consumption by 2020 (The European economic and social
committee 2011). According to Zainordin, the estimated saving of 30% or more from
conventional building design can be achieved through the design of the smart
building (Zainordin, Abdullah and Baharum 2012).
Figure 11 illustrate the comparison of energy consumption before the
implementation of building energy codes with the consumption after
implementation of the codes in Denmark (Lausts 2008). Reduction in energy
consumption can be seen clearly after the implementation of these codes.
Figure 11: Houses existing energy consumption versus energy consumption after
implementing building energy codes in Denmark
Every building can be classified into number of energy system which includes:

Page: 35 MASTERS OF SCIENCE IN RENEWABLE ENERGY DISSERTATION
MURDOCH UNIVERSITY
building envelope (location, type and geometry)
water heating
lighting
electrical and mechanical system
Heating, ventilation and air-conditioning
ENERCON (National Energy Conservation Centre) has been mandated by the Government of
Pakistan to work as a national coordinator for energy policy and conservation measures.
ENERCON with Pakistan Engineering Council designed the building codes of Pakistan by
reviewing 90.1 ASHARE standards (ENERCON 2011). These provisions mainly focus high-end
commercial and domestic users for energy conservation. Building with the total load of
100kW or greater, or 125kVA or more, or unconditioned building with a covered area of
1200 square meter, or conditioned area of 900 square meters are included in this provision.
These standards are designed to influence building construction and design as well as high
energy consuming equipment installed in buildings. However, the success of this initiative is
principally a function of how to effectively administered. Developing standards are not
effective if the implementation of these standards is not supported by technical and
administrative staff. Surprisingly the current practicing engineers and architects are not
exposed to fundamentals of energy efficient design.
Effective implementation and development of energy efficiency codes – legislation to
promote energy efficiency in the country can play a critical role towards meeting energy
needs in the country. This should include building energy codes, standardization and labeling
of electrical appliances, equipment and machinery. A report published during 2015
mentioned that Pakistan is only the halfway operation of building codes hence it is essential
to facilitate assured operation for revised BEC of Pakistan. To produce an effective building
code, it is necessary that design should base on keeping legal requirements in the design
phase and contractors procure and construct under accredited design diagram in the
construction phase. The technical expert should support to facilitate implementation
organization including checking system (National Energy Conservation Centre 2015).
Therefore, to integrate energy efficient practices into the design and construction of
buildings so that truly energy efficient facilities can be produced on a routine basis and
existing ones modified to perform better. It is crucial to recognize that the infusion of new
professionals and the corresponding impact they make on society takes anywhere from ten

Page: 36 MASTERS OF SCIENCE IN RENEWABLE ENERGY DISSERTATION
MURDOCH UNIVERSITY
to twenty years. s. As it is hard to have energy efficient technologies and practices adopted
in buildings, they are of utmost importance because construction decisions made today will
affect energy consumption for the next 5-10 years
Further, public awareness campaigns are necessary so that the people know about the new
regulations. Also, there is the issue of whether practicing professionals can design energy
efficient facilities in compliance with the new codes.
2.3 Case Study: Namal College
2.3.1 College Overview
Namal College is an associate of Bradford University (United Kingdom) and was inaugurated by
Imran Khan (former cricketer) in 2008 following two years of the construction period. This project
was undertaken to facilitate student of rural areas to get an international standard education.
Initially, this college was offering diplomas to the students then the idea of upgrading this college to
a university was initiated by a delegation from Bradford University UK. Namal becomes an associate
college of Bradford University in 2009 and launched undergraduate programs in the engineering of
electrical, electronics and computer science. The next plan of 2020 is of setting up six different
schools that will constitute knowledge city. These schools will include a school of science in
engineering, school of business, school of agriculture, school of humanities, school of medicine,
school of agriculture, science & technology and a technology park.

Page: 37 MASTERS OF SCIENCE IN RENEWABLE ENERGY DISSERTATION
MURDOCH UNIVERSITY
Figure 12: Namal college building (source: Namal College website)
Currently, this college comprises of one building which includes, classrooms, lecture theaters, labs,
library, sports facilities, mosque, e.t.c and it fulfill all of its energy needs from the grid electricity and
by two diesel generators. This college is located in a rural area of Mianwali district and electricity
load-shedding of several hours is very common in these areas. This college claims that almost 90%of
the students get partial or full financial assistance from the College for their studies (Source: Namal
College website).
The significant increase in electricity consumption every year, the high volatile prices of electricity
and diesel fuel is a considerable burden on the financial budget and it can be reduced by using
energy conservation strategies with the mix of renewable technologies. such techniques can also
help the energy shortage situation with the help of renewable source such as solar PV.
The college needs most of the electricity during day time so providing electricity to offset diesel
consumption through a solar source seems like a feasible option.
2.3.2 Location and Demography
Namal College is situated at 32° 40' 52.7484''N and 71° 47' 30.894''E in Namal Valley, which is almost
32 kilometer from Mianwali city. This valley is nestled between salt range and Koh-e-Suleiman along
the border area of Khaybar Pakhtunkhwa and Punjab province. The economy is mainly agrarian with
livestock and farming, dominating the economic activity in this area. (Source: Namal College
website). The total land area acquired by Namal education foundation is about 1000acres on the
western side of Namal Lake while the college is constructed on the foothill of a scenic mountain with
a land covering an area of 60,000 square feet. Figure 13 shows the satellite image of the currently
covered land area of this college, highlighted by red points.

Page: 38 MASTERS OF SCIENCE IN RENEWABLE ENERGY DISSERTATION
MURDOCH UNIVERSITY
Figure 13: Satellite image of total building area of Namal College (Source: Google map)
I do not have to re-emphasize anymore that our country is challenged with serious energy crises
situation. Hence It is important to have detail assessment of where and how energy is being used in
this building and examines measures such as, lighting systems, load profiling, heating, electricity
usage and tariffs, ventilation and air conditioning and specific high consumption electric devices and
services. Such activity of assessment is called energy audit.
2.4 Energy Audit
An energy audit "involves an analysis of a facility to determine the forms of energy used, the
quantities and costs of the various forms of energy used, the purposes for which the energy is being
used and the identification of energy conservation opportunities (Henry 1980). An energy audit is
not a new process; this procedure was first used in the early 1970s in the United States during
the energy crisis (The history of energy efficiency 2013).
The aim of an energy audit is to identify and develop a modification to reduce energy use and cost of
operating a building. It is designed to investigate when, where why and how energy is being utilized
in a facility. An energy audit facilitates in energy cost optimization, pollution control, safety aspects
and suggest the methods to improve the operating & maintenance practices of a building. It is
helpful in managing the situation of variation in energy cost, the reliability of energy supply, the
decision on appropriate energy mix, the decision on using improved energy conservation equipment,
instrumentations and technology (Thumann, Niehus and Younger 2013).
Process of energy audit typically involves
North

Page: 39 MASTERS OF SCIENCE IN RENEWABLE ENERGY DISSERTATION
MURDOCH UNIVERSITY
Collection and analysis of historical energy use
Building operational characteristics
Identification of potential solution that helps in reducing energy consumption
Perform economic and engineering analysis of potential solutions
The main strength of an energy audit is that it permits to adopt a strategy for managing our energy
use and helps us identify and prioritizes the energy program that needs to be implemented. An audit
tells us where we are, what we should focus on first and what environmental and cost benefits of an
energy audit. The implementation of recommendation include;
Reduce energy consumption and energy cost.
Establishment of carbon footprint and reduced greenhouse gas emissions.
Reduce operating and maintenance cost.
Improved assess value and performance.
Establishment of performance benchmarks.
Raised awareness of energy issues amongst staff.
There are three levels of effort in performing energy auditing and each stage differs in the degree of
complexity. These levels are usually organized as follows:
(i) Preliminary Energy Use/ Audit of Historical Data.
STAGE 1 Audit of Historical Data
• Collect and analyze utility data
• Assess energy efficiency improvement potential
• Visually inspect building and key systems
STAGE 2 Screening Survey
• Interview building staff
• Evaluate utility and site data
• Analyze energy and cost savings
STAGE 3: Detailed Energy Audit
• Develop simulation tool
• Summarize findings
• Present recommendations
Page: 40 MASTERS OF SCIENCE IN RENEWABLE ENERGY DISSERTATION
MURDOCH UNIVERSITY
This analysis is the first step in the auditing process. It includes an examination of the
facility’s historical energy consumption and performing a utility rate analysis to point out
any cost saving opportunities and to report low or no cost measure and potentials to capital
improvement for further study. This is the simplest type of energy audit and it also requires
the site visit by an engineer and walking through the building and concentrating on the
major energy consuming equipment, for instance, HVACs, electric ballast. Reference to a
record of equipment operation and maintenance manual, equipment ratings to quickly
determine which systems or appliances are working correctly to report low or no cost
measure and potentials to capital improvement for further study. During a preliminary audit
of Namal College, the electricity and power blueprints, air condition blueprints, Utility bills
and operation logs for the year of preceding audit, occupancy profile and equipment ratings
were collected to identify the major electricity consuming appliances.
(ii) Walk-Through Analysis/ Screening Survey
This type of audit involve the preliminary energy use analysis and also more detailed energy
calculation and financial analysis of purposed energy efficiency measures. The duty of audit
team/person is to identify truly and understand the overall benefits of installing energy
efficient measures. This audit stage goes much beyond the walk through audit and gives an
immediate information about the possible opportunities to reduce energy costs, energy
wastage to improve overall efficiency. Here auditor has exercised more detailed planning
after familiarizing with the building. The building consumption is divided into three-floor
zones. At this stage, the current building condition was assessed for any inefficiency in
energy usage, air leakages, poor operational process and potential energy waste. The
anomalies between energy usage concerning months and years were also observed.
(iii) Detailed investigation and analysis.
This analysis is a further expansion from the previous two levels of efforts and is based
on more detailed and deeper analysis of selected solution. It includes further refinement
of energy model or more extensive data collection, involves smart metering of particular
equipment over a week or two to see total consumption, peak consumption, off-peak
consumption, max demand and power factor.
2.4.1 Pre-Audit
The questionnaire was prepared for pre- audit analysis. Summary of questionnaire is mentioned as
follows

Page: 41 MASTERS OF SCIENCE IN RENEWABLE ENERGY DISSERTATION
MURDOCH UNIVERSITY
2.4.1.1 Questionnaire for Pre-auditing
General Information
Building name
Type of building
No of floors
Land covered area
Person who is conducting audit
Dates of audit
Areas covered for auditing
Daily occupancy hours
Namal College
Educational Institute
3, basement, ground, first floor
26,000 feet²
Fahad Saleem
21-25 December 2015, 27-29 July 2016
All areas
9 am to 5 pm
Electrical Equipment
Equipment turned off when unused (pumps, fans, motors, computers)
Equipment turned off at the end of the day(photocopier, printers, lab equipment)
Electrical Kettles overfilled with water
Standby setting avoided (printers, LCSs, Monitors)
Fridge thermostat temperature
Kitchen equipment turned off after using (microwave, dishwasher)
Class Room/lecture theater Equipment with single combined switch
Switches clearly labeled
Fridge placement near to heat source
Timers on water cooler
Photocopiers placement in ventilated area
Refrigerant leakage checks
Refrigeration, condenser, evaporators, insulation checks and service
Yes
Yes
No
Yes
4 deg.
No
No
No
No
No
Yes
Yes
Yes
Lighting
Lights switched off when unused
Lights usage in enough sunlight
Lights/fitting cleaning
Exterior lighting turned off at unattended areas/ daytime
Automatic light controls on intermittently occupied areas
Tungsten lights usage
Clearly labeled switches of each light
Windows cleaning to increase daylight usage
Lighting power density
Yes
Yes
No
Yes
No
Yes
No
Yes
vary
Heating, Cooling, Air-conditioning and Ventilation
Boiler control and settings
Use of heater and air-condition at the same time
Boilers service and maintenance
AC thermostat temperature
Portable heaters/electric heater
Hot water provision
Yes
No
Yes
26 degree
Electric heaters
Electric

Page: 42 MASTERS OF SCIENCE IN RENEWABLE ENERGY DISSERTATION
MURDOCH UNIVERSITY
Door windows closed during heater or A/C working
Heavy air leakage from door or windows seals
Windows Glazing
Blinds and curtains closed at the end of the day during winters
Unnecessary A/C usage in unused spaces, corridors, cupboards
Use of natural ventilation. Opening windows overnight in summer
Geyser
Yes
No
Single glazed
No
No
No
Water Usage
Push button taps
Water overflow
Taps maintenance/ no dripping taps
Water leakage
Any Water saving encouragement strategy
No
No
On time
No
No
Metering
Meter maintenance
Meter location
No. of meters
Yes
Beneath the transformer
One analog electricity meter
2.4.2 Walkthrough Audit and Detailed Investigation
2.4.2.1 Historical Energy Consumption Patterns
At this stage energy sources and consumption pattern have been observed for this college and
saving measures were proposed. It was found that primary energy sources are grid electricity and
electricity from diesel generators.
Grid Electricity Consumption
Figure 14 shows the monthly electricity consumption from the grid at Namal College from June 2015
to May 2016 and clear anomalies can be observed here. After discussion with relative personal, it
was revealed that the reason for low energy consumption during June, July and August is due to the
semester break holidays of regular full-time students and high power outages, which mean high
reliance on diesel. However, there are still limited summer classes taking place during this period.
This is the reason still some electricity consumption can be seen during these months.
In the month of May and January, the highest electricity consumption can be due to the semester
final examination and the presence of full students strength. Also, the summer season in Pakistan
starts from the month of May. Hence, the electricity load increases due to increase in the use of
cooling equipment and similarly the cold weather is at its peak during January so the increase in load
could be due to the increase in the use of electrical heating equipment.

Page: 43 MASTERS OF SCIENCE IN RENEWABLE ENERGY DISSERTATION
MURDOCH UNIVERSITY
Figure 14: Monthly peak load profile from June 2015- May 2016
The typical load profile of this college can be seen in figure 15. It is evident that the electricity
consumption is high from 10 am to 1 pm on weekdays when most of the classes are in progress.
Figure 15: Daily load profile
Electricity Tariff
The college building has one electricity meter which is billed under a contestable time of use
demand-based tariff. This meter is monitored via Faisalabad Electric Supply company (FESCO). Such
tariffs have a higher rate of electricity during peak periods while cheap rates are during off peak
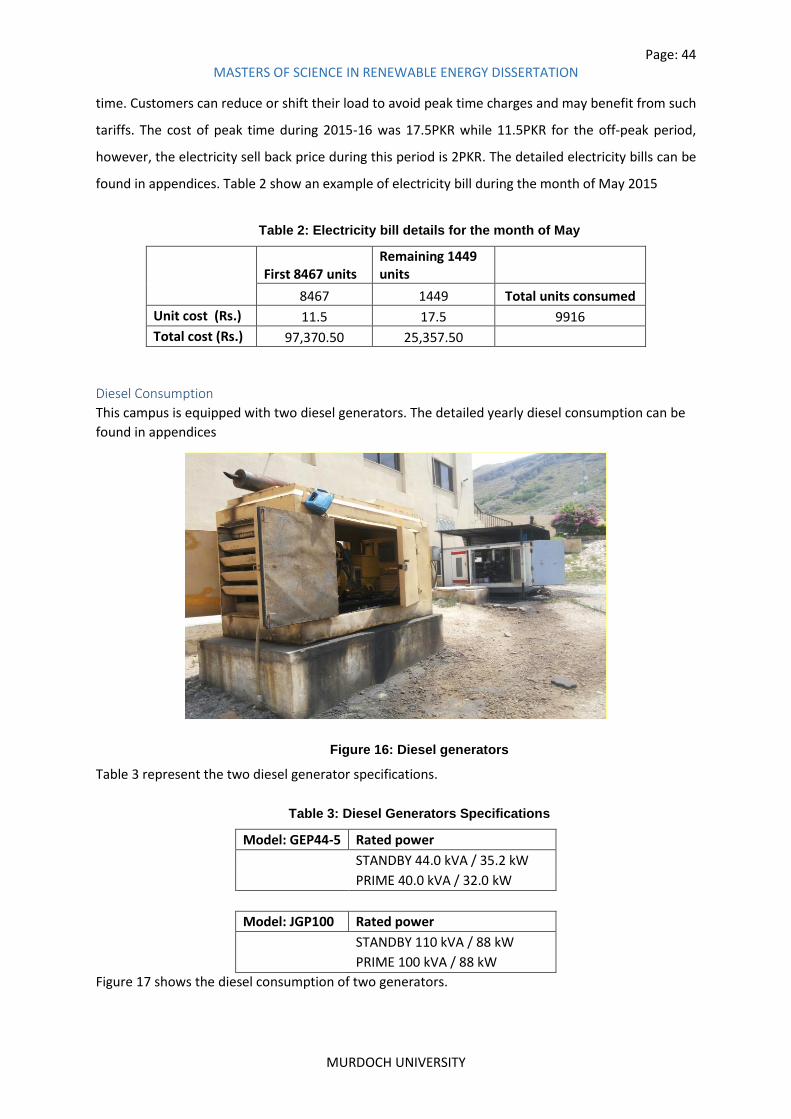
Page: 44 MASTERS OF SCIENCE IN RENEWABLE ENERGY DISSERTATION
MURDOCH UNIVERSITY
time. Customers can reduce or shift their load to avoid peak time charges and may benefit from such
tariffs. The cost of peak time during 2015-16 was 17.5PKR while 11.5PKR for the off-peak period,
however, the electricity sell back price during this period is 2PKR. The detailed electricity bills can be
found in appendices. Table 2 show an example of electricity bill during the month of May 2015
Table 2: Electricity bill details for the month of May
First 8467 units
Remaining 1449 units
8467 1449 Total units consumed
Unit cost (Rs.) 11.5 17.5 9916
Total cost (Rs.) 97,370.50 25,357.50
Diesel Consumption
This campus is equipped with two diesel generators. The detailed yearly diesel consumption can be
found in appendices
Figure 16: Diesel generators
Table 3 represent the two diesel generator specifications.
Table 3: Diesel Generators Specifications
Model: GEP44-5 Rated power
STANDBY 44.0 kVA / 35.2 kW
PRIME 40.0 kVA / 32.0 kW
Model: JGP100 Rated power
STANDBY 110 kVA / 88 kW
PRIME 100 kVA / 88 kW
Figure 17 shows the diesel consumption of two generators.
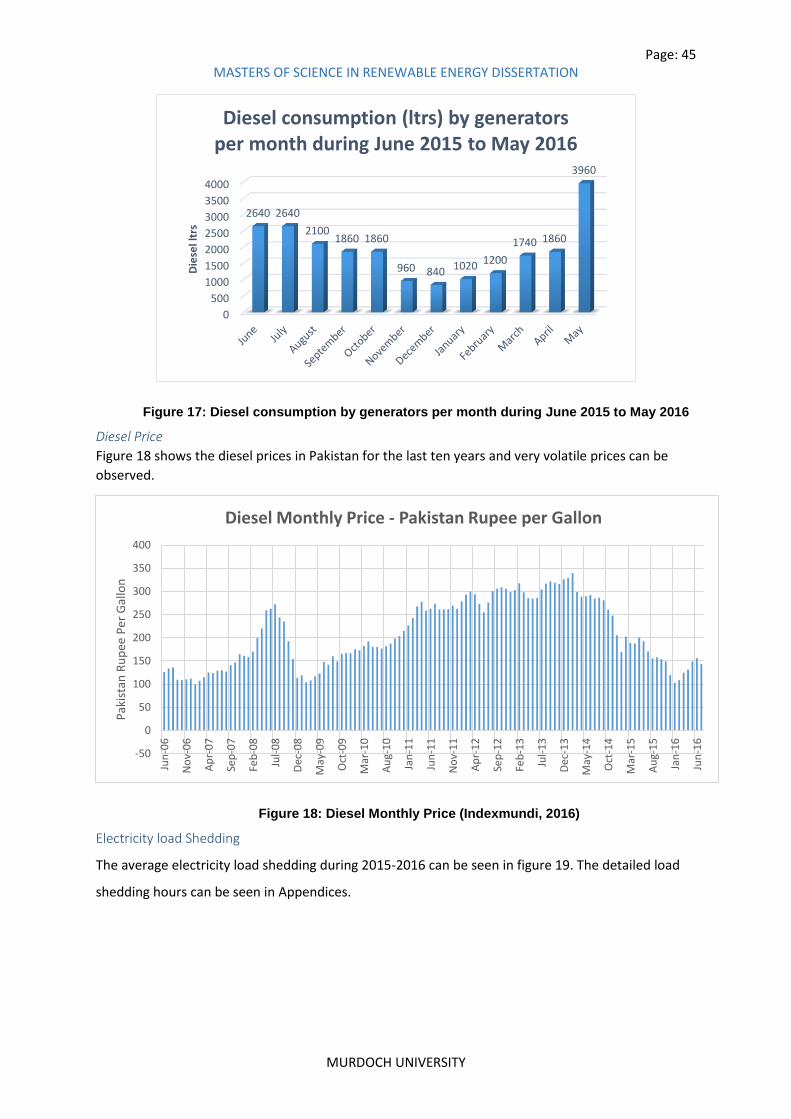
Page: 45 MASTERS OF SCIENCE IN RENEWABLE ENERGY DISSERTATION
MURDOCH UNIVERSITY
Figure 17: Diesel consumption by generators per month during June 2015 to May 2016
Diesel Price
Figure 18 shows the diesel prices in Pakistan for the last ten years and very volatile prices can be
observed.
Figure 18: Diesel Monthly Price (Indexmundi, 2016)
Electricity load Shedding
The average electricity load shedding during 2015-2016 can be seen in figure 19. The detailed load
shedding hours can be seen in Appendices.
0
500
1000
1500
2000
2500
3000
3500
4000
2640 2640
2100 1860 1860
960 840 1020 1200
1740 1860
3960
Die
sel l
trs
Diesel consumption (ltrs) by generators per month during June 2015 to May 2016
-50
0
50
100
150
200
250
300
350
400
Jun
-06
No
v-0
6
Ap
r-0
7
Sep
-07
Feb
-08
Jul-
08
Dec
-08
May
-09
Oct
-09
Mar
-10
Au
g-1
0
Jan
-11
Jun
-11
No
v-1
1
Ap
r-1
2
Sep
-12
Feb
-13
Jul-
13
Dec
-13
May
-14
Oct
-14
Mar
-15
Au
g-1
5
Jan
-16
Jun
-16
Pak
ista
n R
up
ee P
er G
allo
n
Diesel Monthly Price - Pakistan Rupee per Gallon

Page: 46 MASTERS OF SCIENCE IN RENEWABLE ENERGY DISSERTATION
MURDOCH UNIVERSITY
Figure 19: Average daily load shedding hours
2.4.2.2 Occupancy Profile
The total number of occupancy strength including regular faculty, students and others were 520
during 2015-16.
Daily Profile
Daily classes start from 9 am and finish at 5 pm while the cleaning staff stays until 7 pm.
Table 4: Daily occupancy profile
Weekly Profile
Weekdays include Monday till Friday while the weekend is Saturday and Sunday and college remains
closed during weekends.
6
5
4
4
4
2
3
3
3
4
6
11
NU
MB
ER O
F H
OU
RS
AVERAGE DAILY LOADSHEDDING HOURS
100%
75%
50%
25%
0% 7am 9am 11am 1pm 3pm 5pm 7pm
Daily profile
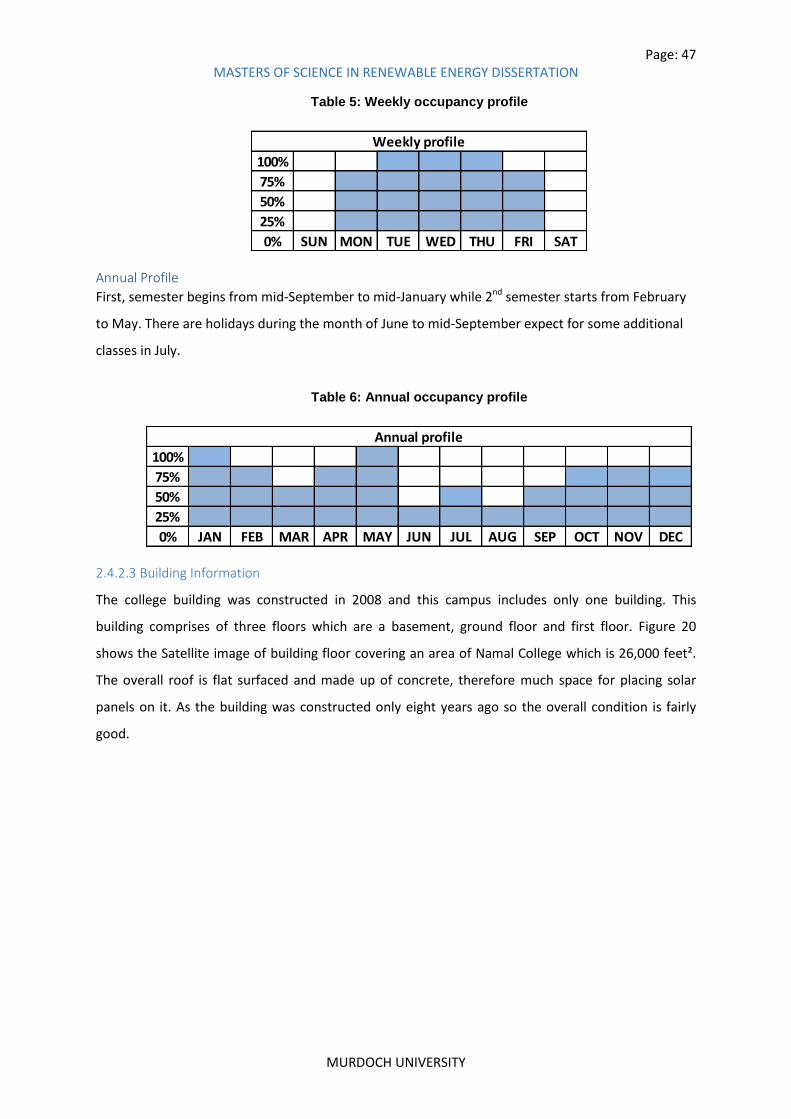
Page: 47 MASTERS OF SCIENCE IN RENEWABLE ENERGY DISSERTATION
MURDOCH UNIVERSITY
Table 5: Weekly occupancy profile
Annual Profile
First, semester begins from mid-September to mid-January while 2nd semester starts from February
to May. There are holidays during the month of June to mid-September expect for some additional
classes in July.
Table 6: Annual occupancy profile
2.4.2.3 Building Information
The college building was constructed in 2008 and this campus includes only one building. This
building comprises of three floors which are a basement, ground floor and first floor. Figure 20
shows the Satellite image of building floor covering an area of Namal College which is 26,000 feet².
The overall roof is flat surfaced and made up of concrete, therefore much space for placing solar
panels on it. As the building was constructed only eight years ago so the overall condition is fairly
good.
100%
75%
50%
25%
0% SUN MON TUE WED THU FRI SAT
Weekly profile
100%
75%
50%
25%
0% JAN FEB MAR APR MAY JUN JUL AUG SEP OCT NOV DEC
Annual profile

Page: 48 MASTERS OF SCIENCE IN RENEWABLE ENERGY DISSERTATION
MURDOCH UNIVERSITY
Figure 20: Building floor area covering (source: Google maps)
Building Architectural Design/Floor Analysis
All three floors basement, ground floor and first floor cover the equal area of 26,000 feet². The
basement floor mostly consists of cafeteria and offices. The ground floor includes staffrooms, lecture
rooms and library. The first floor mainly comprises of labs and classrooms. More details of each
room with their sizes and seating capacities are mentioned in the tables as follows. The interior walls
of this building have significantly low insulation comparative to outer walls. Due to low internal heat
transfer resistance of interior walls and open floor layout, this building is equipped with the single
zone air-conditioning system.
This building is erected in a way to advocate the solar techniques in particular hence it makes this
building attractive for both active and passive solar application. It was constructed with the front
facing north and rear facing south. This southern facing area allows sunlight to penetrate for solar
heat gain inside the building which is beneficial especially during the winter season.
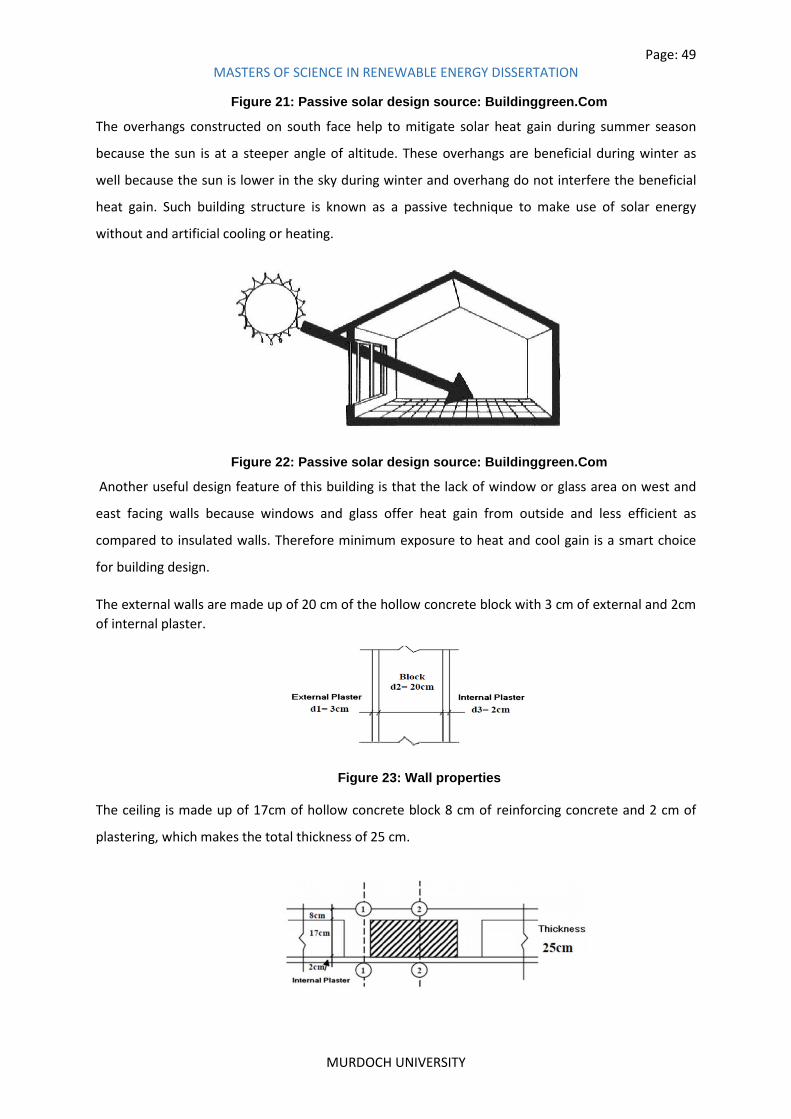
Page: 49 MASTERS OF SCIENCE IN RENEWABLE ENERGY DISSERTATION
MURDOCH UNIVERSITY
Figure 21: Passive solar design source: Buildinggreen.Com
The overhangs constructed on south face help to mitigate solar heat gain during summer season
because the sun is at a steeper angle of altitude. These overhangs are beneficial during winter as
well because the sun is lower in the sky during winter and overhang do not interfere the beneficial
heat gain. Such building structure is known as a passive technique to make use of solar energy
without and artificial cooling or heating.
Figure 22: Passive solar design source: Buildinggreen.Com
Another useful design feature of this building is that the lack of window or glass area on west and
east facing walls because windows and glass offer heat gain from outside and less efficient as
compared to insulated walls. Therefore minimum exposure to heat and cool gain is a smart choice
for building design.
The external walls are made up of 20 cm of the hollow concrete block with 3 cm of external and 2cm
of internal plaster.
Figure 23: Wall properties
The ceiling is made up of 17cm of hollow concrete block 8 cm of reinforcing concrete and 2 cm of
plastering, which makes the total thickness of 25 cm.
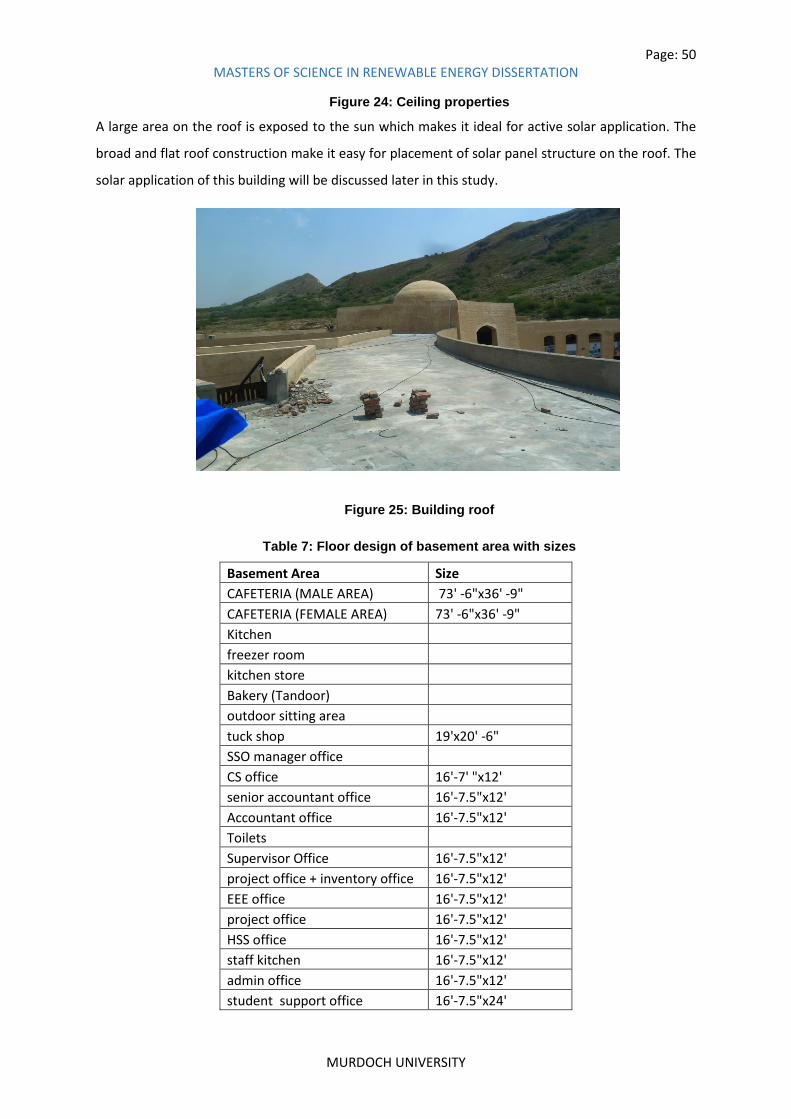
Page: 50 MASTERS OF SCIENCE IN RENEWABLE ENERGY DISSERTATION
MURDOCH UNIVERSITY
Figure 24: Ceiling properties
A large area on the roof is exposed to the sun which makes it ideal for active solar application. The
broad and flat roof construction make it easy for placement of solar panel structure on the roof. The
solar application of this building will be discussed later in this study.
Figure 25: Building roof
Table 7: Floor design of basement area with sizes
Basement Area Size
CAFETERIA (MALE AREA) 73' -6"x36' -9"
CAFETERIA (FEMALE AREA) 73' -6"x36' -9"
Kitchen
freezer room
kitchen store
Bakery (Tandoor)
outdoor sitting area
tuck shop 19'x20' -6"
SSO manager office
CS office 16'-7' "x12'
senior accountant office 16'-7.5"x12'
Accountant office 16'-7.5"x12'
Toilets
Supervisor Office 16'-7.5"x12'
project office + inventory office 16'-7.5"x12'
EEE office 16'-7.5"x12'
project office 16'-7.5"x12'
HSS office 16'-7.5"x12'
staff kitchen 16'-7.5"x12'
admin office 16'-7.5"x12'
student support office 16'-7.5"x24'

Page: 51 MASTERS OF SCIENCE IN RENEWABLE ENERGY DISSERTATION
MURDOCH UNIVERSITY
Lawn
corridor
electric room
lobby
Figure 26: Architectural design of basement level
Table 8: Floor design of Ground area with sizes and capacity
Ground floor Size Capacity
LECTURE ROOM 34' X 24' 82 students
LECTURE ROOM 34' X 24' 82 students
LECTURE ROOM 34' X 24' 82 students
V.C office 19' - 3" x 24'
P.A office 14' X 24'
Meeting room 16' - 7.5" x 24'
faculty offices 14' X 24'
CONFREANCE ROOM 34' X 24'
male + female toilets
COMPUTER LAB. 3 24' X 34' 40 STUDENTS
COMPUTER LAB. 2 24' X 34' 40 STUDENTS
COMPUTER LAB. 1 24' X 34' 40 STUDENTS
Generator room
Server room 12' X 11'

Page: 52 MASTERS OF SCIENCE IN RENEWABLE ENERGY DISSERTATION
MURDOCH UNIVERSITY
Tech. support room 11' - 6" x 12' -0"
17 faculty offices cubicles
Figure 27: Architectural design of ground level
Table 9: Floor design of first level area with sizes and capacity
First floor Size Capacity
COLLEGE STORE 24'x34'
LECTURE HALL 24'x34' 5O STUDENTS
LECTURE HALL 24'x34' 5O STUDENTS
DIGITAL ELECTRONIC lab 24'x34' 4O STUDENTS
DIGITAL ELECTRONIC lab 24'x34' 4O STUDENTS
Workshop 24'x34'
Male + Female toilets
ROBOTICE LAB 24'x34' 25 STUDENTS
SHEARE POINT LAB (24) 24'x34' 25 STUDENTS
bedroom 13' -7.5"x17' -0"
Bedroom 17' -0"x14' -3"
LIBRARY 24'x34'
LIBRARY 24'x34'
EEE LAB 24'x34'

Page: 53 MASTERS OF SCIENCE IN RENEWABLE ENERGY DISSERTATION
MURDOCH UNIVERSITY
Figure 28: Architectural design of the first floor
2.4.2.4 General Description of Activity Levels
Figure 29 and 30 show the breakdown of electricity demand pattern during summer and winter. The
pattern indicates that the major loads to be the cooling, heating and lighting. It is evident that the
major electricity consuming device during summer is air conditioning (41%) while, hot water
equipment (28%) during winter. However, the high demand for electricity from lightning and
computer usage (IT rooms) is seen during both seasons.
Figure 29: Summer electricity consumption breakdown
18%
7%
41%
5%
1% 1%
9%
12% 0% 6%
Summer electricty consumption breakdown
lighting refregration
Airconditons fan and exhausts
kitchen equipment water pump
hot water equipment IT rooms
Room Heaters Miscellenaious (plug loads and office equipments)
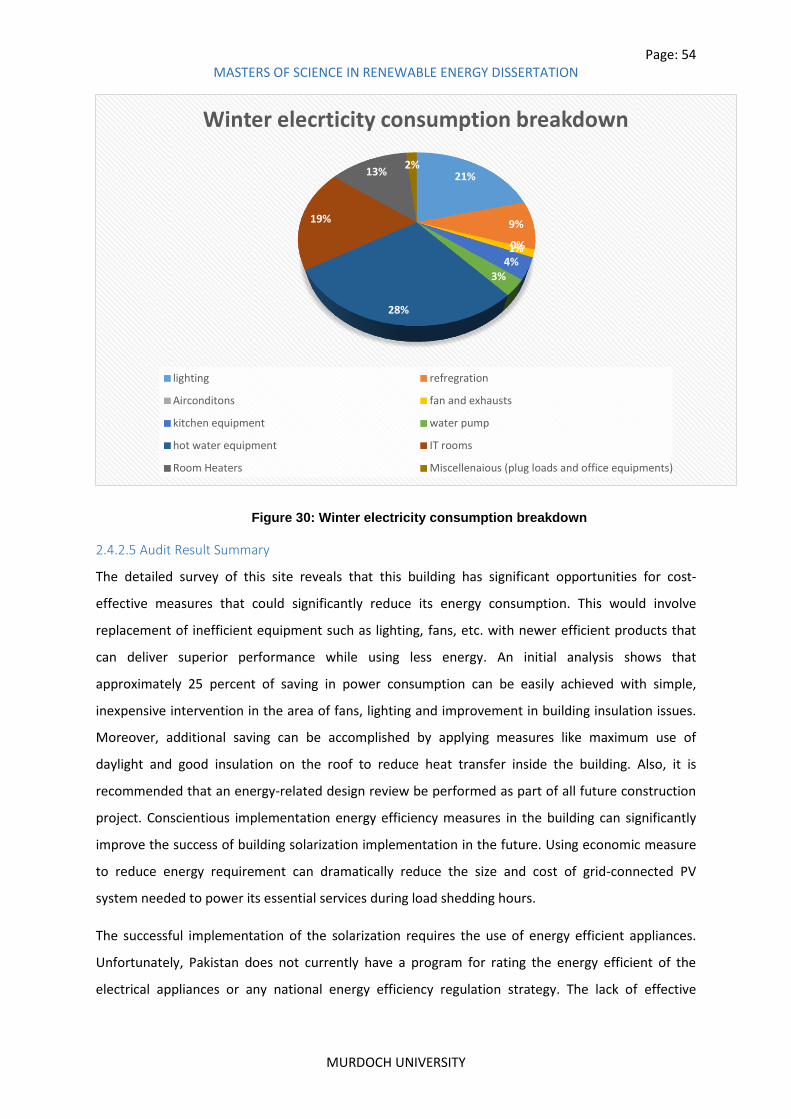
Page: 54 MASTERS OF SCIENCE IN RENEWABLE ENERGY DISSERTATION
MURDOCH UNIVERSITY
Figure 30: Winter electricity consumption breakdown
2.4.2.5 Audit Result Summary
The detailed survey of this site reveals that this building has significant opportunities for cost-
effective measures that could significantly reduce its energy consumption. This would involve
replacement of inefficient equipment such as lighting, fans, etc. with newer efficient products that
can deliver superior performance while using less energy. An initial analysis shows that
approximately 25 percent of saving in power consumption can be easily achieved with simple,
inexpensive intervention in the area of fans, lighting and improvement in building insulation issues.
Moreover, additional saving can be accomplished by applying measures like maximum use of
daylight and good insulation on the roof to reduce heat transfer inside the building. Also, it is
recommended that an energy-related design review be performed as part of all future construction
project. Conscientious implementation energy efficiency measures in the building can significantly
improve the success of building solarization implementation in the future. Using economic measure
to reduce energy requirement can dramatically reduce the size and cost of grid-connected PV
system needed to power its essential services during load shedding hours.
The successful implementation of the solarization requires the use of energy efficient appliances.
Unfortunately, Pakistan does not currently have a program for rating the energy efficient of the
electrical appliances or any national energy efficiency regulation strategy. The lack of effective
21%
9%
0% 1% 4%
3%
28%
19%
13% 2%
Winter elecrticity consumption breakdown
lighting refregration
Airconditons fan and exhausts
kitchen equipment water pump
hot water equipment IT rooms
Room Heaters Miscellenaious (plug loads and office equipments)

Page: 55 MASTERS OF SCIENCE IN RENEWABLE ENERGY DISSERTATION
MURDOCH UNIVERSITY
standard and regulation makes it difficult or impossible to systematically prevent efficient products
from being sold in the domestic market. Over the life of the building, the reduced energy use will
lead to substantial reductions in greenhouse gas emissions. Other potentials of energy efficiency
measures to achieve the energy efficiency goal include daylight harvesting, HVACs efficient controls
and window shading, etc. The summary of average monthly consumption can be seen in appendices.
2.4.2.6 Energy Use by Application and Conservation Opportunities
In this section, energy use of each application is discussed and solution to high consumption
applications is proposed.
Lighting
Lighting is an essential element of energy use in large commercial buildings. Hawken reported that
lighting in buildings consumes 20% - 30% of total energy consumption. (Hawken, Lovins and Lovins
1999). The Lightning system in the subject site mostly consists of artificial lighting from fluorescent
energy savers, fluorescent tube lights and high-pressure sodium tango lamps and is mostly used for
indoor requirements. These lighting devices contain various capacities, types, makes and power
ratings. It was observed that most of the rooms have relatively good window space. As the college
operates during the daytime hence, the need for artificial lighting can be reduced by maximizing the
use of natural light, except for few internal rooms which don’t have access to natural light. Lighting is
one of the primary sources of internal heat gain in buildings, When attempting to mitigate the
energy impact of lighting, it is important to focus not just on electricity saving but also on minimizing
heat generation to reduce the cooling load on air conditioning system.
The remaining high consumption tango lights are being used during night time for mainly security
purpose and parking areas. The lighting system is estimated to consume approximately 2383kWh a
month.
Table 10: Lighting system details
categories power source area description quantityrating
(W)
average
usage
(hrs/day)
total
watt
per day
KWh
22
working
days
24 hr
load
include
weekend
s 30days
proportion
of total
energy
consumpti
on
grid electricity energy saver 150 40 4 6000 24 528
grid electricity energy saver 25 40 24 1000 24 720
grid electricity florescent bulbs 25 100 4 2500 10 220
grid electricity tubelights 150 20 4 3000 12 264
grid electricity tubelights 45 40 4 1800 7.2 158.4
grid electricity outdoor Tango Light 7 400 8 2800 22.4 492.8
402 99.6 1663.2 720
lighting
outdoor/
indoor
17.60%subtotal

Page: 56 MASTERS OF SCIENCE IN RENEWABLE ENERGY DISSERTATION
MURDOCH UNIVERSITY
The earlier investigation has resulted that several lighting equipment stay on even when the area is
unoccupied, these areas include offices, lectures theaters and amenities. It has been observed that
some lighting devices are inefficient and low power factor devices incandescent bulbs and having
the power factor of 1 due to a resistive load. However, this power factor value is quite inefficient
regarding lighting. Retrofitting the existing lighting fixture with electronic ballast or installing new
high power factor lightning devices can help in reducing consumption. Moreover, to improve the
lighting system, it is essential to reduce power rating of luminaries by keeping in mind the occupant
need and comfort.
Unfortunately, poor window glazing and no/less use of natural day lighting have contributed to high
energy consumption from lighting. The additional saving can be made by retrofitting the existing
lighting fixture with electronic ballast or installing new high power factor lighting devices. Using
lighting system which has both high energy efficiency and power factor, minimizes the power
consumption and also help reduce the spike and harmonics and help power grid to unnecessarily
higher effective load. The reduction in lightning energy intensity decreases the need for air condition
inside the buildings. Considering LED instead of fluorescent lamps because of long life and high
energy efficiency of LED. Rooms can be a light zoned where lights can be reduced in unoccupied
area. Dimmer switches can save energy, especially with incandescent lighting fixtures. Lights to be
turned of when unoccupied especially in the washrooms and infrequently used area. Utilizing
occupancy and photo sensors save an average of 30 - 40% on energy costs (Meta-Analysis, 2012).
CFL of 10W can be used instead of 40W in bathrooms. Replacement of 36W CFL from 20WLEDs and
18W CFL to 10W LEDs can be proposed.
Daylight techniques
Maximum use of daylight is an excellent way to reduce the energy consumption as daylight
enhances the psychological comfort and visual of occupants. Occupants can use illumination from
solar daylight for indoor lighting. A webinar by the department of energy in 2009 mentioned that
utilization of solar daylight is one of the top energy design upgrades for commercial buildings
because these buildings are mostly occupied during daytime and consume much power for lighting
(DOE,2009). Moreover, the following measures were identified and proposed to be implemented.
Table 11 explain the energy saving opportunities by replacing the fluorescent lamp with LEDs,
fluorescent tube light with electronic ballast and installing motion sensors.

Page: 57 MASTERS OF SCIENCE IN RENEWABLE ENERGY DISSERTATION
MURDOCH UNIVERSITY
Table 11: Lighting saving measures
Refrigeration
Refrigeration accounts for approximately 7% of the total electricity demand and mainly used in
cafeteria and guestrooms for food storage. The size of three fridges is 200W each while three deep-
freezers have a power rating of 300W each. Both fridges and deep freezers keep running 24 hours a
day for food preservation.
Table 12: Refrigeration detail
It was pointed out that all deep freezers and refrigerators are rated as three stars or less. These units
run 24 hours and these were estimated to consume 936kWh per month. It was observed that the
frost build-up exceed more than 8mm and never defrosted while 1 of the deep freezer was placed
near to stove which restricts the air circulation around the unit. The condenser coils were never
cleaned.
quantity watt duartion avg/year total energy consumption Kw
Fluorescent Lamp 175 40 1825 12775
replacement with LEDs proposed 175 25 1825 7984.375
difference 15 4790.625
average unit cost 14.5 Rs
total saving (Rs) 69464.0625 Rs
cost of 40W lamp with depreciation factor 50% (Rs) 5250 Rs
replacement cost of LEDs 66000 Rs
total aditonal expense 60750 Rs
payback period 0.874552939 years
quantity watt duartion avg/year total energy consumption Kw
flourescent tubelights conventional ballast 195 40 6 46.8
replacement with electronic ballast 195 25 6 29.25
difference 15 17.55
average unit cost 14.5 Rs
total saving (Rs) 254.475 Rs
cost of 30W FTL with depreciation factor 50% 5850 Rs
replacement cost of LEDs 21450 Rs
total aditonal expense 15600 Rs
payback period 0.0163125 years
avg no. of sensors avg. power of TFL avg. no of FTL average reduction in hours per day
use of motion sensor 20 30 3 1095
energy saving (kWh) 1971
average unit cost 14.5 Rs
total saving (Rs) 28579.5 Rs
cost of 30W FTL with depreciation factor 50% 600 Rs
replacement cost 1500 Rs
total aditonal expense 900 Rs
payback period 0.031491104 years
categories power source area description quantity rating (W)average usage
(hrs/day)
total
watt
per day
KWh
22 working
days
24 hr load
include
weekends
30days
grid electricity Guest Room Fridge 1 0 0 0
grid electricity 2 200 24 400 9.6 288
grid electricity 3 300 24 900 21.6 648
6 31.2 0 936
refregrationcafeteria
Fridge /
deepfreez
subtotal

Page: 58 MASTERS OF SCIENCE IN RENEWABLE ENERGY DISSERTATION
MURDOCH UNIVERSITY
These refrigeration systems can be turned off during semester breaks also replacement with more
efficient fridges with regular maintenance of appliances can help saving energy. Moreover, it was
recommended that existing units be replaced with 5-star units. As the units stay almost empty
during holidays and weekends, so thermostats should be set accordingly.
Air-conditions
Air-conditioning (HVACs) systems are the single largest energy consumer in buildings with an
average of almost 60 % of total energy cost worldwide (Teke and Timur 2014).
Figure 31: Air condition outdoor units
Air-conditioning in this building is required for maintaining the humidity level, indoor temperature
and thermal comfort. The type of air conditioning system in this college is a single zone with time
clock control. There are total 28 air-conditions units with the power rating of 1500 each, 24 of which
run on diesel generators while four runs on grid electricity. Most of these units are being used inside
labs, library and offices for an average of 6hrs during weekdays. The total contribution of air
conditioners in total electricity usage is approximately 41% during the summer season.
Table 13: Air-conditions detail
categories power source area description quantity rating (W)average usage
(hrs/day)
total
watt
per day
KWh
22 working
days
24 hr load
include
weekends
30days
diesel gen used when electricty available24 1,500 6 36000 216 4752
grid electricity 4 1,500 6 6000 36 792
28 252 5544 0
Airconditons offices
subtotal
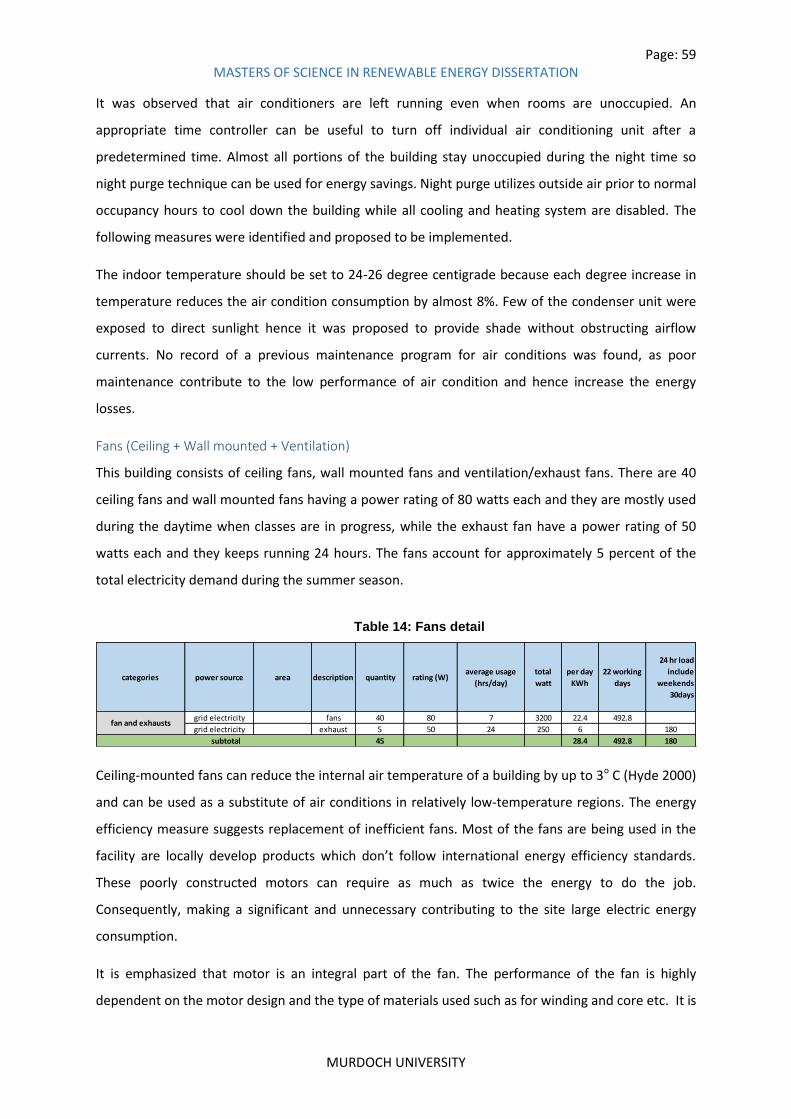
Page: 59 MASTERS OF SCIENCE IN RENEWABLE ENERGY DISSERTATION
MURDOCH UNIVERSITY
It was observed that air conditioners are left running even when rooms are unoccupied. An
appropriate time controller can be useful to turn off individual air conditioning unit after a
predetermined time. Almost all portions of the building stay unoccupied during the night time so
night purge technique can be used for energy savings. Night purge utilizes outside air prior to normal
occupancy hours to cool down the building while all cooling and heating system are disabled. The
following measures were identified and proposed to be implemented.
The indoor temperature should be set to 24-26 degree centigrade because each degree increase in
temperature reduces the air condition consumption by almost 8%. Few of the condenser unit were
exposed to direct sunlight hence it was proposed to provide shade without obstructing airflow
currents. No record of a previous maintenance program for air conditions was found, as poor
maintenance contribute to the low performance of air condition and hence increase the energy
losses.
Fans (Ceiling + Wall mounted + Ventilation)
This building consists of ceiling fans, wall mounted fans and ventilation/exhaust fans. There are 40
ceiling fans and wall mounted fans having a power rating of 80 watts each and they are mostly used
during the daytime when classes are in progress, while the exhaust fan have a power rating of 50
watts each and they keeps running 24 hours. The fans account for approximately 5 percent of the
total electricity demand during the summer season.
Table 14: Fans detail
Ceiling-mounted fans can reduce the internal air temperature of a building by up to 3o C (Hyde 2000)
and can be used as a substitute of air conditions in relatively low-temperature regions. The energy
efficiency measure suggests replacement of inefficient fans. Most of the fans are being used in the
facility are locally develop products which don’t follow international energy efficiency standards.
These poorly constructed motors can require as much as twice the energy to do the job.
Consequently, making a significant and unnecessary contributing to the site large electric energy
consumption.
It is emphasized that motor is an integral part of the fan. The performance of the fan is highly
dependent on the motor design and the type of materials used such as for winding and core etc. It is
categories power source area description quantity rating (W)average usage
(hrs/day)
total
watt
per day
KWh
22 working
days
24 hr load
include
weekends
30days
grid electricity fans 40 80 7 3200 22.4 492.8
grid electricity exhaust 5 50 24 250 6 180
45 28.4 492.8 180
fan and exhausts
subtotal

Page: 60 MASTERS OF SCIENCE IN RENEWABLE ENERGY DISSERTATION
MURDOCH UNIVERSITY
concluded that the GFC fans (Deluxe Model) are the best fans available in the market. On further
analysis, it was observed that GFC is manufacturing ceiling fans of different sizes/wingspans
regarding their wingspans (36 inches, 48 inches and 56 inches) and accordingly, the power being
consumed by them (55W by 36” fan, 70 W by 48” fan & 80 W by 56” fan).
Water Pump
Water is consumed in different sections of college for the various requirement. Water pumping
comprises of approximately 2% of the total energy consumption. A submersible type pump is being
used and the power rating of this pump is 1500W. The average running duration is almost 5 hours a
day to fill water tank of 17x22x8 size.
Table 15: Water pump Details
For energy conservation, a 1,300watt pump was proposed to replace the previous 1,500watt pump.
The replacement cost including labor cost and the cost of the new pump is 21,000PKR. The
calculated payback period is almost four years with an energy saving of 5,000PKR per year.
Table 16: Water pump saving measures
Existing proposed
Power (Watt) 1500 1300
Daily Operation hour (hrs) 5 5
Water pumped (litres/day) 80400 67000
Energy consumed (kWh) 7.5 6.5
Average unit cost (Rs.) 14.5
Annual consumption (kWh) 2737.5 2372.5
Energy saving (kWh)
365
Annual Energy Cost (Rs.) 39,693.75 34,401.25
Annual Cost Savings (Rs.)
5,292.5
Replacement cost (Rs.)
21,000
Payback period (years) 3.97
Hot water
As there is no gas supply in this region, so electric geysers are being used for water heating. The hot
water is mostly used for student and staff amenities and kitchen. There are total three geysers for
hot water supply and are situated on each floor. The total capacity of 3 geysers are 10 liters, 12 liters
and 35 liters respectively, and the average set hot water temperature is set to 70 (°C).
categories power source area description quantity rating (W)average usage
(hrs/day)
total
watt
per day
KWh
22 working
days
24 hr load
include
weekends
30days
water pump grid electricity 50HP 3phase 1 1500 5 1500 7.5 165
1 7.5 165 0subtotal

Page: 61 MASTERS OF SCIENCE IN RENEWABLE ENERGY DISSERTATION
MURDOCH UNIVERSITY
Table 17: Hot water detail
It was observed that these geysers stay energized from the month of September to May. Also they
are kept running even after hours when college is not occupied. These geysers can be equipped with
timers to turn off the units during predetermined times. Such timers switch off the units when not
required (during weekends and night time). The turning off the hot water units not only save energy
but also extends the lifetime of the unit. Installation of instantaneous hot water system also seems a
feasible option as it contributes less to carbon dioxide emissions and saves electricity.
IT Rooms and Computer
The college contains large quantities of computers and hence it consumes substantial 11% of the
total energy. Cabrera and Zareipour estimated that the total number of computers in universities
and colleges in north-America was 2 million during 2011 and these computers consume the
approximate energy of 950MWh. This much electricity consumption would produce equivalent
emissions of 130000 vehicles or 665000 metric tons of carbon dioxide (Motta Cabrera and Zareipour
2011). Webber suggested that computers labs at educational institutions have an enormous
potential of energy saving because computer labs have a significant number of unoccupied hours per
day and year. (WEBBER et al. 2006). There are total 180 computers in labs and offices and most of
them are equipped with cathode ray tube monitors which are highly inefficient.
Table 18: IT rooms details
The walkthrough survey revealed that most desktop computers were left in sleep mode when not in
use and often over weekends. As a result, desktop computers in sleep mode consume more
cumulative energy than when being operated. So turning off monitors after working hours can help
avoiding parasitic power. Moreover, an awareness campaign and the use of dedicated shut-down
procedures would reduce the incidence of this unnecessary load. Table 19 shows the saving
opportunities by replacing cathode ray tube monitors to liquid crystal display.
categories power source area description quantity rating (W)average usage
(hrs/day)
total
watt
per day
KWh
22 working
days
24 hr load
include
weekends
30days
grid electricity 2nd floor 10ltr 70 deg 1 1500 0 1500 0 0
grid electricity 1st floor 12ltr 70 deg 1 1800 0 1800 0 0
grid electricity ground floor 35ltr 70 deg 1 1800 24 1800 43.2 1296
3 43.2 0 1296
hot water equipment
subtotal
categories power source area description quantity rating (W)average usage
(hrs/day)
total
watt
per day
KWh
22 working
days
24 hr load
include
weekends
30days
IT rooms grid electricity labs+offices computer, it equipment 180 200 2 36000 72 1584
180 72 1584 0subtotal

Page: 62 MASTERS OF SCIENCE IN RENEWABLE ENERGY DISSERTATION
MURDOCH UNIVERSITY
Table 19: Computer saving measures
Replacement of cathode ray tube monitors to Liquid crystal display monitors
Cathode ray tube
Liquid crystal display
Quantity 180 180
Watt 200 120
Duration hrs/year 1250 1250
Total energy consumption (kWh)/year 45000 27000
Total saving kWh
18000
cost per year(Rs.) 652500 391,500
cost saving (Rs.)
261,000
Replacement cost (Rs.)
900,000
Payback period (year)
3.45
Heating Equipment
Electrical heating is expensive to run and it produces a high level of greenhouse gasses. However, if
natural gas is not available and only small rooms are being heated then it is the best option. Portable
electrical heaters are inexpensive and can heat up quickly but, the annual running cost is high. In the
college, there are few portable electrical heaters are being used intermittently during the winter
season, but the use of electric resistive heater are inefficient as they run on expensive peak
electricity tariff, therefore, add up more cost on electricity bills. These room heaters consume almost
3.5 % of the total electricity. Table 20 show the detail of electrical heater usage.
It was observed that the existing heater is four stars rated appliances so considering another
solution, for instance, reverse cycle air condition, etc. can add up high capital cost and is not
financially viable.
Table 20: Room heater details
Plug Loads
A plug load is energy consumed by any electronic device that is plugged into a building electrical
socket. Plug loads are not related to general ventilation, cooling, heating, lighting and water heating
loads and do not provide comfort to the occupants (Sheppy and Torcellini 2011).
categories power source area description quantity rating (W)average usage
(hrs/day)
total
watt
per day
KWh
22 working
days
24 hr load
include
weekends
30days
Room Heaters grid electricity 800 offices 7 800 3 5600 16.8 369.6
369.6 0subtotal

Page: 63 MASTERS OF SCIENCE IN RENEWABLE ENERGY DISSERTATION
MURDOCH UNIVERSITY
Many appliances and equipment consume some electric power when they are switched off or not
performing their primary purpose. For instance, microwave oven use energy for touchpad and
display panel and always stay active even when not in use (Rivas 2009). Other example of such
parasitic devices can be cordless phones, digital televisions, internet modems and computers. These
parasitic loads can be mitigated by installing Star rated energy efficient appliances or by completely
turning off when not in use. EnergyStar® Products are designed to help the consumer to save money
and protect the environment through identifying energy efficient product practices. Energy Star is a
combined program of U.S. Department of Energy and U.S. Environmental Protection Agency started
in 1992. It was recorded that with the help of star rated products the American saved $17billion on
utility bills also avoided greenhouse gas emissions equivalent to 30 million cars during 2009 (US
DOE). This program includes all sorts of appliances ranging from dishwashers to computer and all
heating/cooling products. These star rated appliances were suggested in many cases during the
auditing process. Several appliances which are currently being used are either less efficient or poorly
maintained.
The plug load in this college mainly consist of icemakers, water cooler, vegetable cutter, grinder,
electrical kettle, power supplies, oscilloscope, function generator, dishwasher, oven and multimedia
projectors. The contribution of plug load is approximately 6.5%. It was observed that the energy
rating of dishwashers and oven was extremely poor. Considering five-star appliances and replacing
them with 2-3 star appliances provide considerable potential for energy efficiency. Dishwashers are
energy hogging workhorses if they are less efficient and medium to small sized wash tanks can be
used for water conservation. Table 21 show the details of plug loads.

Page: 64 MASTERS OF SCIENCE IN RENEWABLE ENERGY DISSERTATION
MURDOCH UNIVERSITY
Table 21: Plug load details
2.4.2.7 Other Details
Building Design Improvement
In the past, several researchers have proposed the improvement in energy efficiency through
building envelope (Carlo and Lamberts 2008) (Sozer 2010). Building orientation surrounding and
location play an important role for regulating temperature and heat gain inside the building. For
instance, nearby mountains, tall trees can block the wind and provide shading to the building.
Moreover building design which includes well-sealed doors basement slabs, thermal insulation of
walls and foundation, can minimize heat loss by 20-50% (EESI, 2006).
Replacing single glazed windows with more efficient low emissive glazing, high R-value, can help in
reduction of energy consumption and improving indoor comfort. This strategy is most effective
when a significant area of the building is exposed to outside air due to windows. High performance
glazed windows can reduce the for cooling demand inside the building which leads to less need for
heating and cooling
Infiltration load can be significantly reduced by reducing air leakage. Air leakage in buildings can be
reduced by straightforward and inexpensive techniques. Building integrated photovoltaic (BIPV) can
reduce heat gain through building envelope as well as generate electricity.
Building Wiring
Due to non-availability of electricity during visits, the performance of building wiring in term of
voltage losses could not be evaluated but they were thoroughly checked for type and quality of wire
used and found them as per the desired quality standards with no signs of overheating. However, at
a few places the cladding of wires was required, for which, the local administration was asked to
take care of them.
categoriespower
sourcearea description quantity
rating
(W)
average
usage
(hrs/day)
total
watt
per day
KWh
22
working
days
24 hr
load
include
weekend
s 30days
grid electricity Dishwasher 1 1800 1.5 1800 2.7 59.4
grid electricity Oven 2 2000 1.5 4000 6 132
3 8.7 191.4 0
grid electricity Ice Maker 1 1000 8 1000 8 240
grid electricity Water Cooler 3 500 8 1500 12 360
grid electricity Vegetable cutter 1 350 0.5 350 0.175 3.85
grid electricity Grinder 1 350 0.5 350 0.175 3.85
grid electricity Electric kettle 1 1500 0.5 1500 0.75 16.5
grid electricity Power Supply 30 45 1.5 1350 2.025 44.55
grid electricity Oscilloscope 30 40 1.5 1200 1.8 39.6
grid electricity Function Generator 8 85 1.5 680 1.02 22.44
grid electricity Projector 3 300 2 900 1.8 39.6
7 27.745 170.39 600
kitchen
lab
kitchen
subtotal
subtotal
Miscellenaious (plug
loads and office
equipments)

Page: 65 MASTERS OF SCIENCE IN RENEWABLE ENERGY DISSERTATION
MURDOCH UNIVERSITY
Figure 32: Electric wiring
Rooftop Greenery System
Several researchers analyzed the effect of green roofing of building (D’Orazio, Di Perna and Di
Giuseppe 2010), (Sailor 2008) and concluded that green roofing help to minimize energy
consumptions in buildings during summer. Moreover, there are several benefits of green roofs for
instance air pollution, air noise, retention of stormwater, longing the roof life and cooling of the
building so this option can also be considered in future.
Electricity Meter
A sub-meter installation for air condition consumption from diesel was recommended. Also, the
smart meter should be installed to get energy consumption for 15 minutes intervals. Generation of
monthly and annual reports from data logger can help institutions by acquiring online information.
This information can be used for monitoring and verification of energy conservation opportunities
and to design standards for baseline design energy performance of future projects.
Occupant Behaviour
Designing a sustainable building cannot be accomplished without the behavior of its occupants
(Verbeek and Slob 2006). Occupants behavior play a major role in determining energy consumption
of a building alongside building physical characteristics, servicing, surrounding environment and
commissioning(Steemers and Yun 2009). Although several studies have aimed to access the impact
of occupant behavior, this approach can be complex due to complexity and diversity of user
behavior (Yu et al. 2011). However, the impact of holistic occupant behavior on energy use in
commercial building it still needs in-depth consideration.

Page: 66 MASTERS OF SCIENCE IN RENEWABLE ENERGY DISSERTATION
MURDOCH UNIVERSITY
Chapter 3 RENEWABLE ENERGY RESOURCE ASSESMENT
Renewable energy resources are defined as natural but flow-limited that can be replenished. They
are virtually inexhaustible in duration but limited in the amount of energy that is available per unit of
time. Some sources may be stock limited but on a timescale of decades or centuries they can
probably replenish.
Renewable energy sources include geothermal, hydro, solar, wind, biomass, ocean thermal wave
and tidal. However, renewable energy sources do not include fossil fuels, nuclear, inorganic sources
or waste products. The application of renewable energy includes grid-connected or stand-alone
electricity generation.
3.1 Renewable Energy Resources of Pakistan
3.1.1Potential of Renewable Energy in Pakistan.
Pakistan is blessed with several renewable energy sources and there is the vast potential of
harvesting renewable energy from these resources. Please see table below

Page: 67 MASTERS OF SCIENCE IN RENEWABLE ENERGY DISSERTATION
MURDOCH UNIVERSITY
Table 22: Potential capacity of Renewable Sources of Energy in Pakistan (Mirza 2008)
Renewable technologies which are identified as appropriate for Pakistan are mentioned in Table 23
(Mirza, 2008).

Page: 68 MASTERS OF SCIENCE IN RENEWABLE ENERGY DISSERTATION
MURDOCH UNIVERSITY
Table 23: Suitable renewable technologies for Pakistan
3.1.1 Wind Resource
In Pakistan there are several noteworthy locations of potential wind resource, these locations are
mainly present in southern and coastal areas of Sindh and Baluchistan province. The coastline of
Sindh and Baluchistan is almost 1050 kilometers long and the available average wind speed is
calculated as 5 to 7 meter per second. Pakistan metrological department measured the wind
potential by using wind turbine named as N43/600 at 45 prime locations. It was estimated that
presence of 2000 to 3000 full load hours of wind resources present on the Sindh coastal area. While
1000 to 1400 full load hours wind potential was calculated at coastal areas of Baluchistan.
Furthermore, the total wind power estimated in coastal areas of Pakistan is almost 212 terawatt-
hour per year. This figure is almost 2.5 times of the total current installed convention power plants
in Pakistan (Nasir 2009).
A wind turbine does not require large land area rather only need 2 to 3 percent of turbine and
substation whereas the remaining area can be utilized for cattle grazing and low height cultivation.
Fortunately, most of the wind potential areas are positioned in the barren land of Pakistan these
areas include Gharo, Chaghi, Keti Bandar, etc. The corridor of Keti Bandar is located in the south of
Pakistan and has wind potential of 50,000 Megawatt. The monthly average wind speed at this
location with several height references can be seen in table 24 (Sustainable Development Policy
Institute 2014).

Page: 69 MASTERS OF SCIENCE IN RENEWABLE ENERGY DISSERTATION
MURDOCH UNIVERSITY
Table 24: Monthly average wind speed at Keti Bandar with reference to 30m,50m,60m and 67m height.
Month Monthly Benchmark Wind Speed
30m 50m 60m 67m
Jan 4.7 5.1 5.2 5.3
Feb 5.1 5.4 5.5 5.6
Mar 5.3 5.7 5.8 5.9
Apr 7.0 7.3 7.4 7.6
May 8.9 9.4 9.6 9.7
Jun 10.3 10.9 11.1 11.2
Jul 8.4 8.9 9.0 9.2
Aug 9.3 9.8 10.0 10.2
Sep 7.6 8.1 8.2 8.3
Oct 4.3 4.6 4.7 4.7
Nov 3.8 4.1 4.2 4.3
Dec 4.6 4.9 5.1 5.2
Annual avg. 6.6 7.0 7.1 7.2
Wind map of Pakistan has been designed by NREL. Please see figure 33 (National Renewable Energy
Laboratory 2015). The total potential of wind is calculated as 346000 Megawatt and these sources
are located in Baluchistan, Sindh and northern area of Pakistan (Alternative energy development
board, 2015). The report states that total 9 percent of the land has good wind source of class 3
(National Renewable Energy Laboratory, 2015).

Page: 70 MASTERS OF SCIENCE IN RENEWABLE ENERGY DISSERTATION
MURDOCH UNIVERSITY
Figure 33: Wind energy map of Pakistan
3.1.2 Solar Resource
Pakistan is situated at the latitude of minimum 24° and maximum 36° which makes it a perfect
location to take advantage of solar energy. The average radiation falling on the surface of Pakistan is
around 200 to 250 per square meter per day and there are around 1500 to 3000 hours of solar
sunshine through the year and the annual average sunshine duration is 8 to 8.5 hours day. Most
parts of Pakistan lies in the solar potential of 150 to 300-kilowatt hour per square meter per year
(Planning Commission Government of Pakistan 2010). The maximum potential of harvesting solar
energy is present in Baluchistan and the second largest resource is in southern Punjab. Most of the
population of Baluchistan province lives in rural areas where more than 90 percent of villages have
no access to electricity (Sustainable Development Policy Institute 2014). Because of the massive
distances between these villages and the rough terrain make it problematic and expensive to lay
transmission lines. Therefore, solar is a good option to improve the social and economic condition of
people living in such remote areas of Pakistan. According to a report around 40000 houses in these
rural areas can be electrified through solar energy. NREL plotted the total solar radiation of Pakistan
and it is estimated as 2.9 million megawatts. Please see figure 34 (National Renewable Energy
Laboratory 2015).

Page: 71 MASTERS OF SCIENCE IN RENEWABLE ENERGY DISSERTATION
MURDOCH UNIVERSITY
Figure 34: Solar radiation map of Pakistan
The increase in domestic energy consumption during summer is a reason of high usage of air-
conditioners. Table 25 mention the solar irradiation data from six locations for the measurement of
long-term records of sunshine. (Kalhoro 2005)
Table 25: Solar irradiation data from 6 locations (US cents / Kilowatt hour)
Month US cents / Kilowatt
hour
January 6.7
February 7.6
March 8.7
April 11.8
May 21.8
June 23.6
July 30.9
August 12.7
September 11.3
October 10.2
November 9.1
December 8.2

Page: 72 MASTERS OF SCIENCE IN RENEWABLE ENERGY DISSERTATION
MURDOCH UNIVERSITY
Figure 35 illustrate the average hourly irradiation of six different months in Sindh province.
Moreover, the average irradiance during noon from March to October surpass 800 watts per square
meter as can be seen in graph 1 (Kalhoro 2005)
Figure 35: Average hourly irradiation of Sindh on a monthly basis
For the past two years, the cost of solar PV is decreased to ten times and is expected to decrease
more with the increase in usage following economies of scale princple. It allows country more
prospects of investing in solar photovoltaics (Kurokawa 2003). Solar PVs can be explained via two
configurations described as follows and both of these technologies can provide opportunities of
village electrification, lighting, water pumps, net metering, outdoor, space heating and water
heating.
3.1.2.1 Grid connected PV system
Such systems are also known as grid interfaced systems. In such systems, the consumer supplies the
surplus power generated by solar PVs to the grid and takes back from the grid when it is required. In
these systems, there is no battery involvement . Moreover, it is a complex procedure to make grid
interconnection. Net metering is also another part of this and it allows the solar panel owner to sell
the excess generated electricity.
3.1.2.2 Standalone PV system
This system produces and supplies electricity without grid involvement. There is no transmission
line involved from the grid which is the appropriate configuration for remote and areas. These
systems are used to power farms, water pumps, lighting and fence chargers. If such systems are
directly coupled to the load, then no batteries are required and these systems will only work when
solar radiations are available. It can also be coupled with batteries for backup during low sunlight
hours. Moreover, some hybrid systems include additional sources such as diesel generator.

Page: 73 MASTERS OF SCIENCE IN RENEWABLE ENERGY DISSERTATION
MURDOCH UNIVERSITY
3.1.3 Hydropower Resource
The potential of electricity from hydropower in Pakistan is massive. The total identified potential of
hydropower is approximately 41.5 gigawatts out of which only 16 percent is being used (Mirza
2008). It is assessed that potential of small hydropower in northern areas has the potential of 500
megawatts out of which perennial waterfalls accounts for 300 megawatts (Mirza 2008). Potential of
hydropower Punjab province is 7291 megawatts, Azad Jammu & Kashmir province 6450 megawatts,
Gilgit-Baltistan 21725 megawatts and Khyber Pakhtunkhwa province 24736 megawatts (Mirza 2008).
Figure 36 (Private power and Infrastructure Board, 2011) represent the total installed hydropower
capacity in provinces of Pakistan and Khyber Pakhtunkhwa account for most installed capacity
among the other provinces.
Figure 36: Total Hydropower installed capacity in Pakistan.
Figure 37 shows (WAPDA, 2013) that the electricity from hydropower is cheapest among all the
sources in Pakistan. The average cost of electricity generated through hydropower during the year
2011 to 2012 was Rupees 0.16 per kilowatt-hour.
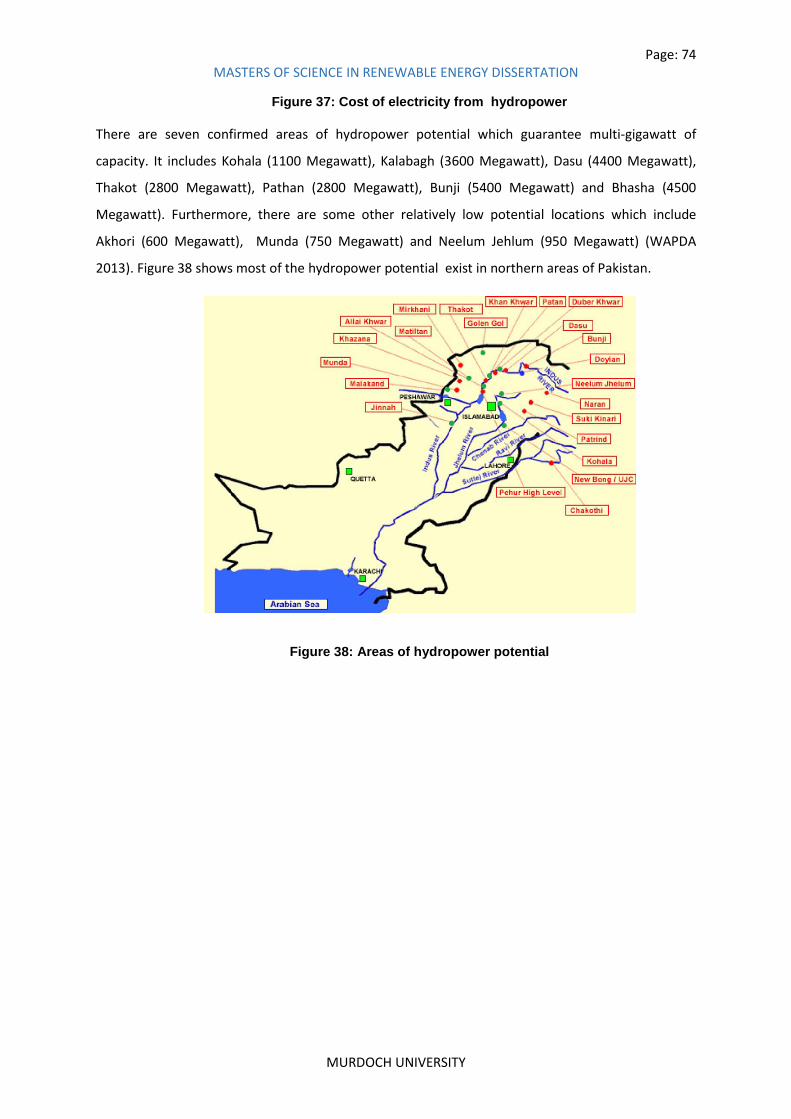
Page: 74 MASTERS OF SCIENCE IN RENEWABLE ENERGY DISSERTATION
MURDOCH UNIVERSITY
Figure 37: Cost of electricity from hydropower
There are seven confirmed areas of hydropower potential which guarantee multi-gigawatt of
capacity. It includes Kohala (1100 Megawatt), Kalabagh (3600 Megawatt), Dasu (4400 Megawatt),
Thakot (2800 Megawatt), Pathan (2800 Megawatt), Bunji (5400 Megawatt) and Bhasha (4500
Megawatt). Furthermore, there are some other relatively low potential locations which include
Akhori (600 Megawatt), Munda (750 Megawatt) and Neelum Jehlum (950 Megawatt) (WAPDA
2013). Figure 38 shows most of the hydropower potential exist in northern areas of Pakistan.
Figure 38: Areas of hydropower potential
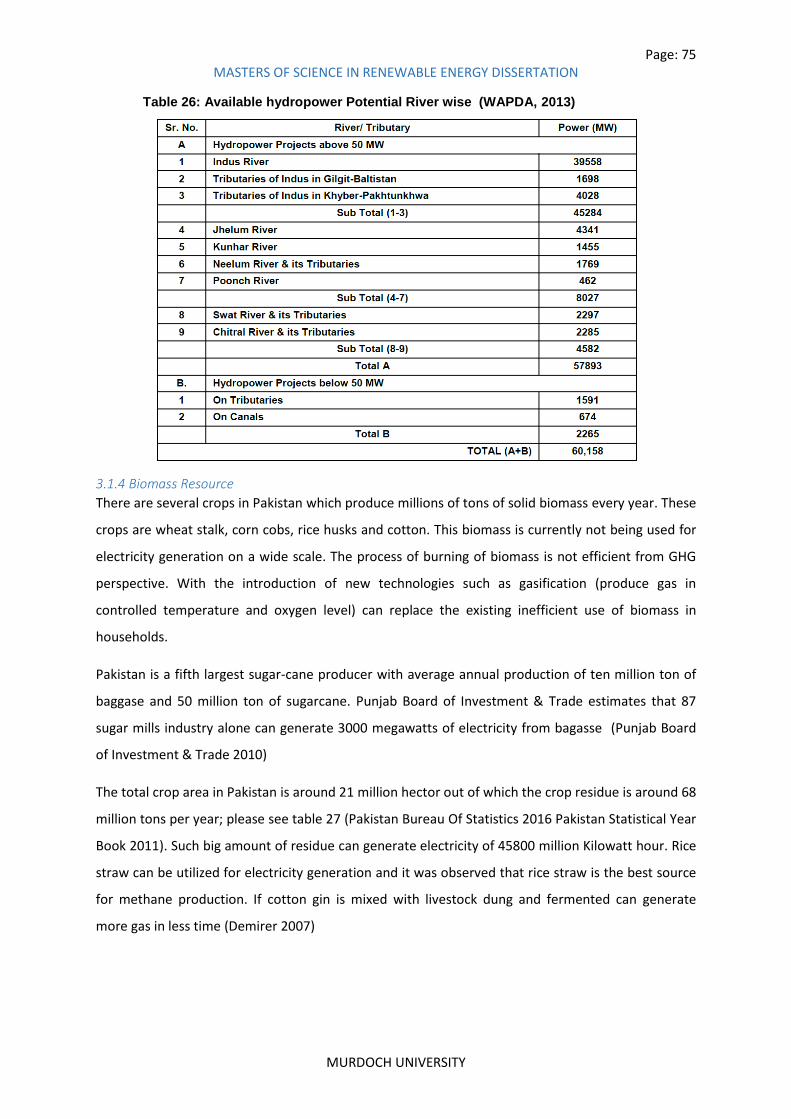
Page: 75 MASTERS OF SCIENCE IN RENEWABLE ENERGY DISSERTATION
MURDOCH UNIVERSITY
Table 26: Available hydropower Potential River wise (WAPDA, 2013)
3.1.4 Biomass Resource
There are several crops in Pakistan which produce millions of tons of solid biomass every year. These
crops are wheat stalk, corn cobs, rice husks and cotton. This biomass is currently not being used for
electricity generation on a wide scale. The process of burning of biomass is not efficient from GHG
perspective. With the introduction of new technologies such as gasification (produce gas in
controlled temperature and oxygen level) can replace the existing inefficient use of biomass in
households.
Pakistan is a fifth largest sugar-cane producer with average annual production of ten million ton of
baggase and 50 million ton of sugarcane. Punjab Board of Investment & Trade estimates that 87
sugar mills industry alone can generate 3000 megawatts of electricity from bagasse (Punjab Board
of Investment & Trade 2010)
The total crop area in Pakistan is around 21 million hector out of which the crop residue is around 68
million tons per year; please see table 27 (Pakistan Bureau Of Statistics 2016 Pakistan Statistical Year
Book 2011). Such big amount of residue can generate electricity of 45800 million Kilowatt hour. Rice
straw can be utilized for electricity generation and it was observed that rice straw is the best source
for methane production. If cotton gin is mixed with livestock dung and fermented can generate
more gas in less time (Demirer 2007)

Page: 76 MASTERS OF SCIENCE IN RENEWABLE ENERGY DISSERTATION
MURDOCH UNIVERSITY
Table 27: Annual crop production in Punjab province
The approximate no of cattle in Pakistan during 2010 was 159 million and the availability of dung
from those cattle is around 652 million kilogram per day ("Biogas Plants, Equipment And Services"
2010), please see Table 28 (PAKISTAN ECONOMIC SURVEY 2011). The production of bio-fertilizer is
estimated around 21million tons per annum (Mirza 2008). Only 1/3 of the total quantity of dung is
utilized for the domestic use of fire and 2/3 is wasted. If this source of dung is utilized properly, then
16.3 million cubic meters of biogas can be generated on a daily basis(Sheikh 2009).
Table 28: Numbers and types of animal in Pakistan (million)
3.1.5 Geothermal Resource
It is a type of energy extracted from earth’s core. It is a renewable, sustainable, abundant and
reliable source of energy. Worlds seismic belt go through Pakistan and it has a long geological
geotectonic history like rifting of Iran Afghanistan, volcanism in Chagai and rifting of indo-Pakistan,
etc. (Kazmi 1997). There are more than 600 estimated indicators of geothermal resources in Tibet
which have estimated the potential of 800 Megawatt (Bakht 2010).

Page: 77 MASTERS OF SCIENCE IN RENEWABLE ENERGY DISSERTATION
MURDOCH UNIVERSITY
Figure 39: Locations of geothermal resources in Pakistan
The Geotechnical framework represents that there is a utilizable potential of geothermal in Pakistan.
These geothermal locations are found in three geothermal environments that are known as
seismotectonic, NeogeneQuaternary volcanism or geopressurized system.
Seismotectonic zones are located in northern areas of Pakistan it includes a mountainous belt of
Himalaya, Karakorum and Hindukush.
Geopressure zones in Pakistan are located in Basin of Indus River in Sindh province and pothwar
basin of province Punjab
NeogeneQuaternary is widely present in KoheSultan volcano (Bakht 2010).
3.1.2 Policy Affecting Renewable Energy Development
Energy policy of Pakistan is designed by provisional local institutional and federal entities. It deals
with the issues of power consumption distribution and production ("CCI Approves National Energy
Policy" 2013). Over the years, several proposals and mandates have been called to focus on energy
conservations, for instance: neon signs were banned to conserve electricity ("Geo.Tv: Latest News
Breaking Pakistan, World, Live Videos" 2016), reducing electricity load from industries by 25 percent
during peak timings (Archive 2007) but there was no considerable long-term strategy implemented
in the past. Several issues were raised such as dependence on imported oil, energy from renewable
resources, unequal distributing of electricity, irresponsible energy sources usage ("The News

Page: 78 MASTERS OF SCIENCE IN RENEWABLE ENERGY DISSERTATION
MURDOCH UNIVERSITY
International: Latest News Breaking, Pakistan News" 2016). History of Pakistan’s energy policies is
full of misplaced assumptions and implementation in a nontransparent manner. Personal financial
and political gains are always preferred over long term consequences. Although several policies were
aimed to stress the need for renewable technologies, but none of those provide an actual
framework of implementation ("Identification And Removal Of Barriers For Renewable Energy
Technologies In Pakistan" 2006). Several institutions were formed in the last 30 years to promote
renewable technologies. NIST (National Institute of silicon technology) was developed in 1981 for
research in the solar field. PCAT (Pakistan Council of appropriate technology) was established in
1985. These institutions merged in 2002 and became PCRET (Pakistan Council of Renewable energy
technology) ("Identification And Removal Of Barriers For Renewable Energy Technologies In
Pakistan" 2006). Another institution was formed in 2003 named AEDB (alternative energy
development board). The main aim of this institute was to develop policies for renewable
technologies, in particular for solar wind and hydro-power ("Identification And Removal Of Barriers
For Renewable Energy Technologies In Pakistan" 2006). This institute introduced a first renewable
policy of Pakistan in 2006. The goal of this policy was to equip 10 % of energy supply mix from
renewable resources ("Powering Up: Pakistan's Push For Renewable Energy" 2007). This policy
stimulated interest in renewable projects for large scale generation. However, the progress was too
slow and only one 50 MW project was installed until 2008 (Bhutta 2008). There were several
challenges faced by this policy such as lack of competition, market barriers, financial barriers, poor
infrastructure, institutional barriers, power technology and information access, lack of training and
capacity and lack of social acceptance and awareness (Mirza et al. 2009). There are several
approaches to address the challenges mentioned above such as energy subsidy transfer, feed in
tariffs, accounting for externalities, public sector involvement, institutional cooperation, financing
for renewable projects, improving technology, renewable portfolio standards, information access,
increasing capacity and training and generation social interest and awareness.
3.2 Renewable Energy Resource at the Case Study Area
3.2.1 Solar Energy The solar resource data was originated online from NASA’s Atmospheric Science Data Center (ASDC)
due to a shortage of data from Pakistan Meteorological Department at subject location. Figure 40
shows the daily monthly average insolation on a horizontal surface at NAMAL college. It can be
observed that the solar insolation is good throughout the year except for the month of November,
December and January. Moreover, the clearness index stays high throughout the year. The scaled
annual average solar insolation is 5.07kWh/m2/day which is considered very healthy for the
feasibility of solar energy system.

Page: 79 MASTERS OF SCIENCE IN RENEWABLE ENERGY DISSERTATION
MURDOCH UNIVERSITY
Figure 40: Solar resource (NASA website)
3.2.1.1 Solar Sun Path
The solar sun path at NAMAL college was plotted from a website named sunearthtool.com. It can be
seen in figure 41 that Sun spend most time of the year in southern part of the sky. Here 21st June
and 21st December show two equinoxes.
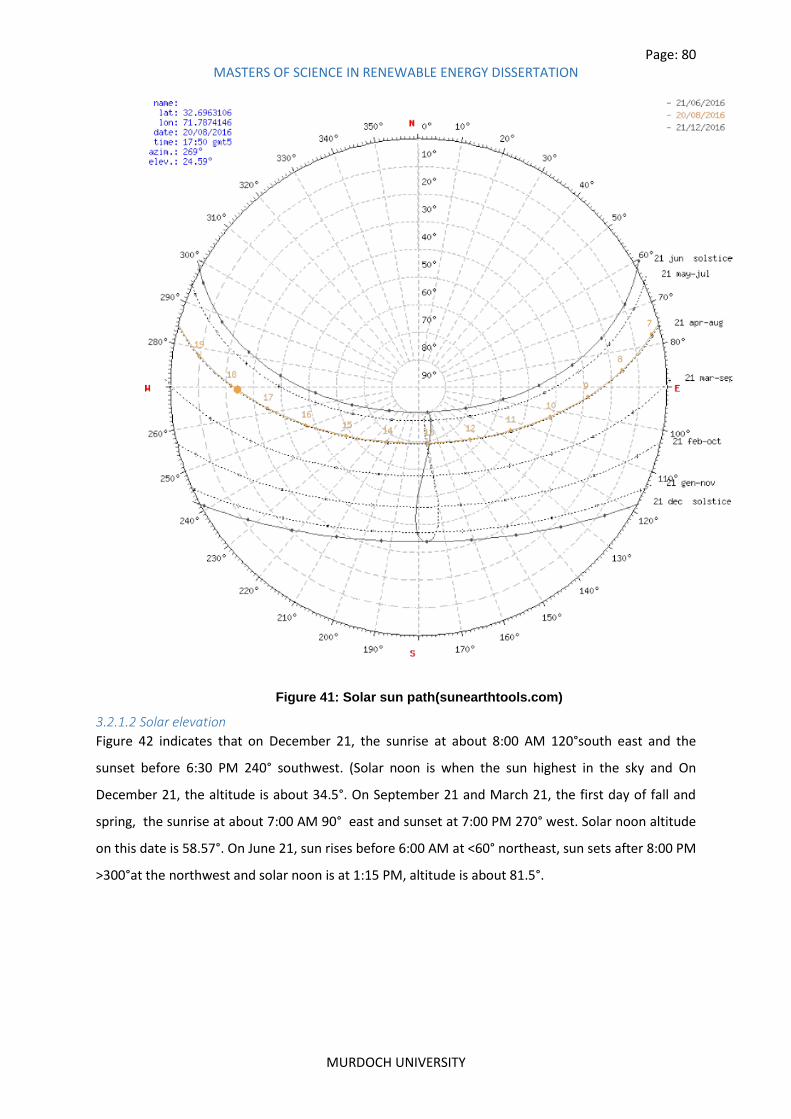
Page: 80 MASTERS OF SCIENCE IN RENEWABLE ENERGY DISSERTATION
MURDOCH UNIVERSITY
Figure 41: Solar sun path(sunearthtools.com)
3.2.1.2 Solar elevation
Figure 42 indicates that on December 21, the sunrise at about 8:00 AM 120°south east and the
sunset before 6:30 PM 240° southwest. (Solar noon is when the sun highest in the sky and On
December 21, the altitude is about 34.5°. On September 21 and March 21, the first day of fall and
spring, the sunrise at about 7:00 AM 90° east and sunset at 7:00 PM 270° west. Solar noon altitude
on this date is 58.57°. On June 21, sun rises before 6:00 AM at <60° northeast, sun sets after 8:00 PM
>300°at the northwest and solar noon is at 1:15 PM, altitude is about 81.5°.

Page: 81 MASTERS OF SCIENCE IN RENEWABLE ENERGY DISSERTATION
MURDOCH UNIVERSITY
Figure 42: Solar elevation
The average temperature of Mianwali is 73.0°F (22.8°C). The warmest month, on average, is June
with an average temperature of 93.0°F (33.9°C). The coolest month on average is January, with an
average temperature of 51.0°F (10.6°C).(Weatherbase)
3.2.2 Wind
Figure 43 shows the wind resource at the case study location with reference to 10 meters height
from the earth surface and average of 10-year data. It can be concluded that the wind resource is
below average and annual average wind speed is calculated as Annual average(m/s) 3.80m/s

Page: 82 MASTERS OF SCIENCE IN RENEWABLE ENERGY DISSERTATION
MURDOCH UNIVERSITY
Figure 43: Annual wind speed
3.2.3 Namal Dam
In 1913, British engineers built a dam to meet the scarcity of drinking water and irrigation of
Mianwali city. This dam was constructed on Namal lake which is spread over 5.5 square meters and
the main source of water is hill torrent and rainfall. With the passage of time and the installation of
new tube wells, the water level is reduced. The lake is almost dry and due to no proper maintenance
and less rain in this region, the dam is no longer in operation ("CSS - 5465"). Figure 44 shows the
view of Namal Dam.
Figure 44: Namal dam (source: "Panoramio - Photo Explorer" 2008)

Page: 83 MASTERS OF SCIENCE IN RENEWABLE ENERGY DISSERTATION
MURDOCH UNIVERSITY
Chapter 4 SIMULATION ANALYSIS
Investigation of a renewable resource is a complex process hence simulators also known as energy
models are created to help provide real-world replication and predict how the system will perform
after implemantation. Such simulation tools comprise of series of complex mathematical models
trying to trace the most energy efficient measures and feasible option. Example of such models are:
Energy flow optimization model (EFOM) to evaluate distributed energy potential and developed by
Commission of European Communities (Cormio et al. 2003), (Dicorato, Forte and Trovato 2008).
MetaNet model is drawn up to study Japanese energy mix in rural areas (Nakata, Kubo and Lamont
2005). Optimal Renewable Energy Mathematical model (OREM) is being used in India (Iniyan and
Sumathy 2003). Inexact Community Scale Energy Model (Cai et al. 2009). MARKet Allocation model
(MARKAL) is designed by the International Energy Agency (IEA) mainly used in Finland and Japan
(Lehtilä and Pirilä 1996), (Endo and Ichinohe 2006)
The preceding chapters of this dissertation focus on analyzing the solarization of load and
verification with two simulation software.
Tools used for simulation
RETScreen 4 developed by CANMET.
HOMER Legacy Version 2.68 developed by NREL.
4.1 RETSCREEN 4 The RETScreen software also known as Renewable Energy Project Analysis Software is designed by
CANMET, Natural Resources of Canada in collaboration with NASA, World Bank and UNEP. Where
NASA provided satellite-derived solar energy data set and surface meteorology, the world bank
provided data on world bank prototype carbon fund. This tool is used for the evaluation of the
financial and technical viability of renewable projects. This tool consists of integrated and
standardized project analysis that estimation energy production, life-cycle cost and GHG emissions
reduction for several types of proposed energy efficient technologies. Moreover, this tool includes
international weather databases, the cost of products and is free for download.
This software was designed in 1991 and is available free of charge in 35 languages and is being used
in private firms, colleges, universities and energy consultants for evaluating Renewable energy
projects. One of the main driving factors that led to the development of the RETScren was that
developer observed that several opportunities for implementation of commercially viable energy
projects were unable to implement due to decision makers, who didn’t have confidence in the
outcomes and often failed to appreciate the benefits of implemanting renewable energy

Page: 84 MASTERS OF SCIENCE IN RENEWABLE ENERGY DISSERTATION
MURDOCH UNIVERSITY
technologies(Kofi 2005). With the help of this tool the projects can be assessed during initial
planning phase if they are reliable and cost-effective(CANMET, 1996). Hence this software can be
employed effectively in promoting the deployment of renewable projects by helping capacity
building, confidence for decision makers, reducing dependency on conventional sources and
assessment of the feasibility of the project (RET screen, 2016).
Figure 45 is based on a survey of project cost for small-scale hydroelectric projects conducted by
World Bank and it depicts that the typical progression of increasing project accuracy as the project
moves from inception to completion. Here horizontal axis represents the increase in financial
investment of the project. Moreover it indicates that early stage of development does not
necessarily account for the accuracy of the project(Retscreen, 2016).
Figure 45: Accuracy of project cost estimates (RETScreen, 2016).
4.1.1 RET Screen Overview The software interface is based on Microsoft Excel spreadsheets. The current version consists of
following technologies.
(i) Solar water heating.
(ii) Passive solar heating.
(iii) Photovoltaics
(iv) Small hydro
(v) biomass heating

Page: 85 MASTERS OF SCIENCE IN RENEWABLE ENERGY DISSERTATION
MURDOCH UNIVERSITY
(vi) wind energy
(vii) solar air heating
(viii) ground source heats pump
(ix) combine heat and power system
All these models are equipped with specific databases to simplify the analysis process. These
databases Include:
International weather data from 4700 ground monitoring stations and satellite
derived NASA meteorology and solar energy data set
International product data from more than 1000 supplier
Comprehensive online user help
Typical cost information in the Canadian context.
Figure 46: RET Screen Model Flow Chart (RETScreen, 2016).
The first step begins with the energy model where information such as type, the number of turbines,
the height of wind measurement, average wind speed are provided then software calculates values
such as power capacity and annual energy production.
The second step is cost analysis where cost information estimates on the feasibility study, energy
equipment, development, engineering and miscellaneous costs are provided.
The third phase is GHG analysis where it is optional to assess emissions. This sheet can be used to
determine the reduction in the GHG emission as a result of using renewable technology.
The fourth step is financial analysis where inflation rate, discount rate, project life, etc. is provided
and sensitivity analysis can be run on it. Then RETScreen financial indicators evaluate the viability of
the project. The indicator includes NPV, IRR, benefit-cost ratio, yearly cash flow and cumulative cash
flow.

Page: 86 MASTERS OF SCIENCE IN RENEWABLE ENERGY DISSERTATION
MURDOCH UNIVERSITY
The last step involves risk and sensitivity analysis. It is an optional step and it helps users to
determine the uncertainty in input parameters and their effect on the overall viability of the project.
4.1.2 Software Validation Independent validation of RET Screen by comparing other software report accurate results. A
comparison of RET Screen with another model that used hourly values showed almost same results
with an annual difference of less than 5 percent. Bekker in 2008 explored the accuracy of RETScreen
and HOMER by comparing a MATLAB bases software called SunSim which observes five-minute
weather data (Bekker and Gaunt 2008). Gilman in 2007 did validation test of RET Screen with
HOMER and Hybrid2
The graph below illustrates the adequacy of validation results from RET Screen against Homer.
0
20
40
60
80
100
120
140
160
Jan Feb Mar Apr May Jun Jul Aug Sep Oct Nov Dec
Month
PV
Po
we
r (k
Wh
)
HOMER
RETScreen
Figure 47: Validation test of RET Screen by comparison of PV energy production with HOMER
4.1.3 Estimation of PV Using RETScreen Model The database of RETScreen is used to estimate the number of solar panel needed to meet the load.
As part of RETScreen simulation software, initially, the general information and climate condition at
the reference site were added. Mianwali is the closest city available in RETScreen software tool
which is selected to access the solar potential of this region. The Load & Network Design worksheet
is used to the evaluation of the power loads for each month of the base case and proposed case
systems. The PV estimation results are shown in figure 48. The monocrystalline silicon cells from
Canadian Solar are selected. RETScreen estimated 405 units of 300W solar panels with an efficiency

Page: 87 MASTERS OF SCIENCE IN RENEWABLE ENERGY DISSERTATION
MURDOCH UNIVERSITY
of 15.6% required to meet the power capacity of 121.50kW. The solar collector area required is
777m2 which is suitable to install on the roof of the namal building.
Figure 48: Solar PV size estimation
Remaining detail of RETScreen simulation can be found in appendices.
4.2 HOMER (Hybrid Optimization of Multiple Energy Resources)
4.2.1 HOMER Overview
HOMER also known as hybrid optimization of multiple energy resources is another optimization tool
designed by the United States national renewable energy laboratory (NREL). This tool can be utilized
to investigate and develop electricity or heat generating system hour wise. This model is based on
system’s economic and technical specification; hence the subsystem’s physical behavior and life
cycle cost including both installation and operation costs (Farret et al. 2006). This software is capable
of modeling grid-connected or off-grid-connected thermal and electric load with the combination of
wind turbines, biomass, PV modules, hydro, fuel cell, hydrogen storage, generators and batteries. It
designs as well as analyses, associated with technique choices and also the addition associated with
concerns. The method complexness, as well as doubt improves whenever alternative resources tend
to be within the program, as they are non-dispatch capable as well as irregular character.
Homer perform three main tasks which are simulation optimization and sensitivity analysis. At
simulation stage, the software models the performance of the proposed system configuration by
using hourly calculations of the whole year to calculate the technical feasibility and life-cycle cost.
During optimization phase, this software simulates various system configuration and nominate the
most feasible option at the lowest life-cycle cost. In a sensitivity analysis, the software performs
multiple optimizations under a range of input assumption to find the effect of uncertainty in the
Photovoltaic
Type mono-Si
Power capacity kW 121.50
Manufacturer
Model 405 unit(s)
Efficiency % 15.6%
Nominal operating cell temperature °C 45
Temperature coefficient % / °C 0.40%
Solar collector area m² 777
Control method
Miscellaneous losses % 10.0%
Inverter
Efficiency % 90.0%
Capacity kW 100.0
Miscellaneous losses % 10.0%
Summary
Capacity factor % 15.7%
Electricity delivered to load MWh 123.229
Electricity exported to grid MWh 44.372
Canadian Solar
mono-Si - CS6X-300M - MaxPower
Maximum power point tracker

Page: 88 MASTERS OF SCIENCE IN RENEWABLE ENERGY DISSERTATION
MURDOCH UNIVERSITY
input configuration. Figure 49 illustrates the relationship between simulation, optimization and
sensitivity analysis.
Figure 49: Simulation, Optimization and Sensitivity Analysis
Here simulation oval is enclosed by optimization oval to represent that fact that ultimate
optimization consists of several simulations. Moreover, optimization oval is enclosed by sensitivity
analysis to express that single sensitivity is based on several optimizations.
4.2.2 Simulation Simulation in HOMER relies on hourly inputs to provide adequate accuracy in the modeling of the
renewable power source. It calculates available intermittent power source and compares it with
desired 24 hours load for each month of the year. Then HOMER automatically adds the user
specified randomness of each day inputs. For this analysis load inputs of 2015-2016 were used and
detail of yearly load data for each month can be found in appendices.
4.2.2.1 Base case inputs
Primary load input
As the average daily load of college stays almost constant, therefore, the noise of 10% was added for
day to day variation while 20% the for the time step. HOMER calculated the average daily load of
353.77 kWh/day while the peak load is calculated as 146.43 kW with a load factor of 0.1. Yearly load
data and an average of every hour of the month can be found in the appendices. Figure 50 shows
the detail of input load for the proposed system.

Page: 89 MASTERS OF SCIENCE IN RENEWABLE ENERGY DISSERTATION
MURDOCH UNIVERSITY
Figure 50: HOMER Primary Load Input
Photovoltaic Input
Figure 51 shows the solar input component. The selected solar panels are named as Canadian Solar
max power cs6x-310 with the efficiency of 16%. The capital cost of solar PV system is $900 with
operation and maintenance cost of $10 per year. The operation and maintenance cost are low
because PV does not require much maintenance. The life of the panels is estimated at 25 years with
a derating factor of 80%.
Figure 51: Photovoltaic Input
Grid input
As mentioned before, the college is connected to the electricity grid. The current grid power price is
0.15 $/kWh and the sell back price in Pakistan is 0.020 $/kWh. Then Homer calculated the equivalent
GHG emissions which include carbon dioxide of 632 g/kWh, sulfur dioxide of 2.74 g/kWh and
nitrogen oxides of 1.34 g/kWh. The grid input and emission details can be seen in figure 52.
Figure 52: Grid input
Converter

Page: 90 MASTERS OF SCIENCE IN RENEWABLE ENERGY DISSERTATION
MURDOCH UNIVERSITY
The proposed converter is allowed to work parallel with AC generator. The life of inverter is
considered as 15 years with the efficiency of 90%. The rectifier capacity is specified as 100% with an
efficiency of 85%. The capital cost of the inverter is $250 and replacement cost of $300. The
converter details can be seen in figure 53.
Figure 53: Converter detail
Battery inputs
The selected batteries specification includes 2V batteries with ten strings having initial SOC of 100%
and minimum SOC of 20%. Moreover, the lifetime of selected batteries is ten year with the capital
cost of $600 and replacement cost of $600. The battery details can be seen in figure 54.
Figure 54: Battery input details
Diesel generator Inputs
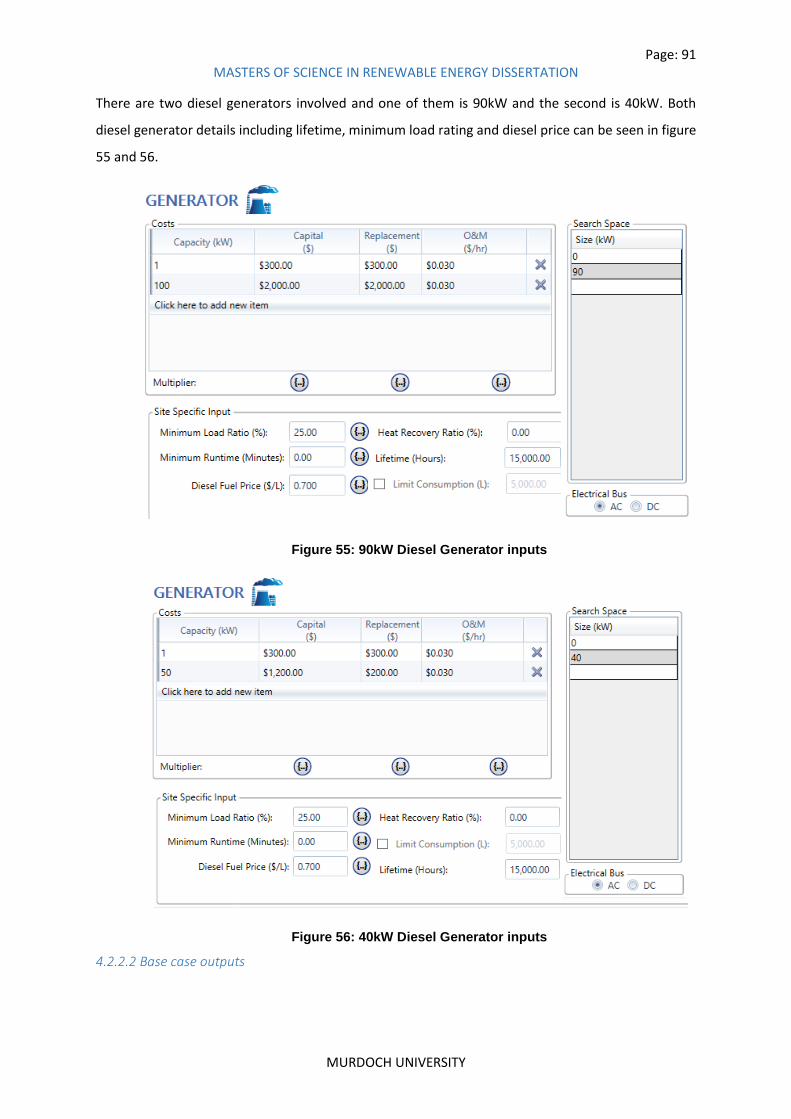
Page: 91 MASTERS OF SCIENCE IN RENEWABLE ENERGY DISSERTATION
MURDOCH UNIVERSITY
There are two diesel generators involved and one of them is 90kW and the second is 40kW. Both
diesel generator details including lifetime, minimum load rating and diesel price can be seen in figure
55 and 56.
Figure 55: 90kW Diesel Generator inputs
Figure 56: 40kW Diesel Generator inputs
4.2.2.2 Base case outputs
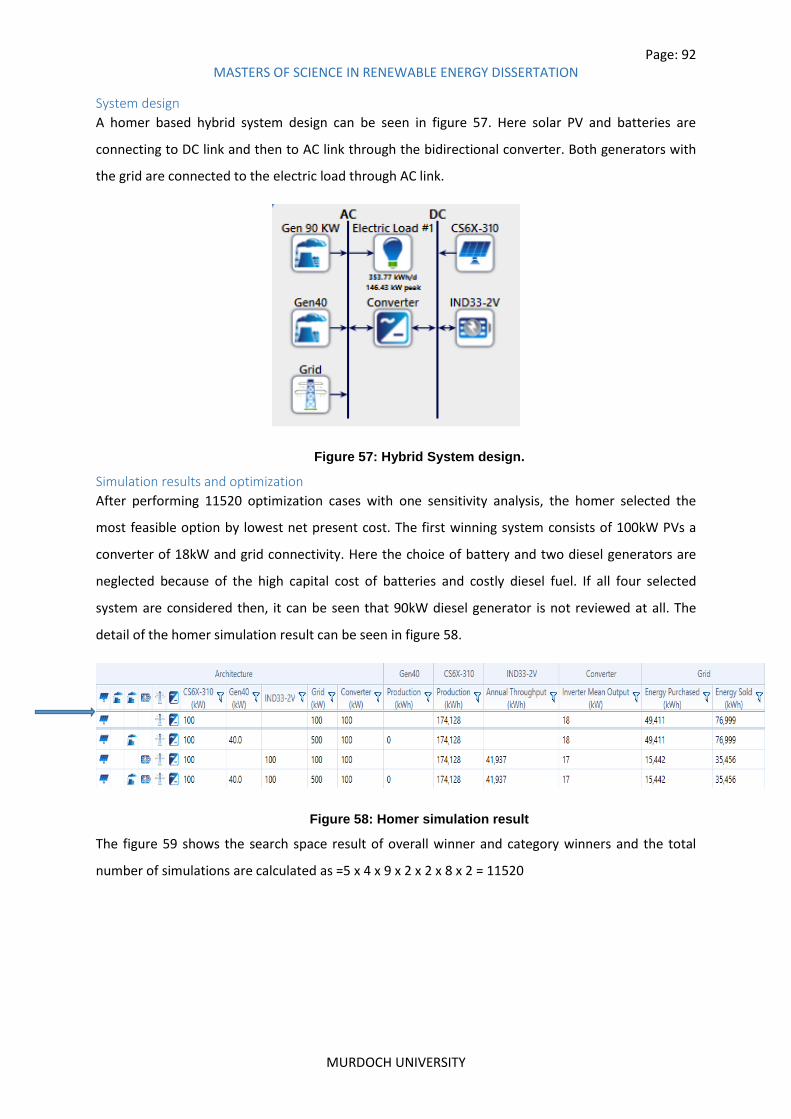
Page: 92 MASTERS OF SCIENCE IN RENEWABLE ENERGY DISSERTATION
MURDOCH UNIVERSITY
System design
A homer based hybrid system design can be seen in figure 57. Here solar PV and batteries are
connecting to DC link and then to AC link through the bidirectional converter. Both generators with
the grid are connected to the electric load through AC link.
Figure 57: Hybrid System design.
Simulation results and optimization
After performing 11520 optimization cases with one sensitivity analysis, the homer selected the
most feasible option by lowest net present cost. The first winning system consists of 100kW PVs a
converter of 18kW and grid connectivity. Here the choice of battery and two diesel generators are
neglected because of the high capital cost of batteries and costly diesel fuel. If all four selected
system are considered then, it can be seen that 90kW diesel generator is not reviewed at all. The
detail of the homer simulation result can be seen in figure 58.
Figure 58: Homer simulation result
The figure 59 shows the search space result of overall winner and category winners and the total
number of simulations are calculated as =5 x 4 x 9 x 2 x 2 x 8 x 2 = 11520

Page: 93 MASTERS OF SCIENCE IN RENEWABLE ENERGY DISSERTATION
MURDOCH UNIVERSITY
Figure 59: Search space result
Electricity output
Here figure 60 show demonstrates monthly average electricity production.
Figure 60: Monthly average electricity production
Figure 61 shows the electricity purchase of friend throughout the year for 24 hours of the day and is
overserved that most of the electricity purchased is during mid-day and rest demand is fulfilled by
PV and no or less electricity is purchased using the month of June and August
Figure 61: Grid purchases
The annual electricity production from solar PVs is 173128 kWh per year with a percentage of 77.9%
and grid contributes 49411 kWh per year with a percentage of 22.10%. Moreover, the consumption

Page: 94 MASTERS OF SCIENCE IN RENEWABLE ENERGY DISSERTATION
MURDOCH UNIVERSITY
pattern shows that out of 206126 kWh per year of electricity, the AC primary load consumption is
62.64% while 37.36% is sold to the grid. The detail of electricity production and consumption can be
seen in Table 29.
Table 29: Electrical production and consumption
Production kWh/yr. %
Canadian Solar MAXPOWER CS6X-310 174128 77.90
Grid Purchases 49411 22.10
Total 223539 100
Consumption kWh/yr. %
AC Primary Load 129127 62.64
DC Primary Load 0 0
Grid Sales 76999 37.36
Total 206126 100
Economic analysis
Figure 62 shows the cash flow summary of the proposed system. The net present cost of this system
is $214,166, operating cost is $7,670 per year and leveled cost of electricity is $.0803 per kWh
Figure 62: Cash flow summary
figure 63 shows the cash flow summary and it can be seen that capital cost and operating expenses
are the two largest contributors to overall system cost

Page: 95 MASTERS OF SCIENCE IN RENEWABLE ENERGY DISSERTATION
MURDOCH UNIVERSITY
Figure 63: Cash flow by cost type
GHG emissions
Figure 64 shows the emission details and negative emission of carbon dioxide, sulfur dioxide and
nitrogen oxides show that the large proportion of electricity is sold to the grid.
Figure 64: GHG analysis
The remaining Homer simulation details can be found in appendices.
During these simulations, RETScreen is used to estimate the number of solar panels and required
area while the in-depth technical and economic feasibility analysis is conducted by using Homer
because RETScreen does not perform time series simulation.
CONCLUSION
Energy is an essential element for the social and economic development of a country because it is
used in all aspect of modern life such as building, industries, agriculture and transportation. World
energy demand is continuously increasing and building sector is one of many contributors to this rise
in demand. So one of the strategic solution to reduce the total energy demand is by improving
energy efficiency in buildings
A pilot study was undertaken to inspect the energy-efficient approaches, how they relate to energy
efficiency improvement and their complex interaction with an energy requirement of the subject
building, along with an analysis of the feasibility of the renewable technology. To gain insight into
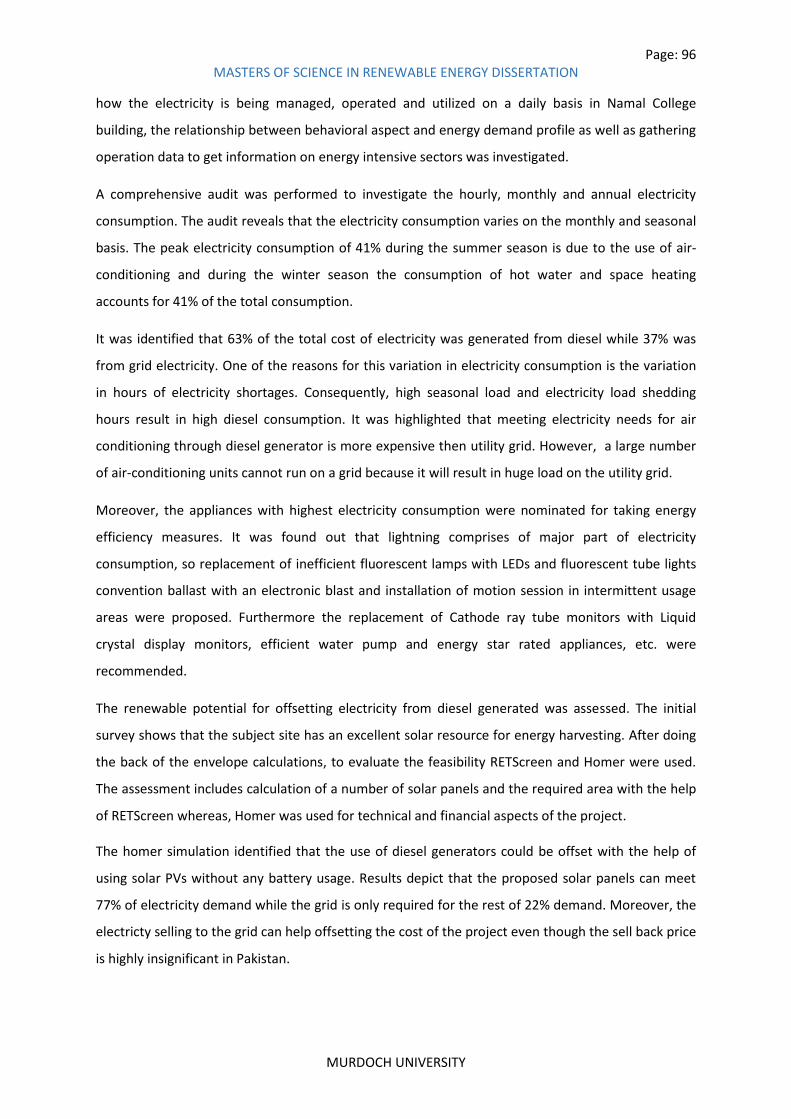
Page: 96 MASTERS OF SCIENCE IN RENEWABLE ENERGY DISSERTATION
MURDOCH UNIVERSITY
how the electricity is being managed, operated and utilized on a daily basis in Namal College
building, the relationship between behavioral aspect and energy demand profile as well as gathering
operation data to get information on energy intensive sectors was investigated.
A comprehensive audit was performed to investigate the hourly, monthly and annual electricity
consumption. The audit reveals that the electricity consumption varies on the monthly and seasonal
basis. The peak electricity consumption of 41% during the summer season is due to the use of air-
conditioning and during the winter season the consumption of hot water and space heating
accounts for 41% of the total consumption.
It was identified that 63% of the total cost of electricity was generated from diesel while 37% was
from grid electricity. One of the reasons for this variation in electricity consumption is the variation
in hours of electricity shortages. Consequently, high seasonal load and electricity load shedding
hours result in high diesel consumption. It was highlighted that meeting electricity needs for air
conditioning through diesel generator is more expensive then utility grid. However, a large number
of air-conditioning units cannot run on a grid because it will result in huge load on the utility grid.
Moreover, the appliances with highest electricity consumption were nominated for taking energy
efficiency measures. It was found out that lightning comprises of major part of electricity
consumption, so replacement of inefficient fluorescent lamps with LEDs and fluorescent tube lights
convention ballast with an electronic blast and installation of motion session in intermittent usage
areas were proposed. Furthermore the replacement of Cathode ray tube monitors with Liquid
crystal display monitors, efficient water pump and energy star rated appliances, etc. were
recommended.
The renewable potential for offsetting electricity from diesel generated was assessed. The initial
survey shows that the subject site has an excellent solar resource for energy harvesting. After doing
the back of the envelope calculations, to evaluate the feasibility RETScreen and Homer were used.
The assessment includes calculation of a number of solar panels and the required area with the help
of RETScreen whereas, Homer was used for technical and financial aspects of the project.
The homer simulation identified that the use of diesel generators could be offset with the help of
using solar PVs without any battery usage. Results depict that the proposed solar panels can meet
77% of electricity demand while the grid is only required for the rest of 22% demand. Moreover, the
electricty selling to the grid can help offsetting the cost of the project even though the sell back price
is highly insignificant in Pakistan.

Page: 97 MASTERS OF SCIENCE IN RENEWABLE ENERGY DISSERTATION
MURDOCH UNIVERSITY
It is hoped that the applicability of such model can help the facility to achieve signification energy
savings.
REFERENCES
A Meta-Analysis Of Energy Savings From Lighting Controls In Commercial Buildings. 2012.
eScholarship, University of California.
Aedb.org,. 2015. 'Alternative Energy Development Board'. http://www.aedb.org/Main.htm.
Alliance Commission on National Energy Efficiency Policy,. 2013. The History Of Energy Efficiency.
https://www.ase.org/sites/ase.org/files/resources/Media%20browser/ee_commission_history_repo
rt_2-1-13.pdf.
Alshuwaikhat, Habib M. and Ismaila Abubakar. 2008. "An Integrated Approach To Achieving Campus
Sustainability: Assessment Of The Current Campus Environmental Management Practices". Journal
Of Cleaner Production 16 (16): 1777-1785. doi:10.1016/j.jclepro.2007.12.002.
Anink, David, John Mak and Chiel Boonstra. 2004. Handbook Of Sustainable Building. London: James
& James.
Apergis, Nicholas and James E. Payne. 2010. "Energy Consumption And Growth In South America:
Evidence From A Panel Error Correction Model". Energy Economics 32 (6): 1421-1426.
doi:10.1016/j.eneco.2010.04.006.
Archive, AAJ. 2007. "Shaukat And Jatoi Take Up Energy Policy". Aaj News.
http://www.aaj.tv/2007/05/shaukat-and-jatoi-take-up-energy-policy/.
Asian Development Bank (ADB),. 2009. Taking Control Of Oil: Managing Dependence On Petroleum
Fuels In The Pacific. Pacific Studies Series.
http://www.adb.org/sites/default/files/publication/27513/taking-control-oil.pdf.
Asimakopoulos, D.A., M. Santamouris, I. Farrou, M. Laskari, M. Saliari, G. Zanis and G. Giannakidis et
al. 2012. "Modeling The Energy Demand Projection Of The Building Sector In Greece In The 21St
Century". Energy And Buildings 49: 488-498. doi:10.1016/j.enbuild.2012.02.043.
Au-Yong, Cheong Peng, Azlan Shah Ali and Faizah Ahmad. 2014. "Improving Occupants' Satisfaction
With Effective Maintenance Management Of HVAC System In Office Buildings". Automation In
Construction 43: 31-37. doi:10.1016/j.autcon.2014.03.013.

Page: 98 MASTERS OF SCIENCE IN RENEWABLE ENERGY DISSERTATION
MURDOCH UNIVERSITY
Azar, Elie and Carol C. Menassa. 2012. "A Comprehensive Analysis Of The Impact Of Occupancy
Parameters In Energy Simulation Of Office Buildings". Energy And Buildings 55: 841-853.
doi:10.1016/j.enbuild.2012.10.002.
Bakht, Malik Sikander. 2010. "World Geothermal Congress 2000". In AN OVERVIEW OF
GEOTHERMAL RESOURCES OF PAKISTAN. Tohoku, Japan. http://www.geothermal-
energy.org/pdf/IGAstandard/WGC/2000/R0707.PDF.
Bekker, Bernard and Trevor Gaunt. 2008. "Simulating The Impact Of Design-Stage Uncertainties On
PV Array Energy Output Estimation". In 16Th Power Systems Computation Conference. Glasgow
Scotland: Curran Associates, Inc. http://toc.proceedings.com/09071webtoc.pdf.
Belke, Ansgar, Frauke Dobnik and Christian Dreger. 2011. "Energy Consumption And Economic
Growth: New Insights Into The Cointegration Relationship". Energy Economics 33 (5): 782-789.
doi:10.1016/j.eneco.2011.02.005.
Bhutta, Nauman. 2008. "Wind Power Projects And Role Of Government". In World Wing Energy
Conference Energy Wing, Planning Commission, 24-26.
http://citeseerx.ist.psu.edu/showciting;jsessionid=9F5F2F11C8AFB22E94F423460DE8672D?cid=280
35113.
Buildings performance Institute Europe (BPIE),. 2011. Europe's Buildings Under The Microscope, A
Country-By-Country Review Of The Energy Performance Of Buildings 2011. Brussels.
Buildinggreen.Com. Accessed August 18.
https://www.buildinggreen.com/sites/default/files/live/images/8-3%20Sun%20angles.gif.
Cai, Y.P., G.H. Huang, Z.F. Yang, Q.G. Lin and Q. Tan. 2009. "Community-Scale Renewable Energy
Systems Planning Under Uncertainty—An Interval Chance-Constrained Programming Approach".
Renewable And Sustainable Energy Reviews 13 (4): 721-735. doi:10.1016/j.rser.2008.01.008.
"Calculation Of Sun’S Position In The Sky For Each Location On The Earth At Any Time Of Day". 2016.
Sunearthtools.Com. Accessed August 20.
http://www.sunearthtools.com/dp/tools/pos_sun.php#annual.
Canadian Wind Energy Association (CanWEA), Wind Energy Basic Information, Backgrounder
Published with Support from CANMET, 1996.
Carlo, Joyce and Roberto Lamberts. 2008. "Development Of Envelope Efficiency Labels For
Commercial Buildings: Effect Of Different Variables On Electricity Consumption". Energy And
Buildings 40 (11): 2002-2008. doi:10.1016/j.enbuild.2008.05.002.

Page: 99 MASTERS OF SCIENCE IN RENEWABLE ENERGY DISSERTATION
MURDOCH UNIVERSITY
Chung, Min Hee and Eon Ku Rhee. 2014. "Potential Opportunities For Energy Conservation In
Existing Buildings On University Campus: A Field Survey In Korea". Energy And Buildings 78: 176-182.
doi:10.1016/j.enbuild.2014.04.018.
Chung, Min Hee and Eon Ku Rhee. 2014. "Potential Opportunities For Energy Conservation In
Existing Buildings On University Campus: A Field Survey In Korea". Energy And Buildings 78: 176-182.
doi:10.1016/j.enbuild.2014.04.018.
COMMUNICATION FROM THE COMMISSION TO THE EUROPEAN PARLIAMENT, THE COUNCIL, THE
EUROPEAN ECONOMIC AND SOCIAL COMMITTEE AND THE COMMITTEE OF THE REGIONS. 2016.
Energy Efficiency Plan 2011. Brussels.
http://ec.europa.eu/clima/policies/strategies/2050/docs/efficiency_plan_en.pdf.
Cormio, C., M. Dicorato, A. Minoia and M. Trovato. 2003. "A Regional Energy Planning Methodology
Including Renewable Energy Sources And Environmental Constraints". Renewable And Sustainable
Energy Reviews 7 (2): 99-130. doi:10.1016/s1364-0321(03)00004-2.
D’Orazio, M., C. Di Perna and E. Di Giuseppe. 2010. "The Effects Of Roof Covering On The Thermal
Performance Of Highly Insulated Roofs In Mediterranean Climates". Energy And Buildings 42 (10):
1619-1627. doi:10.1016/j.enbuild.2010.04.004.
Dicorato, M., G. Forte and M. Trovato. 2008. "Environmental-Constrained Energy Planning Using
Energy-Efficiency And Distributed-Generation Facilities". Renewable Energy 33 (6): 1297-1313.
doi:10.1016/j.renene.2007.07.011.
"Diesel - Monthly Price (Pakistan Rupee Per Gallon) - Commodity Prices - Price Charts, Data And
News - Indexmundi". 2016. Indexmundi.Com. Accessed August 14.
Tahir Masood, Muhammad and Fawad Shah. 2012. "Dilemma Of Third World Countries - Problems
Facing Pakistan Energy Crisis A Case-In-Point". IJBM 7 (5). doi:10.5539/ijbm.v7n5p231.
http://www.indexmundi.com/commodities/?commodity=diesel&months=60¤cy=pkr.
Directive 2002/91/CE of the European Parliament and the Council of 16 December 2002 on the
Energy Performance of Buildings, 2002
Endo, Eiichi and Masayuki Ichinohe. 2006. "Analysis On Market Deployment Of Photovoltaics In
Japan By Using Energy System Model MARKAL". Solar Energy Materials And Solar Cells 90 (18-19):
3061-3067. doi:10.1016/j.solmat.2006.06.049.

Page: 100 MASTERS OF SCIENCE IN RENEWABLE ENERGY DISSERTATION
MURDOCH UNIVERSITY
Lausts, Jens. 2008. ENERGY EFFICIENCY REQUIREMENTS IN BUILDING CODES, ENERGY EFFICIENCY
POLICIES FOR NEW BUILDINGS. IEA Information Paper, In Support Of The G8 Plan Of Action.
International energy agency Agence Internationale de l’energie.
https://www.iea.org/publications/freepublications/publication/Building_Codes.pdf.
Energy Information Administration (EIA), “International energy outlook 2011,”Washington, 2012.
Energy information Administration (IEA),. 2012. International Energy Outlook 2011. Washington.
Energy Yearbook, (2000, 2014). Hydrocarbon Development Institute of Pakistan., Government of
Pakistan, Islamabad.
Energy-efficient lighting "LED Light Bulbs: Comparison Charts - Eartheasy.Com Solutions For
Sustainable Living". Eartheasy.Com. Accessed July 24.
http://eartheasy.com/live_led_bulbs_comparison.html.
Environmental and Energy Study Institute, EESI Washington, DC,. 2006. Fact Sheet : Building Energy
Efficiency (2006) Energy-Efficient Buildings: Using Whole Building Design To Reduce Energy
Consumption In Homes And Offices. http://files.eesi.org/buildings_efficiency_0506.pdf accessed on
Jan 11, 2011.
Farret, Felix A, M. Godoy Sim es, TO LA E T, PAUL GILMAN and PETER LILIENTHAL. 2006.
"MICROPOWER SYSTEM MODELING WITH HOMER". Integration Of Alternative Sources Of Energy,
379-385. doi:10.1002/0471755621.
Google Maps. 2005. Windows. Google.
Harijan, Khanji, Mohammad A. Uqaili, Mujeebuddin Memon and Umar K. Mirza. 2009. "Assessment
Of Centralized Grid Connected Wind Power Cost In Coastal Area Of Pakistan". Renewable Energy 34
(2): 369-373. doi:10.1016/j.renene.2008.05.001.
Harijan, Khanji. 2008. "Modelling And Analysis Of The Potential Demand For Renewable Sources Of
Energy In Pakistan". Ph.D., Mehran University of Engineering and Technology, Jamshoro, Pakistan.
Hawken, Paul, Amory B Lovins and L. Hunter Lovins. 1999. Natural Capitalism. Boston: Little, Brown
and Co.
Hawken, Paul, Amory Lovins and Hunter L Lovins. 1999. Natural Capitalism. New York: Little, Brown
and Company.
Henry, Harold W. 1980. Energy Management. New York: M. Dekker.

Page: 101 MASTERS OF SCIENCE IN RENEWABLE ENERGY DISSERTATION
MURDOCH UNIVERSITY
HomerEnergy, L.L.C. Software HOMER, HOMER Pro 3.6.3; the Micropower Optimization Model.
www.homerenergy.com
Hoppe, T., J.Th.A. Bressers and K.R.D. Lulofs. 2011. "Local Government Influence On Energy
Conservation Ambitions In Existing Housing Sites—Plucking The Low-Hanging Fruit?". Energy Policy
39 (2): 916-925. doi:10.1016/j.enpol.2010.11.016.
Hyde, Richard. 2000. Climate Responsive Design. London: E & FN Spon.
Hydrocarbon Development Institute of Pakistan,. 2014. Pakistan Energy Yearbook.
http://hdip.com.pk/contents/Energy-Yearbook-2014/32.html.
Iniyan, S and K Sumathy. 2003. "The Application Of A Delphi Technique In The Linear Programming
Optimization Of Future Renewable Energy Options For India". Biomass And Bioenergy 24 (1): 39-50.
doi:10.1016/s0961-9534(02)00089-2.
Isci, A. and G.N. Demirer. 2007. "Biogas Production Potential From Cotton Wastes". Renewable
Energy 32 (5): 750-757. doi:10.1016/j.renene.2006.03.018.
Jakovac, Pavle. 2013. "Empirical Analysis On Economic Growth And Energy Consumption
Relationship In Croatia." Economic Research-Ekonomska Istraživanja 26 (4): 21-42.
doi:10.1080/1331677x.2013.11517628.
Jamil, Faisal and Eatzaz Ahmad. 2010. "The Relationship Between Electricity Consumption, Electricity
Prices And GDP In Pakistan". Energy Policy 38 (10): 6016-6025. doi:10.1016/j.enpol.2010.05.057.
Javaid, M. Arshad, Sarfraz Hussain, Abdul Maqsood, Majid Idrees, Zeba Arshad and M.Awais Arshad.
2005. "Electrical Energy Crisis In Pakistan And Their Possible Solutions". International Journal Of
Basic & Applied Sciences 11 (05): 26-35. http://ijens.org/vol_11_I_05/110505-9393-ijbas-ijens.pdf.
Kalhoro, A.N. and A.K. Abro. 2005. "Global Irradiation On Horizontal Surface At Hyderabad,
Pakistan". Mehran University Research Journal Of Engineering And Technology 24 (1): 45-52.
https://inis.iaea.org/search/search.aspx?orig_q=RN:36079340.
Kazmi, Ali H and M. Qasim Jan. 1997. Geology And Tectonics Of Pakistan. Karachi: Graphic
Publishers.
Kofi, Emmanuel. 2005. "Technical & Economic Viability Analysis Of Renewable Energy Technologies
In Ghana". Ph.D. dissertation, The Brandenburg University of Technology.
Krarti, Moncef. 2012. Weatherization And Energy Efficiency Improvement For Existing Homes. Boca
Raton, FL: CRC Press.
Page: 102 MASTERS OF SCIENCE IN RENEWABLE ENERGY DISSERTATION
MURDOCH UNIVERSITY
Kurokawa, Kosuke. 2003. Energy From The Desert. London: James & James (Science Publishers).
Lee, Chien-Chiang and Chun-Ping Chang. 2008. "Energy Consumption And Economic Growth In Asian
Economies: A More Comprehensive Analysis Using Panel Data". Resource And Energy Economics 30
(1): 50-65. doi:10.1016/j.reseneeco.2007.03.003.
Lehtilä, A and P Pirilä. 1996. "Reducing Energy-Related Emissions". Energy Policy 24 (9): 805-819.
doi:10.1016/0301-4215(96)00066-3.
Hoppe, T., J.Th.A. Bressers and K.R.D. Lulofs. 2011. "Local Government Influence On Energy
Conservation Ambitions In Existing Housing Sites—Plucking The Low-Hanging Fruit?". Energy Policy
39 (2): 916-925. doi:10.1016/j.enpol.2010.11.016.
Lorde, Troy, Kimberly Waithe and Brian Francis. 2010. "The Importance Of Electrical Energy For
Economic Growth In Barbados". Energy Economics 32 (6): 1411-1420.
doi:10.1016/j.eneco.2010.05.011.
Masih, Abul M.M. and Rumi Masih. 1996. "Energy Consumption, Real Income And Temporal
Causality: Results From A Multi-Country Study Based On Cointegration And Error-Correction
Modelling Techniques". Energy Economics 18 (3): 165-183. doi:10.1016/0140-9883(96)00009-6
MEIER, Alan and Benoît LEBOT. 1999. "One Watt Initiative : A Global Effort To Reduce Leaking
Electricity". In 32 ENERGY CONSERVATION, CONSUMPTION AND UTILIZATION; APPLIANCES;
COMMERCIAL BUILDINGS; ELECTRIC POWER; ELECTRICITY; TARGETS LEAKING ELECTRICITY STANDBY
LOSSES.
http://www.eceee.org/library/conference_proceedings/eceee_Summer_Studies/1999/Panel_2/p2_
2/paper.
"Mianwali, Pakistan KaPpen Climate Classification (Weatherbase)". 2016. Weatherbase. Accessed
August 23. http://www.weatherbase.com/weather/weather-
summary.php3?s=415920&cityname=Mianwali%2C+Punjab%2C+Pakistan&units=metric.
Ministry of Finance, Government of Pakistan,. 2014. Pakistan Economic Survey.
Ministry of petroleum and natural resources,. 2004. Fossil Fuel Overview. Islamabad.
Ministry of planning and development Government of Pakistan,. 2011. Pakistan Integrated Energy
Model (Pak -IEM). Policy Analysis Report Volume II. Islamabad..

Page: 103 MASTERS OF SCIENCE IN RENEWABLE ENERGY DISSERTATION
MURDOCH UNIVERSITY
Mirza, Umar K, M.Mercedes Maroto-Valer and Nasir Ahmad. 2003. "Status And Outlook Of Solar
Energy Use In Pakistan". Renewable And Sustainable Energy Reviews 7 (6): 501-514.
doi:10.1016/j.rser.2003.06.002.
Mirza, Umar K., Nasir Ahmad and Tariq Majeed. 2008. "An Overview Of Biomass Energy Utilization In
Pakistan". Renewable And Sustainable Energy Reviews 12 (7): 1988-1996.
doi:10.1016/j.rser.2007.04.001.
Mirza, Umar K., Nasir Ahmad, Khanji Harijan and Tariq Majeed. 2009. "Identifying And Addressing
Barriers To Renewable Energy Development In Pakistan". Renewable And Sustainable Energy
Reviews 13 (4): 927-931. doi:10.1016/j.rser.2007.11.006.
Mirza, Umar K., Nasir Ahmad, Tariq Majeed and Khanji Harijan. 2008. "Hydropower Use In Pakistan:
Past, Present And Future". Renewable And Sustainable Energy Reviews 12 (6): 1641-1651.
doi:10.1016/j.rser.2007.01.028.
Motta Cabrera, David F. and Hamidreza Zareipour. 2013. "Data Association Mining For Identifying
Lighting Energy Waste Patterns In Educational Institutes". Energy And Buildings 62: 210-216.
doi:10.1016/j.enbuild.2013.02.049.
Nakata, Toshihiko, Kazuo Kubo and Alan Lamont. 2005. "Design For Renewable Energy Systems With
Application To Rural Areas In Japan". Energy Policy 33 (2): 209-219. doi:10.1016/s0301-
4215(03)00218-0.
"NASA Surface Meteorology And Solar Energy - Available Tables". 2016. Atmospheric Science Data
Center. Accessed August 23. https://eosweb.larc.nasa.gov/cgi-
bin/sse/grid.cgi?&num=252123&lat=32.681&submit=Submit&hgt=100&veg=17&sitelev=&email=ski
[email protected]&p=grid_id&step=2&lon=71.792.
National Energy Conservation Centre (ENERCON), Pakistan Engineering Council (PEC), Ministry of
Housing and Works,. 2011. Building Code Of Pakistan. Energy Provision - 2011.
https://drive.google.com/file/d/0B_Ht8Q1cIEovU29nYWNGa2tDb1k/view.
National Energy Conservation Center, Ministry of Water and Power,. 2015. Islamic Republic Of
Pakistan For Institution – Building And Promotion Of Energy Saving. Final Report. Nippon Koei Co.,
Ltd. http://open_jicareport.jica.go.jp/pdf/12229381.pdf.
NEPRA National electric power regulatory authority,. 2014. State Of Industry Report.
http://www.nepra.org.pk/Publications/State%20of%20Industry%20Reports/State%20of%20Industry
%20Report%202014.pdf.

Page: 104 MASTERS OF SCIENCE IN RENEWABLE ENERGY DISSERTATION
MURDOCH UNIVERSITY
Nguyen, Tuan Anh and Marco Aiello. 2013. "Energy Intelligent Buildings Based On User Activity: A
Survey". Energy And Buildings 56: 244-257. doi:10.1016/j.enbuild.2012.09.005.
Overseas Investor Chamber of Commerce and Industry (OICCI),. 2012. A ROAD MAP FOR ENERGY
EFFICIENCY & CONSERVATION IN PAKISTAN. http://oicci.org/wp-content/uploads/2012/07/Road-
Map-for-Energy-Efficiency-Conservation.pdf.
PAKISTAN ECONOMIC SURVEY 2010-11. 2011.
http://121.52.153.178:8080/xmlui/bitstream/handle/123456789/6558/Pakistan%20Economic%20S
urvey%202010-11.pdf?sequence=3&isAllowed=y
PAKISTAN WATER AND POWER DEVELOPMENT AUTHORITY,. 2013. Hydro Power Potential In
Pakistan
Pakistan‘s Energy Crisis,.2013. From Conundrum to Catastrophe, Michael Kugelman, The National
Bureau of Asian Research, USA.
Pérez-Lombard, Luis, José Ortiz and Christine Pout. 2008. "A Review On Buildings Energy
Consumption Information". Energy And Buildings 40 (3): 394-398.
doi:10.1016/j.enbuild.2007.03.007.
Pérez-Lombard, Luis, José Ortiz and Christine Pout. 2008. "A Review On Buildings Energy
Consumption Information". Energy And Buildings 40 (3): 394-398.
doi:10.1016/j.enbuild.2007.03.007.
Planning Commission Government of Pakistan,. 2010. Final Report Of The Task Force On Climate
Change.
http://www.mocc.gov.pk/gop/index.php?q=aHR0cDovLzE5Mi4xNjguNzAuMTM2L21vY2xjL3VzZXJma
WxlczEvZmlsZS9NT0MvUHVibGljYXRpb25zJTIwb24lMjBFbnYlMjBhbmQlMjBDQy9SZXBvcnRzL1RGQ0
MlMjBGaW5hbCUyMFJlcG9ydCUyMDE5JTIwRmViJTIwMjAxMC5wZGY%3D.
Pout, C. H, Fred T Mackenzie and R Bettle. 2002. Carbon Dioxide Emissions From Non-Domestic
Buildings. Watford: CRC.
Private power and Infrastructure Board (PPIB),. 2011. Hydro Power Resources Of Pakistan.
http://www.ppib.gov.pk/HYDRO.pdf.
Punjab Board of Investment & Trade,. 2010. Power Generation from Sugar Mills. Evolving The
Business Model. https://www.scribd.com/document/179126839/Power-generation-from-sugar-
mills-pdf.

Page: 105 MASTERS OF SCIENCE IN RENEWABLE ENERGY DISSERTATION
MURDOCH UNIVERSITY
Rivas, Jessica. 2009. "Managing Plug Loads: Laptops Chargers And Fans,". In Climate Leader Web
Conference. http://www.teply/documents/events/11feb_plugloads.pdf.
Sailor, D.J. 2008. "A Green Roof Model For Building Energy Simulation Programs". Energy And
Buildings 40 (8): 1466-1478. doi:10.1016/j.enbuild.2008.02.001.
Shahbaz, Muhammad, Muhammad Zeshan and Talat Afza. 2012. "Is Energy Consumption Effective
To Spur Economic Growth In Pakistan? New Evidence From Bounds Test To Level Relationships And
Granger Causality Tests". Economic Modelling 29 (6): 2310-2319.
doi:10.1016/j.econmod.2012.06.027.
Sheikh, Munawar A. 2009. "Renewable Energy Resource Potential In Pakistan". Renewable And
Sustainable Energy Reviews 13 (9) : 2696 -2702. doi:10.1016/j.rser.2009.06.029.
Sheppy, Michael and Paul Torcellini. 2011. "Reducing Plug And Process Loads For A Large Scale, Low
Energy Office Building". In NREL's Research Support Facility. Las Vegas: Shanti Pless.
http://www.nrel.gov/docs/fy11osti/49002.pdf.
Soytas, Ugur and Ramazan Sari. 2003. "Energy Consumption And GDP: Causality Relationship In G-7
Countries And Emerging Markets". Energy Economics 25 (1): 33-37. doi:10.1016/s0140-
9883(02)00009-9.
Sozer, Hatice. 2010. "Improving Energy Efficiency Through The Design Of The Building Envelope".
Building And Environment 45 (12): 2581-2593. doi:10.1016/j.buildenv.2010.05.004.
Steemers, Koen and Geun Young Yun. 2009. "Household Energy Consumption: A Study Of The Role
Of Occupants". Building Research & Information 37 (5-6): 625-637.
doi:10.1080/09613210903186661.
Sustainable Development Policy Institute (SDPI),. 2014. Pakistan Energy Vision 2035.
https://www.sdpi.org/publications/files/Pakistan%20Energy%202035-
FINAL%2020th%20October%202014.pdf.
Teke, Ahmet and Oğuzhan Timur. 2014. "Assessing The Energy Efficiency Improvement Potentials Of
HVAC Systems Considering Economic And Environmental Aspects At The Hospitals". Renewable And
Sustainable Energy Reviews 33: 224-235. doi:10.1016/j.rser.2014.02.002.
The Energy Expert Group Economic Advisory Council Ministry of Finance Government of Pakistan ‘Q’
Block Pakistan Secretariat Islamabad,. 2013. The Energy Expert Group Economic Advisory Council
Ministry Of Finance Government Of Pakistan ‘Q’ Block Pakistan Secretariat Islamabad.

Page: 106 MASTERS OF SCIENCE IN RENEWABLE ENERGY DISSERTATION
MURDOCH UNIVERSITY
Thumann, Albert, Terry Niehus and William J Younger. 2013. Handbook Of Energy Audits. Lilburn,
GA: Fairmont Press.
Verbeek, Peter-Paul and A. F. L Slob. 2006. User Behavior And Technology Development. Dordrecht:
Springer.
WALSH, DECLAN. 2013. 'After Decades Of Neglect, Pakistan Rusts In Its Tracks, In A Journey On A
Crumbling Railway, A Picture Of A Nation’S Troubles'. Nytimes.Com.
http://www.nytimes.com/2013/05/19/world/asia/pakistans-railroads-sum-up-nations-
woes.html?_r=0.
WEBBER, C, J ROBERSON, M MCWHINNEY, R BROWN, M PINCKARD and J BUSCH. 2006. "After-Hours
Power Status Of Office Equipment In The USA". Energy 31 (14): 2823-2838.
doi:10.1016/j.energy.2005.11.007.
World Business Council for Sustainable Development (WBCSD) news on Energy Efficiency in
Buildings,,. 2009. Energy Efficiency In Buildings. http://www.wbcsd.org.
Wu, Shaomin, Keith Neale, Michael Williamson and Matthew Hornby. 2010. "Research Opportunities
In Maintenance Of Office Building Services Systems". Journal Of Quality In Maintenance Engineering
16 (1): 23-33. doi:10.1108/13552511011030309.
Yu, Zhun, Benjamin C.M. Fung, Fariborz Haghighat, Hiroshi Yoshino and Edward Morofsky. 2011. "A
Systematic Procedure To Study The Influence Of Occupant Behavior On Building Energy
Consumption". Energy And Buildings 43 (6): 1409-1417. doi:10.1016/j.enbuild.2011.02.002.
Zabalza Bribián, Ignacio, Alfonso Aranda Usón and Sabina Scarpellini. 2009. "Life Cycle Assessment In
Buildings: State-Of-The-Art And Simplified LCA Methodology As A Complement For Building
Certification". Building And Environment 44 (12): 2510-2520. doi:10.1016/j.buildenv.2009.05.001.
Zero Energy Commercial Buildings Consortium. 3 December 2009 Webinar. U.S. Department of
Energy Energy Efficiency & Renewable Energy. commercialbuildings.energy.gov.
"2050 Pathways - Detailed Guidance - GOV.UK". 2013. Gov.Uk. https://www.gov.uk/guidance/2050-
pathways-analysis.
"Biogas Plants, Equipment And Services". 2010. Beta Pak. http://betapak.org.
"CCI Approves National Energy Policy". 2013. Pakistantoday.Com.Pk.
http://www.pakistantoday.com.pk/2013/08/01/national/cci-approves-national-energy-policy/.

Page: 107 MASTERS OF SCIENCE IN RENEWABLE ENERGY DISSERTATION
MURDOCH UNIVERSITY
"ENERGY STAR Product Specification Development | ENERGY STAR". 2016. Energystar.Gov. Accessed
July 30. https://www.energystar.gov/index.cfm?c=prod_development.prod_development_index.
"Geo.Tv: Latest News Breaking Pakistan, World, Live Videos". 2016. Geo.Tv. http://www.geo.tv/4-22-
2010/63613.htm.
"Identification And Removal Of Barriers For Renewable Energy Technologies In Pakistan". 2006. In
2Nd International Conference On Emerging Technologies IEEE--ICET. Peshawar.
http://ieeexplore.ieee.org/stamp/stamp.jsp?arnumber=4136951.
"Namal College Mianwali | Namal History". Namal.Edu.Pk. https://www.namal.edu.pk/namal-
history/. "Namal College Mianwali | Namal History". Namal.Edu.Pk.
https://www.namal.edu.pk/namal-history/.
"NASA Surface Meteorology And Solar Energy - Choices". 2016. Eosweb.Larc.Nasa.Gov. Accessed July
30. https://eosweb.larc.nasa.gov/cgi-
bin/sse/grid.cgi?email=skip%40larc.nasa.gov&step=1&lat=32.681389&lon=71.791667&submit=Sub
mit.
"NREL: International Activities - Pakistan Resource Maps And Toolkit". 2015. Nrel.Gov.
http://www.nrel.gov/international/ra_pakistan.html.
"Pakistan Statistical Year Book 2011 | Pakistan Bureau Of Statistics". 2016. Pbs.Gov.Pk.
http://www.pbs.gov.pk/content/pakistan-statistical-year-book-2011.s
"Panoramio - Photo Explorer". 2008. Panoramio.Com.
http://www.panoramio.com/photo_explorer#view=photo&position=9&with_photo_id=8680671&or
der=date_desc&user=1465379.
"Powering Up: Pakistan's Push For Renewable Energy". 2007. Scidev.Net.
http://www.scidev.net/global/energy/feature/powering-up-pakistans-push-for-renewable-
energy.html.
"Retscreen | Natural Resources Canada". 2016. Nrcan.Gc.Ca. Accessed August 11.
http://www.nrcan.gc.ca/energy/software-tools/7465.
Ul Islam, Zia. 2011. "Status Of Energy Crisis & Conservation In Pakistan". Presentation.
http://www.fukuoka.unhabitat.org/kcap/activities/egm/2010/pdf/Pakistan_en.pdf

Page: 108 MASTERS OF SCIENCE IN RENEWABLE ENERGY DISSERTATION
MURDOCH UNIVERSITY
"TANDA DAM (RAMSAR SITE) Tanda Dam Is Located In Kohat - CSS - 5465". Coursehero.Com.
Accessed August 9. https://www.coursehero.com/file/p4sfgh6/TANDA-DAM-RAMSAR-SITE-Tanda-
Dam-is-lcated-in-Kohat-District-North-West-Frontier/.
"The News International: Latest News Breaking, Pakistan News". 2016. Thenews.Com.Pk.
http://www.thenews.com.pk/Todays-News-9-71398-Energised-yet-powerless.
"XE: (USD/PKR) US Dollar To Pakistani Rupee Rate". 2016. Xe.Com.
http://www.xe.com/currencyconverter/convert/?Amount=1&From=USD&To=PKR.
Zainordin, Nadzirah Binti, Siti Marina Binti Abdullah and Zarita Binti Ahmad Baharum. 2012. "Light
And Space: Users Perception Towards Energy Efficient Buildings". Procedia - Social And Behavioral
Sciences 36: 51-60. doi:10.1016/j.sbspro.2012.03.006.

Page: 109 MASTERS OF SCIENCE IN RENEWABLE ENERGY DISSERTATION
MURDOCH UNIVERSITY

Page: 110 MASTERS OF SCIENCE IN RENEWABLE ENERGY DISSERTATION
MURDOCH UNIVERSITY
APPENDICES
Appendix A
Electricity bill of Namal College

Page: 111 MASTERS OF SCIENCE IN RENEWABLE ENERGY DISSERTATION
MURDOCH UNIVERSITY
Appendix B
Annual diesel consumption
date start time stop time total running Diesel received
Ltrs Hrs Hrs hrs
1-Jun-15 9:00 18:00 9:00 180
2-Jun-15 9:00 20:00 11:00 180
3-Jun-15 9:00 18:00 9:00 180
4-Jun-15 9:00 20:00 11:00 120
5-Jun-15 9:00 18:00 9:00 180
6-Jun-15 9:00 15:00 6:00 120
7-Jun-15 9:00 - - -
8-Jun-15 9:00 19:00 10:00 180
9-Jun-15 9:00 18:00 9:00 -
10-Jun-15 9:00 17:00 8:00 180
11-Jun-15 9:00 18:00 9:00 180
12-Jun-15 9:00 15:00 6:00 180
13-Jun-15 9:00 - - 60
14-Jun-15 9:00 - - -
15-Jun-15 9:00 19:00 10:00 180
16-Jun-15 9:00 13:00 4:00 120
17-Jun-15 9:00 15:00 6:00 -
18-Jun-15 9:00 15:00 6:00 120
19-Jun-15 9:00 15:00 6:00 120
20-Jun-15 9:00 13:00 4:00 -
21-Jun-15 9:00 12:00 3:00 -
22-Jun-15 9:00 15:00 6:00 -
23-Jun-15 9:00 13:00 4:00 -
24-Jun-15 9:00 16:00 7:00
25-Jun-15 9:00 13:00 4:00 120
26-Jun-15 9:00 13:00 4:00 -
27-Jun-15 9:00 - - -
28-Jun-15 9:00 - - -
29-Jun-15 9:00 16:00 7:00 120
30-Jun-15 9:00 21:00 12:00 120
subtotal 183 2640
1-Jul-15 9:00 15:00 6:00 180
2-Jul-15 9:00 16:00 7:00 120
3-Jul-15 9:00 15:00 6:00 120
4-Jul-15 9:00 14:00 5:00 60
5-Jul-15 9:00 15:00 6:00 -
6-Jul-15 9:00 19:00 10:00 120
7-Jul-15 9:00 18:00 9:00 180
8-Jul-15 9:00 18:00 9:00 120

Page: 112 MASTERS OF SCIENCE IN RENEWABLE ENERGY DISSERTATION
MURDOCH UNIVERSITY
9-Jul-15 9:00 17:00 8:00 180
10-Jul-15 9:00 14:00 5:00 120
11-Jul-15
12-Jul-15
13-Jul-15
14-Jul-15
15-Jul-15
16-Jul-15
17-Jul-15
18-Jul-15
19-Jul-15
20-Jul-15
21-Jul-15 9:00 15:00 6:00 120
22-Jul-15 9:00 15:00 6:00 -
23-Jul-15 9:00 17:00 8:00 180
24-Jul-15 9:00 19:00 10:00 120
25-Jul-15 9:00 16:00 7:00 120
26-Jul-15 9:00 15:00 6:00 -
27-Jul-15 9:00 18:00 9:00 240
28-Jul-15 9:00 19:00 10:00 180
29-Jul-15 9:00 18:00 9:00 180
30-Jul-15 9:00 15:00 6:00 180
31-Jul-15 9:00 15:00 6:00 120
subtotal 148 2640
1-Aug-15 9:00 15:00 6:00
2-Aug-15 9:00 - - 180
3-Aug-15 9:00 16:00 7:00 -
4-Aug-15 9:00 14:00 5:00 120
5-Aug-15 9:00 13:00 4:00 -
6-Aug-15 9:00 - - -
7-Aug-15 9:00 13:00 4:00 -
8-Aug-15 9:00 - - 60
9-Aug-15 9:00 - - -
10-Aug-15 9:00 11:00 2:00 120
11-Aug-15 9:00 13:00 4:00 120
12-Aug-15 9:00 15:00 6:00 120
13-Aug-15 9:00 15:00 6:00 120
14-Aug-15 9:00 14:00 5:00 -
15-Aug-15 9:00 14:00 5:00 -
16-Aug-15 9:00 - - -
17-Aug-15 9:00 14:00 5:00 120
18-Aug-15 9:00 15:00 6:00 120
19-Aug-15 9:00 14:00 5:00 120
20-Aug-15 9:00 15:00 6:00 180

Page: 113 MASTERS OF SCIENCE IN RENEWABLE ENERGY DISSERTATION
MURDOCH UNIVERSITY
21-Aug-15 9:00 14:00 5:00 60
22-Aug-15 9:00 - - 120
23-Aug-15 9:00 - - -
24-Aug-15 9:00 14:00 5:00 120
25-Aug-15 9:00 13:00 4:00 -
26-Aug-15 9:00 14:00 5:00 120
27-Aug-15 9:00 14:00 5:00 120
28-Aug-15 9:00 14:00 5:00 60
29-Aug-15 9:00 15:00 6:00 -
30-Aug-15 9:00 - - -
31-Aug-15 9:00 13:00 4:00 120
subtotal 115 2100
1-Sep-15 9:00 15:00 6:00 -
2-Sep-15 9:00 14:00 5:00 180
3-Sep-15 9:00 14:00 5:00 120
4-Sep-15 9:00 14:00 5:00 120
5-Sep-15 9:00 13:00 4:00 -
6-Sep-15 9:00 14:00 5:00 -
7-Sep-15 9:00 - - 180
8-Sep-15 9:00 14:00 5:00 120
9-Sep-15 9:00 14:00 5:00 -
10-Sep-15 9:00 15:00 6:00 180
11-Sep-15 9:00 14:00 5:00 120
12-Sep-15 9:00 15:00 6:00 -
13-Sep-15 9:00 14:00 5:00 -
14-Sep-15 9:00 - - 120
15-Sep-15 9:00 15:00 6:00 -
16-Sep-15 9:00 - - 180
17-Sep-15 9:00 14:00 5:00 -
18-Sep-15 9:00 14:00 5:00
19-Sep-15 9:00 14:00 5:00 60
20-Sep-15 9:00 - -
21-Sep-15 9:00 13:00 4:00 120
22-Sep-15 9:00 12:00 3:00 120
23-Sep-15 9:00 16:00 7:00 -
24-Sep-15 9:00 - - 120
25-Sep-15 9:00 - - -
26-Sep-15 9:00 - - -
27-Sep-15 9:00 - - -
28-Sep-15 9:00 14:00 5:00 120
29-Sep-15 9:00 13:00 4:00 -
30-Sep-15 9:00 12:00 3:00 -
31-sep-15 9:00 - - -
subtotal 109 1860

Page: 114 MASTERS OF SCIENCE IN RENEWABLE ENERGY DISSERTATION
MURDOCH UNIVERSITY
1-Oct-15 9:00 14:00 5:00 -
2-Oct-15 9:00 16:00 7:00 180
3-Oct-15 9:00 15:00 6:00 120
4-Oct-15 9:00 - - -
5-Oct-15 9:00 13:00 4:00 -
6-Oct-15 9:00 14:00 5:00 120
7-Oct-15 9:00 12:00 3:00 -
8-Oct-15 9:00 12:00 3:00 180
9-Oct-15 9:00 14:00 5:00 60
10-Oct-15 9:00 13:00 4:00 -
11-Oct-15 9:00 - - -
12-Oct-15 9:00 14:00 5:00 180
13-Oct-15 9:00 14:00 5:00 120
14-Oct-15 9:00 15:00 6:00 120
15-Oct-15 9:00 14:00 5:00 -
16-Oct-15 9:00 14:00 5:00 60
17-Oct-15 9:00 13:00 4:00 -
18-Oct-15 9:00 - - -
19-Oct-15 9:00 12:00 3:00 120
20-Oct-15 9:00 13:00 4:00 -
21-Oct-15 9:00 15:00 6:00 -
22-Oct-15 9:00 16:00 7:00 120
23-Oct-15 9:00 - - -
24-Oct-15 9:00 - - -
25-Oct-15 9:00 - - -
26-Oct-15 9:00 13:00 4:00 120
27-Oct-15 9:00 13:00 4:00 120
28-Oct-15 9:00 13:00 4:00 -
29-Oct-15 9:00 12:00 3:00 120
30-Oct-15 9:00 13:00 4:00 120
31-Oct-15 9:00 12:00 3:00 -
subtotal 114 1860
1-Nov-15 9:00 - - -
2-Nov-15 9:00 12:00 3:00 120
3-Nov-15 9:00 13:00 4:00 -
4-Nov-15 9:00 12:00 3:00 60
5-Nov-15 9:00 12:00 3:00 -
6-Nov-15 9:00 12:00 3:00 -
7-Nov-15 9:00 12:00 3:00 120
8-Nov-15 9:00 - - -
9-Nov-15 9:00 11:00 2:00 -
10-Nov-15 9:00 11:00 2:00 -
11-Nov-15 9:00 11:00 2:00
12-Nov-15 9:00 11:00 2:00 120

Page: 115 MASTERS OF SCIENCE IN RENEWABLE ENERGY DISSERTATION
MURDOCH UNIVERSITY
13-Nov-15 9:00 11:00 2:00
14-Nov-15 9:00 11:00 2:00 60
15-Nov-15 9:00 - - -
16-Nov-15 9:00 16:00 7:00 -
17-Nov-15 9:00 18:00 9:00 120
18-Nov-15 9:00 11:00 2:00 60
19-Nov-15 9:00 10:00 1:00 -
20-Nov-15 9:00 10:00 1:00 -
21-Nov-15 9:00 11:00 2:00 -
22-Nov-15 - - - -
23-Nov-15 9:00 11:00 2:00 60
24-Nov-15 9:00 11:00 2:00 -
25-Nov-15 9:00 11:00 2:00 -
26-Nov-15 9:00 11:00 2:00 120
27-Nov-15 9:00 13:00 4:00 -
28-Nov-15 9:00 11:00 2:00 120
29-Nov-15 9:00 - - -
30-Nov-15 9:00 - - -
subtotal 70 960
1-Dec-15 - - - -
2-Dec-15 9:00 11:00 2:00 -
3-Dec-15 9:00 12:00 3:00 -
4-Dec-15 9:00 12:00 3:00
5-Dec-15 9:00 12:00 3:00 -
6-Dec-15 9:00 10:00 1:00 -
7-Dec-15 9:00 11:00 2:00 120
8-Dec-15 9:00 12:00 3:00
9-Dec-15 9:00 13:00 4:00 -
10-Dec-15 9:00 15:00 6:00 120
11-Dec-15 9:00 10:00 1:00 -
12-Dec-15 9:00 13:00 4:00 120
13-Dec-15 9:00 18:00 9:00 -
14-Dec-15 9:00 11:00 2:00 60
15-Dec-15 9:00 16:00 7:00 -
16-Dec-15 9:00 11:00 2:00 120
17-Dec-15 9:00 12:00 3:00 -
18-Dec-15 9:00 11:00 2:00 120
19-Dec-15 9:00 13:00 4:00 -
20-Dec-15 9:00 13:00 4:00 -
21-Dec-15 9:00 12:00 3:00 -
22-Dec-15 9:00 11:00 2:00 120
23-Dec-15 9:00 - - -
24-Dec-15 9:00 - - -
25-Dec-15 9:00 - - -
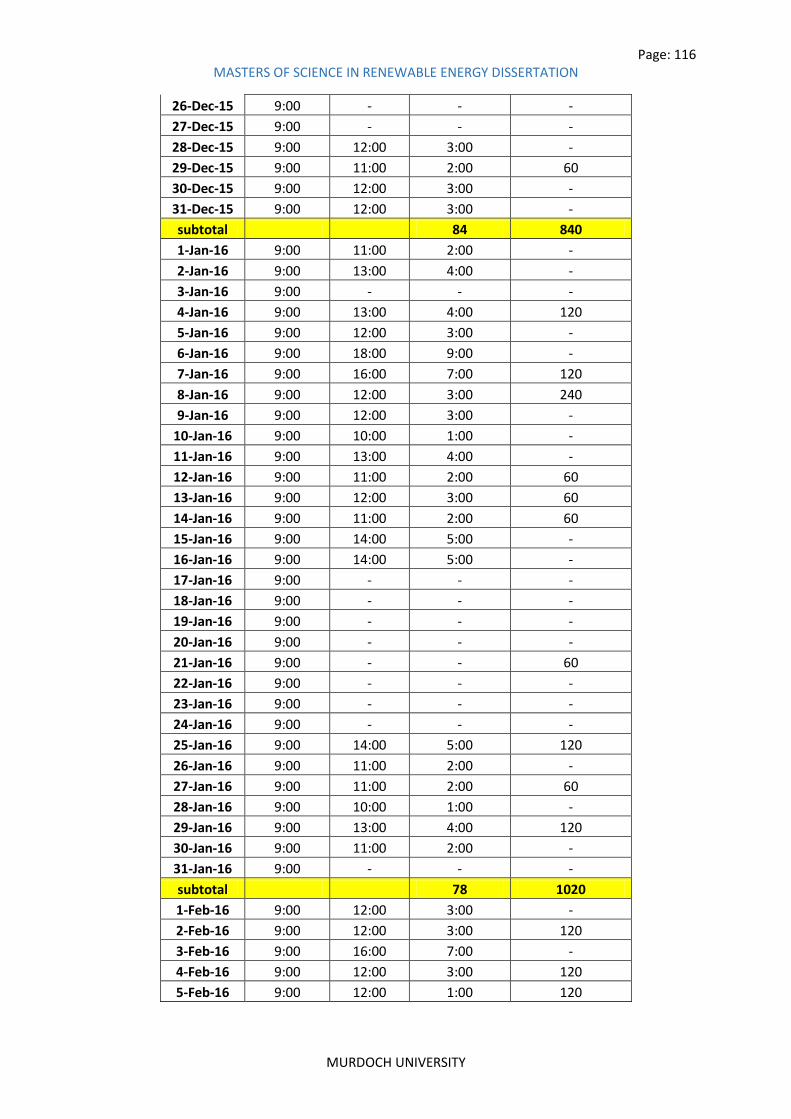
Page: 116 MASTERS OF SCIENCE IN RENEWABLE ENERGY DISSERTATION
MURDOCH UNIVERSITY
26-Dec-15 9:00 - - -
27-Dec-15 9:00 - - -
28-Dec-15 9:00 12:00 3:00 -
29-Dec-15 9:00 11:00 2:00 60
30-Dec-15 9:00 12:00 3:00 -
31-Dec-15 9:00 12:00 3:00 -
subtotal 84 840
1-Jan-16 9:00 11:00 2:00 -
2-Jan-16 9:00 13:00 4:00 -
3-Jan-16 9:00 - - -
4-Jan-16 9:00 13:00 4:00 120
5-Jan-16 9:00 12:00 3:00 -
6-Jan-16 9:00 18:00 9:00 -
7-Jan-16 9:00 16:00 7:00 120
8-Jan-16 9:00 12:00 3:00 240
9-Jan-16 9:00 12:00 3:00 -
10-Jan-16 9:00 10:00 1:00 -
11-Jan-16 9:00 13:00 4:00 -
12-Jan-16 9:00 11:00 2:00 60
13-Jan-16 9:00 12:00 3:00 60
14-Jan-16 9:00 11:00 2:00 60
15-Jan-16 9:00 14:00 5:00 -
16-Jan-16 9:00 14:00 5:00 -
17-Jan-16 9:00 - - -
18-Jan-16 9:00 - - -
19-Jan-16 9:00 - - -
20-Jan-16 9:00 - - -
21-Jan-16 9:00 - - 60
22-Jan-16 9:00 - - -
23-Jan-16 9:00 - - -
24-Jan-16 9:00 - - -
25-Jan-16 9:00 14:00 5:00 120
26-Jan-16 9:00 11:00 2:00 -
27-Jan-16 9:00 11:00 2:00 60
28-Jan-16 9:00 10:00 1:00 -
29-Jan-16 9:00 13:00 4:00 120
30-Jan-16 9:00 11:00 2:00 -
31-Jan-16 9:00 - - -
subtotal 78 1020
1-Feb-16 9:00 12:00 3:00 -
2-Feb-16 9:00 12:00 3:00 120
3-Feb-16 9:00 16:00 7:00 -
4-Feb-16 9:00 12:00 3:00 120
5-Feb-16 9:00 12:00 1:00 120

Page: 117 MASTERS OF SCIENCE IN RENEWABLE ENERGY DISSERTATION
MURDOCH UNIVERSITY
6-Feb-16 9:00 10:00 - -
7-Feb-16 9:00 - 3:00 -
8-Feb-16 9:00 12:00 4:00 -
9-Feb-16 9:00 13:00 3:00 -
10-Feb-16 9:00 12:00 3:00 120
11-Feb-16 9:00 12:00 3:00 -
12-Feb-16 9:00 12:00 2:00 -
13-Feb-16 9:00 11:00 2:00 -
14-Feb-16 9:00 - - 120
15-Feb-16 9:00 16:00 7:00 -
16-Feb-16 9:00 11:00 2:00 -
17-Feb-16 9:00 12:00 3:00 -
18-Feb-16 9:00 12:00 3:00 120
19-Feb-16 9:00 10:00 1:00 -
20-Feb-16 9:00 12:00 3:00 -
21-Feb-16 9:00 - - -
22-Feb-16 9:00 13:00 4:00 120
23-Feb-16 9:00 13:00 4:00 -
24-Feb-16 9:00 13:00 4:00 120
25-Feb-16 9:00 13:00 4:00 -
26-Feb-16 9:00 12:00 3:00 120
27-Feb-16 9:00 12:00 3:00 -
28-Feb-16 9:00 15:00 6:00 120
29-Feb-16 9:00 13:00 4:00 -
subtotal 91 1200
1-Mar-16 9:00 15:00 6:00 120
2-Mar-16 9:00 13:00 4:00 60
3-Mar-16 9:00 14:00 5:00 120
4-Mar-16 9:00 14:00 5:00 120
5-Mar-16 9:00 14:00 5:00 -
6-Mar-16 9:00 - - -
7-Mar-16 9:00 13:00 4:00 120
8-Mar-16 9:00 13:00 4:00 -
9-Mar-16 9:00 13:00 4:00 -
10-Mar-16 9:00 14:00 5:00 120
11-Mar-16 9:00 19:00 10:00 120
12-Mar-16 9:00 14:00 5:00 -
13-Mar-16 9:00 - - -
14-Mar-16 9:00 13:00 4:00 120
15-Mar-16 9:00 14:00 5:00 120
16-Mar-16 9:00 13:00 4:00 -
17-Mar-16 9:00 14:00 5:00 120
18-Mar-16 9:00 13:00 - 120
19-Mar-16 9:00 15:00 6:00 -

Page: 118 MASTERS OF SCIENCE IN RENEWABLE ENERGY DISSERTATION
MURDOCH UNIVERSITY
20-Mar-16 9:00 - - -
21-Mar-16 9:00 13:00 4:00 -
22-Mar-16 9:00 15:00 6:00 120
23-Mar-16 9:00 13:00 4:00 -
24-Mar-16 9:00 13:00 4:00 120
25-Mar-16 9:00 13:00 4:00 -
26-Mar-16 9:00 15:00 6:00 120
27-Mar-16 9:00 - - -
28-Mar-16 9:00 14:00 5:00 120
29-Mar-16 9:00 14:00 5:00 -
30-Mar-16 9:00 13:00 4:00 -
31-Mar-16 9:00 12:00 3:00 -
subtotal 130 1740
1-Apr-16 9:00 14:00 5:00 120
2-Apr-16 9:00 13:00 4:00 120
3-Apr-16 9:00 - - -
4-Apr-16 9:00 13:00 4:00 -
5-Apr-16 9:00 13:00 4:00 120
6-Apr-16 9:00 13:00 4:00 -
7-Apr-16 9:00 14:00 5:00 -
8-Apr-16 9:00 13:00 4:00 180
9-Apr-16 9:00 12:00 3:00 -
10-Apr-16 9:00 - - -
11-Apr-16 9:00 16:00 7:00 120
12-Apr-16 9:00 13:00 4:00 -
13-Apr-16 9:00 12:00 3:00 120
14-Apr-16 9:00 15:00 6:00 -
15-Apr-16 9:00 16:00 7:00 120
16-Apr-16 9:00 19:00 10:00 -
17-Apr-16 9:00 14:00 5:00 -
18-Apr-16 9:00 13:00 4:00 120
19-Apr-16 9:00 15:00 6:00 -
20-Apr-16 9:00 19:00 10:00 120
21-Apr-16 9:00 20:00 11:00 -
22-Apr-16 9:00 19:00 10:00 180
23-Apr-16 9:00 13:00 4:00 -
24-Apr-16 9:00 14:00 5:00 -
25-Apr-16 9:00 14:00 5:00 180
26-Apr-16 9:00 23:00 14:00 120
27-Apr-16 9:00 15:00 6:00 -
28-Apr-16 9:00 20:00 11:00 -
29-Apr-16 9:00 19:00 10:00 240
30-Apr-16 9:00 20:00 11:00 -
subtotal 187 1860

Page: 119 MASTERS OF SCIENCE IN RENEWABLE ENERGY DISSERTATION
MURDOCH UNIVERSITY
1-May-16 9:00 16:00 7:00 -
2-May-16 9:00 16:00 7:00 240
3-May-16 9:00 17:00 8:00 180
4-May-16 9:00 17:00 8:00 60
5-May-16 9:00 13:00 4:00 60
6-May-16 9:00 13:00 4:00 120
7-May-16 9:00 12:00 3:00 -
8-May-16 9:00 - - -
9-May-16 9:00 16:00 7:00 180
10-May-16 9:00 16:00 7:00 120
11-May-16 9:00 17:00 8:00 -
12-May-16 9:00 19:00 10:00 180
13-May-16 9:00 23:00 14:00 240
14-May-16 9:00 21:00 12:00 -
15-May-16 9:00 21:00 12:00 -
16-May-16 9:00 20:00 11:00 240
17-May-16 9:00 22:00 13:00 120
18-May-16 9:00 22:00 13:00 180
19-May-16 9:00 20:00 11:00 120
20-May-16 9:00 23:00 14:00 240
21-May-16 9:00 0:00 15:00 120
22-May-16 9:00 23:00 14:00 -
23-May-16 9:00 0:00 15:00 180
24-May-16 9:00 7:00 22.00 240
25-May-16 9:00 23:00 14:00 180
26-May-16 9:00 0:00 15:00 180
27-May-16 9:00 3:00 18.00 300
28-May-16 9:00 20:00 11:00 -
29-May-16 9:00 21:00 12:00 -
30-May-16 9:00 23:00 14:00 240
31-May-16 9:00 20:00 11:00 240
subtotal 329 3960

Page: 120 MASTERS OF SCIENCE IN RENEWABLE ENERGY DISSERTATION
MURDOCH UNIVERSITY
Appendix C
Annual electricity load shedding hours
Date Hours of load shedding
1-Jun-15 9:00
2-Jun-15 11:00
3-Jun-15 9:00
4-Jun-15 11:00
5-Jun-15 9:00
6-Jun-15 6:00
7-Jun-15 -
8-Jun-15 10:00
9-Jun-15 9:00
10-Jun-15 8:00
11-Jun-15 9:00
12-Jun-15 6:00
13-Jun-15 -
14-Jun-15 -
15-Jun-15 10:00
16-Jun-15 4:00
17-Jun-15 6:00
18-Jun-15 6:00
19-Jun-15 6:00
20-Jun-15 4:00
21-Jun-15 3:00
22-Jun-15 6:00
23-Jun-15 4:00
24-Jun-15 7:00
25-Jun-15 4:00
26-Jun-15 4:00
27-Jun-15 -
28-Jun-15 -
29-Jun-15 7:00
30-Jun-15 12:00
subtotal 183
1-Jul-15 6:00
2-Jul-15 7:00
3-Jul-15 6:00
4-Jul-15 5:00
5-Jul-15 6:00
6-Jul-15 10:00
7-Jul-15 9:00
8-Jul-15 9:00

Page: 121 MASTERS OF SCIENCE IN RENEWABLE ENERGY DISSERTATION
MURDOCH UNIVERSITY
9-Jul-15 8:00
10-Jul-15 5:00
11-Jul-15
12-Jul-15
13-Jul-15
14-Jul-15
15-Jul-15
16-Jul-15
17-Jul-15
18-Jul-15
19-Jul-15
20-Jul-15
21-Jul-15 6:00
22-Jul-15 6:00
23-Jul-15 8:00
24-Jul-15 10:00
25-Jul-15 7:00
26-Jul-15 6:00
27-Jul-15 9:00
28-Jul-15 10:00
29-Jul-15 9:00
30-Jul-15 6:00
31-Jul-15 6:00
subtotal 148
1-Aug-15 6:00
2-Aug-15 -
3-Aug-15 7:00
4-Aug-15 5:00
5-Aug-15 4:00
6-Aug-15 -
7-Aug-15 4:00
8-Aug-15 -
9-Aug-15 -
10-Aug-15 2:00
11-Aug-15 4:00
12-Aug-15 6:00
13-Aug-15 6:00
14-Aug-15 5:00
15-Aug-15 5:00
16-Aug-15 -
17-Aug-15 5:00
18-Aug-15 6:00
19-Aug-15 5:00
20-Aug-15 6:00
21-Aug-15 5:00

Page: 122 MASTERS OF SCIENCE IN RENEWABLE ENERGY DISSERTATION
MURDOCH UNIVERSITY
22-Aug-15 -
23-Aug-15 -
24-Aug-15 5:00
25-Aug-15 4:00
26-Aug-15 5:00
27-Aug-15 5:00
28-Aug-15 5:00
29-Aug-15 6:00
30-Aug-15 -
31-Aug-15 4:00
subtotal 115
1-Sep-15 6:00
2-Sep-15 5:00
3-Sep-15 5:00
4-Sep-15 5:00
5-Sep-15 4:00
6-Sep-15 5:00
7-Sep-15 -
8-Sep-15 5:00
9-Sep-15 5:00
10-Sep-15 6:00
11-Sep-15 5:00
12-Sep-15 6:00
13-Sep-15 5:00
14-Sep-15 -
15-Sep-15 6:00
16-Sep-15 -
17-Sep-15 5:00
18-Sep-15 5:00
19-Sep-15 5:00
20-Sep-15 -
21-Sep-15 4:00
22-Sep-15 3:00
23-Sep-15 7:00
24-Sep-15 -
25-Sep-15 -
26-Sep-15 -
27-Sep-15 -
28-Sep-15 5:00
29-Sep-15 4:00
30-Sep-15 3:00
31-sep-15 -
subtotal 109
1-Oct-15 5:00
2-Oct-15 7:00

Page: 123 MASTERS OF SCIENCE IN RENEWABLE ENERGY DISSERTATION
MURDOCH UNIVERSITY
3-Oct-15 6:00
4-Oct-15 -
5-Oct-15 4:00
6-Oct-15 5:00
7-Oct-15 3:00
8-Oct-15 3:00
9-Oct-15 5:00
10-Oct-15 4:00
11-Oct-15 -
12-Oct-15 5:00
13-Oct-15 5:00
14-Oct-15 6:00
15-Oct-15 5:00
16-Oct-15 5:00
17-Oct-15 4:00
18-Oct-15 -
19-Oct-15 3:00
20-Oct-15 4:00
21-Oct-15 6:00
22-Oct-15 7:00
23-Oct-15 -
24-Oct-15 -
25-Oct-15 -
26-Oct-15 4:00
27-Oct-15 4:00
28-Oct-15 4:00
29-Oct-15 3:00
30-Oct-15 4:00
31-Oct-15 3:00
subtotal 114
1-Nov-15 -
2-Nov-15 3:00
3-Nov-15 4:00
4-Nov-15 3:00
5-Nov-15 3:00
6-Nov-15 3:00
7-Nov-15 3:00
8-Nov-15 -
9-Nov-15 2:00
10-Nov-15 2:00
11-Nov-15 2:00
12-Nov-15 2:00
13-Nov-15 2:00
14-Nov-15 2:00
15-Nov-15 -
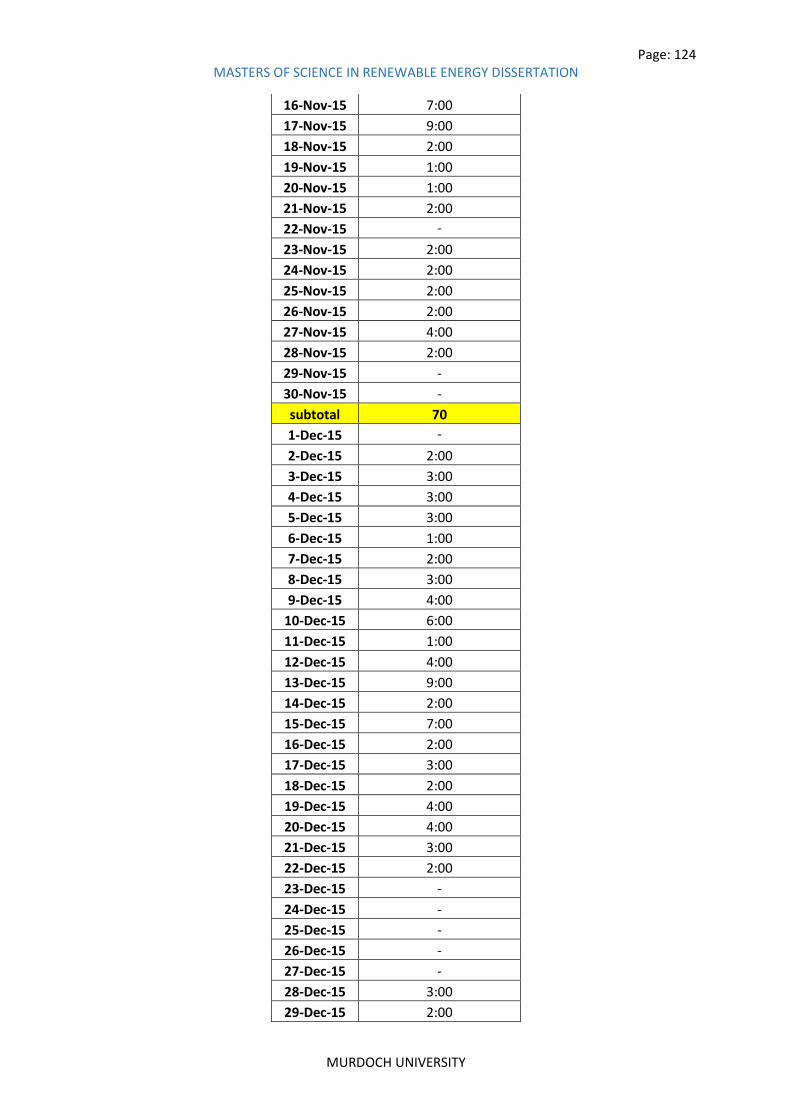
Page: 124 MASTERS OF SCIENCE IN RENEWABLE ENERGY DISSERTATION
MURDOCH UNIVERSITY
16-Nov-15 7:00
17-Nov-15 9:00
18-Nov-15 2:00
19-Nov-15 1:00
20-Nov-15 1:00
21-Nov-15 2:00
22-Nov-15 -
23-Nov-15 2:00
24-Nov-15 2:00
25-Nov-15 2:00
26-Nov-15 2:00
27-Nov-15 4:00
28-Nov-15 2:00
29-Nov-15 -
30-Nov-15 -
subtotal 70
1-Dec-15 -
2-Dec-15 2:00
3-Dec-15 3:00
4-Dec-15 3:00
5-Dec-15 3:00
6-Dec-15 1:00
7-Dec-15 2:00
8-Dec-15 3:00
9-Dec-15 4:00
10-Dec-15 6:00
11-Dec-15 1:00
12-Dec-15 4:00
13-Dec-15 9:00
14-Dec-15 2:00
15-Dec-15 7:00
16-Dec-15 2:00
17-Dec-15 3:00
18-Dec-15 2:00
19-Dec-15 4:00
20-Dec-15 4:00
21-Dec-15 3:00
22-Dec-15 2:00
23-Dec-15 -
24-Dec-15 -
25-Dec-15 -
26-Dec-15 -
27-Dec-15 -
28-Dec-15 3:00
29-Dec-15 2:00
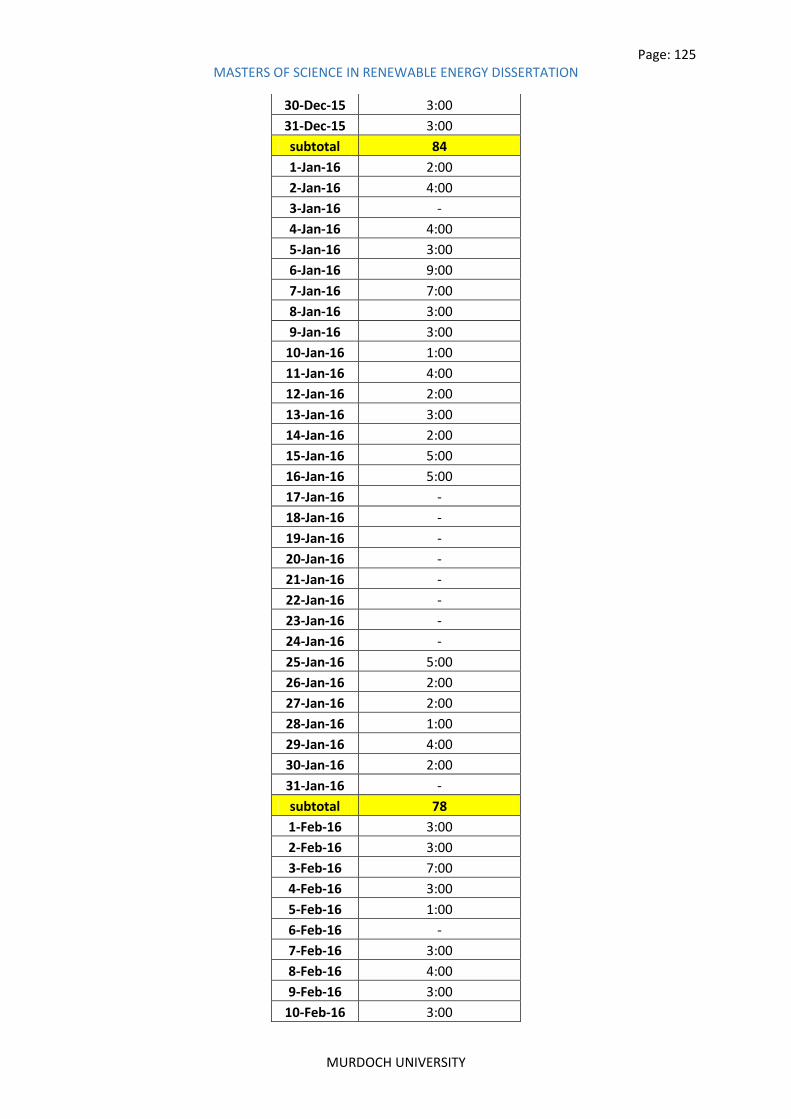
Page: 125 MASTERS OF SCIENCE IN RENEWABLE ENERGY DISSERTATION
MURDOCH UNIVERSITY
30-Dec-15 3:00
31-Dec-15 3:00
subtotal 84
1-Jan-16 2:00
2-Jan-16 4:00
3-Jan-16 -
4-Jan-16 4:00
5-Jan-16 3:00
6-Jan-16 9:00
7-Jan-16 7:00
8-Jan-16 3:00
9-Jan-16 3:00
10-Jan-16 1:00
11-Jan-16 4:00
12-Jan-16 2:00
13-Jan-16 3:00
14-Jan-16 2:00
15-Jan-16 5:00
16-Jan-16 5:00
17-Jan-16 -
18-Jan-16 -
19-Jan-16 -
20-Jan-16 -
21-Jan-16 -
22-Jan-16 -
23-Jan-16 -
24-Jan-16 -
25-Jan-16 5:00
26-Jan-16 2:00
27-Jan-16 2:00
28-Jan-16 1:00
29-Jan-16 4:00
30-Jan-16 2:00
31-Jan-16 -
subtotal 78
1-Feb-16 3:00
2-Feb-16 3:00
3-Feb-16 7:00
4-Feb-16 3:00
5-Feb-16 1:00
6-Feb-16 -
7-Feb-16 3:00
8-Feb-16 4:00
9-Feb-16 3:00
10-Feb-16 3:00
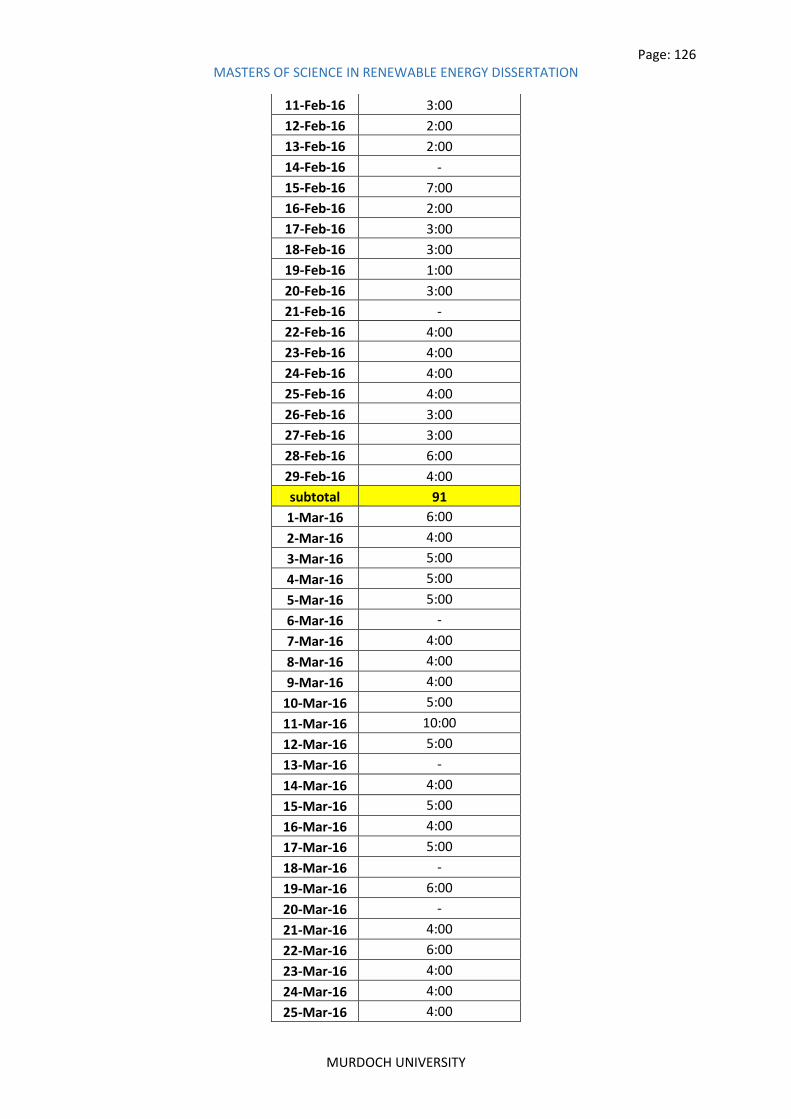
Page: 126 MASTERS OF SCIENCE IN RENEWABLE ENERGY DISSERTATION
MURDOCH UNIVERSITY
11-Feb-16 3:00
12-Feb-16 2:00
13-Feb-16 2:00
14-Feb-16 -
15-Feb-16 7:00
16-Feb-16 2:00
17-Feb-16 3:00
18-Feb-16 3:00
19-Feb-16 1:00
20-Feb-16 3:00
21-Feb-16 -
22-Feb-16 4:00
23-Feb-16 4:00
24-Feb-16 4:00
25-Feb-16 4:00
26-Feb-16 3:00
27-Feb-16 3:00
28-Feb-16 6:00
29-Feb-16 4:00
subtotal 91
1-Mar-16 6:00
2-Mar-16 4:00
3-Mar-16 5:00
4-Mar-16 5:00
5-Mar-16 5:00
6-Mar-16 -
7-Mar-16 4:00
8-Mar-16 4:00
9-Mar-16 4:00
10-Mar-16 5:00
11-Mar-16 10:00
12-Mar-16 5:00
13-Mar-16 -
14-Mar-16 4:00
15-Mar-16 5:00
16-Mar-16 4:00
17-Mar-16 5:00
18-Mar-16 -
19-Mar-16 6:00
20-Mar-16 -
21-Mar-16 4:00
22-Mar-16 6:00
23-Mar-16 4:00
24-Mar-16 4:00
25-Mar-16 4:00

Page: 127 MASTERS OF SCIENCE IN RENEWABLE ENERGY DISSERTATION
MURDOCH UNIVERSITY
26-Mar-16 6:00
27-Mar-16 -
28-Mar-16 5:00
29-Mar-16 5:00
30-Mar-16 4:00
31-Mar-16 3:00
subtotal 130
1-Apr-16 5:00
2-Apr-16 4:00
3-Apr-16 -
4-Apr-16 4:00
5-Apr-16 4:00
6-Apr-16 4:00
7-Apr-16 5:00
8-Apr-16 4:00
9-Apr-16 3:00
10-Apr-16 -
11-Apr-16 7:00
12-Apr-16 4:00
13-Apr-16 3:00
14-Apr-16 6:00
15-Apr-16 7:00
16-Apr-16 10:00
17-Apr-16 5:00
18-Apr-16 4:00
19-Apr-16 6:00
20-Apr-16 10:00
21-Apr-16 11:00
22-Apr-16 10:00
23-Apr-16 4:00
24-Apr-16 5:00
25-Apr-16 5:00
26-Apr-16 14:00
27-Apr-16 6:00
28-Apr-16 11:00
29-Apr-16 10:00
30-Apr-16 11:00
subtotal 187
1-May-16 7:00
2-May-16 7:00
3-May-16 8:00
4-May-16 8:00
5-May-16 4:00
6-May-16 4:00
7-May-16 3:00

Page: 128 MASTERS OF SCIENCE IN RENEWABLE ENERGY DISSERTATION
MURDOCH UNIVERSITY
8-May-16 -
9-May-16 7:00
10-May-16 7:00
11-May-16 8:00
12-May-16 10:00
13-May-16 14:00
14-May-16 12:00
15-May-16 12:00
16-May-16 11:00
17-May-16 13:00
18-May-16 13:00
19-May-16 11:00
20-May-16 14:00
21-May-16 15:00
22-May-16 14:00
23-May-16 15:00
24-May-16 22.00
25-May-16 14:00
26-May-16 15:00
27-May-16 18.00
28-May-16 11:00
29-May-16 12:00
30-May-16 14:00
31-May-16 11:00
subtotal 329

Page: 129 MASTERS OF SCIENCE IN RENEWABLE ENERGY DISSERTATION
MURDOCH UNIVERSITY
Appendix D
RET screen Inputs/outputs
Start sheet

Page: 130 MASTERS OF SCIENCE IN RENEWABLE ENERGY DISSERTATION
MURDOCH UNIVERSITY
Load and Network design

Page: 131 MASTERS OF SCIENCE IN RENEWABLE ENERGY DISSERTATION
MURDOCH UNIVERSITY
Energy model
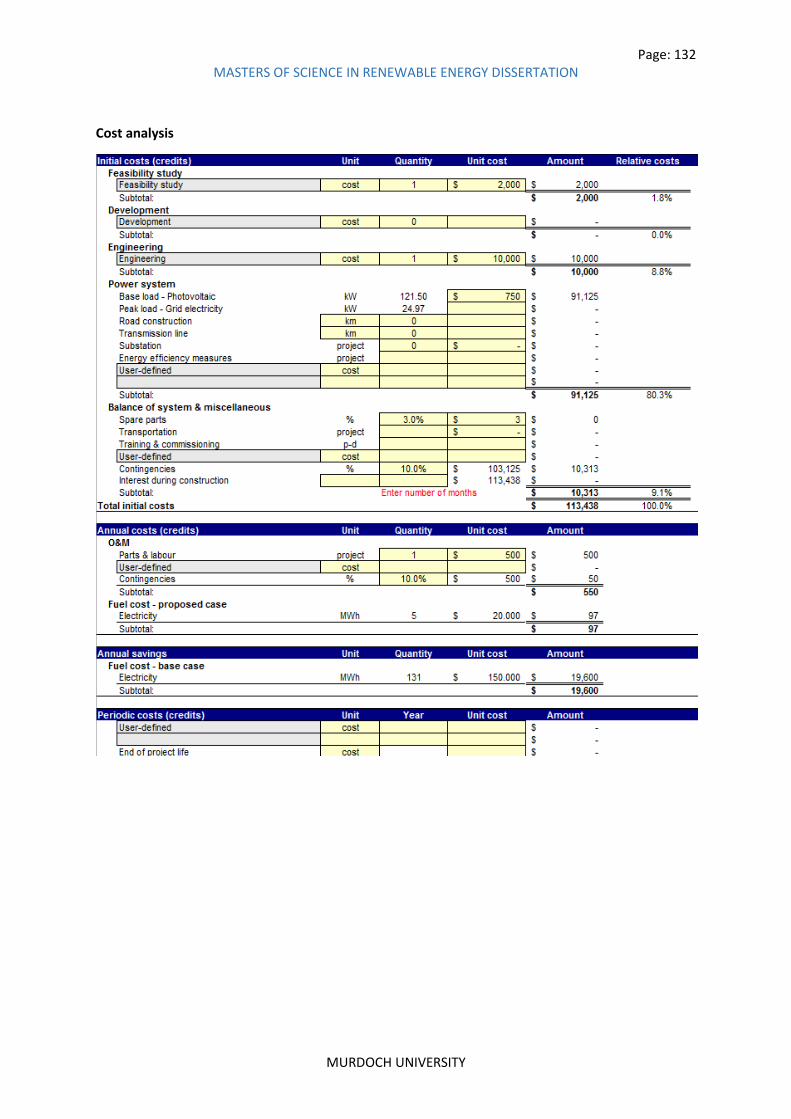
Page: 132 MASTERS OF SCIENCE IN RENEWABLE ENERGY DISSERTATION
MURDOCH UNIVERSITY
Cost analysis
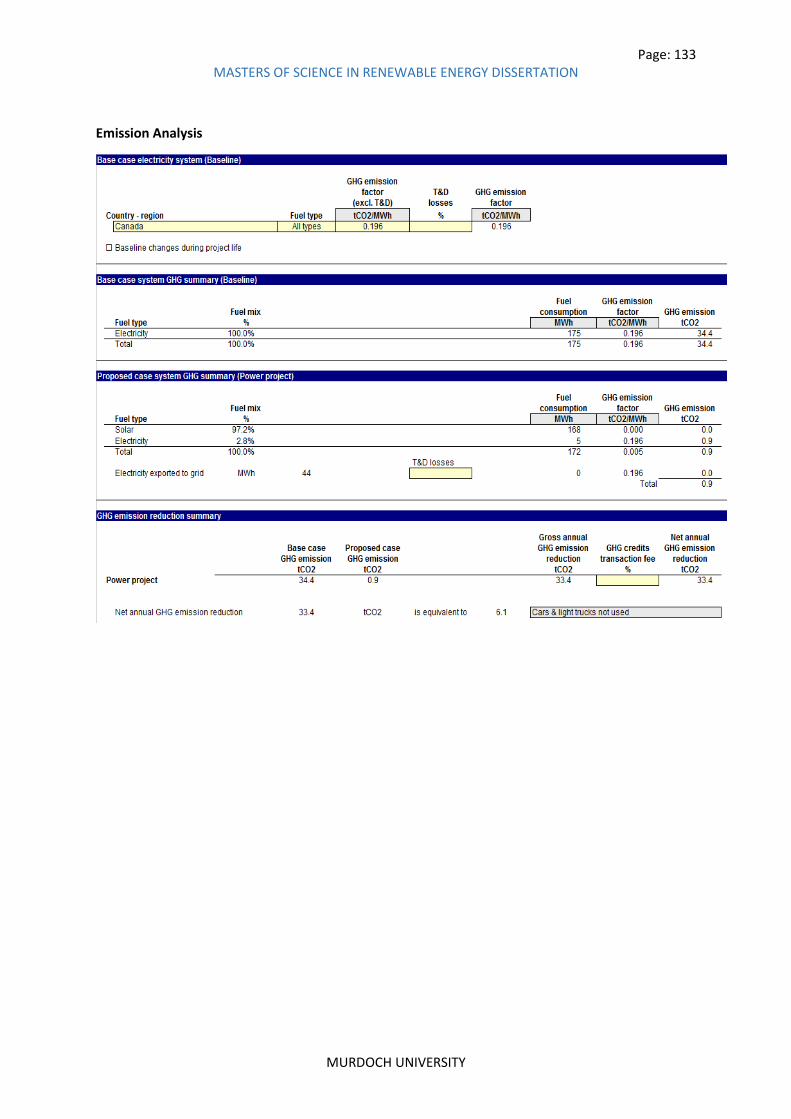
Page: 133 MASTERS OF SCIENCE IN RENEWABLE ENERGY DISSERTATION
MURDOCH UNIVERSITY
Emission Analysis

Page: 134 MASTERS OF SCIENCE IN RENEWABLE ENERGY DISSERTATION
MURDOCH UNIVERSITY
Financial analysis sheet
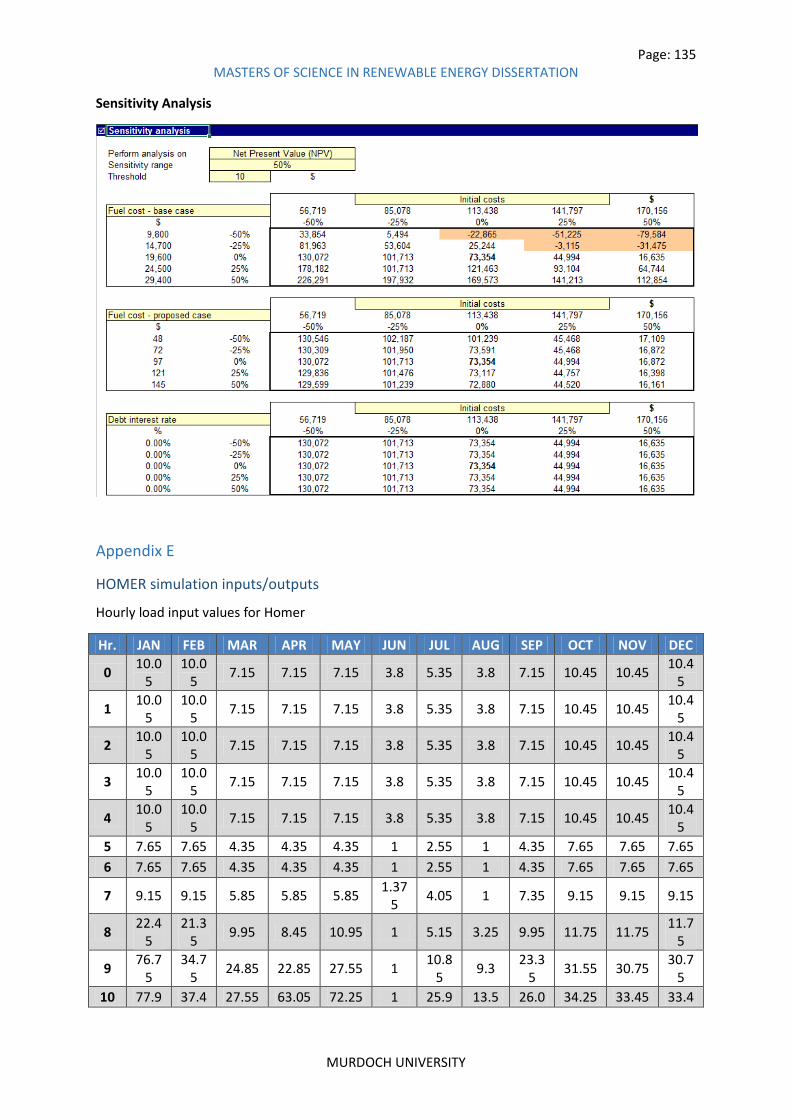
Page: 135 MASTERS OF SCIENCE IN RENEWABLE ENERGY DISSERTATION
MURDOCH UNIVERSITY
Sensitivity Analysis
Appendix E
HOMER simulation inputs/outputs
Hourly load input values for Homer
Hr. JAN FEB MAR APR MAY JUN JUL AUG SEP OCT NOV DEC
0 10.0
5 10.0
5 7.15 7.15 7.15 3.8 5.35 3.8 7.15 10.45 10.45
10.45
1 10.0
5 10.0
5 7.15 7.15 7.15 3.8 5.35 3.8 7.15 10.45 10.45
10.45
2 10.0
5 10.0
5 7.15 7.15 7.15 3.8 5.35 3.8 7.15 10.45 10.45
10.45
3 10.0
5 10.0
5 7.15 7.15 7.15 3.8 5.35 3.8 7.15 10.45 10.45
10.45
4 10.0
5 10.0
5 7.15 7.15 7.15 3.8 5.35 3.8 7.15 10.45 10.45
10.45
5 7.65 7.65 4.35 4.35 4.35 1 2.55 1 4.35 7.65 7.65 7.65
6 7.65 7.65 4.35 4.35 4.35 1 2.55 1 4.35 7.65 7.65 7.65
7 9.15 9.15 5.85 5.85 5.85 1.37
5 4.05 1 7.35 9.15 9.15 9.15
8 22.4
5 21.3
5 9.95 8.45 10.95 1 5.15 3.25 9.95 11.75 11.75
11.75
9 76.7
5 34.7
5 24.85 22.85 27.55 1
10.85
9.3 23.3
5 31.55 30.75
30.75
10 77.9 37.4 27.55 63.05 72.25 1 25.9 13.5 26.0 34.25 33.45 33.4

Page: 136 MASTERS OF SCIENCE IN RENEWABLE ENERGY DISSERTATION
MURDOCH UNIVERSITY
5 5 5 5 5 5
11 71.0
5 66.5
5 59.85 59.35
101.35
1 31.0
5 12.6
5 64.1
5 72.35 71.55
71.55
12 71.8
7 67.3
7 60.67
5 60.17
5 102.1
8 1 39.6 23.9
64.98
73.175
66.775
66.78
13 19.7
7 55.7
7 45.87 48.57 54.57 4.2
28.43
12.5 8.37 16.57 10.17 10.1
7
14 18.1
5 18.1
5 6.75 46.95 52.95 4.2
17.75
23.9 6.75 8.55 8.55 8.55
15 18.7
5 18.7
5 7.35 7.35 53.55 4.2 7.25 12.5 7.35 9.15 9.15 9.15
16 7.65 7.65 4.35 4.35 4.35 1 5.75 5 4.35 7.65 7.65 7.65
17 9.15 9.15 5.85 5.85 5.85 1 2.55 2.5 5.85 9.15 9.15 9.15
18 7.65 7.65 4.35 4.35 4.35 1 2.55 1 4.35 7.65 7.65 7.65
19 9.15 7.65 4.35 4.35 4.35 1 2.55 1 4.35 7.65 7.65 7.65
20 7.65 7.65 4.35 4.35 4.35 1 2.55 1 4.35 7.65 7.65 7.65
21 10.4
5 10.4
5 7.15 7.15 7.15 3.8 5.35 3.8 7.15 10.45 10.45
10.45
22 10.4
5 10.4
5 7.15 7.15 7.15 3.8 5.35 3.8 7.15 10.45 10.45
10.45
23 10.4
5 10.4
5 7.15 7.15 7.15 3.8 5.35 3.8 7.15 10.45 10.45
10.45
Homer most feasible options
Architect
ure/CS6X-
310 (kW)
Architect
ure/Gen4
0 (kW)
Architect
ure/IND3
3-2V
Architect
ure/Grid
(kW)
Architect
ure/Conv
erter
(kW)
Cost/COE
($)
Cost/NPC
($)
Cost/Operati
ng cost ($)
Cost/Initial
capital ($)
System/Re
n Frac (%)
Gen40/Pr
oduction
(kWh)
CS6X-
310/Prod
uction
(kWh)
IND33-
2V/Annu
al
Throughp
ut (kWh)
Grid/Ene
rgy
Purchase
d (kWh)
Grid/Ener
gy Sold
(kWh)
100 100 100 0.08 214166 7671 115000 76.03 174127.6 49410.93 76998.74
100 40 500 100 0.08 215132 7667 116016 76.03 0 174127.6 49411.32 76998.74
100 100 100 100 0.12 264857 6951 175000 90.62 174127.6 41936.9 15442.02 35455.67
100 40 100 500 100 0.12 265822 6947 176016 90.62 0 174127.6 41936.9 15442.41 35455.67
100 500 100 0.23 390928 23665 85000 0.25 393.8643 128808.5 2.40E-06
40 100 500 100 0.23 391893 23661 86016 0.25 0 393.8643 128808.5 2.40E-06

Page: 137 MASTERS OF SCIENCE IN RENEWABLE ENERGY DISSERTATION
MURDOCH UNIVERSITY
Appendix F
Building photographs Electronic lab
Class Room

Page: 138 MASTERS OF SCIENCE IN RENEWABLE ENERGY DISSERTATION
MURDOCH UNIVERSITY
Roof Front view

Page: 139 MASTERS OF SCIENCE IN RENEWABLE ENERGY DISSERTATION
MURDOCH UNIVERSITY
Appendix G
Renewable resource data at subject site Solar resource
Wind resource
Monthly Averaged Insolation Incident On A Horizontal Surface (kWh/m2/day)
insolation 3.3 4.16 5.09 6.21 6.37 7.1 6.2 5.8 5.21 4.59 3.69 3.08
cleaness
index0.54 0.55 0.53 0.55 0.52 0.56 0.5 0.5 0.52 0.56 0.57 0.55
DecJan Feb Mar Apr May Jun Jul Aug Sep Oct Nov
Monthly Averaged Wind Speed At 10 m Above The Surface Of The Earth For Terrain Similar To Airports (m/s)
at 10m
Lat 32.681 Annual
Lon 71.792 Average
10-year Average 3.48 3.79 4.09 4.38 4.19 3.97 3.61 3.31 3.46 4.03 3.91 3.44 3.8
DecJan Feb Mar Apr May Jun Jul Aug Sep Oct Nov

Page: 140 MASTERS OF SCIENCE IN RENEWABLE ENERGY DISSERTATION
MURDOCH UNIVERSITY
Appendix H
Summary of monthly average electricity load
categories power source area description quantityrating
(W)
average
usage
(hrs/day)
total
watt
per day
KWh
22
working
days
24 hr
load
include
weekend
s 30days
annual
use
proportion
of total
energy
consumptio
n
grid electricity energy saver 150 40 4 6000 24 528
grid electricity energy saver 25 40 24 1000 24 720
grid electricity florescent bulbs 25 100 4 2500 10 220
grid electricity tubelights 150 20 4 3000 12 264
grid electricity tubelights 45 40 4 1800 7.2 158.4
grid electricity outdoor Tango Light 7 400 8 2800 22.4 492.8
402 99.6 1663.2 720
grid electricityGuest Room Fridge 1 0 0 0
grid electricity 2 200 24 400 9.6 288
grid electricity 3 300 24 900 21.6 648
6 31.2 0 936
diesel gen used when electricty available24 1,500 6 36000 216 4752
grid electricity 4 1,500 6 6000 36 792
28 252 5544 0
grid electricity fans 40 80 7 3200 22.4 492.8
grid electricity exhaust 5 50 24 250 6 180
45 28.4 492.8 180
grid electricity Dishwasher 1 1800 1.5 1800 2.7 59.4
grid electricity Oven 2 2000 1.5 4000 6 132
3 8.7 191.4 0
water pump grid electricity 50HP 3phase 1 1500 5 1500 7.5 165
1 7.5 165 0
grid electricity 2nd floor 10ltr 70 deg 1 1500 0 1500 0 0
grid electricity 1st floor 12ltr 70 deg 1 1800 0 1800 0 0
grid electricityground floor 35ltr 70 deg 1 1800 24 1800 43.2 1296
3 43.2 0 1296
IT rooms grid electricitylabs+officescomputer, it equipment 180 200 2 36000 72 1584
180 72 1584 0
Room Heaters grid electricity 0 offices 0 0 0 0 0 0
0 0 0
grid electricity Ice Maker 1 1000 8 1000 8 240
grid electricity Water Cooler 3 500 8 1500 12 360
grid electricity Vegetable cutter 1 350 0.5 350 0.175 3.85
grid electricity Grinder 1 350 0.5 350 0.175 3.85
grid electricity Electric kettle 1 1500 0.5 1500 0.75 16.5
grid electricity Power Supply 30 45 1.5 1350 2.025 44.55
grid electricity Oscilloscope 30 40 1.5 1200 1.8 39.6
grid electricity Function Generator 8 85 1.5 680 1.02 22.44
grid electricity Projector 3 300 2 900 1.8 39.6
subtotal 7 27.745 170.39 600
lab
5.69%
Miscellenaious
(plug loads and
office
equipments)
kitchen
hot water
equipment
9.57%subtotal
11.70%subtotal
0.00%subtotal
kitchen equipment kitchen
1.41%subtotal
1.22%subtotal
Airconditons offices
41%subtotal
fan and exhausts
4.97%subtotal
lighting
outdoor/
indoor
17.60%subtotal
refregration
6.91%
cafeteriaFridge /
deepfreezer
subtotal