pad-78-21 comparative life cycle cost: a case study
TRANSCRIPT

DOCUBENT RESUBE
06791 - [B23073841
Comparative Life Cycle Cost: a Case Study, PAD-78-21; B-163058.August 16, 1978. 18 pp.
Staff st'dy by Sorton A. Myers, Acting Eirector, Prcrc-aAnalysis Div.
issue Area: Alternative Apprcaches or Sethods to Achieve FederalProgram Objectives (3600).
Contact: Program Analysis Div.,.OAqet Function: natlonal Defanse: Weapon systems (057);
a tional Defense: Department of Ceftnse - Procurenent &Contracts (056).
Organization Concerned: Department of Defense; Department of theArry.
Congressional Relevance: House Committee cn Armsd Services;Senate Committee on Armed Services.
A case study of the costs for two Army tanks, X1-1 ands60A3, demonstrated the importance of life-cycle costcomparisons. The XR-1 main battle tan). was developed tc succeed160 series tankls which have been prodtced for 17 years.Findinqs/Conclusionv: Comparing only acquisition costs, the XI-1is twice as expensive as the S60A3. When life-cycle costs(totals for buying, operating, and maintaining tanks) during aA0-year period are considered, the X1-1 costs about 20S oacrebecause of large, nearly equal maintenance and operaticm costsfor the two tanks. Thus, the lX-1 need be only 201 sore costeffective, and the consensus of Army studies has been that itscost effectiveness compared to the B60A3 is considerably acrethan this percentage. Cost estimates made before startingproduction are subject to uncertainty such as inflation andother factors. Cost estimate assumptions were examined, and thesensitivity of XIS- costs to these assumptions was reflected inlife-cycle cost data. Weapon systems decisions are not madesolely on cost or effectiveness data. For example, NATO weaponsstandardization programs offer possible economies in researchand development and logistics, but other co:ts may be higher.Foreign military sales can help recoup development costs ofweapons sysxte 3, but the market for these is not highlypredictable. (Author/HTR)

STUDY BY THE STAFF OF THE U. S.
Gerneral Accounting Office
Corparatoi~v f e. Cycle Cost:A CO Stdy
PAD-78-21
'1I~~~~cc~~~~oUI~%v~~ ~AUGUST 16, 1978

PREFACE
In considering funding new programs, the Congress needsanswers to several questions: How much will it cost? Howreliable are the estimates? Would soretning else be better?This study deals with these questions.
Comparing unit cost is one means of determining theappropriate method of achieving an objective; an even bettermethod is comparing life cycle cost. Using the case studymethod, we have portrayed the importance of life cycle costand present a rough frame for its use, using as examplestwo Army tanks--XM-l and M60A3. Our study relied on dataprovided by the Department of Defense and our prvptiousreports.
We have not verified the information and arl..'sis fronon-GAO sources. Given the complexity of many of fee issuesand problems associated with estimating tank ccsts and effec-tiveness, other studies should be sought in fully assessingthese tanks. We hope this study wili be useful to the Con-%ress in considering future procurement programs.
This study was prepared by our Economic Analysis staff.Any questions you may have regarding the analysis should bedirected to Mr. Kenneth M. Brown, (202) 275-3588.
Morton A. Myers, Acting DirectorProgram Analysis Division

STUDY BY THE STAFF OF THE COMPARATIVE LIFE CYCLE COST:U.S. GENERAL ACCOUNTING OFFICE A CASE STUDY
D I G E S T
The XM-1 main battle tank was developed tosucceed M60 series tanks, which have beenproduced for 17 years. The Army's purchaseof 3,312 new tanks will cost about $4 bil-lion in 1976 dollars. Operation and main-tenance costs over 20 years will bring thecosts to over $10 billion 1976 dollars.This study shows how the XM-1 costs comparewith those of the M60 series.
We compiled cost estimates of XM-1 and M60A3.Comparing only acquisition costs, the XM-1is twice as expensive as the M60A3. Whenlife cycle costs (totals for buying, operat-ing, and maintaining tanks) during a 20-yearperiod are considered, the XM-1 costs about20 percent more because of large, nearlyequal maintenance and operation costs forthe two tanks.
If these cost estimates are reliable, theXM-] need be only 20 percent more costeffective. Although the definition of"effectiveness" is to some extent subjec-tive, the consensus of Army studies hasbeen that the XM-1 is considerably moreeffective than 20 percent over the M60A3.
Cost estimates made before starting produc-tion are subject to some uncertainty. In-flation and other factors can cause signif-icant cost increases. We examine theunderlying cost estimate assumptions forlarge weapon systems and show the sensitiv-ity of XM-1 costs to the basic assumptionsand reflect them in life cycle cost data.
We recognize that weapon systems decisionsare not made solely on cost or effectivenessdata. For example, NATO weapons standardiza-tion programs offer possible economies inresearch and development and logistics, butother costs may be higher. Foreign militarysales can help recoup development costs ofweapons systems, but the market for thesesales is not highly predictable.
i PAD-78-21

Con tents
PREFACE
DIGEST
CHAPTER
1 INTRODUCTION 1Cost estimates 1Confidence in the estimates 1Comparison to alternatives 1Outline of study 2Scope of study 2
2 COMPARATIVE COST ANALYSIS 3Incremental cost comparison 3Leopard 2AV costs 6Summary
73 COST UNCERTAINTY IN LIFE CYCLE COST 8Hardware cost 8Range of uncertainty
9Monthly production volume 9Learning curve 10Quantity produced 12Annual distance driven 12Summary
13
4 OPERATIONAL EFFECTIVENESS AND OTHER ISSUES 14Operational effectiveness 14Other issues affecting choices 15
ABBREVIATIONS
DOD Department of Defense
FMS Foreign Military Sales
FRG Federal Republic of Germany
GAO General Accounting Office
MBT main battle tank
NATO North Atlantic Treaty Organization
R&D research and development

CHAPTER 1
INTRODUCTION
In considering funding new programs, the Congress needsanswers to several questions about costs:
-- How much will it cost to acquire and use?
-- How sound are cost estimates?
-- Would some other system (perhaps less effective butless expensive) be better?
This study deals with these questions relative to XM-1,the Army's new main battle tank. The third question can onlybe answered with classified effectiveness information. Wehave, however, presented cost information to easily relateit to assessing XM-l's relative effectiveness.
COST ESTIMATES
we have excluded costs already incurred as irrelevantand have added operation and maintenance to compute lifecycle costs.
CONFIDENCE IN THE ESTIMATES
Estimates necessarily involve numerous assumptions, someof which are crucial to the final total. Sensitivity analysesshow how assumption changes affect cost estimates.
COMPARISON TO ALTERNATIVES
Continued production of M60A3, the most advanced U.S.tank, was a possible alternative to XM-1. It is less effec-tive but also less costly. Acquisition costs of M60A3 areabout half of those for XM-1, but since operation and main-tenance costs are about equal for the two tanks, life cyclecosts for the XM-1 are only about 20-percent higher than forM60AS. If XM-1 is considered significantly over 20-percentmore effective than M60A3, it would be a better choice basedon cost-effectiveness.
According to DOD, the German LEOPARD 2AV was lesseffective and more costly than XM-1. Therefore, if cost-effectiveness were the sole criterion for selection, theLEOPARD would be excluded. Only benefits of NATO standardi-zation could tip the scales in favor of the LEOPARD. (Thesebenefits, however, are difficult to quantify.)
1

OUTLINE OF STUDY
Chapter 2 presents costs for three main battle tanks--M60A3, XM-1, and the LEOPARD 2AV. Chapter 3 deals with theassumptions on which the cost estimates are based and showsthe sensitivity of costs to changes in these assumptions.Chapter 4 discusses unclassified information on operationaleffectiveness and other considerations (standardization,procurement decisions by other NATO countries, foreign mili-tary sales, and coproduction) which are not a part of thebasic cost-effectiveness analysis but which are relevant toprocurement decisions.
SCOPE OF STUDY
We used information from the Office of the Secretary ofDefense and the Department of the Army. We did not try toverify the data because they are estimates. We met with Armyofficials and reviewed documents at the following locations:
-- Headquarters, U.S. Army, Washington, D.C.
-- Headquarters, U.S. Army Materiel Development andReadiness Command, Alexandria, Virginia.
--U.S. Army Tank Automotive Materiel Readiness Command,Warren, Michigan.
2

CHAPTER 2
COMPARATIVE COST ANALYSIS
In making program and budget decisions, the Congressmust consider both the cost and the effectiveness of the pro-gram. This chapter presents figures for comparing XM-1 axndM60A3 costs. Because "sunk costs" (funds already spent) arenot relevant, we have not included them.
INCREMENTAL COST COMPARISON
If we assumed that there was no tank system in the cur-rent inventory, fielding XM-1 would be based on expectedperformance versus expected costs. The decision to purchase3,312 XM-ls means committing about $10.3 billion, over20 years, in constant dollars. The costs in i.nflated dollarscould be as much as twice the 1976 dollar estimate.
The decision does not have quite the magnitude that the$10.3 billion figure might imply. The decision was notwhether to spend $10.3 billion for the XM-1. Instead, thedecision was made on whether to spend the difference betweenXM-1 costs and the costs of M60; that is, the incrementalcost. However, even this decision may not be straightforwardbecause alternatives may exist which have not been considered.
Life cycle costs have three groupings: research anddevelopment, investment, and operating and support. Totalingthese costs for a selected period provides the cost to ac-quire, operate, and maintain the weapon system. Proceedingwith a weapon system's development has generally been basedon its estimated acquisition cost. Less attention has focusedon the system's total cost, although these could ultimatelyamount to several times the acquisition cost.
20-year life cycle cost
To determine the XM-1 incremental cost, we obtained thelife cycle costs of 3,312 XM-1 and M60A3 tanks from theirrespective project offices. The M60A3 was chosen becausethe Army is expected to produce it as its firstline tank in1980 when XM-1 production is to start. During pur review,estimates were revised several times and they will continueto be refined. However, when comparing alternative weapon
.systems, the estimates give a relative measure of costsbetween the two tanks and can be of considerable interestand value.
3

A life cycle of 20 years is a fairly common assumptionin cost studies of major weapons. It mc!ans that tanks areexpected to last 20 years with specified maintenance and areto be unserviceable thereafter. By comparing 20-year lifecycle costs, however, one assumes no tanks will be lost inbattle. In fact, there is some (unknown) probability of usingthe tanks in combat and some additional probability of theirbeing damaged or destroyed. The larger these probabilities,the shorter the probable life cycle and the higher the rela-tive cost of XM-1 (due to its higher acquisition cost). Afavorable factor to XM-1, however, is its superior surviv-ability. In general, one would expect an XM-1 force to havelower casualty figures than those Cfr an M60A3 force for anygiven battle. A complete consideration of costs would there-fore haves to ascribe some value to crew safety on which XM-1lwould have the advantage.
Using a shorter life cycle would require an esbentiallysubjective estimate of the probability of battle casualtiesand their costs. Such estimates are beyond the scope of thisstudy.
The data we obtained were adjusted to reflect remainingfunds only and were not verified. The estimated 20-year lifecycle costs, as of December 1976, in 1976 dollars appear intable 1.
The incremental hardware cost of 3,312 XM-ls is about34-percent more than the M60A3 ($2.259 billion compared to$1.689 billion). There are costs which must be incurred byXM-1 because it is a new program. The M60A3 program willnot incur these costs. For example, XM-l requires a newproduction plant, 1/ whereas M60A3 will be produced in anexisting plant. Also, because H60A3 is only a modificationof an existing tank, there will be considerably less cost inintroducing the tank into the inventory in such areas astraining service/equiIment and initial spares and repairparts. These items and others, when added to the remainingresearch and development costs, make the incremental acquisi-tion cost of XM-1 about $2.1 billion, or about 116 percentmore costly to produce. More than twice as many M60A3s couldbe bought for the same investment in XM-ls (7,138 M60OA3s com-pared to 3,312 XM-ls). These are only part of the costs in-volved. Actually using the tanks requires people, parts,supplies--all of which are costly.
l/See our report (PSAD-77-107. May 11, 1977), "SelectingProduction Site for Army's New Main Battle Tank."
4

rable 1
Incremental Costs of t'h Xm-1(note a)
FY 76 $ Constant
20-.year er iod
M60A3 X- I(note b Ii(note c) Difference
Research & development (note a) S 9.3 $ 309.6 $ +300.3Non-recurring investment 6.6 69!.2 +684.6Production (hardware cost) 1,6C9.2 2,259.2 -569.9engineering changes 24.2 68.7 +44.5Systam test 4.9 3.2 -1.7Data 2.8 26.9 +24.1System project management 19.1 177.6 +158.5Cperational site activation -0- -0- -0-Training services/equipment 2.1 72.2 +7 1Initial spates/repair parts 20.3 253.5 +2?Transportation 28.5 34.0 4Support equipment 15.0 31 4 +l4.
Subtotal $1,P22.2 $3.92 .5 +$2,105.3
Percent difference 116%
Crew (note d) .1,638.9 $1,726.u S +87.1Maintenance 1,521.0 678.0 -643.0Vehicle overhaul 591.8 574.5 -17.3Ammunition 1,666.0 1,702.5 +36.5Fuel and lubricants 43.5 67.9 +24.4Training 7'2.2 744. -37.4integrated logistics support 44.5 14.7 -29.8Transportation 34.4 43 i +9.3Indirect 476. 582.4 +iCE.2
Total 3oerotino and su-oort (note ei, ;6,798.5 S6,334.5 -$464.0
Percent difference -7%
Total funds to be expended $8,620.7 $10,262.0 +$1,641.3
Average cost per vehicle S 2.60 S 3.10 $ +.50
Percent incremental cost difference +19%
a/ Excludes all sunk costs for both systems.
b/ Eased on production of 3,312 U60A3s, h0-.onth rate, l-R-', oneplant, 105 m~i *,un.
c/ Based on production of 3,312 XM-l's, 60-montn rate, 1-3-5, twocomplementary plants, having. 105 :rm sun in ¾'y'irid turTet, an<a learning curve of 93 percent. (The 120 . gun wsoull increanecosts by about $35,000 for each tank orotlucer.)
d/ There is a difference in crew cost ornl ;: LcCsde t- il tiLTteswere pctjred( by separate Ariy of[icCes.
e/ Total -.t incurred to onerato each vehicle in 1a lq94 .'i-lefleet for 'Q0 ears. Pattalion overheal costr .)f $3,9i7.9million not include4 t rove. L'aso- on 1,000 ,iles of ooerationa year.
5

The project managers' 20-year estimates show incrementalcosts to operate and support the XM-1 at $464 million, or7 percent less than the M60A3. Some reasons for this are:
-- The XM-l was designed to be more reliable and moreeasily maintained than other tanks. The lower costestimate for maintenance reflects this. However, itshigher hardware cost, reflected in repair parts, andits complexity, adding labor hours, both increasecosts.
--The difference in ammunition is not readily comparablesince the tanks mount different weapons. Therefore,there will be a real increase in the costs of theammun/tion used by XM-1. This cost estimate is basedon both tanks mounting 105-mm guns. When the 120-mmgun is introduced, these costs could rise. 1/
-- The fuel and lubricant costs are greater for XM-1because of its larger engine.
The costs of acquisition and ownership, when addedtogether, reveal the total incremental XM-1 cost--$1.641 bil-lion, or 19 percent more than M60A3.
Present value analysis of the systems' costs could bemisleading. For example, producing 3,312 XM-ls would re-quire at least 5 years at normal capacity because the XM-1plants will be phased in, beginning in 1981, and will notreach 60 tanks a month until 1983. Procurement of 3,312M60A3s would require only 2-1/2 years because the M60A3 plantwill be able to produce yver 1A tanks a month at normalcapacity. The M60A3's investment money discounted over a2-1/2-year period, compared with the XM-l's investment moneydiscounted over a 5-year period, present the M60A3 as arti-ficially more expensive.
LEOPARD 2AV COSTS
Army studies have concluded the LEOPARD 2AV is morecostly and less effective than the XM-1. Though exactly com-parable cost figures are not available, the FMC Corporation
l/The Federal Republic of Germany (FRG) and the U.S. Army havesigned a memoLandum of understanding for standardizing themain gun in their future main battle tanks. The projectmanager's office has stated that the 120-mm gun added about$35,000 to the cost of each XM-1.
6

has estimated the cost of producing the LEOPARD 2AV at
$783,700 each in 1976 dollars. The XM-1 project manager's
office comparable XM-1 cost estimate is $728,400. Both these
estimates, which we did not verify, are based on the assump-
tion discussed on page 8.
SUMMARY
Our analysis shows the XM-l as 19-percent more expensive
than the M60A3, considering acquisition costs plus operation
and maintenance for 20 years. The projected XM-1 unit cost
is 34-percent more than M60A3, considering only average unit
cost, and 74-percent more, if nonrecurring investment is in-
cluded. Acquisition cost alone, however, is about twice as
much for XM-1 as for M60A3.
Our analysis did not consider war losses. During a war,
tank life may be limited, so incremental costs would be closer
to acquisition costs. This consideration does not necessarilyfavor the cheaper M60 tank, because the XM-l's superior armor
would mean lower attrition.
7

CHAPTER 3
COST UNCERTAINTY IN LIFE CYCLE COST
Cost estimates in advance of production are subject tosome degree of uncertainty. We varied some basic assumptionsabout cost estimates to show t:he sensitivity of cost estimatesto these assumptions.
HARDWARE COST
In 1972 the Army established an average-unit-hardware-cost goal of $507,800 in 1972 dollars. The Army MaterielDevelopment and Readiness Command Headquarters establisheda conversion factor based on a composite index using (1)Bureau of Labor Statistics inflation indices; (2) laborrate contracts between contractors and their union; (3)wholesale price index code 101, iron and steel; and (4)other applicable charges for converting to 1976 dollars.This conversion factor was established at 1.484, thus makingthe goal $754,000 1976 dollars.
Obviously, with production not scheduled until 1980,these cost figures will increase due to inflation in theU.S. economy. However, since inflation will also raisecosts of other tanks, it should not areatly affect theirrelative magnitudes.
The basic assumptions on which the cost goal was basedare (1) a production of 3,312 tanks, (2) a production rateof 30 a month, and (3) a learning curve of 93 percent. TheArmy, after selecting the prime contractor, estimated thatthe XM-1 would cost 3-percent less than the cost goalestablished in 1976 dollars. Based on the above assumptions,the Army currently estimates XM-1 hardware cost at $728,400,assuming the conversion factor properly escalates the 1972cost to 1976 cost. (We did not verify this estimate.)
The project manager has changed one basic assumption onwhich the cost goal had been based. The current hardware costestimate is $705,555-assumed production of 60 tanks a month,rather than the 30 tanks a month formerly planned. Also,this new production plan requires two complementary plants,one in Lima, Ohio, and one at the U.S. Army Tank Plant inWarren, Michigan. Initial production is to begin at theLima Plant in 1980. the Plant in Warren, which currentlyproduces M60 tanks, will be converted to producing XM-1tanks after M60 production ends.
8

RANGE OF UNCERTAINTY
The XM-1 project manager estimates the 20-yeaL life cyclecost of 3,312 XM-ls to be about $10.5 billion (includes allsunk cost), composed of: research and development--$539.3million, investment--$3,617.9 million ($2,259.2 of this forhardware cost), and operating and support--$6,334.5 million.
No matter how good these estimates may be, they arebased on judgment and specific assumptions. Either of thesecan change producing variances from the original estimate.Fluctuations in estimated cost could result from policychanges, such as those affecting the frequency of maintenance,miles driven, quantity produced, rate of production, learningcurve experienced, arms to be mounted, inflation rates used,number of years the estimate is to cover, etc.
In the past, budgetary decisions by the Congress havelargely been based on the unit cost estimated. If costs subse-quently increase, much has been made of it. We believe thatit is also necessary to examine those assumptions which mayultimately change and determine a range of possible costs. 1/
We have examined four assumptions upon which XM-1 costshave been based: the volume of monthly production, the learn-ing curve, the quantity to be produced, and the distance thatthe tank will be driven each year. The first three directlyaffect the unit cost of the XM-1 tank and the last affects theoperational and support cost of the tank. As we will show,each of these factors involves a degree of uncertainty aboutcost.
MONThLY PRODUCTION VOLUME
Originally, the Army planned to produce 30 XM-ls a month.In 1976 the Army established a goal of eventually producing 60XM-1 tanks a month on a one shift, 8 hours-a-day basis. Thiswould provide 30 tanks a month in two complementary plants, eachhaving a surge capacity to 75 a month. This planned change hasreduced the tanks' cost by about 3 percent. The project man-ager gave us data which would indicate the effects of producing
1/See our reports: "Ways To Make Greater Use of the Life CycleCosting Acquisition Technique in DOD" (May 21, 1973), "LifeCycle Estimating--Its Status and Potential Use in MajorWeapons System Acquisitions" (Dec. 30, 1974), and"Application of Design-to-Cost Concept to Major WeaponsSystems" (June 23, 1975).
9

more or less than the planned 60 tanks a month. The followingchart is an adaptation of the supplied data.
Monthly production Hardware cost
(1976 dollars)
30 $718,30040 714,00050 709,80060 705,60070 701,30080 697,10090 692,900
The data indicates that changing the monthly productionvolume by 10 units would change the average unit cost byabout $4,000, or 0.6 percent, without other assumptionchanges.
LEARNING CURVE
The Government frequently uses the learning curve tech-nique to estimate the costs of new weapons. Labor and manu-facturing expenses are unusually high for the first unitsproduced for practically any new item since there is alearning period involved before production flows smoothly.(It takes time to solve equipment problems and to teachworkers to produce the new product.) Determining the level-ing point for such costs is important in pricing the product.
The Army has assumed that the XM-1 unit production costwill follow a 93-percent learning curve. This means thatonce the cost of the first tank is established, 7-percentcost reduction will occur each time production doubles.The decision to assume a 93-percent learning curve wasbased on the Army's experience with M60 tanks. Studies bythe competitive contractors, Chrysler and General Motors,reaffirmed that a 93-percent learning curve was reasonable.The Army estimates the average XM-1 cost at $705,600, basedon the assumptions of two complementary plants producing60 tanks a month, with total production of 3,312 and a93-percent learning curve. Given these data, we producedthe following chart using different learning curves.
10
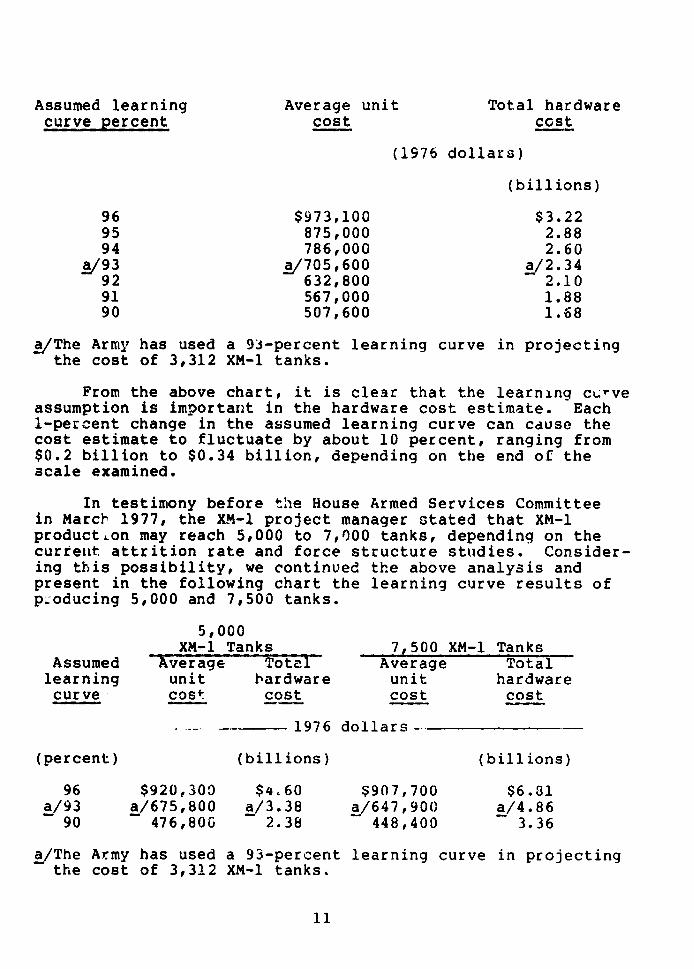
Assumed learning Average unit Total hardwarecurve percent cost cost
(1976 dollars)
(billions)
96 $973,100 $3.2295 875,000 2.8894 786,000 2.60
a/93 ^/705,600 a/2.3492 632,800 2.1091 567,000 1.8890 507,600 1.68
a/The Army has used a 93-percent learning curve in projectingthe cost of 3,312 XM-1 tanks.
From the above chart, it is clear that the learning curveassumption is important in the hardware cost estimate. Each1-percent change in the assumed learning curve can cause thecost estimate to fluctuate by about 10 percent, ranging from$0.2 billion to $0.34 billion, depending on the end of thescale examined.
In testimony before the House Armed Services Committeein March 1977, the XM-1 project manager stated that XM-1production may reach 5,000 to 7,000 tanks, depending on thecurrent attrition rate and force structure studies. Consider-ing this possibility, we continued the above analysis andpresent in the following chart the learning curve results ofp.oducing 5,000 and 7,500 tanks.
5,000XM-1 Tanks 7,500 XM-1 Tanks
Assumed Average Total Average Totallearning unit hardware unit hardwarecurve cost cost cost cost
1976 dollars -
(percent) (billions) (billions)
96 $920,300 $4.60 $907,700 $6.81a/93 a/675,800 a/3.38 a/647,90(0 a/4.86
90 476,800 2.38 448,400 3.36
a/The Army has used a 93-percent learning curve in projectingthe cost of 3,312 XM-1 tanks.
11

Comparing the average unit hardware cost of 3,312, 5,000,and 7,50(C tanks at the assumed 93-percent learning curveindicates that as production increases, costs decrease.Savings associated with the learning curve obviously cannotbe realized indefinitely. Afte. doubling production 13 times,obtaining an additional 7-percent savings requires producingabout 8,200 additional tanks--not very likely at this timeconsidering that 8,200 tanks would already have been produced.
QUANTITY PRODUCED
The currently approved production goal is 3,312 tanks.(The Army is considering increasing total production to between5,000 and 7,000 tanks.) The average unit hardware cost ofthe tank will not be materially affected by increased pro-duction quantity except as noted above. Some economies maybe realized through changes in procurement practices, suchas saving through quantity discounts. However, program costwould be affected because a much greater quantity wouldbe supported by the original production base.
ANNUAL DISTANCE DRIVEN
The project manager reported an average life cycle costof $3.17 million a tank operating a fleet of 1,940 tanksout of 3,312 produced. The remainder will be used as warreserves--in training, as maintenance floats, and pre-positioned. Built into the estimate is an average 1,000miles driven per year per tank. (The average tank in 1976traveled about 650 miles.) We adjusted the average life cyclecost to reflect the costs of only those tanks actually used,resulting in the inuse vehicle life cycle cost. Cost cate-gories mainly affected by changed mileage are "operating"and "support." These include initial spares and the trans-portation cost attributed to distributing them, maintenancecosts, amortized overhaul costs, annual petroleum, oil andlubricants, and operational transportation costs. For example,operating the tank for 1,2C0 miles a year, rather than 800miles, would add about $1 billion to the life cost of a 3,312tank fleet. Total life cycle cost would increase by about7 percent. On the other hand, operating the fleet for 600instead of 1,000 miles would reduce the cos' by about $1billion. The graph below depicts the impact of annual mile-age on life cycle cost per tank.
i2

AVERAGE OPERATIONAL VEHICLE LIFE CYCLE COST(MILLIONS OF 1976 DOLLARS)
'4.8
4.6
4.4
4.2
0 600 800 1000 1200Tank miles per year
SUMMARY
Varying the assumptions on which the XM-ls' estimatedcosts have been based demonstrates that these assumptionshave greatly affected its estimated cost. We found that avariation of 1 percent in the learning curve could changethe hardware cost by about 10 percent, variation of 10 unitsin the monthly production quantity could change hardwarecost by 0.6 percent, and variation of annual mileage of 100miles per tank could change total life cycle cost by almost2 percent. The revised production plan requiring two com-plementary plants will reduce the hardware cost by about3 percent.
13

CHAPTER 4
OPERATIONAL EFFECTIVENESS AND OTHER ISSUES
Over the years, many tests have been conducted to deter-mine the effectiveness of tanks but few have been based onconcepts agreed to by all NATO tank users or even by thefour major tank producers. Some of the reasons are obvious.The combat experience and professional background of thedifferent countries' armor officers differ. Analysis andstudy of wars are and will be based on these individual dif-ferences and the countries' scientific evaluation capabilities.All countries regard the tank as a prestigious weapon. Thelarger NATO members, for reasons of national pride and economicinterests, would prefer to field their own tanks, even thoughthe advantages of a common tank and potential savings areacknowledged by all. We do not discuss effectiveness in de-tail since most of the results of DOD effectiveness studiesare classified and this study deals mainly with life cyclecost. However, once comparative life cycle costs are estab-lished, effectiveness becomes a key consideration. The costcomparisons in chapter 2 indicate the increased effectivenessneeded to justify selecting the more costly XM-1.
OPERATIONAL EFFECTIVENESS
Our analysis in chapter 2 indicates a 19-percent costdifference between XM-l and M60A3 over a 20-year life cycle.The Army states that XM-i is twice as effective overall asM60A3. If this is true, then XM-1 would be an outstandingpurchase, assuming force effectiveness is somewhat proportionalto cost (that is, no substantial effectiveness-advantagereduction occurs when expending equal amounts on XM-1 andM60A3). For example, suppose there are two types of tanks,A and b. In simulated battles in which five As fight fiveBs, A might be found 40-percent more effective. Yet if fiveAs fight six Bs, tank B miJht win. Therefore, using moreBs could produce more than a proportionate increase in forceeffectiveness.
Effectiveness depends on the uses of the system. Defensecapability is different from offensive capability, so the as-sumption about the ratio of defensive to offensive use mayinfluence the conclusion about which tank is more effective.Army studies have examined the relative likelihood of a tank'suse in defense or offense. The ratios examined were 1 to 1,7 to 3, and 9 to 1 for use in defense operations. That is,a 9 to 1 ratio represents the assumption that a tank is usedin a defensive operation 90 percent of the time. The 7 to 3ratio was the preferred rate.
14

The XM-l's overall effectiveness advantage was moderatelysensitive to the offensive or defense ratio in the comparisonbut dominated in all comparisons. For example, in a defen-sive position where fire power is more important than protec-tion and mobility/agility, the XM-l's advantage over M60A3is decreased by only 10 percent. Not considered was that20-percent more M60A3s could have been involved in a battlefor the same money, thus reducing the XM-l's advantage tosome additional degree.
Another consideration NATO defense primarily emphasizedis that for about the same expenditure as is planned for thecurrent 3,312 XM-1 program, it would be possible to purchaseabout 6,300 M60A3 tanks; store 3,000 in Europe; and meet train-ing and operational needs in the United States, Europe, andelsewhere with the remaining 3,300. Should the need arise,the. 6,300 tanks stored in Europe would need only be staffedand supplied to be used; thus, decreasing the mobility forcesrequired and possibly increasing the speed of overseas deploy-ment. However, problems could occur, such as supplying fuelfor the increased number of tanks that would eventually beavailable. Obviously, there are other variations that needconsidering when making overall effectiveness-assessmentsbased on comparable cost. The important premise is that givena dollar benchmark, several considerations must be considered,not just cost and effectiveness of one tank against another.
In offensive situations, the heavy XM-1 tanks are ex-cellent alternatives to the M60 series tanks. However, thearmor protection advantage which these tanks have will notcontinue indefinitely because enemy tanks are likely tobe improved. Enemy tanks currently outnumber NATO tanks2.5 to 1. Even if all the planned XM-ls were fielded now,the ratio would only drop to about 2 to 1.
OTHER ISSUES AFFECTING CHOICES
Some benefits cannot be quantified. For example, we areunable to quantify the benefits of NATO's deploying only onetype of tank, instead of several types, although these benefitsmight be considerable.
International trade considerations are important forlarge weapon systems. With continued growth of world spendingon arms, foreign markets for weapons are important becausethey not only increase domestic production and employmentbut also affect DOP acquisition costs through economies oflarge scale production. Foreign sales can also help recoup
15

part of the development costs. Coproduction with our alliescould bring larger sales to other counr ies. We discussthese issues below but we cannot fully analyze them.
Standardization
Some defense analysts believe that NATO will replace10,00n tanks in the next 15 years. Standard tanks wouldoffer possible economies in research and development, produc-tion, and logistics operations. Though there have been anumber of partial standardization projects, we found littleanalysis of the resultant savings. In the January 1977 addi-tion to a 1974 memorandum of understanding, the U.S. Armyand the Federal Republic of Germany agreed to standardizeon the U.S. turbine engine and to explore additional areasfor standardization, including a 120-mm main gun.
In principle, standardization reduces costs of duplica-tive research and development among the Allied nations.With the new tanks, however, savings in research and deve-lopment would be limited. Over half the Xh-l's research anddevelopment funds already have been spent, and the LEOPARD2 was already in full scale production in 1977.
Producing weapons for the total NATO market could resultin longer production runs and larger scale factories, both ofwhich would lower unit costs. However, this too requiresinternational agreement in the early planning stages.
Standardization could eliminate redundant support facili-ties and overhead, reduce staffing needs for support forces,and lower overall stock levels by merging supplies. All ofthese actions would reduce NATO logistical costs. Also,through increased standardization, unit costs for spare partsand supplies may decrease due to quantity discounts. However,current tank inventories limit the near-term benefits achiev-able through standardization. Great savings are unlikelywhile large numbers of M60, M60A1, M60A2, LEOPARD, and XM-1tanks continue in service because, even with standardization,existing tanks will remain in service for a long time. How-ever, as long as no movement toward standardization occurs,these savings continue to be postponed.
An argument against standardization is the cost of failure.Vast sums have been spent on standardization projects whichnever materialized. The example of U.S.-German efforts todevelop a common main battle tank, known as MBT-70, is oftencited.
16
Decisions by other North Atlantic TreatyOrganization (NATO) countries andforeign military sales
Current plans do not include foreign XM-1 sales. However,Army officials plan to study the possibility in the fall of1978, and they believe demand for XM-i could be great. Foreignsales mi, t result in an extended U.S. procurement program,an increased production rate, or a combination of both.
If the United States decided to sell the XM-1 tank toforeign countries after domestic needs have been met, therewould be no reason to assume that XM-1 program costs wouldchange. However, jobs would be available at XM-1 facilitiesinto the 1990s, and the United States would recoup some ofits sunk costs. There is, however, no reason to think poten-tial buyers would wait until 1986 for new tanks. If the UnitedStates decided to sell the XM-1 tank to foreign countriesearly in the production program, the program cost could bereasonably expected to drop.
Department of Defense (DOD) Directive 2140.2 states thata surcharge for nonrecurring research and development (R&D)will be included in the sale price to non-U.S. Governmentcustomers. The amount is determined within the Departmentbased on a prorata share of all units made.
The United States plans to buy at least 3,312 XM-ls,with a chance of selling 7,000 more. Should this unlikelyevent happen, total R&D costs (over $.5 billion in 1976 dol-lars) would be prorated over 10,312 tanks. The United Stateswould add about $51,400 to the price of each tank sold underForeign Military Sales (FMS), and the United States wouldrecover about $360 million or approximately 51 percent ofits R&D costs. If FMS sales totaled 1,750 XM-1 tanks, theUnited States should add $104r700 to the price of each tank,recovering $183 million, or 35 percent, of its R&D costs.
Other savings
R&D is only one area for which this ty-p of surcharge isassessed. Nonrecurring production costs are d!so prorated,and this surcharge would be somewhat less than the R&D sur-charge. There is also a surcharge of 4 percent of the unitcost per unit for DOD sunk investment in facilities and equip-ment. However, DOD officials may grant deviations from thestated policy and may not charge any surcharge or may reducethe amount as they see fit. In addition to the recovery ofsome R&D and nonrecurring investment costs, other savingsmay be realized through learning curve effects.
17

Coproduction 1/
There are political and economic barriers to adoptingstandard weapons and equipment. Each nation needs to maintainhigh levels of employment, develop a modern industrial base,and preserve a reasonable Salr.- of international trade.Therefore, it may not be feasible for many NATO Allies topurchase tanks from other countries or even to develop tanksof their own. Coproduction arrangements are a logical wayof increasing cooperation and standardization in NATO. Be-cause there are major political, economic, and technologicaladvantages for participating countries, there will probablybe increased pressure fuor coproduction programs.
There is the possibility that harmonization of XM-1 andLEOPARD 2 will involve some coproduction or licensing arrange-ments. (Officials at the XM-1 project manager's office toldus that they expected royalty fees on the turbine engine.)
Coproduction agreements are difficult and present manymanagement challenges. Total costs may be higher than iftotally produced in the United States. On the other hand,coproduction agreements could save money if excess coproducerplant capacity could be used to meet surge requirements.
In economic terms, if the assumption were made that for-eign countries would buy directly from the United Stateswithout coproduction incentives, coproduction arrangementscould result in economic loss to the United States. Conversely,if sales of an item were dependent on coproduction, coproductionwould be positive because part of the item would be producedin the United States. If these agreements are considered anextension of U.S. production capabilities, they could alsobe considered beneficial to the U.S. economy since U.S. firmscould possibly realize royalty fees which contribute to theprofit margin of firms. the U.S. tax base, and the balanceof payments.
U.S. participation in a coproduction effort may signi-ficantly restrict prerogatives to change the program scheduleor reduce funding levels. Such actions could cause politicalrepercussion, ir, the participating nations and could affect U.S.relations with the nations involved.
1/See "Sharing the Defense Burden: The Multinational F-16Aircraft Program' (Aug. 15, 1977).
(97133)
18