pacific northwest gridwise™ testbed demonstration projects… · the study used 150 new...
TRANSCRIPT

Pacific Northwest GridWise™ Testbed Demonstration Projects Part II. Grid Friendly™ Appliance Project
DJ Hammerstrom, Principal Investigator J Brous TA Carlon DP Chassin C Eustis GR Horst OM Järvegren R Kajfasz W Marek P Michie RL Munson T Oliver RG Pratt
October 2007
Prepared for the U.S. Department of Energy under Contract DE-AC05-76RL01830

DISCLAIMER
This report was prepared as an account of work sponsored by an agency of the United States Government. Neither the United States Government nor any agency thereof, nor Battelle Memorial Institute, nor any of their employees, makes any warranty, express or implied, or assumes any legal liability or responsibility for the accuracy, completeness, or usefulness of any information, apparatus, product, or process disclosed, or represents that its use would not infringe privately owned rights. Reference herein to any specific commercial product, process, or service by trade name, trademark, manufacturer, or otherwise does not necessarily constitute or imply its endorsement, recommendation, or favoring by the United States Government or any agency thereof, or Battelle Memorial Institute. The views and opinions of authors expressed herein do not necessarily state or reflect those of the United States Government or any agency thereof.
PACIFIC NORTHWEST NATIONAL LABORATORY
operated by
BATTELLE
for the
UNITED STATES DEPARTMENT OF ENERGY
under Contract DE-AC05-76RL01830
Printed in the United States of America
Available to DOE and DOE contractors from the
Office of Scientific and Technical Information,
P.O. Box 62, Oak Ridge, TN 37831-0062;
ph: (865) 576-8401
fax: (865) 576-5728
email: [email protected]
Available to the public from the National Technical Information Service,
U.S. Department of Commerce, 5285 Port Royal Rd., Springfield, VA 22161
ph: (800) 553-6847
fax: (703) 605-6900
email: [email protected]
online ordering: http://www.ntis.gov/ordering.htm

Pacific Northwest GridWise™ Testbed Demonstration Projects Part II. Grid Friendly™ Appliance Project
DJ Hammerstrom, Principal Investigator J Brous TA Carlon DP Chassin C Eustis GR Horst OM Järvegren R Kajfasz W Marek P Michie RL Munson T Oliver RG Pratt
October 2007
Prepared for the U.S. Department of Energy under Contract DE-AC05-76RL01830
Pacific Northwest National Laboratory Richland, Washington 99352


PNNL-17079
iii
Abstract Fifty residential electric water heaters and 150 new residential clothes dryers were modified to
respond to signals received from underfrequency, load-shedding appliance controllers. Each controller monitored the power-grid voltage signal and requested that electrical load be shed by its appliance whenever electric power-grid frequency fell below 59.95 Hz. The controllers and their appliances were installed and monitored for more than a year at residential sites at three locations in Washington and Oregon. The controllers and their appliances responded reliably to each shallow underfrequency event—an average of one event per day—and shed their loads for the durations of these events. Appliance owners reported that the appliance responses were unnoticed and caused little or no inconvenience for the homes’ occupants.


PNNL-17079
v
Executive Summary From early 2006 through March 2007, Pacific Northwest National Laboratory (PNNL) managed the
Grid Friendly™(a) Appliance Project, a field demonstration of an autonomous, grid-responsive controller called the Grid Friendly™ appliance (GFA) controller. This device is a small electronic controller board that autonomously detects underfrequency events and requests that load be shed by the appliance that it serves. The Grid Friendly Appliance Project was one of two field-demonstration projects of the encompassing Pacific Northwest GridWise™(b) Testbed Demonstration.
For the Grid Friendly appliance demonstration, the GFA controller was configured to observe the nominally 60-Hz ac voltage signal, which is available at any residential wall plug receptacle, to recognize instances when the measured grid frequency fell below a 59.95-Hz threshold and to promptly alert the controlled appliance about the impending underfrequency event. Grid frequency is a grid-wide indicator of any mismatch between generation and load on the grid. The sudden loss of a large generator on the grid will result in a sudden drop in grid frequency that cannot be immediately counteracted by the existing resource-side controllers and available spinning reserves. The resulting underfrequency condition will continue until generation and load again become matched.
The study used 150 new residential clothes dryers that were manufactured for the project by Whirlpool Corporation and 50 retrofitted residential water heaters. The appliances were modified to shed major portions of their electrical loads when they received signals from their GFA controllers. These modified appliances were distributed among residences in several communities in the Pacific Northwest—Gresham, Oregon; and Yakima, Port Angeles and Sequim, Washington. The GFA controllers’ output signals and corresponding appliance responses were monitored at the participating residences for more than a year using commercial energy-management systems.
Autonomous underfrequency load shedding. The Grid Friendly Appliance Project tested the hypothesis that the GFA controller could directly contribute to frequency protection on the electric power grid. It performed a function similar to what is now practiced at some substations where underfrequency relays autonomously react to shed the load of entire feeders when low-frequency thresholds are crossed—essentially leaving whole neighborhoods in the dark to prevent even more widespread outages.
Substation frequency protection is seldom activated, but the frequency threshold of the GFA controller was set high enough so it would recognize frequent, shallow frequency excursions. Indeed, 358 GFA underfrequency events were observed and analyzed during the field demonstration using the selected threshold of 59.95 Hz. This report shows that these events were reliably detected in the field by GFA controllers and that the appliances responded to the signals as designed by shedding portions of their loads.
Based on laboratory test observations, the GFA controller supplied a signal to shed its appliance’s load within about ¼ second after a sudden drop in frequency. The underfrequency events observed in the field lasted from several seconds to 10 minutes—short enough that residential customers, when later
(a) “Grid Friendly” is a registered trademark of Battelle Memorial Institute.
(b) “GridWise” is a registered trademark of Battelle Memorial Institute.

PNNL-17079
vi
surveyed, responded that they had neither observed nor been inconvenienced by the curtailments of their appliances. The appliances received virtually the same frequency signal and responded to the signal similarly, despite the distribution of controllers over a wide geographic region. Every appliance responded when the frequency dipped 0.003 Hz or more below the control threshold as measured by a frequency monitor in eastern Washington State.
While the results were promising, the sum of the load resources controlled by the 200 controllers was admittedly small. Therefore, the hypotheses that an army of such controllers could protect the system frequency, prevent actuation of substation underfrequency relays, and displace much of the need for spinning reserves remain to be definitively proven by simulation and by larger field demonstrations.
It is interesting to consider that the service provided by demand-side controllers might be superior in many ways to the underfrequency protection currently provided at substations. First, the frequency threshold of the GFA controller was set relatively high compared to the thresholds for substation underfrequency relays. The response of the GFA controller will, therefore, anticipate and precede that of the substation relays. Protection performed with GFAs results in little or no inconvenience for the appliance owner, whereas the substation relay action creates outages for many customers on entire feeder circuits. The loads shed by large substation relays represent large bulk load reductions; the curtailment of a vast number of loads controlled by GFA controllers could be intentionally staggered by imposing a distribution of frequency-response thresholds, resulting in a smoother abatement of system deceleration. Furthermore, if widely adopted throughout distribution systems within a power grid, GFA appliances might better prevent the propagation of disturbances by mitigating them near their source, which is not as feasible using more centrally located substation protection devices.
Autonomy and communication. Among the important attributes of a GFA controller is that it performs its duties autonomously. The only communication that it requires is the ac voltage signal that is available at any appliance’s wall-plug receptacle. For the purposes of this demonstration, however, components of the Invensys Controls GoodWatts™ energy-management system monitored the performance of each controller and its appliance and communicated observations of the controller and appliance actions. This energy-management system further allowed the traditional demand response to be successfully applied from a central location to the controlled appliance. A fully communicating controller could offer benefits such as permitting the controller to be temporarily disabled, or its performance to be modified, as might be requested by system operators. However, communication to otherwise autonomous demand-side controllers like the GFA controller incurs additional costs. Those who invest in GFAs and their services must weigh whether additional functions and additional flexibility warrant the additional costs for external communications.
Traditional demand response applied to GFA controllers. Several times during this field demonstration, traditional peak-shaving demand-response requests were submitted to the appliance loads for intervals from 2 to 4 hours. While not as innovative as other aspects of the project, performing this curtailment successfully demonstrated that loads controlled by the GFA controller could also receive and react to other demand-response requests. The affected water heaters fully curtailed their loads in response to this prolonged signal; the dryers simply alerted their operators to the request audibly and visually via a front panel light-emitting diode indicator. If the dryer owners wanted to use the appliance during this time, they would have to push the start button a second time to acknowledge the curtailment request. This

PNNL-17079
vii
is one of the first demonstrations wherein an interactive appliance like the clothes dryer has been equipped to announce a utility’s curtailment request for voluntary curtailment.
Correlation of underfrequency events and load shapes. Persistent monitoring of the controlled water heaters and dryers gathered extensive data as to how consumers used these appliances. Most important, the likelihood that these appliance loads will be active and available for curtailment at various times of the day was determined. This information permitted a strong statistical argument to be established about the capacity value of the autonomous regulation and protection services available from this experimental appliance population for utilities and the entire grid.
Between 0.02 and 0.2 kW per controlled clothes dryer were available to be shed, depending on time of day, day of week, and season. Between 0.1- and 0.7-kW average load per controlled water heater was observed. The water-heater peak consumption corresponded closely with Pacific Northwest grid electric-load peaks. The clothes dryer load, in contrast, was relatively flat throughout the daytime hours.
No relevant pattern was observed for the occurrences of underfrequency events for the specific threshold exercised in the Grid Friendly Appliance Project, meaning that the likelihood of such frequency excursions was quite random and unpredictable. The statistical argument that accompanies these observations will be instrumental to utilities as they evaluate and develop programs to apply autonomous grid-responsive controllers.
The authors contend that there will be value in controlling multiple appliance types over a broad geographical area to benefit from the diversity of such diverse load populations. While the onset and release of underfrequency appliance responses in this project were applied uniformly, it is recognized that frequency threshold distributions should be imposed, and event releases should be randomized to maintain and re-create load diversity in the populations of appliances.
Cold load pickup. Any time the controlled appliances were energized, the GFA controllers initialized themselves in their triggered, curtailed states. A short delay therefore occurred before controlled appliances were permitted to operate. Such a cold-load-pickup capability is obtained at no cost with smart appliance load controllers like the GFA controller. The delay may be designed to ease the introduction of loads onto feeders as they energize.
Cost effectiveness of controlling small loads. Part of the vision for GFA controllers is to inexpensively employ numerous distributed controllers to perform needed demand-side control that will, ultimately, support and improve the operation and reliability of a power grid. Two load-control options presently exist for large and small loads: large industrial loads may be controlled by applying unique engineering site-by-site. Smaller and appliance loads may be controlled by applying external load-control switches placed between the loads and their electric service. The cost of controlling a single large commercial or industrial load is great, but the one large control point controls much capacity. The electric-power industry has not yet fully investigated whether a superior application model might exist for numerous smaller, perhaps even residential, loads that are designed once and manufactured literally by the millions, ready to respond to demand-response signals or other grid needs. A goal for developing GFA controllers would be to have such control eventually installed by the appliance manufacturers at their manufacturing facilities where labor is most economical.
The “friendly” part of GFAs. The model for applying demand-side controllers is also greatly affected by the “friendliness” with which demand-side control or ancillary services are performed. The

PNNL-17079
viii
resource pool is very restricted if the goal is only to control the largest commercial and industrial loads. Utilities that request commercial and industrial loads to be curtailed must pay their customers well for inhibiting profitable endeavors. Indeed, anyone’s willingness to supply demand-side responsiveness will be influenced by the inconvenience they must endure to supply the response. If, for example, a circuit is interrupted even briefly while a clothes dryer is being used, it must be restarted and reset. In contrast, the “grid-friendly” dryer used in this demonstration simply stopped powering the heating elements, leaving the dryer drum to tumble until the heating elements could come back online. Significant power was thereby shed without an observable inconvenience to the dryer owner.
The authors contend that many such opportunities exist to perform similar innocuous and “friendly” demand-side functions on millions of residential and small commercial appliance loads. These opportunities are further enhanced if they are designed in close cooperation with the manufacturers of such appliances to achieve such grid benefits while incurring only minimal customer inconvenience.
Participants surveyed. A unique aspect of this report is the inclusion of several essays from project participants representing the perspectives of utilities, appliance manufacturers, and appliance owners. When surveyed at the conclusion of the project, residential participants confirmed that they had not been inconvenienced by the autonomous underfrequency control of their appliances, and most would purchase an appliance configured with such a grid-responsive control.
Conclusions and recommendations. Based on the conclusions drawn from the Grid Friendly Appliance Project, technical feasibility is not standing in the way of applying distributed, frequency-responsive appliance load controllers. The project’s controllers reliably recognized and responded to underfrequency events on the electric power grid. Appliance owners accepted and were not inconvenienced by such control applied to their home appliances. More work is needed, however, in developing a viable business case that is acceptable for utilities, appliance manufacturers, and appliance owners. More work also is needed to verify the grid-wide benefits and the advisability of applying such distributed load control.

PNNL-17079
ix
Acknowledgements
This project owes its success to the commitments and contributions of many individuals and companies who provided financial support and in-kind labor.
Bonneville Power Administration provided financial support, provided technical guidance, suggested non-wires resources that could be made available to the project, and helped the project recruit willing utility collaborators. Terry Oliver, David Le, and Mike Weedall provided valuable technical guidance to the project. Jenny Roehm, and Mike Hoffman were steadfast participants in weekly technical meetings and helped immensely with the project’s recruitment efforts.
Many employees of Invensys Controls spent numerous hours providing engineering assistance and hardware and firmware modifications for the project. The project acknowledges the efforts of Mike Anderson, Joe Beaudet, Rich Burns, Walt Conner, Sandie Haynes, and Anthony Gajadharsingh, who worked very hard to make the project successful.
PacficCorp provided counsel from conception through the conclusion of this project. Their contributions included financial resources, research design, technical guidance, customer recruitment, issue resolution, and recommendations for the customer questionnaire. Jeff Baumgarner, Dean Miller, and especially Bill Marek provided their useful insights and participation.
Port Angeles was kind enough to help the project recruit residents from among their electric utility customers. The project acknowledges the valuable participation of Bob Kajfasz and his coworkers.
Portland General Electric Company provided counsel from conception through the conclusion of this project. Their contributions included financial resources, research design, technical guidance, customer recruitment, issue resolution, and recommendations for the customer questionnaire. The contributions of Joe Barra, Laura Rooke, and Conrad Eustis helped make this project successful.
PUD #1 of Clallam County kindly helped the project recruit participants from among its electric utility customers. The project acknowledges especially Mattias Järvegren and Bronna Hankoff for their enthusiastic participation.
The U.S. Department of Energy provided the largest share of funding for the project. The leadership of Eric Lightner should be acknowledged. The project also acknowledges the participation of many additional persons at Pacific Northwest National Laboratory who performed many necessary support functions. Many researchers at PNNL have contributed to the Grid Friendly technology and vision over the years.
Whirlpool Corporation has made significant research investments in smart appliances and made significant in-kind investments in this project. Project dryers were supplied to the project by Whirlpool at a deeply discounted rate. The project especially recognizes Andrew Sinclair, Jiannong Zhang, and Gale Horst for their efforts on behalf of the project.


PNNL-17079
xi
Acronyms
AMI advanced metering infrastructure
ASIC application-specific integrated circuit
BPA Bonneville Power Administration
DOE U.S. Department of Energy
DSL digital subscriber line
FPGA field programmable gate array
GFA Grid Friendly™ appliance
HVAC heating, ventilation and air conditioning
ISO independent system operator
LCM load control module
LED light-emitting diode
NERC National Electric Reliability Council
OEM original equipment manufacturer
PGE Portland General Electric
PLL phase lock loop
PNNL Pacific Northwest National Laboratory
PUC public utility commission
PUD public utility district
RTO regional transmission organization
RTP real-time price
TOU time-of-use
VPN virtual private network
WECC Western Electricity Coordinating Council


PNNL-17079
xiii
Contents
Abstract ........................................................................................................................................................iii
Executive Summary ...................................................................................................................................... v
Acknowledgements...................................................................................................................................... ix
Acronyms.....................................................................................................................................................xi
1.0 Introduction....................................................................................................................................... 1.1 1.1 Introduction to the GFA Controller ......................................................................................... 1.1 1.2 Potential Benefits for Various Stakeholders............................................................................ 1.1 1.3 Function of the GFA Controller .............................................................................................. 1.3 1.4 Underfrequency Load Shedding .............................................................................................. 1.4 1.5 GFA Controller Hardware ....................................................................................................... 1.7 1.6 GFA Controller Firmware ....................................................................................................... 1.8 1.7 Controller and Implementation Costs .................................................................................... 1.10
2.0 Appliance Integration Process for the Grid Friendly Controller....................................................... 2.1 2.1 General Grid Friendly Controller Integration.......................................................................... 2.1 2.2 Integration of Grid Friendly Controller with Appliance Loads ............................................... 2.6 2.3 Observed Load Effects on Frequency Measurement ............................................................. 2.10
3.0 Recruitment Activities and Project Interactions with Appliance Owners ........................................ 3.1 3.1 Recruitment Activities ............................................................................................................. 3.1 3.2 Routine Appliance-Owner-Project Interactions....................................................................... 3.6 3.3 Project Decommissioning Activities ....................................................................................... 3.9 3.4 Final Survey............................................................................................................................. 3.9
4.0 Performance Data ............................................................................................................................. 4.1 4.1 Data Collection ........................................................................................................................ 4.1 4.2 Time-Stamp Issues................................................................................................................... 4.3 4.3 Underfrequency-Event-Response Recording .......................................................................... 4.7 4.4 Electrical-Load Measurement during Events ........................................................................ 4.10 4.5 Characteristics of Recorded Underfrequency Events ............................................................ 4.11 4.6 Total Recognized Events Appliance-by-Appliance............................................................... 4.12

PNNL-17079
xiv
4.7 Detected Events as a Function of Event Frequency Depth.................................................... 4.15 4.8 Response Success as a Function of Event Duration .............................................................. 4.16 4.9 Histograms of Underfrequency Events versus Time ............................................................. 4.17 4.10 Measured Appliance Behaviors ............................................................................................. 4.18 4.11 Traditional Demand-Response Events................................................................................... 4.20
5.0 Perspective Statements ..................................................................................................................... 5.1 5.1 Utility Perspectives.................................................................................................................. 5.1 5.2 An Appliance Manufacturer’s Perspective ............................................................................ 5.10 5.3 An Appliance Owner’s Perspective....................................................................................... 5.16
6.0 Conclusions....................................................................................................................................... 6.1
7.0 References......................................................................................................................................... 7.1
Appendix A................................................................................................................................................... 1

PNNL-17079
xv
Figures
1.1. WECC Frequency Histogram Using Data Collected by PNNL from 2002 to 2005.......................... 1.5
1.2. Response Time of the GFA Controller .............................................................................................. 1.7
1.3. GFA Controller Board used in the Grid Friendly Appliance Project................................................. 1.8
1.4. Simplified FPGA Firmware Logic-Block Control Diagram.............................................................. 1.9
2.1. Invensys GoodWatts System ............................................................................................................. 2.2
2.2. Invensys GoodWatts Load Control Module and Extra Second Box.................................................. 2.4
2.3. Invensys Controls GoodWatts Home Gateway.................................................................................. 2.5
2.4. Load-Control Module Installed on Water Heater in a Project Home ................................................ 2.9
3.1. Dryer Installation Schematic.............................................................................................................. 3.5
3.2. Project Sears Kenmore HE2 Dryer and Load Control Module in a Participating Home ................... 3.6
3.3. Label Affixed to Project Dryer with Prominent Toll-free Telephone Number.................................. 3.7
4.1. GFA Controller Responses to Two Underfrequency Events on July 25, 2006.................................. 4.4
4.2. GFA Controller Responses by Location ............................................................................................ 4.5
4.3. Responses by Location Soon After a Gateway Firmware Update Had Been Completed.................. 4.6
4.4. Distributions of Time Stamps to the Nearest Second ........................................................................ 4.6
4.5. Frequency and Aggregate GFA Controller Response to an Event, Oct. 21, 2006............................. 4.7
4.6. GFA Responses to Several Consecutive Underfrequency Events ..................................................... 4.8
4.7. Cumulative Response Separated By Onset Triggers and Releases.................................................... 4.9
4.8. Example Data Logged From Active Project Dryer During an Underfrequency Event.................... 4.10
4.9. Distribution of Event Depths for the Grid Friendly Demonstration Appliances ............................. 4.11
4.10. Cumulative GFA Controller Responses by Event-Frequency Depth............................................. 4.12
4.11. Distribution of Recorded Event Durations During the Grid Friendly Project ............................... 4.13
4.12. Distribution of Total Underfrequency Events Recognized by Water Heaters ............................... 4.14
4.13. Distribution of Events Recognized at Clothes Dryers ................................................................... 4.15
4.14. Percentages of GFA Controllers Responding at Various Frequency Depths................................. 4.16
4.15. GFA Responses versus Event Durations ....................................................................................... 4.17
4.16. Distribution of Frequency Events by Month.................................................................................. 4.18
4.17. Distribution of Frequency Events by Time of Day........................................................................ 4.19
4.18. Predicted Daily Load Value of the Electric Water Heater by Season............................................ 4.20

PNNL-17079
xvi
4.19. Predicted Daily Load Value of the Electric Clothes Dryer by Season........................................... 4.21
5.1. BPA Energy Web Diagram................................................................................................................ 5.2
Tables
1.1. Likelihood of Underfrequency Events (Events/Day)......................................................................... 1.5
1.2. Field Settings of the GFA Controller ................................................................................................. 1.9
2.1. Example Event Data Set as Maintained at and Retrieved from the Back-End Server....................... 2.6
2.2. Definitions of Data Column Headers Used for GFA Event Data Logs ............................................. 2.7
2.3. Designed GFA Signals and Corresponding Appliance Responses. ................................................... 2.8

PNNL-17079
1.1
1.0 Introduction The Grid Friendly Appliance Project was part of the Pacific Northwest GridWise Testbed
Demonstration Project managed for the U.S. Department of Energy by Pacific Northwest National Laboratory (PNNL) from 2005 through 2007. This project was intended to demonstrate a toolset to manage the emerging smart grid. PNNL and the U.S. Department of Energy at times use the word GridWise for these smart grid tools and their programmatic application. This report describes the field demonstration of the Grid Friendly appliance (GFA) controller, an underfrequency load-shed controller applied to 50 water heaters and 150 clothes dryers in the Pacific Northwest. A companion report describes the Olympic Peninsula Project in which energy price controls were experimentally applied (Hammerstrom et al. 2007).
This chapter introduces the GFA controller hardware and its functions. After a brief overview, the function of the controller will be introduced, including its potential benefits to various stakeholders. The specific capabilities of the controller will be stated. Then an attempt will be made to describe the state of the controller’s commercialization, including its present cost.
The next chapter will address the integration process by which the GFA controller was placed in homes with water heaters and clothes dryers for the field project. Chapter 3 will address how the project recruited and interacted with homeowners in whose homes the frequency-responsive appliances were placed and monitored. In Chapter 4, collected field data concerning the performance of the appliance controllers are analyzed and discussed. Chapter 5 includes essays from several utility, manufacturer, and appliance owners describing their unique project perspectives. The last chapter summarizes the project’s findings, list lessons learned during the project, and suggests possible future research directions. The report also includes a list of references and an appendix containing detailed information on GFA responses, participation criteria, and participant survey results.
1.1 Introduction to the GFA Controller The ultimate purpose of the GFA controller is for it to reside within an electrical appliance load,
observe the ac voltage signal available to the appliance at its wall plug, autonomously detect grid problems, and alert its appliance when the appliance load can react to help the electrical power grid. In this specific field demonstration, the GFA controller observed only grid frequency and advised its appliance to shed portions of its load whenever an underfrequency threshold was matched. This action, when carried out by numerous appliances, could help protect the power grid frequency, enhance regulation, and perhaps also avoid excitation of oscillatory modes within the power grid.
One could foresee many other future opportunities for the GFA controller to also respond to voltage and, with communications, to price signals and more traditional demand-response program signals.
1.2 Potential Benefits for Various Stakeholders Even after the technical performance of grid-responsive load controllers like the GFA controller has
been proven, business cases must be made to each stakeholder to convince them to move forward to build and apply such controllers. Consider the benefits available to each stakeholder:

PNNL-17079
1.2
1.2.1 Appliance Owner The appliance owner potentially benefits in both indirect and direct ways. First, the appliance owner
could benefit from a more-reliable electric grid if many appliances on the grid were responsive. This benefit is indirect and relies on the altruism of numerous appliance owners. The case may be hard to make, especially for the electric customer who has become accustomed to adequately reliable power at moderate electricity costs. The argument might be easier to make for one who has recently experienced rolling blackouts or other power quality hindrances. On a more positive note, altruism itself might be enough to convince some appliance buyers to pay more for a global benefit. Indeed, some utility customers now buy premium “green” power that is, other than by price, indistinguishable from the power received by non-green customers.
Also, appliance life might be increased for appliances that anticipate and respond to electric grid problems. An appliance could place itself in safe mode, for example, during an underfrequency or under-voltage event, thus preventing premature failure of the appliance. Again, this argument may be weak for an electric customer who now trusts his utility to indefinitely supply reliable electric power. Appliance owners may also expect appliance manufacturers to warrantee that their appliances will work regardless of poor power quality.
Finally, appliance purchasers have increasingly smart appliances from which to choose. It may be easier to justify grid-responsive functions in appliances that are already “smart.” Some additional functionality in processor-based appliances may be had through changes in software alone. Some customers already pay premiums for smart, processor-based appliances.
More direct economic benefits derived from improved system efficiencies might be passed along to an appliance owner as rebates, program participation payments, or pay-per-response rewards from the utility, state, or federal governments. Ideally, an appliance owner should share economic benefits received by his utility or another party.
For his/her willingness to participate, each appliance owner incurs a small cost—the inconvenience of having his/her appliance respond and operate in a curtailed mode. Inconveniences borne by the appliance owner should be minimized. This study will show that such inconvenience was small for appliances responding to short underfrequency events.
1.2.2 Utility Grid Operator While all utilities desire stable, regulated grid frequency, the responsibility for these services is
distributed among utilities and are not wholly attributable to a single utility or region. Programmatically, the investment of utilities in Grid Friendly underfrequency appliances duplicates the functions now provided by substation underfrequency relays and by generator regulation. Utilities realistically need to invest no more than their share in the correction and regulation of grid frequency, the benefits of which might be received by their neighbors instead.
A cost perspective, however, will drive utilities and other grid entities to value grid-responsive technologies if they can cost-effectively displace their need for costly spinning reserves. Utilities must use their resources efficiently. Therefore, the potentially off-set costs of spinning reserves maintained for frequency regulation and other contingencies will enhance the value of GFAs from the utility perspective.

PNNL-17079
1.3
1.2.3 Appliance Manufacturer The appliance manufacturer may not benefit directly from its decision to include grid-responsive
controller technologies in its appliances, but appliance manufacturers constantly seek ways to differentiate their products in the marketplace and better serve their customers. For example, grid-responsive controllers might help an appliance last longer by avoiding stalled motors or by anticipating and performing graceful recoveries from grid problems. An appliance manufacturer’s GFA might better satisfy the needs of emerging utility programs and thereby become the preferred appliance for a utility program. Through competition, the manufacturer’s appliance earns participation in even more utility programs if his appliance is more responsive to program needs than those appliances offered by competitors.
The appliance manufacturer can also differentiate itself from competitors by the “friendly” way in which the appliance interacts with its owner. This means the appliance manufacturer will avoid unnecessarily inconveniencing customers while its appliances help the grid. Those appliances that inconvenience their owners unnecessarily will compete poorly.
Ultimately, the appliance manufacturer participates in a competitive market and has limitations because of the challenges of manufacturing. Even minor manufacturing costs incurred by appliance manufacturers must be recovered from their customers or from others. The appliance manufacturer must anticipate and react to mandatory programs and standards to which it might become subjected. Also modifications to existing product assembly lines are prohibitively expensive. An appliance manufacturer cannot easily and economically modify its product uniquely region-by-region or program-by-program.
1.3 Function of the GFA Controller The GFA controller used in this field demonstration is a small electronic control board that calculates
the electrical ac fundamental frequency of a grid voltage signal and asserts one of its output signals whenever the measured frequency falls below a threshold frequency. Once asserted, the signal remains asserted until the measured frequency rises above another higher threshold. This higher threshold provides some response hysteresis that will prevent the output signal from oscillating should the measured frequency hover near the underfrequency threshold. After the higher frequency has been exceeded, a timer is initiated, and a predetermined time duration must be exceeded before the output signal will be released. If the frequency falls below the higher frequency again at any time during this count, the count is restarted. This delay, too, prevents oscillatory responses and verifies that system frequency is acceptable and stable before the controlled appliance load is permitted to restart.
No claim is made that the thresholds and delays used in this project are optimal. The underfrequency threshold was chosen instead to guarantee that numerous underfrequency events would be observed at least once per week. The recovery delay was set long enough to verify that the event would be captured by the event logging equipment used by the project. Eventually, the instantiation of thresholds and delays should be determined in coordination with appliance manufacturers and utilities according to the needs and capabilities of each. Single, specific values for the thresholds and delays were chosen, but the thresholds and delays should eventually be assigned as distributions to promote smooth responses and to quickly re-establish the diversity of cycling loads after each grid event.

PNNL-17079
1.4
1.4 Underfrequency Load Shedding The nominally 60-Hz power grid frequency is ordinarily controlled by a combination of automated
generation controllers and human oversight. Mismatched system generation and load cause deviations from nominal grid frequency. Automatic generator controls respond to such mismatches within tens of seconds; humans further respond within tens of minutes. Active loads can rapidly shed portions of their loads in response to sudden generation deficits—underfrequency events—and can respond faster than either generation or humans. Autonomous underfrequency controllers could become an important tool for the management of grid frequency.
A histogram of the likelihood of grid frequencies on the Western Electricity Coordinating Council (WECC) system was shown by Lu and Hammerstrom (2006) and is reproduced here in Figure 1.1. Note that the likelihood axis is a log scale, demonstrating the remarkably narrow region within which the grid frequency is managed about its nominal value.
Project staff desired to observe underfrequency events in the field with intermittency between once per week and once per day. This design criterion was chosen to achieve numerous observable underfrequency events during the experiment. Ultimately, the underfrequency threshold would be established lower than this for permanently installed frequency-responsive resources at frequencies perhaps midway between nominal and those frequencies at which substation underfrequency relays now respond. Fewer events would then become recognized and cause load responses. However, appliance owners were apparently not inconvenienced even by the high experimental threshold and by the consequent high number of appliance responses during this field experiment.
Lu and Hammerstrom (2006) thoroughly analyzed historic WECC data from which an acceptable underfrequency threshold was selected. Simulation studies were performed on historic WECC frequency data to predict the effects, in general, of using various underfrequency thresholds, triggering response delays, tt, and reset delays, tr (see Table 1.1).
The triggering response delay (the delay from the time the system frequency signal goes below the threshold and the response of the appliance) is a function of both the GFA hardware and its firmware. The minimum duration is limited by hardware, hardware configuration, sensing algorithm, and by any intentionally imposed filtering that is performed on the raw data. The appliance hardware also can intentionally or unintentionally increase the triggering-response delay. While actually a function of event depth and frequency deceleration rate, the controller’s triggering-response delay can be approximated well enough as being 0.2 second. The maximum allowable value for this delay should be specified by industry to avoid harmful excitation of grid dynamic system modes.
The reset delay (the delay between the frequency recovery and the release of the appliance response) can be designed to protect the appliance without incurring unnecessary numbers of, or oscillatory, control actions. Field monitoring equipment used in this experiment had been specified during a request for proposals to capture events 15 seconds and longer in duration. Therefore, the reset delay was set at 16 seconds for the project.

PNNL-17079
1.5
Figure 1.1. WECC Frequency Histogram Using Data Collected by PNNL from 2002 to 2005
Table 1.1. Likelihood of Underfrequency Events (Events/Day) (Lu and Hammerstrom 2006)
tt = 0.2 s 1.0 s 4.0 s f (Hz) tr = 1 s 10 s 100 s 1 s 10 s 100 s 1 s 10 s 100 s 59.90 0.03 0.01 0.01 0.03 0.01 0.01 0.020 0.00 0.00 59.91 0.06 0.01 0.01 0.05 0.01 0.01 0.03 0.01 0.01 59.92 0.09 0.02 0.01 0.08 0.01 0.01 0.06 0.01 0.01 59.93 0.26 0.05 0.02 0.21 0.03 0.01 0.14 0.03 0.01 59.94 0.69 0.10 0.03 0.61 0.10 0.03 0.51 0.07 0.02 59.95 2.0 0.34 0.11 1.6 0.26 0.09 1.2 0.20 0.06 59.96 10 1.7 0.54 8.1 1.3 0.41 6.3 0.99 0.30 59.97 56 9.0 2.6 44 7.1 2.1 34 5.4 1.6 59.98 270 42 10. 230 35 8.4 180 27 6.8 59.99 1000 150 28 870 130 25 720 100 21
Pr
obab
ility
of O
ccur
renc
e
Frequency (Hz)
100
10-5
10-10
60.0 60.2 60.4 59.8 59.6
PNNL-17079
1.6
Using these known values for triggering and reset delays and using the simulation results summarized in Table 1.1, an acceptable underfrequency threshold was estimated to be 59.95 Hz to achieve more than one response per week but not more than one response per day. Not included in this analysis was a response hysteresis parameter designed to avoid multiple triggers for each event. By design, after a frequency event was recognized at 59.95 Hz, the frequency must then exceed 59.96 Hz for 16 seconds before the event would become released and the controller reset.
1.4.1 Related Research Ongoing research can be found for underfrequency load shedding at substations, but research at the
feeder level need not be addressed here. The use of distributed loads to enhance the frequency stability of electrical power is being addressed by Dr. Trudnowski at Montana Tech, University of Montana (Trudnowski, Donnelly, and Lightner 2006). Virginia Tech researchers have focused on studying the propagation of frequency disturbances through a power grid (Virginia Tech 2007). Researchers at the Technical University of Denmark have been among the first to investigate the modulation of set points on small thermostatically controlled loads for provision of frequency reserve (Xu et al. 2007). Cannon Technologies, Inc. (2005) has provided and installed underfrequency load-control devices on loads on the island of Oahu, Hawaii, which is served by the Hawaiian Electric Company, Inc.
1.4.2 Response Time The response of the GFA controller was observed in a laboratory setting before its application in the
field. The controller-frequency measurement includes the effects of a low-pass digital filter, which smoothes the data and prevents false responses to spurious inputs and noise. Therefore, the triggering response time of the controller is best defined by a formal response time, the time needed for a measurement to transition between 10% and 90% of its response to a step input that is being tracked.
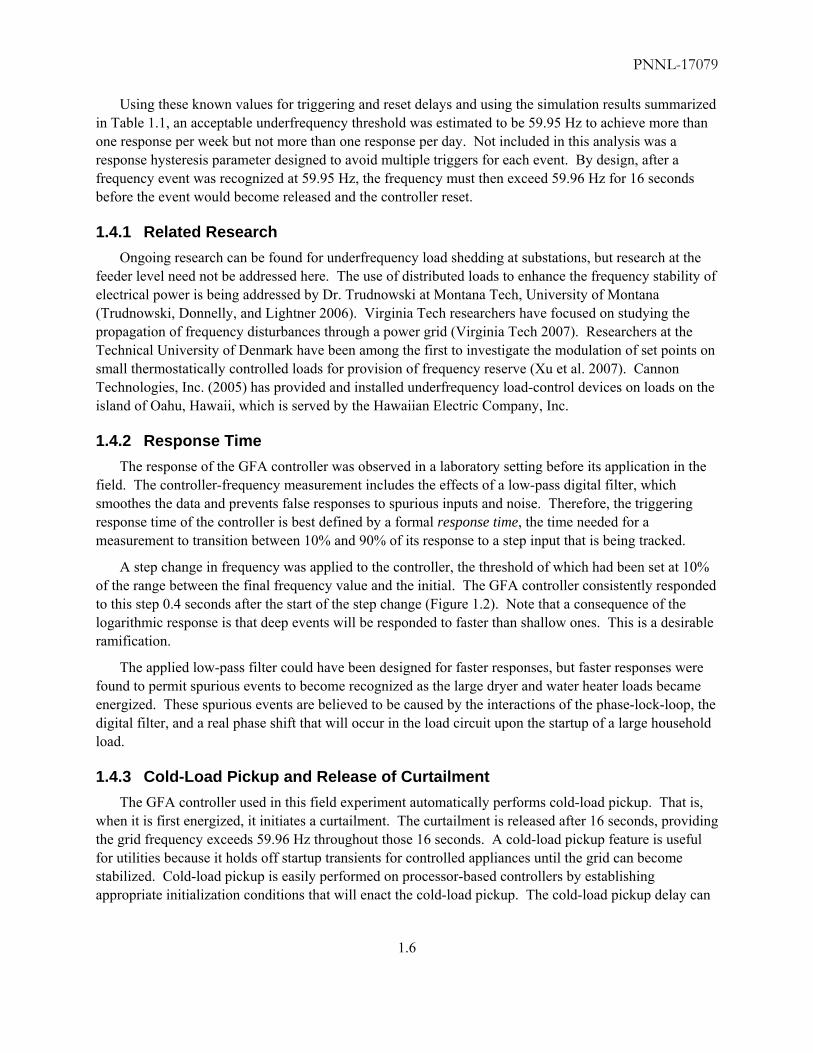
A step change in frequency was applied to the controller, the threshold of which had been set at 10% of the range between the final frequency value and the initial. The GFA controller consistently responded to this step 0.4 seconds after the start of the step change (Figure 1.2). Note that a consequence of the logarithmic response is that deep events will be responded to faster than shallow ones. This is a desirable ramification.
The applied low-pass filter could have been designed for faster responses, but faster responses were found to permit spurious events to become recognized as the large dryer and water heater loads became energized. These spurious events are believed to be caused by the interactions of the phase-lock-loop, the digital filter, and a real phase shift that will occur in the load circuit upon the startup of a large household load.
1.4.3 Cold-Load Pickup and Release of Curtailment The GFA controller used in this field experiment automatically performs cold-load pickup. That is,
when it is first energized, it initiates a curtailment. The curtailment is released after 16 seconds, providing the grid frequency exceeds 59.96 Hz throughout those 16 seconds. A cold-load pickup feature is useful for utilities because it holds off startup transients for controlled appliances until the grid can become stabilized. Cold-load pickup is easily performed on processor-based controllers by establishing appropriate initialization conditions that will enact the cold-load pickup. The cold-load pickup delay can

PNNL-17079
1.7
be assigned identically to those of the underfrequency delay. The permissible delay would be short for many appliances, longer for others.
Figure 1.2. Response Time of the GFA Controller
1.5 GFA Controller Hardware The GFA controller used in the field project is a 5-cm × 7.5-cm (2-in. × 3-in.) digital electronic
controller board. The digital intelligence is based on an Altera field programmable gate array (FPGA) (Figure 1.3).
Inputs to the controller board include 5 V dc, which is used to power the board, and a 24-V ac voltage-sensing input from a voltage transformer that is used to sense grid frequency of the appliance’s 120- or 240-Vac electric service. The exact ac voltage magnitude applied to the 24-Vac input is not critical. The ac signal is conditioned by a series of comparators that convert the ac sinusoid into a square-wave signal having fast rise and fall times. The period of the resulting 60-Hz square wave is measured using the pulse count from a 7.2-MHz crystal oscillator reference. The details of the calculation will be more fully described in the firmware section that follows this section.
Outputs of the controller board consist of several digital outputs, the characteristics and meanings of which can be assigned by firmware. Only the “relay control” signal was passed along to the controlled appliance. This signal was pulled to its low logic state while a curtailment response was being requested
0%
10%
20%
30%
40%
50%
60%
70%
80%
90%
100%
110%
400 ms
Input Response
Freq
uenc
y St
ep a
nd R
espo
nse
(%)
Time

PNNL-17079
1.8
from the controlled appliance. Remaining output pins were assigned to facilitate testing and troubleshooting, but these additional signals were not used for appliance control.
Figure 1.3. GFA Controller Board used in the Grid Friendly Appliance Project
The output of the GFA controller is simply a binary signal. Appliance load current did not flow through any part of the controller board. The binary output signals were used to control the relay switches in the control modules for water-heater loads. For the dryers, optically isolated versions of the controllers’ output signals were sent to Whirlpool’s communication processors, where they were then translated into Whirlpool’s proprietary serial protocol and sent to and understood by the dryers’ microcontrollers.
1.6 GFA Controller Firmware The firmware operation of the GFA controller was designed and implemented on the equivalent of an
Altera EPM7128BTC100-10 FPGA. A hardware gate design approach was used to achieve an efficient implementation using the limited number of FPGA macrocells. The block diagram of the FPGA firmware is shown in Figure 1.4.
PNNL-17079
1.9
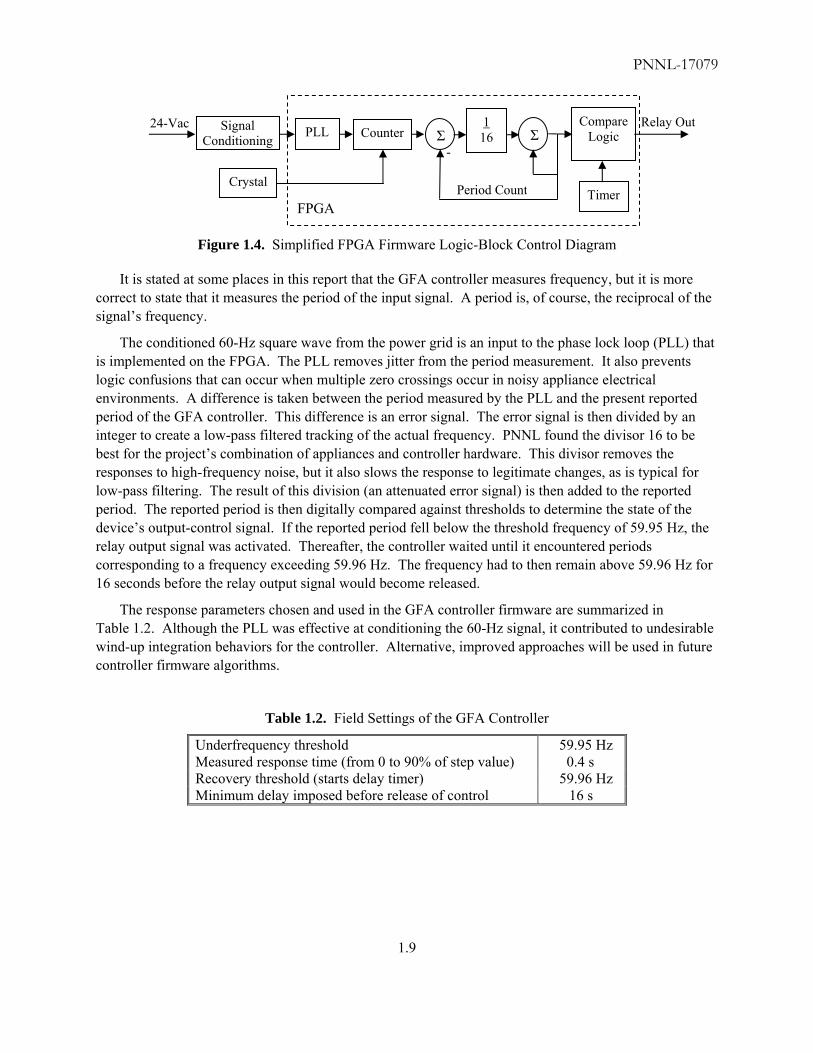
Figure 1.4. Simplified FPGA Firmware Logic-Block Control Diagram
It is stated at some places in this report that the GFA controller measures frequency, but it is more correct to state that it measures the period of the input signal. A period is, of course, the reciprocal of the signal’s frequency.
The conditioned 60-Hz square wave from the power grid is an input to the phase lock loop (PLL) that is implemented on the FPGA. The PLL removes jitter from the period measurement. It also prevents logic confusions that can occur when multiple zero crossings occur in noisy appliance electrical environments. A difference is taken between the period measured by the PLL and the present reported period of the GFA controller. This difference is an error signal. The error signal is then divided by an integer to create a low-pass filtered tracking of the actual frequency. PNNL found the divisor 16 to be best for the project’s combination of appliances and controller hardware. This divisor removes the responses to high-frequency noise, but it also slows the response to legitimate changes, as is typical for low-pass filtering. The result of this division (an attenuated error signal) is then added to the reported period. The reported period is then digitally compared against thresholds to determine the state of the device’s output-control signal. If the reported period fell below the threshold frequency of 59.95 Hz, the relay output signal was activated. Thereafter, the controller waited until it encountered periods corresponding to a frequency exceeding 59.96 Hz. The frequency had to then remain above 59.96 Hz for 16 seconds before the relay output signal would become released.
The response parameters chosen and used in the GFA controller firmware are summarized in Table 1.2. Although the PLL was effective at conditioning the 60-Hz signal, it contributed to undesirable wind-up integration behaviors for the controller. Alternative, improved approaches will be used in future controller firmware algorithms.
Table 1.2. Field Settings of the GFA Controller
Underfrequency threshold 59.95 Hz Measured response time (from 0 to 90% of step value) 0.4 s Recovery threshold (starts delay timer) 59.96 Hz Minimum delay imposed before release of control 16 s
PLL Σ1
16 Compare
Logic
Timer
Signal Conditioning ΣCounter
Period Count
24-Vac Relay Out
FPGA
Crystal
-

PNNL-17079
1.10
1.7 Controller and Implementation Costs The purpose of this section is to discuss the hardware and installation costs incurred in applying the
GFAs used in the field demonstration. The challenges of accurately stating implementation costs are as follows:
• The field demonstration was small in scale and proved none of the benefits anticipated for large-scale implementation.
• The degree of integration of the controller into the appliances was also low. The resulting costs, therefore, exceed what should be expected for full integration of the controller into appliances by appliance manufacturers in their factories where labor and manufacturing efficiencies can eventually be realized.
• The experimental design mandated that monitoring and control were included, but ultimate cost effectiveness of the implementation might not bear the additional costs of communication.
• The form of the GFA controller itself has not yet been reduced to an application-specific integrated circuit (ASIC) where its final cost effectiveness can be proven.
The cost of the GFA controller board used in this project was approximately 44 U.S. dollars. This cost is based on the delivery price at which a commercial board manufacturer purchased components for and populated 300 controller boards for this project. This estimate does not include initial engineering costs for the board, which was replicated from PNNL designs. The estimate does, however, include the non-recurring engineering charges incurred for setting up automated pick-and-place board population and other purchasing, manufacturing, and testing charges to the project by the commercial board manufacturer. The additional costs borne by the project for each appliance included approximately $290 for both a modified load control box, which monitored the performance of the controller, and for a home gateway that relayed the information back via a broadband internet connection.
Both the dryer and water heater also incurred installation charges from skilled electricians for installing monitoring equipment in the homes. The costs of these installations were approximately $110 for the water heaters and dryers and another $40 for installing communications equipment.
For both appliances, the load-control monitoring boxes were required by code to be directly spliced into the 220-V ac circuit. Each installation, therefore, also incurred Washington state electrical inspection fees. The initial fee per installation was $50. Fortunately, this fee was later reduced to $10 thanks to actions taken by the Bonneville Power Administration (BPA) as it was able to negotiate a preferred bulk inspection fee applicable to both this and another BPA project.
Broadband connectivity was provided by various cable and Internet providers at the expense of the appliance owners, but the project paid a small fee of approximately $1 per month for each home to maintain a back-end server for all the monitoring services.
Research labor is not included in these estimates. Also not stated are labor costs for removing equipment at the end of the project. One can see that many of these incurred costs are directly attributable to the research nature of the project. Others may have been incurred by communication equipment, which may be desirable, but not essential, to the function of the GFA controller. Ultimately, PNNL’s goal is to

PNNL-17079
1.11
have the GFA controller installed by an appliance manufacturer at an incremental cost under $2, ready to provide grid supportive services at the time it is plugged in by its new owner.

PNNL-17079
1.12

PNNL-17079
2.1
2.0 Appliance Integration Process for the Grid Friendly Controller
This section describes the methods used to integrate the GFA controller with clothes-dryer and water-heater appliances for this field demonstration. This section also describes the methods used to monitor the performances of both the controller itself and the controlled appliances.
The long-term objective for GFA controllers has been to achieve close integration of the controller with appliances. Ideally, appliances would incorporate grid-responsive controllers at the time of the appliances’ manufacture. In practice, only a small degree of integration could be practiced and demonstrated. These are contributing factors:
• Appliance manufacturers are unwilling to significantly modify production lines for the needs of the small number of appliances used in pilot-scale demonstrations. Even minor modifications of manufacturing lines require major planning and investments.
• Participating utilities had a limited tolerance for experimental, non-commercial-grade equipment as a result of their potential liabilities.
• PNNL also wished to limit liabilities that might be incurred by placing experimental equipment permanently in residences. Ultimately, a decision was made to remove all non-commercial-grade and test equipment from homes at the conclusion of the experiment.
• Safety certifications were more readily obtained for modifying an existing piece of equipment—the load-control modules of the chosen energy-management system. This approach allowed state inspectors to review a single, fully packaged solution for their approval processes.
2.1 General Grid Friendly Controller Integration PNNL selected and solicited five vendors of energy-management systems to request equipment that
would house the GFA controller and would monitor both the controller and its controlled appliance. The responsive device was to recognize and report events no less frequently than daily concerning any controller or appliance event that was at least 15 seconds in duration. An appliance event was defined as a change in load of at least 1200 Watts. Time-stamped data logs were requested from the vendors to track events and verify controller performance for the project. Three vendors submitted complete responses to the solicitation. The winner, Invensys Controls, met the solicitation requirement at the lowest price.
The components of the Invensys Controls GoodWatts™ system (Figure 2.1) used for the Grid Friendly Appliance Project included:
• Load control modules—The load-control module monitored the GFA controller and water heater or dryer load.
• Home gateway—The home gateway wirelessly communicated with the load-control modules and relayed the information to the back-end server via the appliance owner’s broadband cable modem or digital subscriber line (DSL) connection.
• Back-end server—The back-end server received periodic data from each home’s gateway and stored and organized the data for the project.

PNNL-17079
2.2
Figure 2.1. Invensys GoodWatts System (Courtesy of Invensys Controls)
During design, Invensys Controls and the project elected to also include a second box that would be attached to the load-control module to house the GFA controller. This modification was suggested and accepted because doing so hastened the design and approval processes.
It was observed early in the project but after the initial equipment installations that the premise radio communications at times failed to fully link radio-system components in some homes. This was especially true when unusual building materials or long distances were encountered within homes. Regardless of the reason, GoodWatts communications thermostats were sometimes used as radio-communication relays within homes to link the load-control modules and home gateways. This need and limitation had not been anticipated.
The chosen energy-management system’s home gateway was also found to not communicate with some of the broadband communications available at responding homes. The existing system worked well where cable modems existed, but an additional virtual private network (VPN) router box was necessary where homes had DSL Internet connectivity. The router box supplied by Invensys Controls looked identical to their home gateway except for its nameplate. This also had not been anticipated.

PNNL-17079
2.3
2.1.1 Load-Control-Module Description The load-control module of the Invensys’s GoodWatts system had been designed to control water
heaters and pool pumps to facilitate occupancy scheduling and traditional time-of-use demand response. Each load-control module has a 240-V ac switch, and each load-control module can wirelessly exchange information with its home gateway. The project had requested some modifications be made to the load-control module to suit project requirements.
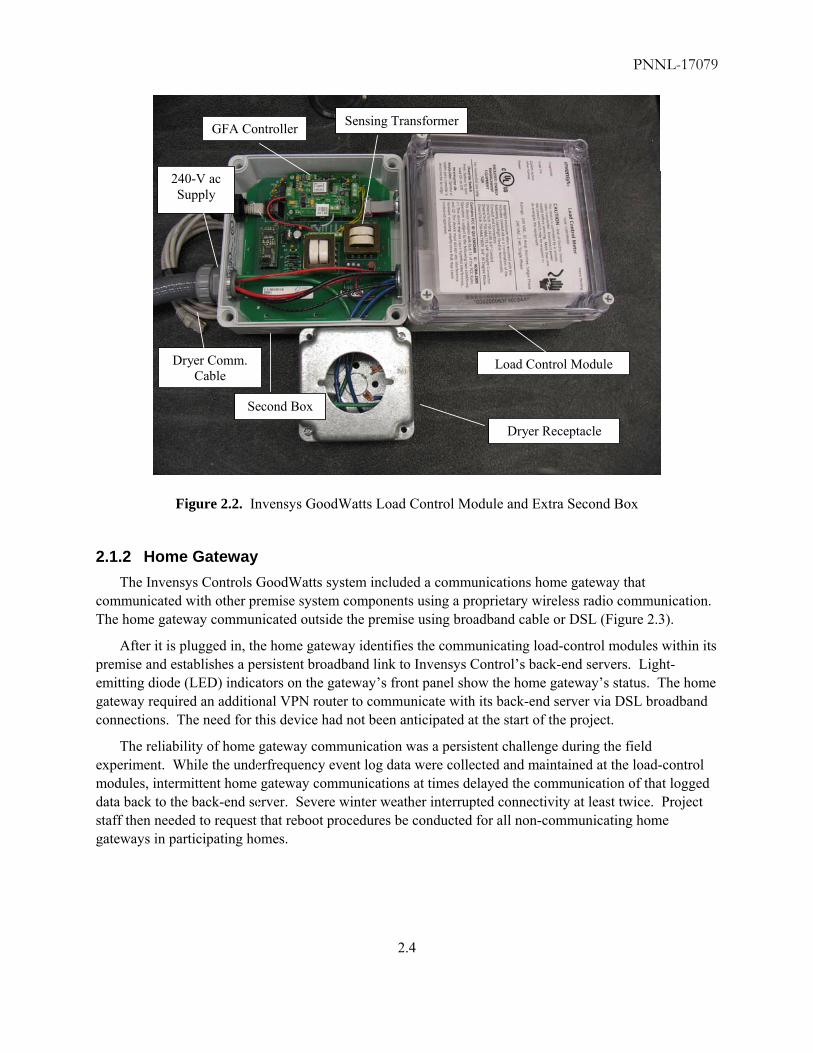
Invensys and project staff elected to attach a second box adjacent to the load-control module to accommodate project functions because doing so hastened the design and approval processes. Figure 2.2 shows the load-control module and attached second box that housed the controller. The second box also housed one of Whirlpool Corporation’s processors that interpreted their proprietary serial communication protocol for the project dryer.
The project required that the load-control module collect time-stamped event data whenever the state of the GFA controller’s output changed. In the case of the water heater, the load-control module opened the 240-V ac circuit immediately whenever an underfrequency event was recognized by the controller. For the dryer, the load-control module was only to pass the GFA controller signal onward to the dryer, but it was never to open the circuit. The GFA controller was powered from the load-control module’s existing 5-V ac power supply.
An additional 24-V ac transformer was provided in the extra second box to provide the ac signal, which was monitored by the controller for its frequency signal. It may be acceptable for the frequency sensor to share a transformer with its power supply, but PNNL chose not to do so to avoid possibly confounding noise problems that can occur on the loaded secondary of a power-supply transformer.
The load-control module was also to monitor and report any time its appliance significantly changed its load. As noted above, “significant” changes were defined as changes of approximately 1200 W or more. The accuracy of these measurements was not critical, but the measurements should have clearly indicated the appliances’ operational state. Each such event was to be time stamped to the nearest second, and every event 15 seconds or more in duration was to be logged. Therefore, important information about each load’s usage was logged, regardless of whether the changes in operation were attributable to underfrequency events. The event log captured by the load-control module was periodically relayed to the home gateway via wireless by radio communication.
Safety was always a priority while designing and installing project equipment. Invensys Controls sought and received Underwriter Laboratory certification for their modified load-control module and second box. They also submitted the modified load-control module for rigorous testing by a Whirlpool Corporation approvals process that was perhaps more restrictive than the national certification process.
The State of Washington initially demanded that a $50 inspection fee be paid for each dryer and water heater installation because each installation required modifying an existing 240-V ac home circuit. After negotiations led on the project’s behalf by the Bonneville Power Administration, Washington State eventually agreed to bulk permitting of the project installations for $10 each, a great cost savings for the project.
PNNL-17079
2.4
Dryer Receptacle
GFA Controller Sensing Transformer
Load Control Module
Second Box
240-V ac Supply
Dryer Comm. Cable
Figure 2.2. Invensys GoodWatts Load Control Module and Extra Second Box
2.1.2 Home Gateway The Invensys Controls GoodWatts system included a communications home gateway that
communicated with other premise system components using a proprietary wireless radio communication. The home gateway communicated outside the premise using broadband cable or DSL (Figure 2.3).
After it is plugged in, the home gateway identifies the communicating load-control modules within its premise and establishes a persistent broadband link to Invensys Control’s back-end servers. Light-emitting diode (LED) indicators on the gateway’s front panel show the home gateway’s status. The home gateway required an additional VPN router to communicate with its back-end server via DSL broadband connections. The need for this device had not been anticipated at the start of the project.
The reliability of home gateway communication was a persistent challenge during the field experiment. While the underfrequency event log data were collected and maintained at the load-control modules, intermittent home gateway communications at times delayed the communication of that logged data back to the back-end server. Severe winter weather interrupted connectivity at least twice. Project staff then needed to request that reboot procedures be conducted for all non-communicating home gateways in participating homes.

PNNL-17079
2.5
Figure 2.3. Invensys Controls GoodWatts Home Gateway
Wireless communication distance and material obstructions also affected data collection within homes. Where wireless communication quality was insufficient, the vendor supplied and positioned wireless communication relays between load-control modules and the home gateway until adequate communication quality could be achieved.
2.1.3 Local Monitoring Provided by the Load-Control Module The water heaters turned on and off according to the needs of their thermostatically controlled loads.
The dryer heating elements also cycled on and off frequently during each laundry load. The load-control modules calculated power consumption just before and just after such load changes.
Unfortunately, these measurements and calculations occurred during transients and were sometimes difficult to interpret as either ongoing or off-going appliance events without intelligent human intervention and interpretation. The project was, therefore, unable to find an efficient means to determine exactly how much aggregate load was curtailed by each underfrequency event. Furthermore, data from early in the experiment failed to reliably pair off-going events with every ongoing event, making it appear that some appliances remained on indefinitely. The data, especially early in the field demonstration, were therefore useful only for anecdotal observations of individual appliance, not aggregated, events. A series of gateway firmware updates progressively improved data quality, but never fully rectified these stated limitations.
The project relied instead on a statistical argument based on each appliance type’s daily load shape, as was measured in 15-minute intervals for appliances by the GoodWatts system, to evaluate the GFA controllers for their statistical likelihood of shedding water heater and clothes dryer loads.
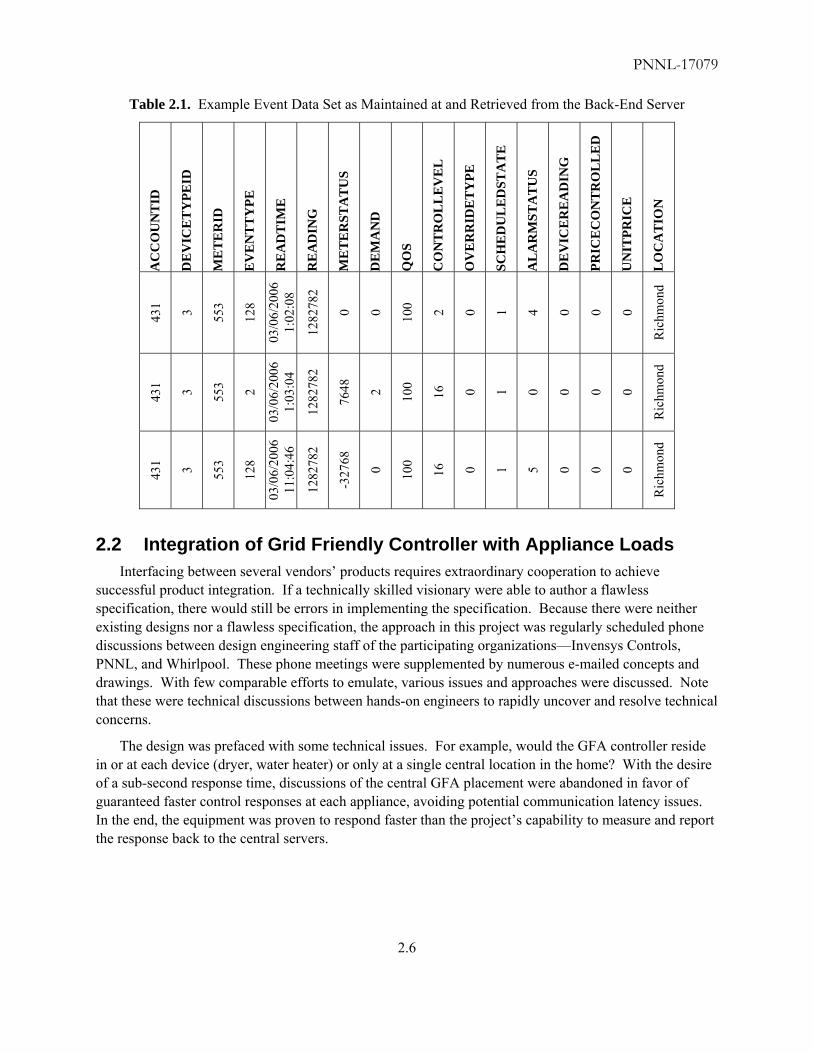
2.1.4 Remote Communications Provided by the Energy Management System The event data were maintained at the back-end servers of Invensys Controls and were made
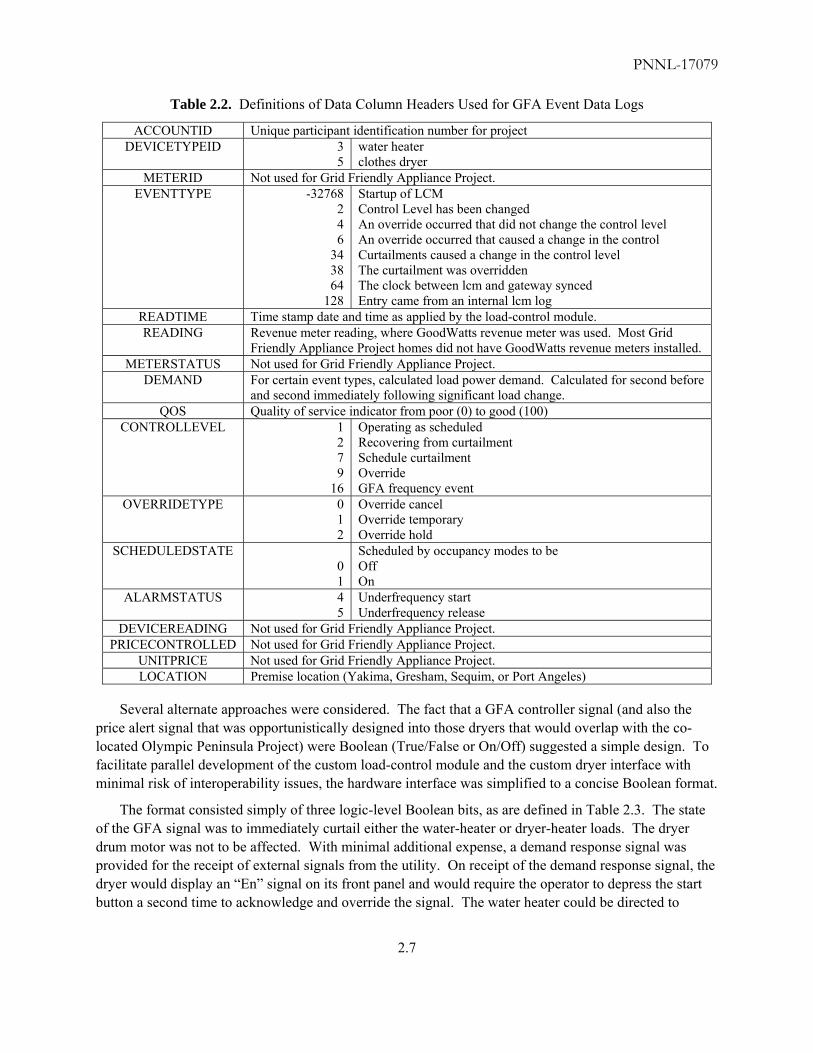
available to PNNL in a series of daily logs. Eventually, the process of retrieving the daily logs from Invensys to mirrored databanks at PNNL was automated. An example series of event data entries is shown in Table 2.1. The definitions of column headings are given in Table 2.2.
PNNL-17079
2.6
Table 2.1. Example Event Data Set as Maintained at and Retrieved from the Back-End Server
AC
CO
UN
TID
DE
VIC
ET
YPE
ID
ME
TE
RID
EV
EN
TT
YPE
RE
AD
TIM
E
RE
AD
ING
ME
TE
RST
AT
US
DE
MA
ND
QO
S
CO
NT
RO
LL
EV
EL
OV
ER
RID
ET
YPE
SCH
ED
UL
ED
STA
TE
AL
AR
MST
AT
US
DE
VIC
ER
EA
DIN
G
PRIC
EC
ON
TR
OL
LE
D
UN
ITPR
ICE
LO
CA
TIO
N
431 3 553
128
03/0
6/20
06
1:02
:08
1282
782
0 0 100 2 0 1 4 0 0 0
Ric
hmon
d
431 3 553 2
03/0
6/20
06
1:03
:04
1282
782
7648
2 100
16
0 1 0 0 0 0
Ric
hmon
d
431 3 553
128
03/0
6/20
06
11:0
4:46
1282
782
-327
68
0 100
16
0 1 5 0 0 0
Ric
hmon
d
2.2 Integration of Grid Friendly Controller with Appliance Loads Interfacing between several vendors’ products requires extraordinary cooperation to achieve
successful product integration. If a technically skilled visionary were able to author a flawless specification, there would still be errors in implementing the specification. Because there were neither existing designs nor a flawless specification, the approach in this project was regularly scheduled phone discussions between design engineering staff of the participating organizations—Invensys Controls, PNNL, and Whirlpool. These phone meetings were supplemented by numerous e-mailed concepts and drawings. With few comparable efforts to emulate, various issues and approaches were discussed. Note that these were technical discussions between hands-on engineers to rapidly uncover and resolve technical concerns.
The design was prefaced with some technical issues. For example, would the GFA controller reside in or at each device (dryer, water heater) or only at a single central location in the home? With the desire of a sub-second response time, discussions of the central GFA placement were abandoned in favor of guaranteed faster control responses at each appliance, avoiding potential communication latency issues. In the end, the equipment was proven to respond faster than the project’s capability to measure and report the response back to the central servers.
PNNL-17079
2.7
Table 2.2. Definitions of Data Column Headers Used for GFA Event Data Logs
ACCOUNTID Unique participant identification number for project DEVICETYPEID 3
5 water heater clothes dryer
METERID Not used for Grid Friendly Appliance Project. EVENTTYPE -32768
2 4 6
34 38 64
128
Startup of LCM Control Level has been changed An override occurred that did not change the control level An override occurred that caused a change in the control Curtailments caused a change in the control level The curtailment was overridden The clock between lcm and gateway synced Entry came from an internal lcm log
READTIME Time stamp date and time as applied by the load-control module. READING Revenue meter reading, where GoodWatts revenue meter was used. Most Grid
Friendly Appliance Project homes did not have GoodWatts revenue meters installed. METERSTATUS Not used for Grid Friendly Appliance Project.
DEMAND For certain event types, calculated load power demand. Calculated for second before and second immediately following significant load change.
QOS Quality of service indicator from poor (0) to good (100) CONTROLLEVEL 1
2 7 9
16
Operating as scheduled Recovering from curtailment Schedule curtailment Override GFA frequency event
OVERRIDETYPE 0 1 2
Override cancel Override temporary Override hold
SCHEDULEDSTATE 0 1
Scheduled by occupancy modes to be Off On
ALARMSTATUS 4 5
Underfrequency start Underfrequency release
DEVICEREADING Not used for Grid Friendly Appliance Project. PRICECONTROLLED Not used for Grid Friendly Appliance Project.
UNITPRICE Not used for Grid Friendly Appliance Project. LOCATION Premise location (Yakima, Gresham, Sequim, or Port Angeles)
Several alternate approaches were considered. The fact that a GFA controller signal (and also the price alert signal that was opportunistically designed into those dryers that would overlap with the co-located Olympic Peninsula Project) were Boolean (True/False or On/Off) suggested a simple design. To facilitate parallel development of the custom load-control module and the custom dryer interface with minimal risk of interoperability issues, the hardware interface was simplified to a concise Boolean format.
The format consisted simply of three logic-level Boolean bits, as are defined in Table 2.3. The state of the GFA signal was to immediately curtail either the water-heater or dryer-heater loads. The dryer drum motor was not to be affected. With minimal additional expense, a demand response signal was provided for the receipt of external signals from the utility. On receipt of the demand response signal, the dryer would display an “En” signal on its front panel and would require the operator to depress the start button a second time to acknowledge and override the signal. The water heater could be directed to

PNNL-17079
2.8
curtail for demand-response signals via other means provided through the load-control module—an existing feature of the Invensys Controls system. The price signal was to elicit a similar response from the appliances, except the dryer would display “Pr” in response to the price signal.
Table 2.3. Designed GFA Signals and Corresponding Appliance Responses.
bit name water heater response dryer response
GFA Underfrequency shed: 0 – Curtail entire load 1– Release load
0 - Immediately turn off heating elements for up to 10 minutes. Drum motor is not affected.
1 – Release heating element load
Pr High price response: 0– No action 1– No action
0 – Display “Pr” on panel front. User must push start twice to override.
1 – No action
En Demand response: 0 – No action (existing GoodWatts LCM response possible) 1 – No action
0 - Display “En” on panel front. Must push start twice to override. 1 – No action
2.2.1 Water-Heater Control Integration Local electricians were contracted by the project to insert the modified load-control modules into the
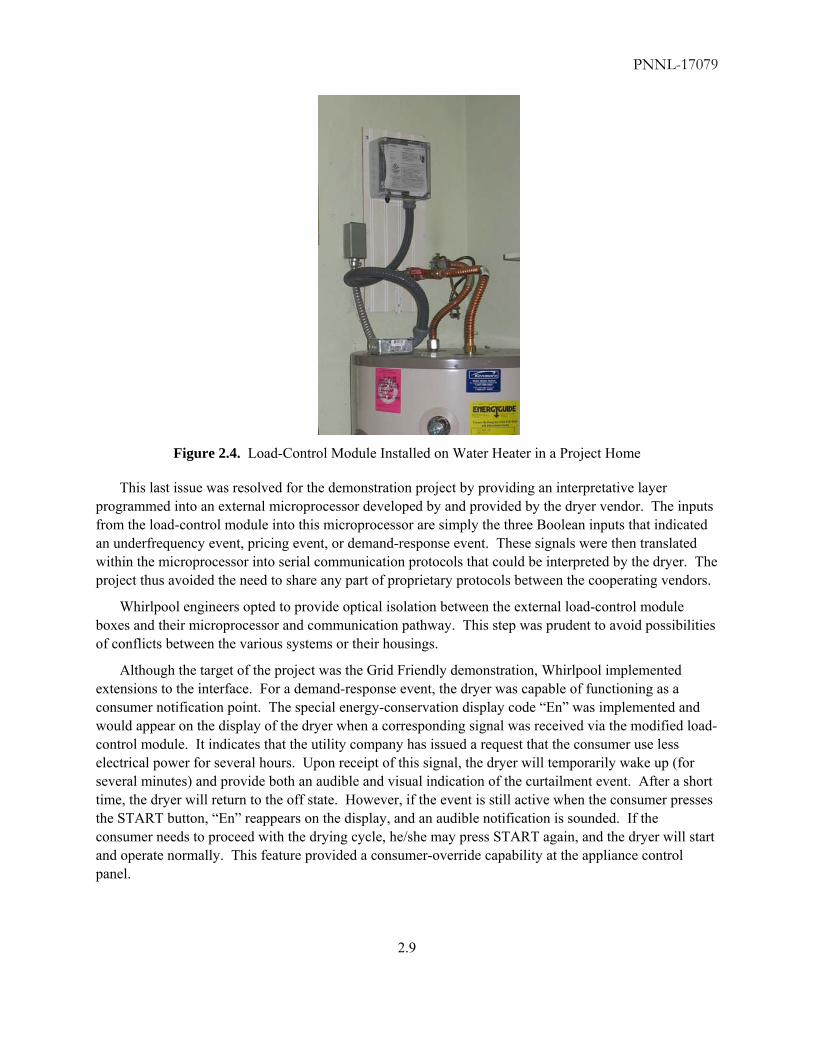
240-V ac circuits between each home’s electrical service and water-heater appliance. Except for the presence of the extra second box, installing the water-heater load-control module was identical to the installation that would have been performed otherwise for the commercial load-control module. No unique electrical installation challenges were anticipated or found (Figure 2.4).
Installers were to apply labels to the load-control modules at the time of their installation. These labels advised appliance owners to phone the project phone numbers if they had questions or concerns about the performance of their modified water heaters.
2.2.2 Integration of the GFA Controller with the Clothes Dryer As has been stated, the modified load-control module with a Grid Friendly response had to
communicate with the existing serial communication protocol of the Whirlpool dryer. Selecting a simple Boolean interface resolved some issues, but other issues persisted unique to the dryer:
• Testing and debugging an interface reliant upon a proprietary data payload can be difficult and time consuming. This was especially true because the design center for the dryer and the communication hardware were located in different regions of the country.
• The dryer vendor was hesitant to disclose enough protocol and security information to allow including their interface into a load control module (LCM) provided by another vendor. Obtaining permission within Whirlpool to share this information would have taken a prohibitively long time.
PNNL-17079
2.9
Figure 2.4. Load-Control Module Installed on Water Heater in a Project Home
This last issue was resolved for the demonstration project by providing an interpretative layer programmed into an external microprocessor developed by and provided by the dryer vendor. The inputs from the load-control module into this microprocessor are simply the three Boolean inputs that indicated an underfrequency event, pricing event, or demand-response event. These signals were then translated within the microprocessor into serial communication protocols that could be interpreted by the dryer. The project thus avoided the need to share any part of proprietary protocols between the cooperating vendors.
Whirlpool engineers opted to provide optical isolation between the external load-control module boxes and their microprocessor and communication pathway. This step was prudent to avoid possibilities of conflicts between the various systems or their housings.
Although the target of the project was the Grid Friendly demonstration, Whirlpool implemented extensions to the interface. For a demand-response event, the dryer was capable of functioning as a consumer notification point. The special energy-conservation display code “En” was implemented and would appear on the display of the dryer when a corresponding signal was received via the modified load-control module. It indicates that the utility company has issued a request that the consumer use less electrical power for several hours. Upon receipt of this signal, the dryer will temporarily wake up (for several minutes) and provide both an audible and visual indication of the curtailment event. After a short time, the dryer will return to the off state. However, if the event is still active when the consumer presses the START button, “En” reappears on the display, and an audible notification is sounded. If the consumer needs to proceed with the drying cycle, he/she may press START again, and the dryer will start and operate normally. This feature provided a consumer-override capability at the appliance control panel.

PNNL-17079
2.10
The concise interface definition simplified testing and debugging as intended. The project team was able to use a very simple test to determine if a signal arrived at the dryer. The custom Whirlpool microprocessor chip in the load-control module then converted the concise signal to the appropriate proprietary serial signal for the dryer. The project collaborators submit that this simple interface model could successfully accommodate both advanced microprocessor-controlled devices and simpler analogue and electromechanical devices.
In retrospect, the project should have implanted a verification of connectivity. With the demonstrated configuration, it was difficult to determine if, for example, the interface cable between the load-control module and dryer had been disconnected from the dryer. It would have been very helpful to have had a return “handshake” signal to verify that end-to-end communications were intact. This could also have been done in a concise manner, although it was not designed into the demonstrated system.
Disadvantages of the selected concise design were also identified. The simple Boolean interface limits future expansion in the type of energy signals that can be transmitted and received. A more complex serial interface could always add messages in the protocols transmitted. This luxury is not possible with limited binary messages. Perhaps the vision for the future should be to move ahead with an interface specification that includes both the concise interface as well as accommodations for a more advanced interface to enable future expansion. It must be realized that the appliance manufacturer might envision other uses for an external interface and will not want their interface port captured exclusively for the purpose of energy management.
This was the first time (to our knowledge) that a research modification for a product manufacturing line has been accommodated in an existing product line for the purposes of conducting energy appliance research. The 150 dryers modified by the project took less than 1 hour to manufacture on the existing Whirlpool production lines. The planning for this short run of appliances took months.
2.3 Observed Load Effects on Frequency Measurement The GFA controller was first implemented with a faster response time near 200 ms. Upon appliance
testing, it was observed that introducing the large appliance loads could trigger false underfrequency events for the integrated GFA controllers. This result was likely caused by 1) a real shift in the relative phase caused by drawing power over long premise distribution lines and 2) the PLL filter that was designed into the controller. The PLL is an effective integrator that can cause windup error and overshoot of the frequency that was to be tracked.
An adequate engineering solution was found by doubling the response time of the controller without otherwise changing the design. The response remained fast, but most false triggers could be avoided with this solution. The PLL will not be used as a filter component in later controller solutions because of this windup behavior.

PNNL-17079
3.1
3.0 Recruitment Activities and Project Interactions with Appliance Owners
This chapter describes the project’s interactions with appliance owners in three main areas—recruitment, routine interactions during the project, and project decommissioning activities.
3.1 Recruitment Activities The project identified, qualified, contracted, and supplied the experimental project equipment to
residential participants. With the help of collaborating utilities, the project recruited homeowners who would agree to house and operate project appliances for the project.
3.1.1 Recruitment of Potential Participants Three target populations in Washington and Oregon were made available to recruit residential
participants by four collaborating project utilities:
1. PacifiCorp recruited for the placement of 50 dryers and 25 water heaters in Yakima, Washington.
2. Portland General Electric (PGE) supported 50 research sites for the placement of 50 dryers in Gresham, Oregon.
3. PUD #1 of Clallam County and Port Angeles together recruited sites for the placement of 50 dyers and 25 water heaters in and near Sequim and Port Angeles, Washington.
These regions recruited accordingly. Applicants were required to own their residences and have high-speed, broadband Internet access.
Participants were offered a new Sears Kenmore HE2 dryer, manufactured by Whirlpool Corporation, as their principal participation incentive. Project staff had anticipated that this significant incentive would cause the project to become overwhelmed by applicants, but that was not the case. The stringent list of additional participation criteria greatly reduced the number of eligible homes available to the project. Staff had to conduct creative recruitment activities and contacted increasingly more potential participants to finally identify and sign up between 150 and 200 applicants to participate in the Grid Friendly Appliance Project.
The following are examples of some of the special recruitment activities:
• January 2006, in Port Angeles and Sequim, PNNL staff led two town hall meetings to inform and recruit participants, answer questions, and assist applicants with completing their applications.
• During January 2006, a radio advertisement was purchased and aired in Sequim and Port Angeles. The text for the advertisement read
Pacific Northwest National Laboratory, in cooperation with Clallam County PUD and the City of Port Angeles, need your help testing smart energy technologies. As demand for electricity goes up, progressive utilities are looking for ways to avoid building additional transmission lines while keeping your rates low. You can actually earn money, and maybe even a new dryer, by testing technologies to control how and when you use electricity. There will be two Town Meetings on Thursday,

PNNL-17079
3.2
January 26, where you can learn more about this innovative program and how you can earn money for volunteering. The meetings will be at 1 in the afternoon and 6:30 in the evening on Thursday, at the Vern Burton Meeting Room, 321 5th Street, Port Angeles. If you own your home, have high-speed Internet and electric water and heat, you may qualify. To sign up for the program today, call 1-866-528-1882 or apply online at www.gridwise.pnl.gov/testbed.
• A particularly enthusiastic recruit in Sequim single-handedly recruited at least five additional participants by phone calls and by demonstrating his installed project equipment to others in his home.
• Newspaper advertisements were run during January 2006 on the Olympic Peninsula. One example read
Power to the People! Come learn how you can earn money by testing smart energy technologies in your home; Pacific Northwest GridWise™ Demonstration Project; Town Meetings; Thursday, January 26, 2006 1:00 and 6:30 p.m.; Vern Burton Meeting Room, 321 5th Street, Port Angeles. Find out how you can be part of this program if you: * own your home * have electric hot water and heat * have high speed Internet (cable modem, fiber optic or DSL, not dial-up); www.gridwise.pnl.gov/testbed; 1-866-528-1882; This project is funded by the U.S. Department of Energy and is being conducted by Pacific Northwest National Laboratory in collaboration with Clallam County PUD and the City of Port Angeles.”
• Rob Pratt and Don Hammerstrom, both of PNNL, and Bronna Hankoff, Clallam County PUD, were interviewed on November 1, 2005, by KNOP radio talk show from Port Angeles, Washington. This exposure generated several more sign-ups on the project’s GridWise Testbed Web site.
• PacifiCorp provided its own recruiter, who at one point canvassed neighborhoods of Yakima, Washington, door-to-door to invite project participation.
3.1.2 Qualification of Participants A tiered approach was used to qualify applicants for project participation. First, the project targeted
recruitment where it would likely be successful in finding qualified applicants. The recruitment advertisements themselves listed many of the most important qualifications. Applicants were then directed to an automated Web site, where the applicants’ qualifications were further tested. The action of accessing the Web site itself was part of the selection test because applicants were required to have (broadband) connectivity. The project preferred applicants who were Internet savvy and able to participate in a final survey by Internet. Finally, all remaining applicants were further interviewed by telephone to confirm that they were indeed qualified to participate.
The main recruitment qualifications consisted of
• having high-speed Internet service, either cable or DSL
• ownership of the home occupied by the applicant
• having electric water heater and dryer services, not gas, to the home.

PNNL-17079
3.3
Several calls were received from potential applicants during recruitment asking whether “high-speed” dial up service would qualify for the program. High-speed Internet consisted of a home having access to either cable or DSL service. One participant having satellite Internet service was disqualified after having program equipment installed because the satellite signal in this particular application was not strong enough to communicate with the project’s Invensys equipment.
An example logic flow diagram (Figure A.1), according to which the automated Web site qualification processes were designed, may be found in Appendix A. Care must be used to accurately assess whether respondents are truly eligible to participate. Even after automated qualification had been conducted, the follow-up interviews revealed misunderstandings. Some applicants perhaps answered the questions to intentionally avoid disqualification and receive project incentives. Others were unable to answer basic questions about their appliances and their Internet connections. For example, those applicants who did not know whether they had electric or gas water heaters required further interview by the project.
3.1.3 Initial Project Survey Participants were provided by mail and were asked to complete and return an initial project survey
before their further project participation. The purpose of this survey was to assess characteristics of the participant population and detect biases that might influence the project’s findings. The text of this survey has been included in the appendix of this report (Table A.3).
The same survey was sent to all participants. Questions that could affect the Grid Friendly Appliance Project perhaps fall into these several categories:
• home quality and age
• appliance owner’s present likelihood to perform certain energy practices within the home
• appliance owner’s laundry practices
• appliance owner’s hot water consumption practices
• home’s occupancy.
The survey results suggest that participants were a roughly even mix of males and females who were typically late, middle-aged. Most participants owned a single water heater that they kept between 120 and 140oF. They used their dryers about 4 to 6 times per week and claimed to do their clothes washing at various times of the day.
3.1.4 Participant Contracts and Initial Education Process Each applicant was required to sign and return to the project a participation contract and access
agreement. The participation contract educated applicants about their and the project’s respective responsibilities and formalized their agreements to participate through the duration of the project. The access agreement addressed the liability faced by the presence of project equipment and contracted project personnel who would access participating homes.
In general, PNNL had greater interest in the participation contract, which confirmed its education of participants pertaining to their rights and responsibilities; the utilities tended to be more interested in the

PNNL-17079
3.4
access agreements, which addressed the liabilities incurred by the presence of equipment and personnel in their customers’ homes.
Participants committed by contract to
• participate for the duration of the experiment
• not modify or remove project equipment
• provide reasonable access to project personnel for the installation, repair, and removal of project equipment
• participate in both opening and closing surveys.
While the project had an obligation to inform participants about the experiment, it tried to do so without greatly influencing their perceptions of the Grid Friendly function that was to be tested. For example, it was stated that some parts of their appliances might momentarily curtail operation, but it was not explicitly stated that the project would do so for the purpose of underfrequency protection. It was also not explicitly stated what changes in appliance performance that appliance owners might observe during such an event. By avoiding these specifics, the project was able to ask and assess at the end of the experiment whether appliance owners had observed project appliance behaviors without improperly influencing their answers to these questions.
The placement of project stickers on project equipment too was an effort to educate the participants and others who might encounter the modified appliances during the project. Stickers advised appliance owners to phone a project phone number if they had further questions.
3.1.5 Equipment Installations Three electrician contractors were hired to make appointments with residential participants and install
modified load-control modules and home gateways in selected homes. Fifty dryers were installed in each of the cities of Gresham, Yakima, and on the Olympic Peninsula. A schematic of the dryer installation is shown in Figure 3.1, and a picture of a dryer installation is shown in Figure 3.2. Because the project was recruiting over 50 participants in the Olympic Peninsula (coincident with recruitment for the Olympic Peninsula Project [Hammerstrom 2007]), the project team decided to distribute the 50 dryers there on a first come, first serve basis to those applicants who met all the required qualifications and submitted their paperwork.
The modified load-control modules were to be installed on the wall behind dryers and water heaters. See Figure 3.1 concerning a schematic for the dryer installation. This installation required that several screw holes be placed in the wall. The project accepted responsibility to fill the screw holes after removing the equipment but accepted no additional responsibility for cosmetic damages.
Dryer installers were contracted by the project through Whirlpool Corporation authorized factory service to install and connect project dryers. This effort required coordination with the project’s contracted electricians, who installed the project’s dryer load-control modules to make sure the dryers had the proper pronged plugs and were functional after the installers’ visits. The Whirlpool appliance installers were also qualified to confirm that the homes’ dryer venting was adequate for the new dryers. These same dryer installers would provide any warrantee service on the dryers during the project.

PNNL-17079
3.5
The project had offered to remove existing dyers from participating homes, but few individuals took advantage of this service, choosing instead either to store their dryers or to donate the dryers to relatives and friends.
Installing project water-heater controllers required only a visit from an electrician to install the water-heater load-control module and home gateway. See Figure 2.4 for a typical water-heater installation. Only one mishap occurred during these installations: A copper pipe was pierced accidentally as a contractor drilled a hole through sheet rock, which resulted in a slow leak and minor water damage in an appliance owner’s garage. This damage was corrected to the owner’s satisfaction by the same contractor. No other reports of significant damage occurred during equipment installations.
The home gateways were positioned near the participants’ personal computers, and communication was established between the home gateways and the homes’ broadband service. During some of the first gateway installations, it was determined that some computer configurations would not automatically allow for plug-and-play operation of the home gateways. The vendor’s product worked seamlessly with cable connectivity, but the systems needed a VPN router on most computers having a DSL type of broadband connectivity. Additional routers were provided, as needed, by the project to achieve the needed broadband connectivity.
Figure 3.1. Dryer Installation Schematic

PNNL-17079
3.6
It was also found early that some wireless communications within homes would not be successful because of long communication distances and intervening materials. In these cases, the equipment vendor positioned additional communicating thermostats from its GoodWatts™ system to act as communication repeaters. Some homes required many such repeaters.
3.2 Routine Appliance-Owner-Project Interactions To some degree, technical challenges diminished after project equipment had been installed in homes,
but the project still had to interact with appliance owners to answer their questions, to keep their equipment functioning, and to handle special or unexpected conditions.
Figure 3.2. Project Sears Kenmore HE2 Dryer and Load Control Module in a Participating Home
3.2.1 Project Call Center Hotline The project established and maintained a toll-free telephone call center “hot line” for residential
participants. This number was advertised and distributed on all project mailings to these participants, and the number was also prominently displayed on stickers affixed to controlled project appliances (Figure 3.3). PNNL call-center personnel were provided PNNL “human subjects” training, designed at PNNL to verify that call-center personnel understood their responsibilities for conducting humane and

PNNL-17079
3.7
legal interactions with residential participants. The call-center answering machine helped direct calls about clothes dryers directly to Whirlpool Corporation call-center personnel who knew about the project. It initially also directed calls about the Invensys Control equipment to an Invensys Control call center, but PNNL adopted this project responsibility in late 2006.
The following questions were most frequently fielded by the PNNL call center:
• How do I cancel an override?
• What is my password?
• How do I reboot my gateway?
PNNL technical staff’s most common request from participants was to reboot the project’s home gateway, VPN router, or modem. These telephone interactions were especially needed after each of two winter outages in Sequim and Port Angeles, Washington.
Figure 3.3. Label Affixed to Project Dryer with Prominent Toll-free Telephone Number
3.2.2 Equipment Problems Encountered Equipment problems encountered during the project, but after initial installations, fell into two
categories: data collection and dryer panel.
Wireless communication quality problems persisted within homes throughout the experiment. Inexplicably, wireless communication would be lost to certain appliances for prolonged periods. In some cases, these communication issues were resolved by installing wireless repeaters within the homes.
It was also determined after equipment had been installed that ongoing and off-going appliance events were not being successfully paired. Data falsely implied that some appliances were remaining on

PNNL-17079
3.8
for extended periods of time when, in fact, that was known not to be the case. This issue was eventually resolved adequately by a firmware update in the homes’ gateways.
Home gateways required rebooting periodically and after major winter storms. In many cases, the need for such a reboot was not detected by, or could not be remedied by, the residential participant. Project staff then had to help participants complete the steps to reboot their communications equipment and thereby reestablish their equipments’ connectivity with the project.
Approximately 4% of project dryers encountered improper behaviors during the project. Several dryer front panels required replacement after indicators failed to work properly. Several dryers entered operating states where they would not start up and heat properly without becoming fully reset by turning the breaker off and on.
These conditions were not successfully resolved during the experiment beyond the fact that toggling the breaker would often successfully reset the dryers’ operation. One customer was able to reproduce the condition with or without the project communication cable in place.
3.2.3 Keeping Track of Appliances Keeping track of the numbers of available, participating, and responsive appliances was very
challenging. First, the project had to reconcile the numbers and identities of configured and installed appliances with those responding back to the project. The project had to deduce the appliance status from whether each appliance responded with its controller events and load-change events. Load-change events did not occur, of course, unless appliance owners were using their appliances. Failures of appliances to report back to the project could be equivalently caused by malfunctions of wireless communication equipment, loss of Internet connectivity, controller failure, appliance failure, or disconnection of a communication cable. Many of these communication paths could be disconnected or misconfigured accidentally or intentionally by participants. In at least one instance, service providers hired by the residential participants had disconnected project equipment.
To remedy these inconsistencies, the project manager directed a series of “appliance roundups.” Regardless, the project was only partially successful at managing this objective, and one of our lessons learned is that the process must be automated. A convincing and verifiable list of responsive appliances must be updated, available, and archived for every moment of the project.
3.2.4 Participants Who Left the Project Early The project had originally been planned to end after September 2006. Because of delays that had
occurred during the design and installation of the project field equipment, the project was extended an additional 6 months. The desire was to collect data for at least 1 full project year. Therefore, project participants had to be invited to extend their project participation by contract from October 2006, the original ending date, through the end of March 2007. The project consequently had to extend the original dryer warrantee period at least until the end of the experiment.
Most appliance owners accepted the extension willingly and signed the extension contract for the project. However, 14 of the original participants did not endure until the conclusion of the experiment. Of these, three moved during the project period, four did not respond to or declined our request for an

PNNL-17079
3.9
extended contract, and seven were not invited to continue their participation because of poorly functioning monitoring equipment or other reasons.
3.3 Project Decommissioning Activities At the conclusion of the field experiment, equipment was removed from participants’ homes,
participants were asked to take a final project survey, and participants were informed of the general outcome of and findings from the research effort.
3.3.1 Equipment Removal All project equipment, including modified load-control modules, home gateways, and in some cases,
additional routers and wireless repeaters, were removed from participating homes during April and May 2007. Two contractors were hired by the project to schedule times with appliance owners, remove project equipment, and send the removed equipment back to PNNL. At PNNL, the experimental GFA controller boards and Whirlpool microprocessors were removed from the modified load-control modules.
Water heaters were returned to their original condition at the conclusion of the project. Dryers were left in place within homes after the load-control module and communication cable had been disconnected from the dryers. After removing load-control modules, the technicians then photographed the wall locations to verify that screw holes had been filled satisfactorily.
3.4 Final Survey Project collaborators proposed and negotiated final survey questions and their formats for
approximately 4 months from September through December 2006. The objectives of conducting the final survey of residential participants were to assess the level of consciousness of and their tolerance for the project’s underfrequency control of their affected appliances. The project also hoped to query which methods of marketing would be accepted by appliance purchasers and hoped to solicit feedback on the project’s experimental interaction with the participants. Whirlpool Corporation possessed great experience conducting customer surveys. They offered this expertise to the project, providing the project valuable feedback about the survey and providing the use of their automated Web site survey site and tools.
Residential participants were invited to take the survey by a project letter mailed in March 2007. The letter directed them to an automated survey Web site. Each participant was asked in the survey to provide his unique identification number and one of six letters provided him to identify which GFAs had been tested in his home. Follow-up letters and emails were sent to those participants who did not immediately take the survey. Ultimately, 96% of appliance owners completed their final surveys.
The final survey questions and responses are included in appendix Table A.4. The majority of respondents was satisfied with their participation and would participate again in a similar study. They were not inconvenienced by the autonomous underfrequency load shedding performed by their appliances, and they said they would probably purchase an appliance with this feature, expecting to initially pay just under $20 more for the feature. Respondents preferred automated energy responses be made by their appliances, providing the appliance owner can retain the right to override such responses.

PNNL-17079
3.10

PNNL-17079
4.1
4.0 Performance Data There were approximately 200 GFAs distributed to residences in Washington and Oregon making up
an active Grid Friendly Appliance Project field test bed. These appliances monitored the power grid via the electrical signal available at each appliance and shed a load when a state of high stress—an underfrequency event in this case—was detected. Data were collected for these appliances from early 2006 through March 2007. This section will cover the performance data collected for the GFAs during this period and the methodology used for analysis.
Each GFA controller was monitored by a load-control module that communicated performance data for both the controller and appliance load to the home gateway of an energy-management system. Details of data collection were discussed in Section 3. The home gateway eventually relayed the data via broadband Internet back to central servers where the data were archived. Each home had been assigned a unique ID number, and time stamps were appended by the load-control modules to each piece of information sent to the central server.
There were three main sources of data used in this analysis:
1. A continuous history of the WECC-power-grid frequency that has been measured and stored at PNNL since 2002. This history was used to define the actual time, duration, and frequency depth of each underfrequency event.
2. Time-stamped event data for the inception and release of every GFA controller underfrequency event as it occurred at and was recorded at each appliance. These data were used to confirm whether individual GFA controllers observed and responded to underfrequency events, regardless of whether their controlled appliances were active or responsive.
3. Time-stamped event data for changes of 1200 W or more in each appliance’s load, as measured by the load control module at each appliance. These data were intended to confirm the curtailment responses of the controlled appliances. The data also offered a detailed history of how, how often, and when appliance homeowners used their appliances.
The data collected by the load-control modules at each appliance also included indicators of wireless communication quality. Each recorded event could be traced to a unique home and appliance.
The following types of analyses were performed using the available data. Each analysis will be presented and discussed later in this section:
1. total numbers of defined underfrequency events by appliance, by season, and by time of day
2. percentage of GFA responses vs. the “depth” of an underfrequency event
3. percentage of GFA responses vs. duration of an underfrequency event
4. analysis of daily and seasonal load magnitude by appliance type.
4.1 Data Collection Two data-collection pathways were important for the GFA field demonstration. The first was an
existing data stream of WECC grid-frequency data collected at PNNL from a single frequency sensor.

PNNL-17079
4.2
The second data pathway relied on the load-control module at each appliance and was specifically designed to collect the fielded, distributed appliance and controller behaviors during the experiment.
4.1.1 PNNL Grid-Frequency Records Continuously since 2002, PNNL researchers have measured and stored WECC electrical-grid
frequency at Richland, Washington (Chassin et al. 2005; Lu and Hammerstrom 2006). The sensor used for these measurements is similar to the GFA controller in that it accurately measures the electrical period between signal zero crossings at a 120-V wall outlet. The recorded data are averaged for a window 10 cycles in duration and are sampled and archived at a rate of 10 samples per second. These data have been archived at PNNL in MySQL database format (Gilfillan 2003) and can be readily queried to extract interesting historical-frequency characteristics and events.
Incidentally, a similar frequency data stream is publicly available online from PNNL for viewing from a personal computer. There, one can download programs for either a WECC grid frequency screen saver or a monitor (GridWise 2007).
These data were used before field work to predict the frequency threshold at which approximately one underfrequency event per day should be observed. The general approach was described in Lu and Hammerstrom (2006). The intermittency of detected underfrequency events is affected by 1) the assignment of the frequency threshold itself, at which the event should be recognized, 2) the short delay expected between the moment the threshold is exceeded and the time at which the response action takes place, 3) the selection of the frequency at which the appliance is allowed to return to normal operation after an underfrequency event, and 4) the minimum duration assigned to an underfrequency response before the response is allowed to be released. A simple simulation using these parameters on historical-frequency data was required to accurately predict the number of events that would occur during the field experiment. Such a simulation supported the decision to place the underfrequency threshold for the GFA controllers at 59.95 Hz for this study.
Thereafter, these PNNL grid-frequency records were used as the reference data from which underfrequency events were defined. At any time the recorded frequency fell below 59.95 Hz, that moment in time was recorded and numbered as one of the experiment’s underfrequency events, against which data received from the fielded appliances would be compared. The lowest frequency recorded during each event and the duration for which the frequency remained below the threshold were recorded as important parameters of each event.
4.1.2 Load-Control-Module Event Recording and Data While the GFA controller itself relies on no external communication, the project necessarily relied on
components of an energy-management system to log the occurrences of underfrequency events recognized by each GFA controller and to report the behaviors of the appliance loads that were controlled by each controller. Specifically, load-control modules of the Invensys Controls GoodWatts™ energy-management system were procured and modified by the project to observe and record events recognized by each controller. The load-control modules would periodically transmit their event logs to the home’s communication gateway, also part of the GoodWatts™ system, and then onward to Invensys Control’s back-end data servers via a broadband Internet connection.

PNNL-17079
4.3
The algorithms by which GFA controller signals and load measurements were detected and logged were configured in firmware by Invensys Controls in their load-control modules and home gateways. The firmware modifications of the load-control modules for this project were designed and improved during initial project testing. The home-gateway firmware could be updated periodically in the field to improve the performance of the data collection.
In summary, the load-control module recorded
• the onset of the GFA controller signal
• the release of the GFA controller signal
• the calculated average power consumption of the appliance 1 second immediately before its load has changed an estimated 1200 Watts or more
• the calculated average power consumption of the appliance 1 second immediately after its load has changed an estimated 1200 Watts or more.
4.2 Time-Stamp Issues Logged-event time-stamp precision was to the nearest second for the load-control modules.
However, the time-stamp accuracies were suspect, as will be described in this section.
Figure 4.1 shows a frequency history measured at PNNL over about 13 minutes on July 25, 2006. One can observe two distinct project underfrequency events within this period. The corresponding time stamps for the recorded onset of the two events at each field appliance are also shown. Note that the event time stamps of the GFA controller have been intentionally spread vertically to enhance the visibility of the numerous points.
While the figure displays a general correlation between the time histories of underfrequency events and the corresponding time stamps recovered from field appliances, it also demonstrates how the time stamps were spread over almost 1 minute by the field monitoring equipment. Load-control-module time stamps appear to be roughly evenly distributed, both before and after the actual event.
In part, the spread of the time stamp over time can be attributed to time clock errors of the energy-management system. The internal clocks of the load-control modules had been designed by the product vendor to become recalibrated only after discrepancies exceeding 30 seconds had been detected through communications with the back-end server. Such accuracies are fully acceptable for the time-of-use programs for which the vendor’s equipment had been designed.
Other time-stamp anomalies can also be noted. For example, the distribution of reported events demonstrated an inexplicable and persistent periodicity. Time stamps were grouped at about 10-second intervals.
To better understand these observations, the GFA responses were broken down by appliance location to see if there were any localized phenomena.

PNNL-17079
4.4
Figure 4.1. GFA Controller Responses to Two Underfrequency Events on July 25, 2006
Figure 4.2 shows data from another underfrequency event on July 22, 2006. Here, different colors and marker shapes have been assigned to each of four utilities and corresponding geographic areas where the GFAs had been placed—Clallam County PUD (Sequim, Washington); Port Angeles (Port Angeles, Washington); PacifiCorp (Yakima, Washington); and PGE (Gresham, Oregon). No pattern emerges for the timing of events by geographic location. Instead, there are distinct groupings of time stamps again, each grouping separated by about 10 seconds.
The analysis was repeated for an event that occurred on April 29, 2006. This date was chosen because a home-gateway firmware update had been completed on the prior day. Each time a firmware update is implemented, the internal clocks of the energy-management systems should become re-synchronized with the clock of the central server. Staff should, therefore, have effectively eliminated the effects of time-stamp calibration errors. A plot of the April 29 responses can be seen in Figure 4.3.
It was again obvious that there were distinct groupings of time stamps for this underfrequency event. The responses were again spread and separated by intervals of 10 seconds. The recalibration of energy–management-system time stamps had also failed to more narrowly group the event time stamps, leaving the resulting time stamps discrepant by about 1 minute altogether.
4:25 4:27 4:28 4:30 4:31 4:32 4:34 4:35 4:37
time (GMT hh:mm)
59.8
59.85
59.9
59.95
60.00
60.05
freq
uenc
y (H
z)
50 sec 50 sec

PNNL-17079
4.5
Figure 4.2. GFA Controller Responses by Location
It was examined whether the time stamps of individual appliances could be corrected by subtracting the discrepancy from one event to another. The analysis, however, did not reveal any specific trend other than the recurring 10-second intervals. That is, one appliance that appears to be early by 10 seconds for one event might appear to be late by 10 seconds or within another 10-second grouping for the following event. Attempts to calibrate and remove these errors from measurements were unsuccessful.
A histogram was created to explore the nature of the observed 10-second periodicity. All time stamps for GFA controller events were accumulated in histogram bins according to only the second value reported within each time stamp. One should expect the distribution to be random across all seconds from 0 to 59. That is, any second of a minute should possess an equal likelihood that an event would be recorded during that second. Figure 4.4 shows the resulting histogram.
From this histogram, one can see that the underfrequency events are only being time stamped on predominantly 10-second intervals. Furthermore, there were clearly preferred seconds each minute during which time stamps were applied. The largest numbers of time-stamp occurrences happened during the seconds 7, 18, 28, 37, 48, and 58.
This observed periodicity is likely related to a programming issue in the load-control modules or gateways. Perhaps an affected processor became delayed by other processes, and time stamps could be
20:06:4720:06:5720:06:37
20:06:00 20:06:43 20:07:26 20:08:10 20:08:53 20:09:36time (GMT)
59.8
59.85
59.9
59.95
60
freq
uenc
y (H
z)
Clallam Port Angles Yakima Gresham Freq
Frequency Threshold = 59.95 Hz

PNNL-17079
4.6
0:08:27
0:08:37
0:08:47
12:07 AM 12:08 AM 12:09 AM
time (GMT)
59.80
59.85
59.90
59.95
60.00
freq
uenc
y (H
z)
Clallam Port Angeles Yakima Gresham freq
Figure 4.3. Responses by Location Soon After a Gateway Firmware Update Had Been Completed
Figure 4.4. Distributions of Time Stamps to the Nearest Second
second recorded by time stamps
0
1
2
3
4
5
6
7
8
0
perc
enta
ge o
f occ
urre
nces
(%
)
10 20 30 40 50
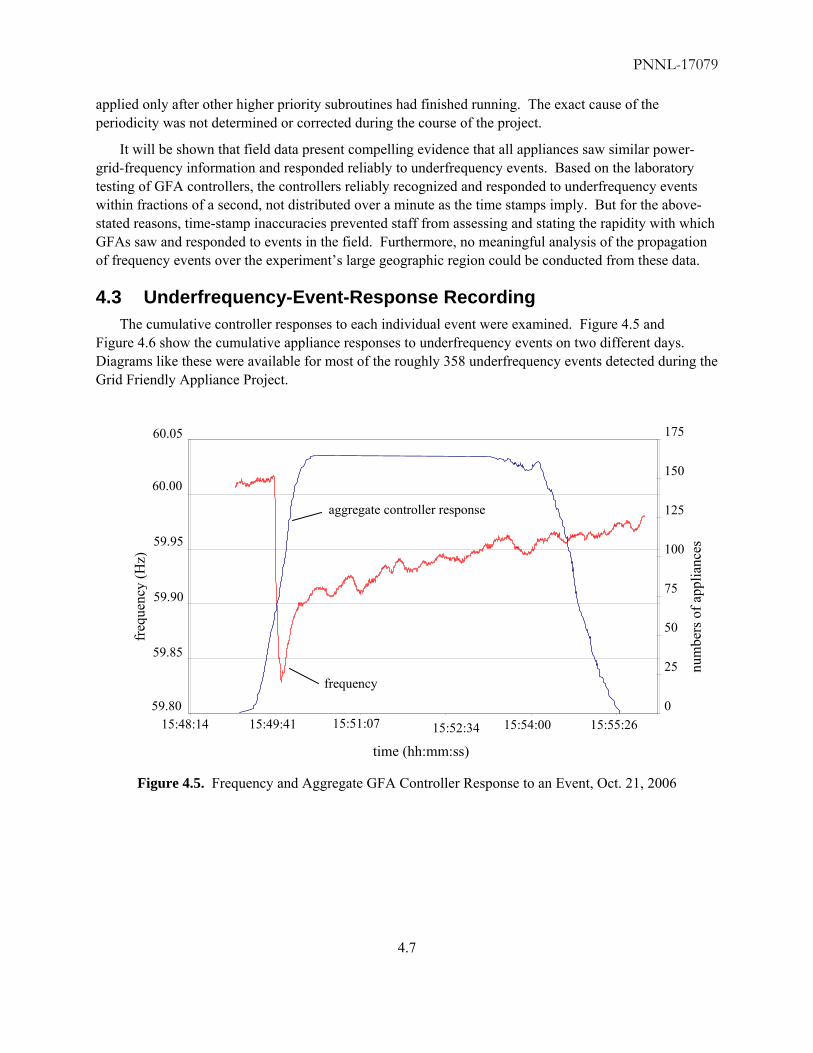
PNNL-17079
4.7
applied only after other higher priority subroutines had finished running. The exact cause of the periodicity was not determined or corrected during the course of the project.
It will be shown that field data present compelling evidence that all appliances saw similar power-grid-frequency information and responded reliably to underfrequency events. Based on the laboratory testing of GFA controllers, the controllers reliably recognized and responded to underfrequency events within fractions of a second, not distributed over a minute as the time stamps imply. But for the above-stated reasons, time-stamp inaccuracies prevented staff from assessing and stating the rapidity with which GFAs saw and responded to events in the field. Furthermore, no meaningful analysis of the propagation of frequency events over the experiment’s large geographic region could be conducted from these data.
4.3 Underfrequency-Event-Response Recording The cumulative controller responses to each individual event were examined. Figure 4.5 and
Figure 4.6 show the cumulative appliance responses to underfrequency events on two different days. Diagrams like these were available for most of the roughly 358 underfrequency events detected during the Grid Friendly Appliance Project.
Figure 4.5. Frequency and Aggregate GFA Controller Response to an Event, Oct. 21, 2006
59.80
59.85
59.90
59.95
60.00
60.05
15:48:14 15:49:41 15:51:07 15:52:34 15:54:00 15:55:26
time (hh:mm:ss)
freq
uenc
y (H
z)
0
25
50
75
100
125
150
175
num
bers
of a
pplia
nces
frequency
aggregate controller response

PNNL-17079
4.8
Figure 4.6. GFA Responses to Several Consecutive Underfrequency Events
As can be seen in Figure 4.6, there were three distinct threshold crossings in the span of approximately 13 minutes. The first event demonstrates how the appliances’ release delay had been designed to work; once actuated, the controller does not release control of its appliance until the frequency has risen above and remained above the release threshold for 16 seconds. Therefore, even though the grid frequency traversed the event-release threshold quickly and multiple times, the GFA controller remained triggered. This delay prevented appliances from unnecessarily trying to perform multiple rapid and potentially damaging appliance load switches between on and off states.
The second and third events of Figure 4.6, which were shorter in duration than the first, appear to have had fewer responsive appliances. In fact, it is believed that this apparent reduction in total responding appliances is an artifact of the way the numbers of responsive appliances were accumulated. During the generation of this figure, an appliance was added at the time its GFA controller underfrequency event was logged, and an appliance was subtracted when a release of that controller event was logged. However, the time-stamps of these logged events were spread broadly over about a minute, as has been discussed. This problem is also evident in the slow rate at which the appliances appear to enter and leave the population of affected appliances. Therefore, when counting the cumulative response to an event, it was necessary to examine the trigger and release counts separately.
The effect of this overlap is demonstrated in Figure 4.7. The purple line shows the accumulation of the onset of underfrequency events according to the times in the time-stamp logs. The green line similarly shows the accumulated off-going release signals according to their time stamps. Observe that

PNNL-17079
4.9
the inaccuracy of the time stamps spreads both the ongoing and off-going responses. With accurate time stamps, one would expect the purple onset line to rise completely before the first green off-going events occur. The fact that these two lines intersect as the logged onset events accumulated means that appliances were being subtracted before the onset of all responsive appliances were fully accounted for. Therefore, the spread of time stamps by monitoring equipment prevented an easy demonstration of accurate, crisp accumulations of appliance responses.
Figure 4.7. Cumulative Response Separated By Onset Triggers and Releases
In later figures, the aggregate event responses were normalized to the number of available appliances. There were many factors that made normalization of responses sensible and necessary. Some initial installation delays and communication limitations prevented some of the installed appliances from responding to the project early in the experiment. Some users of the equipment would unplug the communication connection for various reasons, and their information was not received properly at the server for the time the communications were unplugged. A few residential participants moved and left the experiment early. For these reasons, the total number of controlled appliances varied throughout the experiment, and this report will therefore present most quantitative results normalized to the total number of appliances that were available to respond.

PNNL-17079
4.10
4.4 Electrical-Load Measurement during Events An attempt was made to capture measurements for appliance loads just before and immediately
following major appliance load changes. The energy-management-system vendor modified its load-control-module code to facilitate this feature. Figure 4.8 shows one such time series for a project dryer that was being used during a recognized underfrequency event. Each triangular marker represents one dryer load entry. Consecutive entries are connected by lines for easier readability.
Before the underfrequency event, one can see that the dryer performed its normal cycling on and off as it maintained the dryer’s drum temperature. Corresponding to a recognized project underfrequency event, the cycling stopped during the approximately 3-minute underfrequency event. When the controller released its control of the appliance, the dryer drum heated a little longer before it returned the dryer drum to its prescribed temperature.
The recorded maximum load magnitude was recorded by the load-control module as about 6 kW. The minimum load was recorded at about 0.4 kW, which approximates the power of the drum motor that continues to tumble the clothes. (Installers had been directed to monitor the leg of the 240-V ac circuit that served the motor load, but this directive was not always followed.) The variability of these measurements was considerable. Many measurements were located halfway between the extremes, as is shown in the fourth point of Figure 4.8. Not every ongoing load event could be successfully paired with an anticipated off-going load event. While these data were useful for anecdotal evidence like that shown in Figure 4.8, the data were not very amenable to useful automated aggregate-load analysis. Considerable human interpretation and intervention were needed to extract even the anecdotal plots like this one.
Figure 4.8. Example Data Logged From Active Project Dryer during an Underfrequency Event
0
4
3
2
1
5
6
7
drye
r pow
er (k
W)
time (total duration about 20 minutes)
GFA event duration
about 3 minutes

PNNL-17079
4.11
4.5 Characteristics of Recorded Underfrequency Events The data set that was used to analyze the performance of GFA controllers consists of 358 separate
frequency events that occurred between May 14, 2006, and March 31, 2007. Each event was characterized by three principal parameters: the time at which the event happened, the depth of the event, and the duration of the event.
Appendix Tables A.1 and A.2 include lists of these events, their times, their characteristics, and the numbers of appliances that recognized each underfrequency event. The project also archived a time-frequency series near each underfrequency event.
An event’s frequency depth is defined for this report as the lowest frequency recorded in the PNNL frequency data stream during the time at which a Grid Frequency controller should have recognized the event. Figure 4.9 describes the distribution of events by their frequency depths. Figure 4.10 presents the same data as a cumulative sum of events as a function of increasing frequency depth.
Figure 4.9. Distribution of Event Depths for the Grid Friendly Demonstration Appliances
As can be seen from the distribution histogram, the vast majority of recognized events have a frequency depth shallowly located in between 59.90 and 59.95 Hz. The lowest recorded frequency depth in the data set was 59.826. Admittedly, few, if any, of these events decelerated to a frequency sufficient to activate substation remedial-action schemes, but that is part of the point to be made. There are many
0%
1%
2%
3%
4%
5%
6%
7%
8%
9%
59.80 59.85 59.90 59.95
frequency (Hz)
perc
ent f
ract
ion
of to
tal e
vent
s (%
)
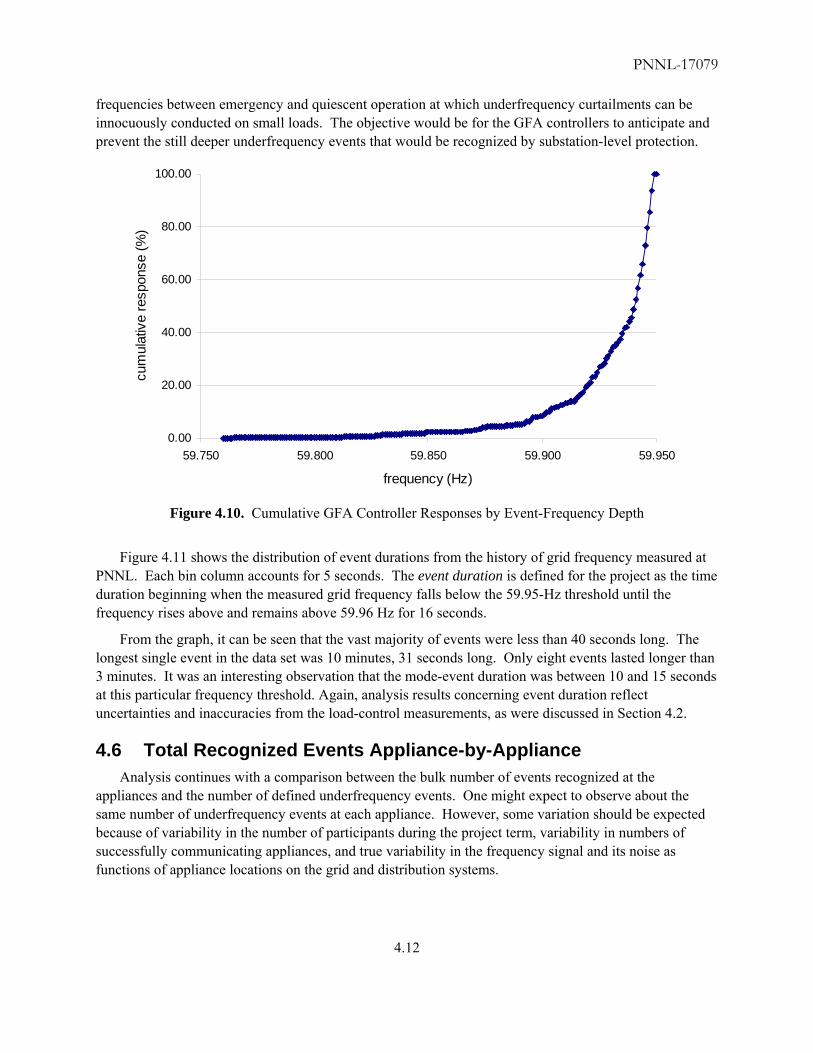
PNNL-17079
4.12
frequencies between emergency and quiescent operation at which underfrequency curtailments can be innocuously conducted on small loads. The objective would be for the GFA controllers to anticipate and prevent the still deeper underfrequency events that would be recognized by substation-level protection.
0.00
20.00
40.00
60.00
80.00
100.00
59.750 59.800 59.850 59.900 59.950
frequency (Hz)
cum
ulat
ive
resp
onse
(%)
Figure 4.10. Cumulative GFA Controller Responses by Event-Frequency Depth
Figure 4.11 shows the distribution of event durations from the history of grid frequency measured at PNNL. Each bin column accounts for 5 seconds. The event duration is defined for the project as the time duration beginning when the measured grid frequency falls below the 59.95-Hz threshold until the frequency rises above and remains above 59.96 Hz for 16 seconds.
From the graph, it can be seen that the vast majority of events were less than 40 seconds long. The longest single event in the data set was 10 minutes, 31 seconds long. Only eight events lasted longer than 3 minutes. It was an interesting observation that the mode-event duration was between 10 and 15 seconds at this particular frequency threshold. Again, analysis results concerning event duration reflect uncertainties and inaccuracies from the load-control measurements, as were discussed in Section 4.2.
4.6 Total Recognized Events Appliance-by-Appliance Analysis continues with a comparison between the bulk number of events recognized at the
appliances and the number of defined underfrequency events. One might expect to observe about the same number of underfrequency events at each appliance. However, some variation should be expected because of variability in the number of participants during the project term, variability in numbers of successfully communicating appliances, and true variability in the frequency signal and its noise as functions of appliance locations on the grid and distribution systems.

PNNL-17079
4.13
Figure 4.11. Distribution of Recorded Event Durations during the Grid Friendly Project
0:0 1:0 2:0 3:0event duration (mm:ss)
num
ber o
f eve
nts
Bin for all events longer
than three minutes.
90
8
7
6
0
1
2
3
4
5

PNNL-17079
4.14
Figure 4.12 shows the distribution of total numbers of water-heater underfrequency events detected by the project’s water heaters. Most water heaters detected 362 events, but the average number of detected events was 315, and the median number was 345. The standard deviation of the water-heater event counts was 83. These data were heavily skewed by three questionable low counts.
Figure 4.12. Distribution of Total Underfrequency Events Recognized by Water Heaters
The distribution of total detected events for the project dryers is similarly represented in Figure 4.13. For this larger appliance sample, the mean, mode, and median event counts are more closely grouped with mean 322, mode 326, and median 328. If one discards the maximum (665 counts) and minimum (20 counts) from the dryer distribution, the standard deviation of this distribution is then 52 event counts. The standard deviation is heavily influenced by four extreme counts far from the main cluster that might be discarded if such extreme counts could be attributed to unusual installations.
Recall that appendix Tables A.1 and A.2 list 358 events that might have been detected, according to the historical frequency data collected at PNNL during the project. Many of these defined events were shallow or short-lived. The point at which this frequency data were monitored was geographically far from the appliance locations. This project did not further consider the possibilities of dynamic variability of frequency measurements over large regions.
0
2
4
6
8
10
12
Und
er 2
0020
0-21
0
210-
220
220-
230
230-
240
240-
250
250-
260
260-
270
270-
280
280-
290
290-
300
300-
210
310-
320
320-
330
330-
340
340-
350
350-
360
360-
370
370-
380
380-
390
390-
400
400-
410
410-
420
wat
er h
eate
r cou
nt
mean: 315mode: 362median: 345 Total water heater count was 47, less two that were removed with1 and 620 counts. These two were thought to be a test unit and a water heater that never communicated after installation.
events detected

PNNL-17079
4.15
4.7 Detected Events as a Function of Event Frequency Depth Measurable variability had been anticipated in the responses of the controllers to be caused by 1) the
differing impedances of their connections to their electrical distribution systems and 2) dynamic frequency differences from region to region. For example, the frequency depth might be expected to be greater near a system disturbance than it would be farther from the disturbance. Figure 4.14 shows the percentage of appliances responding to events having various frequency depths.
Figure 4.13. Distribution of Events Recognized at Clothes Dryers
0
5
10
15
20
25
30
35
40
< 20
020
0-21
0 21
0-22
0 22
0-23
0 23
0-24
0 24
0-25
0 25
0-26
0 26
0-27
0 27
0-28
0 28
0-29
0 29
0-30
0
300-
210
310-
320
320-
330
330-
340
340-
350
350-
360
360-
370
370-
380
380-
390
390-
400
400-
410
410-
420
420-
430
430-
440
> 44
0
events detected
drye
r cou
nt
mean: 322mode: 326median: 328total dryers in sample: 144

PNNL-17079
4.16
0%
10%
20%
30%
40%
50%
60%
70%
80%
90%
100%
59.959.9159.9259.9359.9459.95frequency (Hz)
perc
ent r
espo
nse
(%)
Water Heaters Dryers
Figure 4.14. Percentages of GFA Controllers Responding at Various Frequency Depths
As the figures show, the aggregate response of the GFA controllers is very steep near the frequency threshold. Virtually all GFA controllers responded to any event for which the frequency depth was 0.003 Hz or more below the threshold set point.
4.8 Response Success as a Function of Event Duration An approach similar to the one used to analyze frequency depth response was then applied to event
duration. Virtually all the controllers responded to any event that was longer than 7 seconds, according to the data shown in Figure 4.15.
However, because of several noted inconsistencies and likely inaccuracies of the time stamps attributed to each underfrequency event, little can be said about the rates at which the underfrequency responses occurred in the field. As discussed earlier, plots of time-stamps for any one event displayed an inexplicably broad range with an equally inexplicable 10-second periodicity. For these reasons, the precision of the time stamps should not be claimed to be better than 5 to 10 seconds. Especially the short field events, for example, may not have been reliably detected by the project’s data-collection equipment.
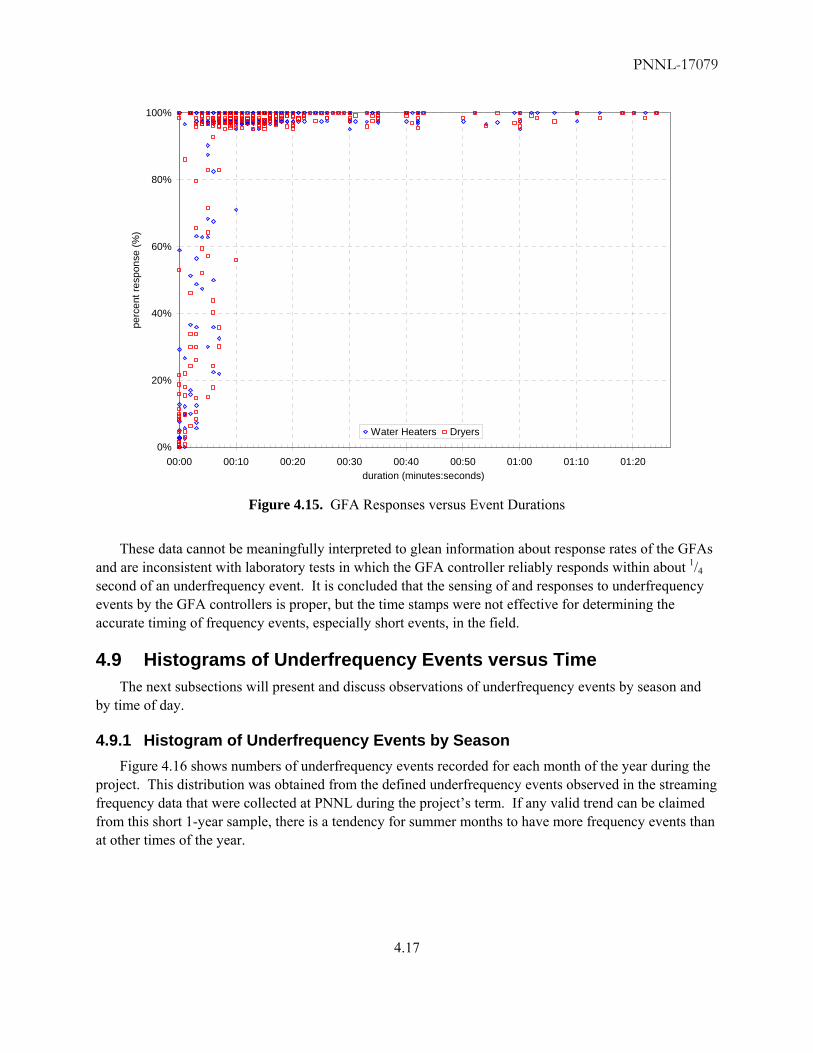
PNNL-17079
4.17
0%
20%
40%
60%
80%
100%
00:00 00:10 00:20 00:30 00:40 00:50 01:00 01:10 01:20duration (minutes:seconds)
perc
ent r
espo
nse
(%)
Water Heaters Dryers
Figure 4.15. GFA Responses versus Event Durations
These data cannot be meaningfully interpreted to glean information about response rates of the GFAs and are inconsistent with laboratory tests in which the GFA controller reliably responds within about 1/4 second of an underfrequency event. It is concluded that the sensing of and responses to underfrequency events by the GFA controllers is proper, but the time stamps were not effective for determining the accurate timing of frequency events, especially short events, in the field.
4.9 Histograms of Underfrequency Events versus Time The next subsections will present and discuss observations of underfrequency events by season and
by time of day.
4.9.1 Histogram of Underfrequency Events by Season Figure 4.16 shows numbers of underfrequency events recorded for each month of the year during the
project. This distribution was obtained from the defined underfrequency events observed in the streaming frequency data that were collected at PNNL during the project’s term. If any valid trend can be claimed from this short 1-year sample, there is a tendency for summer months to have more frequency events than at other times of the year.

PNNL-17079
4.18
Figure 4.16. Distribution of Frequency Events by Month
4.9.2 Histogram of Underfrequency Events by Time of Day Figure 4.17 shows the distribution of underfrequency events by their time of day. The day was
divided into forty-eight 30-minute intervals. A count was then taken for the total number of underfrequency events that occurred during each 30-minute interval during the project. The events appear to be mostly randomly distributed; however, there was an unusually high incidence of underfrequency events soon after midnight, according to these data. This finding was confirmed by the collaborating utility Portland General Electric, but Portland General Electric stated that this observation was not a persistent system-frequency trend.
4.10 Measured Appliance Behaviors The load curves for the water heater and clothes dryer were then calculated from the 15-minute
energy-consumption data provided to the project by the energy-management-system vendor. Separate load curves are shown by season, where winter season (i.e., “Q1”) includes January, February, and March; spring includes April, May, and June; and so on.
These data provide the project with a statistical argument for the capacity curtailment available, on average, from each appliance type should respond to the GFA controller by shedding its entire appliance load.
0
10
20
30
40
50
1 2 3 4 5 6 7 8 9 10 11 12
month (calendar year)
num
ber o
f eve
nts
2007 2006
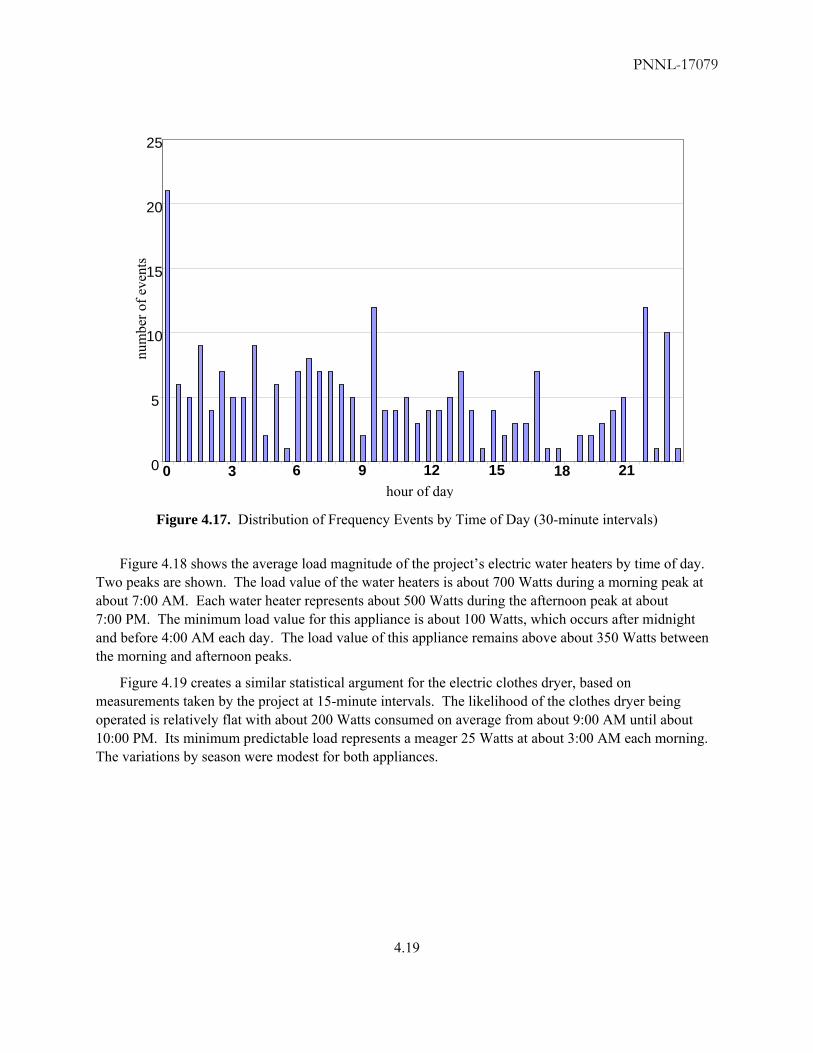
PNNL-17079
4.19
Figure 4.17. Distribution of Frequency Events by Time of Day (30-minute intervals)
Figure 4.18 shows the average load magnitude of the project’s electric water heaters by time of day. Two peaks are shown. The load value of the water heaters is about 700 Watts during a morning peak at about 7:00 AM. Each water heater represents about 500 Watts during the afternoon peak at about 7:00 PM. The minimum load value for this appliance is about 100 Watts, which occurs after midnight and before 4:00 AM each day. The load value of this appliance remains above about 350 Watts between the morning and afternoon peaks.
Figure 4.19 creates a similar statistical argument for the electric clothes dryer, based on measurements taken by the project at 15-minute intervals. The likelihood of the clothes dryer being operated is relatively flat with about 200 Watts consumed on average from about 9:00 AM until about 10:00 PM. Its minimum predictable load represents a meager 25 Watts at about 3:00 AM each morning. The variations by season were modest for both appliances.
0
5
10
15
20
25
0 3 9 12 15 18 21 hour of day
num
ber o
f eve
nts
6

PNNL-17079
4.20
Each appliance represents a statistically predictable load. More load can be shed by these appliances during normal waking hours, as one would expect. These load curves may be used to project the numbers of these types of appliances that would be required to achieve a quantity of aggregate underfrequency response up to potentially megawatts of load response.
Figure 4.18. Predicted Daily Load Value of the Electric Water Heater by Season
4.11 Traditional Demand-Response Events A traditional demand-response event was conducted Thursday, December 7, 2006. This event lasted
only 30 minutes from 7:00 to 7:30 AM; progressively longer demand-response events were called on following Thursdays. The command was implemented centrally from the Invensys Controls communication server to the water-heater and dryer load-control modules.
The response of project appliances to these events is exemplified by this first response. Of the 18 water-heater load-control modules in Yakima, Washington, 16 received the command message and responded. Fourteen of these were determined to have contributed to the curtailment of about 14 kWh during the 1/2 hour. Twenty-three kW of water-heater load was curtailed by the water heaters, and 43 kW re-entered upon the release of the demand-response command. These and system-wide measurements could have been confounded somewhat by changes in the scheduled occupancy modes that might have corresponded to this morning interval.
0
0.1
0.2
0.3
0.4
0.5
0.6
0.7
0.8
0.9
0 3 6 9 12 15 18 21 hour of day
aver
age
pow
er p
er w
ater
hea
ter (
kW)
Q1 Q2 Q3 Q4

PNNL-17079
4.21
Figure 4.19. Predicted Daily Load Value of the Electric Clothes Dryer by Season
The signal was also sent to project dryers that could not be directly curtailed, but which were to display “En,” beep, and require a second depression of their start buttons. Of the 135 dryers then in the system, 106 received the message and participated. However, no reduction in load could be directly attributed to the demand-response signal received by the dryers. Late in the project, demand-response requests were sent to only the project dryers on every other Thursday morning. The analysis of these requested, voluntary dryer responses will be analyzed and published elsewhere.
Project collaborators were satisfied through these tests that a traditional demand response can be practiced on the same appliances that perform autonomous underfrequency responses if communications are provided to the appliances.
0
0.05
0.1
0.15
0.2
0.25
0 3 6 9 12 15 18 21 hour of day
aver
age
drye
r loa
d (k
W)
QQQQ

PNNL-17079
4.22

PNNL-17079
5.1
5.0 Perspective Statements Below are essays contributed by representatives of utilities, an appliance manufacturer, and the
projects’ residential participants. The unique perspectives of these stakeholders are captured.
5.1 Utility Perspectives Utility perspective essays were provided to the project by representatives of three utilities that
collaborated with PNNL during this project: Bonneville Power Administration, PacifiCorp, and Portland General Electric.
5.1.1 BPA Perspective The following perspective was offered jointly by Preston Michie of Preston Michie and Associates
and Terry Oliver, Director of the Technology Innovation Program at BPA. BPA helped the project find willing utilities and residential project participants in Sequim and Port Angeles, Washington.
“BPA has had a long interest in demand-side management. Historically it has focused on end-use efficiency, but in the past 10 years, BPA has become much more interested in the interactions between various generating resources, end-use load patterns and resource management. These ideas have the potential to use demand response to defer capital investments for system upgrades or expansion, assist in maintaining reliability, mitigate market price excursions and thereby help manage market power, thus providing new sources of ancillary services.
“BPA’s interest in these areas arose from a team effort in the late-1990s, which developed the EnergyWeb concept (Figure 5.1). The EnergyWeb is a vision BPA defined for the future power system that consists of integrating the existing utility infrastructure with high speed data communication, market principles, new resources such as renewable resources, and new ‘smart’ technology to manage the power system more effectively. The EnergyWeb was featured in an article in the July 2001 issue of Wired Magazine (Silberman 2001). The Wired Magazine article made BPA realize that similar work and interests existed at PNNL, and vice versa.
“The Grid Friendly Appliance Study. The Grid Friendly appliance controller is a perfect example of a new ‘smart’ technology to detect underfrequency events in the home and turn off the appliance in response to a system event. BPA’s interest in testing the Grid Friendly controller installed in water heaters is to confirm that the technology works as promised and to assess the efficacy of Grid Friendly technology to manage underfrequency events, and the potential for Grid Friendly controllers to provide reliability or other system benefits to BPA or other regional system operators.
“BPA expected the Grid Friendly controllers to work. This part of the study essentially validated what BPA thought would be the case. BPA sees value in showing skeptics that these automatic responding devices work as intended.

PNNL-17079
5.2
Figure 5.1. BPA Energy Web Diagram
“BPA has a continuing interest in what has now come to be identified as ‘smart grid’ technologies. These technologies are highlighted in BPA’s Technology Innovation agenda (BPA 2006).
“What would it take for Grid Friendly Controller Technology to be of serious interest to BPA? Two-way communication and programmability is of particular interest to BPA with respect to Grid Friendly controller technology, as is the potential for such devices to respond to voltage and over-frequency events.
“One problem Grid Friendly appliance controllers face is that at times BPA does not want the devices located in the Pacific Northwest to trigger during an underfrequency event. For example, consider the case where the Northwest is exporting power to California and a large California generator trips off creating an underfrequency event in the Western Interconnection. In this case, Northwest generators respond by transferring momentum from Northwest generators to generators in California. If Northwest Grid Friendly devices also trip in response to an underfrequency event in California, the amount of surplus generation in the Northwest increases and more power surges down the Intertie to correct the imbalance thereby potentially increasing, rather than decreasing, system stability.
“If the Grid Friendly controllers instead could be re-programmed during export periods not to trip, this exaggeration of a California problem would be avoided. Indeed, if they could be set to turn on in this instance, stability would actually increase depending on the size of the frequency excursion, admittedly a counter intuitive result. Conversely, if the frequency event occurred in

PNNL-17079
5.3
the Northwest, stability is improved by having Northwest Grid Friendly controllers trip to shed load.
“BPA understands that the next generation of chip triggers when an under-voltage problem develops as well as underfrequency or over frequency. This is of potential interest to BPA in managing voltage stability, a highly localized effect. This capability, coupled with programmability, would be a valuable technology. BPA recognizes that these features add costs and increase complexity.
“A key future question is to explore the impacts of distribution of such devices (heavily weighted in the NW or PSW or evenly spread in the West) on the West-wide electrical system. Whether control springs from a central location or is distributed or autonomous is a matter of debate and concern for BPA.
“Other Issues. It is not clear whether these ‘smart’ technologies should be mandated by utility commissions and other regulators or whether deployment should be left to the market.
“Conclusion. While these technologies are potentially valuable tools with which to help manage reliability and provide other valuable services, many questions related to scalability and public policy remain.
“BPA is encouraged by the success of the Grid Friendly Appliance and Olympic Peninsula studies. These studies clearly indicate that ‘smart’ technologies have the potential to provide valuable benefits to system operators.”
5.1.2 PacifiCorp Perspective The following perspective was offered by Bill Marek, an employee of PacifiCorp, which hosted the
Grid Friendly Appliance Project at its customers’ homes in Yakima, WA.
“In the mid 1980’s electric utilities began to disassemble their research and development organizations and instead began to rely on university, industry institutions (EPRI, EEI), consultancies and government laboratories (DOE) for engineering, scientific and associated economic analysis and information relative to emerging electric and electronic systems and technologies. As part of this trend these same institutions piloted and evaluated advanced systems such as solar, parabolic arrays, solar molten salt generation plants together with a host of demand-side solutions. The mantra of the utility was one of taking what primary research organizations had proven to be reliable: Let the research organizations take the risk became the utility watch cry. Utility emphasis was on customer service, reducing inventory, operating on ‘lean’ budgets, maintaining rate stability and advancing shareholder value. It was with this background that PacifiCorp approached the Grid Friendly Appliance Project and the foundational technology supporting the project−the autonomous Grid Friendly underfrequency controller.
“Background and initial concerns. With the aforementioned bias PacifiCorp and other participating utilities in the Northwest brought forward capital, people and access to customers to participate in the Demonstration Project. The fact that utilities participated at all is a testimony to the interest and potential benefits the autonomous Grid Friendly underfrequency controller has to offer. Nevertheless, PacifiCorp’s concerns sorted themselves into four groups: (1) would the

PNNL-17079
5.4
technology work; (2) putting grid reliance on a ‘passive’ system; (3) the economic fundamentals and (4) the timing and tolerances of dispatch settings.
“Concern One: Would the technology work? While not a major issue, there was concern the technology was too immature for a large scale pilot. This concern was mitigated by PNNL meeting with utility leadership, the fact that the technology itself was the output of ‘brand name’ research organizations− Department of Energy (DOE) and PNNL and that the underlying technology had already earned the endorsement, abet participation, of IBM and Whirlpool.
“Concern Two: Reliance on ‘passive’ participants. Assuming the embedded Grid Friendly underfrequency controller actually worked, the question that next surfaced was would there be (1) significant acceptance on the part of consumer product manufacturers and (2) would there be sufficient consumer adoption of the technology such that when dispatched there would be satisfactory volumes to actually make a difference in maintaining grid stability?
“Keep in mind, engineers are a ‘fail safe’ sort, particularly when it comes to electricity. The electric grid has been designed to leave nothing to chance. For instance, the National Electric Reliability Council (NERC) requires utilities to have a certain percent of substations and circuits to be armed with underfrequency relays. Because electricity is indiscriminate as to where it goes (just so long as there is a path) individual utilities within a NERC control areas must act in concert with one another. By so doing, frequency and voltages are maintained for the good of all. For instance, within Western Electric Coordinating Council (WECC), if a generation unit in New Mexico unexpectedly ‘goes down,’ voltage ‘sags’ and frequency ‘droops’ can and are created in Washington State. Of course, these vagaries are mitigated by the installation and operation of a myriad of transmission and distribution equipment and systems. So, the question emerged, can a utility afford to have the responsibility for reliability dependent on the coincident operation of customer end-use loads? That is, allow the reliability component to be ‘passively’ managed?
“Concern Three: Value proposition. Why would the customer incur additional costs for Grid Friendly enabled equipment? What is in it for them…the equipment manufacturer…the utility? One thing for sure, capitalism, despite its foibles, is a terribly efficient economic order. The individual ultimately ‘paying the freight’ has to get something he or she deems worth the cost. In addition, the equipment manufacturer must factor into their financial metrics additional equipment and manufacturing costs, market acceptance and penetration and ultimately return on investment. It is not likely the economics will work for them. The end use customer is shopping for a ‘deal,’ and the consumer value of ‘underfrequency’ simply doesn’t translate when purchasing a clothes dryer.
“The utility, on the other hand, has a huge upside by maximizing customer service and minimizing lost revenue. The benefits that accrue can, of course, be passed on to those who make the value proposition work. But how, how much, and when? These are knotty issues without precedent, simple resolution or regulatory oversight. Clearly, equipment standards are and will remain a pivotal solution to the problem. But mandated standards alone are insufficient to solve the entire problem. Regulatory fiat will likely play a role if the value proposition is to move forward and ultimately translate Grid Friendly intentions into practical results.

PNNL-17079
5.5
“Concern Four: Timing and tolerances. Currently, underfrequency relays come standard on substation equipment. To add equipment to older substations costs about $2,500 per substation. Underfrequency relays are armed to user defined settings. If not properly configured with the appropriate logic the Grid Friendly underfrequency relay equipment could end-up ‘fighting’ grid installed equipment. That is, Grid Friendly enabled loads must ‘see’ and respond to underfrequency events prior to distribution asset doing so. Failing at this will cause confusion at best and the lights going out at worst. This concern is more or less an operational matter. Nevertheless, it is a concern that, from the utility perspective, needed attention.
“Pilot implementation. Putting aside the aforementioned concerns, PacifiCorp ‘bellied-up’ capital budget, hired temporary field personnel, assigned a company employee to provide oversight and made available customers to the Grid Friendly Appliance Project. The fact that customers were promised a new, state-of-the-art, high-efficient, top-of-the-line clothes dryer from a name brand manufacturer led PacifiCorp to believe that the 50 slots available for demonstration participation would be oversubscribed. Accordingly, a limited mailing to customers was planned to minimize customer complaints anticipated as a function of oversubscribing the available participant slots. There was surprise when the first mailing produced limited interest and even fewer participants. To be fair, there were unique recruiting constraints−each domicile was required to have high-speed Internet, an electric water heater and an electric clothes dryer. In addition there would be installation disruption. These issues aside there remained a measure of confusion related to the dearth of applicants. In one way or another, the pool of participants was impeded. A subsequent target mailing was made to folks assumed to have the requisite appliance configurations. These selection criteria resulted in a much larger pool for additional candidate screening and ultimately program participation. In the end, 50 PacifiCorp customers in Yakima, Washington were selected to participate in the Grid Friendly Appliance Project.
“Potential customers had relatively benign questions. Questions were those that would otherwise be expected. For example, customers wanted to know, is the dryer a regular dryer? Will I notice a difference? Can I use my PC as normal? Will it affect when, how, how much I do things now (either with water heating, clothes drying and/or my PC)? Do I get to keep my old dryer? What will happen if I don’t like it?
“The ‘enlistment’ effort did result in a number of surprises. First, and as part of the deal, PacifiCorp agreed to ‘dispose of’ their old dryers. Elaborate plans were laid to handle the logistics of this. As it turned out, the largest majority of program participants had a married son or daughter, relative, rental property or charitable organization lined-up for their old dryers. A full 80% of the participating customers had a ‘home’ for their old dryers. Second, a local phone number was set up to facilitate customer service issues and concerns. In fact, this was an important consideration and concern on the part of all participating utilities. Here again, initial concerns for customer service never materialized. Within a three month period only 25-30 calls were received into the PacifiCorp-dedicated line and nearly 100% of those calls were informational in nature how the program operated, who was eligible, can I keep my old dryer?, etc., etc., etc. After a three-month period the phone was disconnected altogether. Third, and final, despite the initial tepid customer reaction to the first batch of mailings, a second mailing (about 300 pieces) ‘carried-the-day’ in acquiring the appropriate number of participant sites. As mentioned, this success was the result of pin-pointing a target audience.
PNNL-17079
5.6
“Implementation findings. With the first batch of field installations the PacifiCorp Grid Friendly team anticipated at least a handful of ‘ah-ha’ problems and concerns. In this regard the team was not disappointed. The team learned quickly that all electricians are not created equally. The installation of the Grid Friendly equipment was both a traditional electrician problem and, as result of having to backbone data from the appliance to the server, a contemporary WAN/LAN problem. The team was fortunate to have selected a local Yakima electrician who had both electrician and digital skill sets. In addition, the project team experienced MODEM connectivity and configuration options. These problems emerged as the technology was designed and tested exclusively with cable configurations and installations were largely on broadband communication equipment. Nevertheless, nearly all ‘low voltage’ issues were largely resolved after the first four or five days. A small percentage of problems lingered, but these were not serious. Problem solving was aided by the cooperation of the local field electrician, a committed appliance manufacturer engineering staff, patient customers and the PNNL project manager. Despite efforts, the Grid Friendly Appliance team discovered that there is no such thing as a ‘typical install’. Nearly all installs had some unique nuance that required additional consideration. The ‘good news’ (besides receiving a ‘free’ dryer) was twofold. First, the autonomous Grid Friendly underfrequency controller was virtually transparent to demonstration participants. Second, customers were largely satisfied. Customer satisfaction occurred despite some inconvenience, such as having to remove doors and the usual scrapes, bumps and marring of walls to accommodate the moving of dryers into and out of the domiciles.
“Utility perspective. The theory is that when a utility (1) looses generation or (2) experiences a significant end-use industrial load at ‘power-up’ there is potential for underfrequency. To maintain stability with these sorts of grid-vagaries, WECC and other regional interconnect systems require that all participating utilities provide underfrequency load shed capabilities on a defined percent of their system’s substations (i.e., ‘droop settings’). For instance, PacifiCorp maintains a certain number of substations armed at a droop setting of 59.4 Hz. That is, if a particular underfrequency relay configured to a feeder registers 59.4 Hz for more than x-milliseconds, then the relay to that circuit will open. The circuit will remain open for a defined period or until the cause for the low frequency can be determined and fixed. All utilities within WECC have agreed to coordinate to ensure grid reliability.
“PacifiCorp like all other utilities also has ‘spinning reserve’ resources that can be engaged to mitigate against underfrequency conditions. The implicit but pivotal question raised by the Grid Friendly Appliance Project is can frequency-responsive end-use loads act as a complement to or eliminate altogether the need for underfrequency substation relays under the control of the utility or the need for spinning reserve? The answer to this question may more fundamentally rest on the economics of such a system.
“It is highly unlikely (in fact, predictable) that a passive, end-use load system will replace altogether the current system of strategically placed underfrequency relays throughout the utility’s grid. There are two reasons for this. First, the utility has the obligation to manage the system, not the customer. The customer can be a partner in this important utility operation, but it is not likely a utility (whether the utility is regulated or under municipal jurisdiction) will be willing to put the core operational integrity of their ‘grid’ at the risk of end use customers. Second, there is simply too much at risk and far too little to gain to support complete reliance on a

PNNL-17079
5.7
‘passive’ system. Displacing underfrequency relays currently at a nominal cost of about $2,500 per substation simply can’t offset the liabilities of system failure. It is not likely state regulatory bodies, regional reliability interconnect agencies or municipal governing bodies would consider the utility is prudent allowing a passive customer-centric system to sit at the core of its reliability operations.
“So, where does the underfrequency controller ‘fit’? Having said this, the autonomous Grid Friendly underfrequency controller can and should be integrated with the standard utility protections. But how? As previously mentioned, the electric grid has been designed from the get-go with two things in mind—safety and reliability. Safety is looked at from the perspective of the general public and of the electrical equipment itself. Reliability is fundamental to the regulatory compact between the utility and the regulatory bodies.
“When an underfrequency situation is detected, there are two and only two alternatives — (1) dump load or (2) add additional capacity. Either of these actions will accomplish the same two fundamental objectives of achieving safety and maintaining reliability. Underfrequency relays and their role in expeditiously dumping load have been discussed. PacifiCorp and all other electric utilities also have reliability requirements to maintain ‘spinning reserve.’ Spinning reserves are thermal generating resources that are synchronously operating with the utility’s system and output power can be allowed to flow into the grid within milliseconds. These resources, like the underfrequency relays at substations, are required for emergency situations. The difference with ‘spinning reserves’ is that they are extraordinarily expensive. The benefit, of course, is that they provide enhanced customer service in that they improve reliability and mitigate revenue loss which is a consequence of dumping load.
“So, where does the Grid Friendly underfrequency controller fit in all of this? Very simply, the ‘passive’, Grid Friendly controller can and should be ‘upstream’ to substation-armed underfrequency relays. ‘Up-stream’ simply means that the ‘trip-settings’ need to be more sensitive than the substation underfrequency relays. This would mean that the Grid Friendly appliances would sense and ‘trip’ to the underfrequency settings prior to the active sub-station system doing that same task. Together, the passive and active systems would work in harmony. The result would be a ‘redundant’ system capable of providing greater reliability and less customer service impact than the current ‘drop-the-entire-feeder’ approach. This in-series system would introduce a pervasive redundancy into the utility grid and would likely reduce the number of times the substation-armed underfrequency would trip; hence, improve power quality.
“The economics of such an approach are perhaps even more interesting. Assuming the underfrequency controller and the traditional substation underfrequency relay system prove effective, could the spinning reserve be removed from the equation? The economics of doing so represents a huge economic windfall. Certainly, and at this point this is only theoretical and one ought not to ‘get out over his skis’ on the basis of a single proof-of-concept demonstration project. Nevertheless, the potential cannot nor should not be ignored. At this point, caution would suggest that utilities would be ‘ill advised’ to pursue such a strategy based on a ‘passive’ design architecture. That is, with something as fundamental as underfrequency the electric grid can’t simply rely on equipment penetrations and coincident operation to ensure protections against underfrequency.

PNNL-17079
5.8
“Conclusion. While the autonomous Grid Friendly underfrequency controller may not be the Holy Grail of reliability, the potential benefits are difficult to ignore. Assuming market uptake on behalf of manufacturers and consumers, the strategy seems to offer appropriate risk and reward. If the utility can reduce or eliminate altogether the need for spinning reserves, there is the potential for significant and measured savings to all ratepayers. For years now there has been talk and certainly a plethora of industrial articles discussing the need to upgrade the 100-year-old electric grid—to modernize and better match utility systems with contemporary electronics to a 21st Century ‘solid state’ world.
“The trouble is that these sorts of decisions cannot and will not be made alone. Equipment manufacturers have to see an opportunity, consumers must realize value as must utility shareholders. Perhaps the easiest way to accomplish these disparate objectives is to (1) mandate the autonomous Grid Friendly underfrequency controller to equipment manufacturers selling into a specific geographic region and (2) provide a utility-based participation credit for each customer purchasing a grid-responsive end-use technology. Over time, and as this push / pull approach is carried out, the penetration of units will grow in the service territory. As this occurs, the utility can adjust downward the percent of spinning reserve. Savings from the avoided spinning reserves can be passed on to the consumer in the form of a participation credit or rate reduction or rate stabilization. Certainly this is all very futuristic, but it does provide a migratory road map for implementation and suggests the requisite research and regulatory decision making that will need attention if it is decided to move the technology forward.
“Irrespective, the autonomous Grid Friendly underfrequency controller represents a single step to the problem of improving grid reliability. Regulatory bodies, electric utilities and their ratepayers have much to gain in avoided spinning reserve costs and enhanced system reliability. The Grid Friendly Appliance Project proves the technology works. Grid-responsive load implementation and adoption as a roll-out proposition represents a huge effort but the benefits would be equally matched.”
5.1.3 Portland General Electric (PGE) Perspective The following perspective article was provided by Conrad Eustis, Director, Retail Technology
Development, PGE. PGE hosted the Grid Friendly Appliance project at its customers’ homes in Gresham, Oregon.
“PGE found the Grid Friendly Appliance Project to be a constructive process to demonstrate the advantages and disadvantages of an innovative technology. The collaboration of utilities, government agencies, and stakeholder industry leaders in the project brought much needed credibility and diverse input to the project.
“To summarize the findings from the technology trial that PGE finds most useful, the project demonstrated that (1) If implemented with care, utility-beneficial technology can exist in appliances with minimal impact to customer. (2) Using the appliance’s built-in controls to reduce load at the appliance looks promising as a way to reduce the cost of appliance control relative to retrofit technologies like direct load control. (3) The partnership of this project produced a useful synergy; specifically where appliance original equipment manufacturers (OEM) focus on creating appliance controls and intuitive user interfaces for customers and utilities focus on a minimal set

PNNL-17079
5.9
of load control commands. (4) At the beginning of the project, market penetration of suitably equipped broadband homes severely limited the customers that could participate. (5) The model of depending on the customer’s Internet provider (IP) broadband connectivity as a communication path to the appliance needs to be made easier to setup and more reliable. The security of this approach needs more examination. (6) The post project customer survey answered by 191 customers indicated that customers are highly supportive of an energy control paradigm where the utility sends price and/or control signals directly to the appliance, causing it to cut back on power use, as long as they can override the signal on a case by case basis in the user interface at the appliance. This response was selected 67% of the time compared to choices that included traditional utility direct load control (17%), price signals where the customer would self-manage the appliance (15%), or paying a 10% increase in price so they would not have to think at all about load control (1%). These results should be tempered by the fact these customers self-selected into the project and are more technology-savvy than most. Nevertheless the responses are based on informed opinion which is difficult to achieve from random research samples. Based on the simplicity of the solution and the condition of a simple override process, there is no reason to suspect that this choice wouldn’t be adopted by less informed customers when supported by their trusted advisors.
“One weakness of the Grid Friendly appliance technology, as implemented, comes from the power operations part of the electric business. In this trial, the underfrequency set point that triggers the autonomous load reduction at the appliance is assumed to be imbedded in the appliance at the time the appliance is manufactured. Power operations personnel are concerned that the underfrequency set points might need to be changed over the lifetime of the appliance because of gradual, long-term changes in the grid’s transient response. Do power transient differences between the West Coast, compared to say those in New England, mean the Grid Friendly controller board set points should be different by region? Appliances are added to the grid gradually. Years’ worth of appliances will be added before sufficient numbers are available for their effect to be noticeable and then, what if the fixed set point adds to system instability instead of improving it? Power Operations would like a way to easily change the set point.
“PGE adds the following comments as a logical consequence of the findings above.
“The obvious solution to a fixed set point in the Grid Friendly appliance logic is to add communications to the appliance so the set point can be changed. This adds considerable cost to an already difficult economic barrier for the appliance OEMs. Besides the cost increase, this also begs the question of which communication protocol should be implemented in the appliance. Can you bet that the selected communication technology will be viable over the entire life of the appliance?
“On the positive side, adding communications enables not only Grid Friendly controller set point flexibility but also much needed support for demand response. That is, once you design the appliance controls to accommodate Grid Friendly controller signals, and then if you add communications, you can use communication channel to access the appliance controls for direct load control and price responsive load reduction. Indeed, the Grid Friendly Appliance Project successfully tested interruption of water heater load over the same communication channel used initially only to record under frequency events in the Grid Friendly appliance experiment.

PNNL-17079
5.10
“PGE believes the solution is to design a physical interface at the appliance, a type of socket and message protocol defined by a standard that allows any communication device to be added, at any point in the future, and by the customer. The consumer-accessible socket connects to the appliance’s control logic much as the Grid Friendly controller card in this project did. The standard allows Grid Friendly control functions to be passed to the appliance from the communication module. The communication module has two functions. (1) Provide communication signals to the appliance through the socket, and (2) with Grid Friendly controller logic in the communication module, Grid Friendly control capability is added to the appliance when the communication module is resident. With the Grid Friendly controller board co-located in the communication module, the set points for autonomous the Grid Friendly function can be changed.
“In other words, if a standard is created, then for the cost of adding a socket in every major appliance a growing inventory of grid-ready, demand response-ready appliances is created with every customer purchase of a new appliance.
“Roughly 35 million major appliances are purchased every year. The average, coincident, summer-peak load contributed by these appliances is about 0.4 kW each, or 15 GW. In ten years this builds to and inventory of 150 GW or about 15% of the U.S. summer peak load ten years from now. If the incremental cost of adding the socket is $4 per appliance, then the cost of buying this ‘site license’ is about $10/kW. In 10 years, assuming a $15 communication module cost, and that utility programs could capture 60% of the ‘sites,’ then the total resource cost of building a 90-GW capacity resource would be about $27/kW ($10/60% + $15), or about $35/kW allowing for the opportunity cost of investing $4 per appliance ahead of the actual resource delivery date. This represents a net savings of at least $40 billion dollars compared to conventional peak-generation resources.”
5.2 An Appliance Manufacturer’s Perspective The following perspective was offered by Gale R. Horst, Lead Engineer, Advanced Electronic
Application at Whirlpool Corporation. Whirlpool Corporation collaborated with the project to integrate the underfrequency response of the GFA controller into the controls for the Sears Kenmore HE2 dryer that it manufacturers. Whirlpool provided 150 of these appliances to the project at a deeply discounted price.
“As an appliance manufacturer, Whirlpool Corporation has continually refined and perfected the processes performed by residential appliances. The first goal is to provide consumers with the cleanest clothes, spotless dishes, and maximum convenience at reasonable cost. The target of reasonable cost applies both to the cost of the product as well as the cost of use and ownership. An energy managed appliance fills two needs in that it can reduce the cost of ownership as well as providing a more eco-friendly product. An appliance manufacturer working together with the utility industry should be able to determine how modern appliance design can take grid issues as well as energy supply and demand into consideration for a breakthrough appliance design concept.
“When the Grid Friendly concept was presented by PNNL, it seemed a bit far-fetched at first glance. But after further discussion regarding potential implementation of Grid Friendly controller concepts in appliance controls, additional research was justified. Up to that time the

PNNL-17079
5.11
residential field tests conducted by utilities were focused on forced controls on the power source to the appliance such as a water heater. The power to the appliance was interrupted as a way to control demand.
“This piece of history from the historical perspective identified a key disconnect in the approach to energy controls for appliances. Generally speaking, residential appliances fall into two categories, persistent and process-oriented. A persistent appliance tends to operate independently to maintain something in a persistent state. For example, the water heater keeps warm water available while an HVAC system maintains the temperature in the residence. The consumer may not see or interface with their persistent appliances for days, months, or even years.
“In contrast, the process-oriented appliances perform a multi-step process involving a variety of critical factors. Much of the time these appliances perform a start-to-finish process involving multiple steps, sensors, temperatures and consumables. Generally these processes are performed upon other consumer products such as food, clothing, and dishes. The process-oriented appliances do not operate unless the consumer has interacted with the device. Consumers also have a passion for the appliances or at least for the food, clothing and dishes being processed.
“Considering the processes performed on the other consumer products and their interactive nature, one can ascertain the high degree of care that an appliance manufacturer must undertake to invoke any change in response to an external energy related request. Without such care, one could cause damage to consumer products via inadequate process temperatures, loss of the effectiveness of consumables (e.g. detergents), and most of all cause safety concerns. If any of these issues are not addressed adequately, consumer acceptance and satisfaction will suffer. As our partners in the utility industry verify, consumer acceptance is critical to a residential energy program.
“To effectively manage energy with either demand response or Grid Friendly features, these process-oriented appliance devices must have special energy considerations within the embedded electronic controls. The appliance must be designed to expect these energy events and correctly respond in a way that consumers will respect. One of the keys to this project was to determine what can be done automatically and what events require consumer interaction.
“Prior to the Grid Friendly Appliance Project, Whirlpool Corporation conducted an independent study on special appliance designs to help the consumer interact with time-based pricing, such as time-of-use (TOU) and real-time pricing (RTP). The ‘Woodridge Energy Study and Monitoring Pilot’ (Horst 2006) validated the results of several earlier consumer focus group sessions: (1) Consumers must alter their lifestyle to some degree to react to time-based energy pricing structures. (2) Consumers are willing to change their use times for certain process-oriented appliance products while others are considered non-changeable ones they would be more likely to override. (3) Appliance design can assist the consumer in dealing with time-based pricing. This project served well to narrow down consumer perceptions and bring a reality check to the concept only previously talked about. The results of this study were compiled into a report.
“Beyond the Woodridge study, a solo effort of any manufacturer of process-oriented appliances has limitations compared to the benefits enabled by a cooperative effort involving the energy industry, government, and other related technology providers. A focus on the needs and

PNNL-17079
5.12
expectations of residential consumers in a live test environment is necessary to help the appliance manufacture home in on specific energy technologies being considered. While Whirlpool focuses on the needs of its consumers, having a team that also drives the project from the needs of the utility industry was viewed as a necessary ingredient to ensure valid conclusions. Thus the Grid Friendly Appliance Project was determined to be a worthwhile investment in a cooperative learning effort.
“From an appliance perspective, the project team had to determine which appliance would be the best candidate for this research. Our qualifications included an appliance that consumed enough energy to be of interest. Each appliance type is used for a different purpose at different times of the day and an appliance manufacturer still needs to meet the consumer performance expectations for each product. Each consumer may have differing interactions with the appliance and the other consumer products involved in the process. Researchers need to understand how much of the appliance power can realistically be affected, at what time of day, during what phase of the process, and at what cost.
“Based on the above criterion, the electric clothes dryer easily became the prime candidate for this project. The dryer consumes well over 5 kW of power when operating. The dryer load curve shows a reasonable number of them (15-20%) are expected to be operating during the time of day when a grid event is likely to occur. Whirlpool Corporation was also in the process of designing a new electric clothes dryer with an electronic control where a software modification could be envisioned to handle the Grid Friendly controller events appropriately.
“The electronic control was a key point for the Whirlpool team. With a focus on consumer satisfaction, the electronic control software in the appliance would need to be modified to accommodate the Grid Friendly energy interruption. To do this the appliance will turn off the heating element during the grid frequency excursion which could last a few minutes. The drum and effectively, the cycle, must continue to completion. If the drum was stopped or if the power to the dryer were turned off at the source, safety specifications would not allow the dryer to restart by itself. On the other hand, a consumer will not notice the heating element going off for a few minutes since the heating element cycles off and on regularly during a normal drying cycle. However, the consumer would notice if their clothing was not dried to the extent desired as selected by the consumer at the dryer control panel.
“Timing the duration of a Grid Friendly controller event inside the control software along with data obtained from other internal sensors, the modified control is able to accommodate the interruption and continue the drying cycle as planned. If necessary, the control may extend the drying cycle by a few minutes to make up for the loss of heat during the grid underfrequency event. Whether responding to a grid event or the receipt of an external energy signal from a utility company, the electronic appliance control should be empowered to respond appropriately based on a number of internal parameters.
“What other appliances could participate? Appliances are often referred to as the second or third largest energy user in the residential environment. This may be true, but looking at the sum total energy from a group of appliances designed for various purposes doesn't imply that this energy consumption can be harnessed and managed with a single effort. Rather than looking at the aggregate sum total as if it were a single entity, one must look at each appliance individually.

PNNL-17079
5.13
“Each appliance type is used for a different purpose at different times of the day and one still needs to meet the consumer performance expectations for each product. Each consumer may have differing interactions with the appliance and the consumer products involved. Designers need to understand how much of the appliance power can realistically be affected, at what time of day, during what phase of the process, and at what cost. This project initiated work for a single appliance type. Similar work will need to be undertaken for various additional appliances. Consumer reaction and interaction issues must be studied relative to automated demand response and the interaction with a consumer appliance that, in turn, operates upon a consumer product. For example: (1) ranges, ovens, and cook-tops process food (2) refrigerator and freezer preserves food (3) washer and dryer process clothing (4) dishwasher performs a cleaning process on dishes.
“These consumer products (food, clothing, and dishes) have to be placed or removed by the consumer. An interrupted process could leave dirty dishes, dirty clothing, or food that has been improperly prepared or preserved. On a micro scale as compared with industrial customers, appliances execute critical processes. An interruption of the process could result in damage to a consumer product or unsatisfactory performance of the process.
“A particular appliance device may be able to reduce some or the entire load assuming the control is allowed to have energy decision-making authority. To include more appliance types into a program, one has to entrust some of the real-time decision making to the appliance itself.
“For example, assume that 10% of the refrigerators receiving an energy event notification would be caused to have an unsafe rise in temperature that could risk food spoilage. This would be more than enough risk to decide that refrigerators cannot participate in the energy program. On the other hand, assume that the refrigerator is allowed to say, ‘No, I cannot conserve at the moment because the consumer left the door open for a while and I have to get the temperature down to a safe level as quickly as possible’. In this case, having the intelligent control still allows the other 90% of the refrigerators to respond to the grid emergency or demand response request. As long as the appliance has the right to say ‘Sorry, not now,’ more appliances can be designed to participate.
“Thoughts from the business side. A project such as this forces differences in focus and the playing fields to the surface. The common business questions include: ‘Can you show me the business case?’ or ‘What will induce a consumer to want to own a product with this feature in lieu of a standard product?’ ‘Will there be government and utility incentives to encourage market transformation?’ Sometimes the appliance manufacturer has to remind its friends in the utility industry that appliance manufacturers operate in the free market. Although this sounds very fundamental, an appliance company spends money based on the anticipated (but non-guaranteed) financial return. An appliance business is accustomed to terms like ‘consumer value’, ‘market share’, and ‘return on investment’. When in program conversations with partners or associates in the utility industry, the appliance company must learn to understand unfamiliar phrases such as ‘rate case’, ‘cost per megawatt’, and ‘revenue neutral’.
“Currently, consumers are going to purchase their electric ‘product’ from their local utility. That is their only option. In the case of their appliance selection, consumers may purchase from an appliance company, a competitor, or not at all. In the appliance industry the appliance company does not have the equivalent of a public utility commission (PUC) to whom it petition

PNNL-17079
5.14
permission for a price increase to cover the cost of a modification that is to be paid for by consumers who are going to purchase its product ‘regardless.’ Assume an appliance company makes 5 million dryers a year (for illustration purposes). Now assume the addition of a Grid Friendly controller adds $2 to the cost of the dryer. This added cost will be taking $10 million of profit directly off of the bottom line if it is not recovered in incremental market share or by some other means. There is no guarantee that the appliance company will recover this additional $2 per unit and the consumer is not required to fund it.
“To compound this further, a consumer could feel that they are paying extra cost for a feature that makes their product inconvenient or more difficult to use. The business challenge is to either show the consumer a way the energy features save them far more than the cost delta, or keep the cost down or below standard pricing via incentives to the manufacturer.
“Assume the appliance manufacturer must recover or justify the cost in a similar way for each appliance category that is enabled with Grid Friendly controller technology. Perhaps one or more of the following methods could be considered:
“Increase the cost of the appliance - This requires extensive marketing effort to convince the consumer to select this product over other options from an appliance manufacturer and its competitors. There are substantial costs in marketing in addition to the added product cost. The added cost must be recovered on the increase in market share. If market share was 20% and now the product has 22% market share, that additional 2% would have to generate enough additional margin to recover the cost of adding the technology to the entire 22% of the market. This raises the question of whether utilities could offer consumer incentives to reduce the cost of ownership to a point where the purchase decision is motivated. This is a tall order that may be difficult to be considered by the manufacturer.
“Utility rebate to the consumer - Although this has been used extensively by past and current programs, it is subject to the same cost recovery as noted in the method above. It has historically been difficult to track and prove it’s effectiveness from the perspective of the appliance manufacturer. Although utility rebates were able to transform the marketplace with high efficiency front-load clothes washers, they are still somewhat difficult to accurately link to the bottom line.
“Rebates direct to the manufacturer - This could be done on a basis of per-product-manufactured. The difficulty is that products are manufactured in high volume without respect to what region the product will eventually be installed and utilized. For strictly Grid Friendly appliances, this may be a good alternative if one assumes every grid region will benefit. For the dispatched functions such as real-time price (RTP), many of the appliances might not be installed where this feature is utilized. The source of the funding (government, grid, individual utility) may affect how this method would be managed and justified.
“Grid rebate (possibly from the ISO/RTO) to the manufacturer - In this scenario, the rebate is based on the amount of grid response added into a specific grid region. This should also have an element derived from appliance design data to determine the ability of the particular appliance to meet the needs of the power grid. Product warranty registration could provide an effective method to track since regional data is included in the product registration process. There continues to be the issue regarding whether all grid regions are willing to contribute. Some may

PNNL-17079
5.15
be more inclined to participate than others. Then one still has the issue of adding cost to all appliances and a limited percentage of these are actually earning some sort of cost recovery.
“Grid Friendly becomes a government mandate - All manufacturers would have equal playing field having to support the mandated specification. This method may not be able to provide incentives for a better Grid Friendly controller implementation in the product. How would one ensure the effectiveness of each manufacturer’s implementation? Since the appliance designer has some element of freedom in how it responds to the various energy demand requests, there would have to be some testing and evaluation process to ensure appropriate compliance. In addition, some of the concepts have already secured patents. There will be some technology licensing issues for various technologies involved. Efforts would be required to develop appropriate design and test standards as well as to maintain their effectiveness over time.
“U.S. DOE initiatives such as the current Energy Star® program - Initiatives should be based in the ability of the technology to perform adequately in a particular appliance model. In other words, an element of competition may be desirable. If one manufacture or model reduces 2,000 watts during an underfrequency event while another only reduces 1,500, logic dictates that one should earn a more attractive incentive. Energy efficiency measurement formulas would need to ensure that no advantage can be gained when a grid event triggers in a less efficient appliance since it now has more energy available from which to conserve.
“Grid Friendly becomes a government sanctioned voluntary initiative - Similar to Energy Star®, manufacturers voluntary participate in a grid management initiative to reduce grid congestion. Government, product manufacturers, utilities, and grid system operators would jointly develop product and communication guidelines that would be policed by participants. Under the guidelines, manufacturers would have the opportunity to maintain product applications and protocols that fit within established guidelines. Rebates from various participants would serve to stimulate the market transformation, while managing increased production costs.
“Hybrid Rebate - As in any solution, there is always the combination solution. Consider a rebate or incentive that provides financial incentives for both the consumer selecting the product as well as the manufacturer of the device. Assume a consumer purchases an energy managed and Grid Friendly controller-enabled appliance in a region where the incentives exist. Each product ‘earns’ a rebate based on a formula designed around how well that particular model is able to manage energy. This could include Grid Friendly, demand response, and time-based pricing features.
“The total rebate should be computed based on a discounted energy cost. As a simplified example, assume the utility or RTO/ISO could be, in effect, transmitting and selling $200 worth of energy over the average life of the product. From there one may reverse amortize the present value to $100. Then discount again by 50% to arrive at a $50 rebate investment that is split between the consumer and the appliance manufacturer.
“The split may or may not be 50/50 depending on the cost of the modifications, the saturation expected, the projected curtailment, and revenue projections. Assume the rebate is $50 for our example. When the consumer registers their product or sends in the rebate card, the consumer receives a rebate of $30 while the manufacturer receives the other $20. This split may need to be driven by the break-even point for the appliance manufacturer. If one again assumes an
PNNL-17079
5.16
incremental cost of $2 per appliance, then if 10% of the appliances are sold in an area where the $20 rebate is offered, the incremental cost will have been recovered.
“A comprehensive discussion of these and other considerations is beyond the scope of this discussion. Our main point is that numerous creative solutions can be envisioned and evaluated to meet both program goals and manufacturer expenses. These need to be explored carefully to ensure that correct and effective incentives are applied.
“From the business perspective, the cost of development, higher product cost, and communication technologies need to be justified. The amount of energy that can be saved in a curtailment situation for example may not by itself justify installation of the infrastructure necessary to implement a single-purpose system focused on appliances. However, as an addition to a system that also addresses energy management for devices such as water heaters, pumps, and HVAC, the incremental cost to include consumer process-oriented appliances may be reasonable. The trend to roll out AMI infrastructures will support this type of program in the near future. With the Whirlpool dryer in the GridWise program, live data has been provided with which to evaluate the potential business justification from perspectives of the appliance manufacturer and the utility industry. This joint evaluation is intended to provide an equitable business proposition to both parties.”
5.3 An Appliance Owner’s Perspective Jerry and Pat Brous were two of the project’s most enthusiastic participants. Some of their statements
below refer to the companion Olympia Peninsula Project (Hammerstrom et al. 2007), its equipment, and activities. The reader is advised to also visit the appendix of this report, where the project’s residential participant survey results may be reviewed.
“I learned of the Testbed program while listening to an interview with the GridWise management team on a local radio station. As the program was described and the objectives presented I knew this is something I wanted to be a part of. I wasted no time in calling the number provided during the radio interview to sign up.
“From the first call I have experienced only the highest levels of professionalism from the GridWise Team and their business partners. It is fun and satisfying to be a participant with this exceptional organization.
“The equipment was efficiently installed in our home, the first on the Olympic Peninsula. It didn’t take long to recognize the value of the information provided from the system to the homeowner. I couldn’t wait to share this knowledge with neighbors, friends and anyone else showing the least bit of interest. Pat and I opened our home to all comers and for some time we had a fairly steady flow of people in to see what we had. Several neighbors signed up after seeing what the program could do for them and how easy it was to use.
“As the project progressed Pat and I learned a lot about how we use electricity and how we can conserve it. We also learned what our tolerance levels were and tweaked the settings to make the comfort level satisfactory for us a few times. We also tried the compact fluorescent lights in all lamps but soon found the light output was inadequate for us when reading and went back to the incandescent lights for that purpose.

PNNL-17079
5.17
“It is also great fun to sit at a picnic table in an RV park and jump on line through a Wi-Fi connection and tell the water heater and heat pump in our house to wake up and get to work, we’re coming home early. When we arrive home the house is warm and the water hot – a good deal indeed.
“The system provided many helpful reports to help us understand where, when and how much electricity we are using. Almost immediately the hot water heater was scheduled off through the night to avoid the 3 to 4 times it cycled on while we were asleep. A before and after check verified we did save kilowatts when we shut it off during the night.
“Overall, I feel we were able to reduce our electrical usage by 15% but most importantly we were rarely bothered as the Testbed program changed our heat pump, hot water heater & dryer settings. It certainly is something we could easily live with in the future — we did for the past year with no significant problem.
“We like the idea of taking a little from all to meet peak load demands and to postpone or stop the need for new infrastructure.
“From January 2006 Through March 2007 we used 20,236 kilowatt-hours of electricity, and here is how it broke down by appliance: Water heater 21 %; Heat Pump 19 %; Dryer 4 % and everything else 56 %.”

PNNL-17079
5.18

PNNL-17079
6.1
6.0 Conclusions The main project conclusions were as follows:
1. As per experimental design for the chosen frequency set point, the project experienced approximately 1 event per day over the course of the experiment. A total of 358 events were recognized and analyzed during the field experimentation.
2. The autonomous Grid Friendly underfrequency load-shedding controllers worked reliably and in concert over a geographically large area. The controllers apparently observed virtually the same frequency information from each electrical wall circuit, as was evident from their unanimous response within a narrow frequency band around their design-frequency threshold.
3. Typical underfrequency events were short. The majority of observed underfrequency events were 16 seconds long, the minimum duration that was allowed by the controller for this experiment. The longest event observed was about 10 minutes.
4. The effect of the underfrequency events on residents’ appliances was largely transparent to the appliance owners. The survey of appliance owners revealed that no residential participants became seriously inconvenienced or even aware that their appliances were being affected by the over 300 underfrequency events.
5. The value of each frequency-responsive appliance was assessed based on the appliance type’s likelihood that it would be operating and its load shed at the time underfrequency events occurred. It was found that the likelihood of underfrequency excursions was unpredictable by time of day and showed a minor tendency to increase in summer. However, the load shapes of the water heaters and dryers were quite predictable. Statistically speaking, the curtailment of the 50 project water heaters resulted in from 5 to 35 kW of load reduction, and the 150 dryers resulted in 3 to 30 kW of load reduction, depending on time of day.
6. It was further demonstrated that, with the addition of communications, the GFA controller can facilitate and will not deter the application of conventional demand-response curtailments.
7. An intermediate level of controller integration was demonstrated through a collaboration of Whirlpool Corporation, Invensys Controls, and PNNL. This level of integration demonstrated the function adequately, but it did not allow the project to demonstrate a technology pathway to a favorable, attractive system price.
In short, the Grid Friendly Project succeeded in demonstrating the reliability of and opportunity for grid-responsive underfrequency protection controllers like the GFA controller.
The following future research and development is suggested:
1. The scale of the present project was perhaps inadequate to convince skeptics of the capability of numerous GFA controllers to truly affect and correct system frequency. One alternative is a computer simulation of system-wide behaviors showing more global application and higher device penetrations than can be economically demonstrated at pilot scale. Another opportunity will evolve as the need arises to protect electrically islanded power systems, where GFA

PNNL-17079
6.2
controllers could indeed be installed in quantities adequate to significantly affect and control system frequency.
2. Some skeptics, while accepting the value of frequency-responsive curtailment for matching load and generation resources, question the potential for the technology to inadvertently excite dynamic system modes. Here too, additional simulation will be helpful.
3. The commercialization of appliance controllers requires more work to tie the economic benefits to the implementation costs. For example, how can one ask the appliance manufacturer and his customer to pay for this hardware controller that provides a universal benefit to the entire power grid? The solution perhaps lies in the imposition of mandatory or voluntary appliance standards to further drive implementation costs out of the solution.
4. Universal demand-response interfaces should be adopted such that all appliances are purchased ready to respond to available programs and their demand-response signals. In the case of autonomous responses like that demonstrated for the GFA controller, the interface would anticipate such autonomous signals, and the appliance would be ready to conduct a reasonable, useful appliance-level response upon receipt of such signals. In the case of more traditional directed demand response, the universal appliance interface must provide inputs for communicating modules that can deliver the demand-response signals to the loads. Regardless, the interface should negate the need for skilled installers as are often required now by utility demand-response programs.
5. The value of the GFA controller will be perhaps enhanced by its response to multiple control signals. The load controller should monitor not only frequency, but also voltage and, if communications are provided, it might become responsive to price and conventional demand-response inputs, too. The vision is to both reduce the cost of the grid-responsive controller and to provide additional functions that will make the same device serve as many valuable grid-protection and control functions as possible.

PNNL-17079
7.1
7.0 References Bonneville Power Administration (BPA). 2006. “Energy Efficiency Technology Road Map.” Portland, OR, July 2006. Available at www.bpa.gov/corporate/business/innovation.
Cannon Technologies. 2005. Hawaiian Electric Company Cites Under-Frequency Protection as a Key Benefit of Direct Load Management Program. Cooper Power Systems, 2005 Press Releases, July 18, 2005. Cannon Technologies, Inc., Minneapolis, Minnesota. Accessed at http://www.cannontech.com/news/pressreleases/071805.asp.
Chassin DP, Z Huang, MK Donnelly, C Hassler, E. Ramirez, and C Ray. 2005. ”Estimation of WECC System Inertia Using Observed Frequency Transients,” In IEEE Trans. on Power Systems, Vol. 20, No. 2, pp. 1190-1192.
Gilfillan I. 2003. Mastering MySQL 4. SYBEX, Inc., Alameda, CA.
GridWise. 2007. ”Grid Monitor Screensaver,” GridWise at PNNL: Developing Transactive Technologies. Accessed at http://gridwise.pnl.gov/technologies/transactive_controls.stm.
Hammerstrom DJ, R Ambrosio, TA Carlon, DP Chassin, JG DeSteese, RT Guttromson, OM Jarvegren, R Kajfasz, S Katipamula, P Michie, T Oliver, and RG Pratt. 2007. Pacific Northwest GridWise Testbed Projects: Part 1. Olympic Peninsula Project, PNNL-17167, Pacific Northwest National Laboratory, Richland, Washington, October 2007.
Horst G. 2006. “Whirlpool Corporation Woodridge Energy Study and Monitoring Pilot,” [online] http://ciee.ucop.edu/dretd/documents/Woodridge%20Final%20Report.pdf.
Lu N and DJ Hammerstrom. 2006. “Design Considerations for Frequency Responsive Grid Friendly Appliances." In 2005/2006 IEEE/PES Transmission and Distribution Conference and Exhibition, 21-24 May 2006, Dallas, TX, USA, pp. 647-652. Institute of Electrical and Electronics Engineers, Piscataway, NJ.
Silberman S. 2001. “The Energy Web,” Wired News, Issue 9.07, July 2001. Available at http://www.wired.com/wired/archive/9.07/juice_pr.html.
Trudnowski D, M Donnelly, and E Lightner. 2006. “Power-System Frequency and Stability Control using Decentralized Intelligent Loads.” In IEEE Power Engineering Society Transmission and Distribution 2005/2006, May 21-24, 2006, pp. 1453-1459.
Virginia Tech – Bradley Department of Electrical and Computer Engineering, Virginia Tech. 2007. GPS/Internet-based Frequency Monitoring Network (FNET) Design. Accessed September 2007 at http://www.powerit.vt.edu/Fnet.htm.
Xu Z, J Østergaard, M Togeby, and C Marcus-Møller. 2007. “Design and modeling of thermostatically controlled loads as frequency controlled reserve.” In Power Engineering Society General Meeting, 2007. June 24-28, 2007, Tampa, Florida, pp. 1-6.

PNNL-17079
7.2
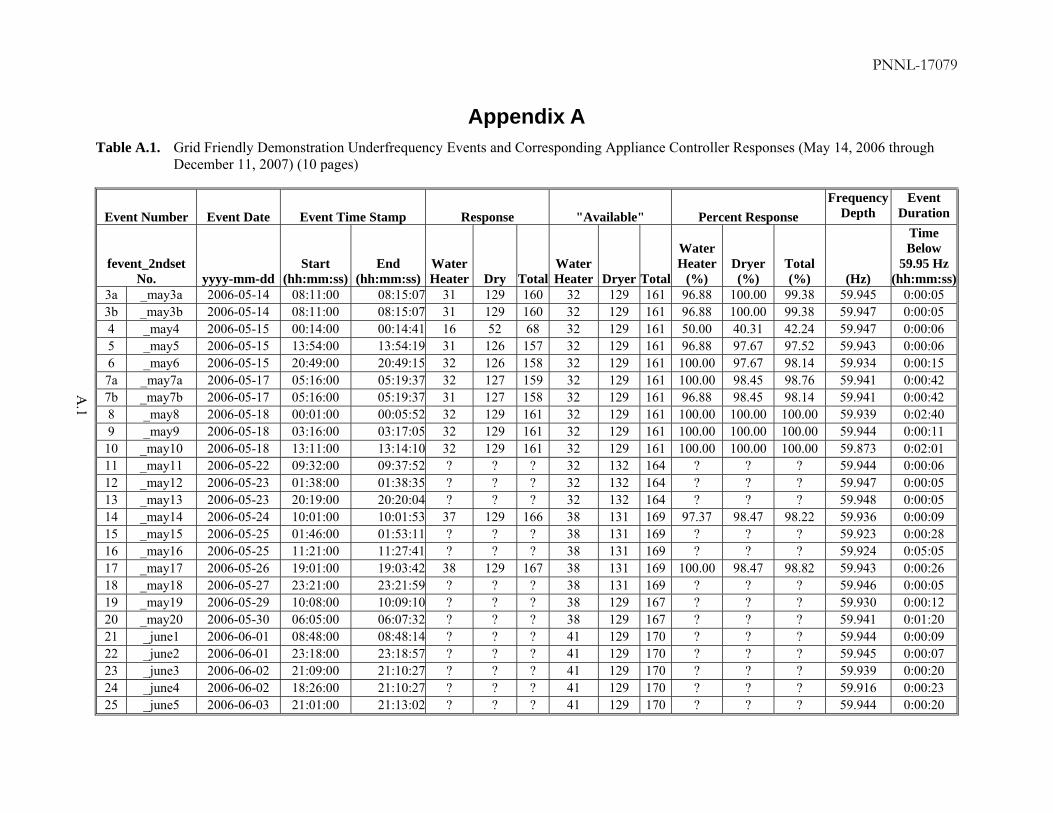
PNNL-17079
A.1
Appendix A Table A.1. Grid Friendly Demonstration Underfrequency Events and Corresponding Appliance Controller Responses (May 14, 2006 through
December 11, 2007) (10 pages)
Event Number Event Date Event Time Stamp Response "Available" Percent Response Frequency
Depth Event
Duration
fevent_2ndset No. yyyy-mm-dd
Start (hh:mm:ss)
End (hh:mm:ss)
Water Heater Dry Total
Water Heater Dryer Total
Water Heater
(%) Dryer (%)
Total (%) (Hz)
Time Below
59.95 Hz (hh:mm:ss)
3a _may3a 2006-05-14 08:11:00 08:15:07 31 129 160 32 129 161 96.88 100.00 99.38 59.945 0:00:05 3b _may3b 2006-05-14 08:11:00 08:15:07 31 129 160 32 129 161 96.88 100.00 99.38 59.947 0:00:05 4 _may4 2006-05-15 00:14:00 00:14:41 16 52 68 32 129 161 50.00 40.31 42.24 59.947 0:00:06 5 _may5 2006-05-15 13:54:00 13:54:19 31 126 157 32 129 161 96.88 97.67 97.52 59.943 0:00:06 6 _may6 2006-05-15 20:49:00 20:49:15 32 126 158 32 129 161 100.00 97.67 98.14 59.934 0:00:15 7a _may7a 2006-05-17 05:16:00 05:19:37 32 127 159 32 129 161 100.00 98.45 98.76 59.941 0:00:42 7b _may7b 2006-05-17 05:16:00 05:19:37 31 127 158 32 129 161 96.88 98.45 98.14 59.941 0:00:42 8 _may8 2006-05-18 00:01:00 00:05:52 32 129 161 32 129 161 100.00 100.00 100.00 59.939 0:02:40 9 _may9 2006-05-18 03:16:00 03:17:05 32 129 161 32 129 161 100.00 100.00 100.00 59.944 0:00:11
10 _may10 2006-05-18 13:11:00 13:14:10 32 129 161 32 129 161 100.00 100.00 100.00 59.873 0:02:01 11 _may11 2006-05-22 09:32:00 09:37:52 ? ? ? 32 132 164 ? ? ? 59.944 0:00:06 12 _may12 2006-05-23 01:38:00 01:38:35 ? ? ? 32 132 164 ? ? ? 59.947 0:00:05 13 _may13 2006-05-23 20:19:00 20:20:04 ? ? ? 32 132 164 ? ? ? 59.948 0:00:05 14 _may14 2006-05-24 10:01:00 10:01:53 37 129 166 38 131 169 97.37 98.47 98.22 59.936 0:00:09 15 _may15 2006-05-25 01:46:00 01:53:11 ? ? ? 38 131 169 ? ? ? 59.923 0:00:28 16 _may16 2006-05-25 11:21:00 11:27:41 ? ? ? 38 131 169 ? ? ? 59.924 0:05:05 17 _may17 2006-05-26 19:01:00 19:03:42 38 129 167 38 131 169 100.00 98.47 98.82 59.943 0:00:26 18 _may18 2006-05-27 23:21:00 23:21:59 ? ? ? 38 131 169 ? ? ? 59.946 0:00:05 19 _may19 2006-05-29 10:08:00 10:09:10 ? ? ? 38 129 167 ? ? ? 59.930 0:00:12 20 _may20 2006-05-30 06:05:00 06:07:32 ? ? ? 38 129 167 ? ? ? 59.941 0:01:20 21 _june1 2006-06-01 08:48:00 08:48:14 ? ? ? 41 129 170 ? ? ? 59.944 0:00:09 22 _june2 2006-06-01 23:18:00 23:18:57 ? ? ? 41 129 170 ? ? ? 59.945 0:00:07 23 _june3 2006-06-02 21:09:00 21:10:27 ? ? ? 41 129 170 ? ? ? 59.939 0:00:20 24 _june4 2006-06-02 18:26:00 21:10:27 ? ? ? 41 129 170 ? ? ? 59.916 0:00:23 25 _june5 2006-06-03 21:01:00 21:13:02 ? ? ? 41 129 170 ? ? ? 59.944 0:00:20

PNNL-17079
A.2
Table A.1. Grid Friendly Demonstration Underfrequency Events and Corresponding Appliance Controller Responses (May 14, 2006 through December 11, 2007) (10 pages)
Event Number Event Date Event Time Stamp Response "Available" Percent Response Frequency
Depth Event
Duration
fevent_2ndset No. yyyy-mm-dd
Start (hh:mm:ss)
End (hh:mm:ss)
Water Heater Dry Total
Water Heater Dryer Total
Water Heater
(%) Dryer (%)
Total (%) (Hz)
Time Below
59.95 Hz (hh:mm:ss)
26 _june6 2006-06-03 23:07:00 23:07:36 ? ? ? 41 129 170 ? ? ? 59.945 0:00:10 27 _june7 2006-06-05 06:48:00 06:52:13 ? ? ? 41 129 170 ? ? ? 59.914 0:03:37 28 _june8 2006-06-07 11:20:00 11:20:41 40 123 163 41 123 164 97.56 100.00 99.39 59.929 0:00:14 29 _june9 2006-06-08 06:17:00 06:18:23 41 123 164 41 123 164 100.00 100.00 100.00 59.947 0:00:11 30 _june10 2006-06-09 09:38:00 09:38:48 40 123 163 41 123 164 97.56 100.00 99.39 59.940 0:00:30 31 _june11 2006-06-12 06:25:00 06:25:41 9 44 53 41 123 164 21.95 35.77 32.32 59.947 0:00:07 32 _june12 2006-06-12 07:04:00 07:04:25 3 13 16 41 123 164 7.32 10.57 9.76 59.948 0:00:03 33 _june13 2006-06-12 09:47:00 09:47:33 41 122 163 41 123 164 100.00 99.19 99.39 59.947 0:00:04 34 _june14 2006-06-12 10:11:00 10:12:03 40 119 159 41 123 164 97.56 96.75 96.95 59.933 0:00:17 35 _june15 2006-06-12 13:46:00 13:48:01 38 121 159 39 123 162 97.44 98.37 98.15 59.942 0:00:10 36a _june16a 2006-06-13 17:08:00 17:31:09 39 120 159 39 123 162 100.00 97.56 98.15 59.935 0:00:07 36b _june16b 2006-06-13 17:08:00 17:31:09 38 119 157 39 123 162 97.44 96.75 96.91 59.946 0:00:03 37 _june17 2006-06-14 01:12:00 01:12:31 39 120 159 39 123 162 100.00 97.56 98.15 59.945 0:00:08 38a _june18a 2006-06-15 22:10:00 22:11:15 38 117 155 39 123 162 97.44 95.12 95.68 59.943 0:00:08 38b _june18b 2006-06-15 22:10:00 22:11:15 14 32 46 39 123 162 35.90 26.02 28.40 59.948 0:00:03 39 _june19 2006-06-16 08:10:00 08:11:40 14 30 44 39 123 162 35.90 24.39 27.16 59.948 0:00:06 40 _june20 2006-06-17 01:50:00 01:54:59 38 122 160 39 123 162 97.44 99.19 98.77 59.829 0:04:30 41 _june21 2006-06-17 02:11:00 02:12:05 38 128 166 39 130 169 97.44 98.46 98.22 59.944 0:00:13 42 _june22 2006-06-18 00:05:00 00:12:39 38 122 160 39 123 162 97.44 99.19 98.77 59.920 0:00:40 43 _june23 2006-06-18 14:25:00 14:25:18 38 123 161 39 123 162 97.44 100.00 99.38 59.945 0:00:05 44 _june24 2006-06-18 16:04:00 16:04:59 38 120 158 39 123 162 97.44 97.56 97.53 59.935 0:00:09 45a _june25a 2006-06-22 13:16:00 13:48:56 40 119 159 40 123 163 100.00 96.75 97.55 59.946 0:00:10 45b _june25b 2006-06-22 13:16:00 13:48:56 9 22 31 40 123 163 22.50 17.89 19.02 59.947 0:00:06 46 _june26 2006-06-23 00:10:00 00:11:03 39 117 156 40 123 163 97.50 95.12 95.71 59.937 0:00:15 47 _june27 2006-06-24 02:37:00 02:38:14 40 122 162 40 123 163 100.00 99.19 99.39 59.903 0:01:02 48 _june28 2006-06-26 09:46:00 09:46:42 40 130 170 40 130 170 100.00 100.00 100.00 59.942 0:00:11 49a _june29a 2006-06-28 11:42:00 11:43:07 39 121 160 40 123 163 97.50 98.37 98.16 59.941 0:00:03

PNNL-17079
A.3
Table A.1. Grid Friendly Demonstration Underfrequency Events and Corresponding Appliance Controller Responses (May 14, 2006 through December 11, 2007) (10 pages)
Event Number Event Date Event Time Stamp Response "Available" Percent Response Frequency
Depth Event
Duration
fevent_2ndset No. yyyy-mm-dd
Start (hh:mm:ss)
End (hh:mm:ss)
Water Heater Dry Total
Water Heater Dryer Total
Water Heater
(%) Dryer (%)
Total (%) (Hz)
Time Below
59.95 Hz (hh:mm:ss)
49b _june29b 2006-06-28 11:42:00 11:43:07 40 123 163 40 123 163 100.00 100.00 100.00 59.918 0:00:24 50 _june30 2006-06-29 08:37:00 08:42:03 40 118 158 40 123 163 100.00 95.93 96.93 59.900 0:04:20 51 _june31 2006-06-30 01:38:00 01:40:32 39 121 160 40 123 163 97.50 98.37 98.16 59.982 0:02:06 52 _june32 2006-06-30 09:03:00 09:13:01 39 118 157 40 123 163 97.50 95.93 96.32 59.875 0:07:15 53 _july1 2006-07-01 14:20:00 14:31:52 40 123 163 40 123 163 100.00 100.00 100.00 59.887 0:00:40 54 _july2 2006-07-01 19:29:00 19:30:17 39 127 166 40 130 170 97.50 97.69 97.65 59.907 0:00:17 55 _july3 2006-07-02 01:04:00 01:05:00 39 130 169 40 130 170 97.50 100.00 99.41 59.944 0:00:08 56 _july4 2006-07-02 04:00:00 04:00:28 39 130 169 40 130 170 97.50 100.00 99.41 59.944 0:00:08 57 _july5 2006-07-02 17:03:00 17:04:46 39 123 162 40 123 163 97.50 100.00 99.39 59.905 0:00:25 58 _july6 2006-07-02 20:18:00 20:18:50 39 123 162 40 123 163 97.50 100.00 99.39 59.944 0:00:07 59 _july7 2006-07-03 07:45:00 07:45:53 39 118 157 40 123 163 97.50 95.93 96.32 59.944 0:00:07 60 _july8 2006-07-03 11:33:00 11:33:40 13 37 50 40 123 163 32.50 30.08 30.67 59.948 0:00:07 61 _july9 2006-07-03 12:03:00 12:33:00 39 118 157 40 123 163 97.50 95.93 96.32 59.894 0:01:00 62 _july10 2006-07-03 17:11:00 17:11:20 5 18 23 40 123 163 12.50 14.63 14.11 59.949 0:00:03 63 _july11 2006-07-04 07:48:00 07:50:45 39 117 156 40 123 163 97.50 95.12 95.71 59.941 0:00:20 64 _july12 2006-07-04 23:05:00 23:07:53 39 121 160 40 123 163 97.50 98.37 98.16 59.917 0:00:50 65 _july13 2006-07-05 13:35:00 13:35:41 39 119 158 40 123 163 97.50 96.75 96.93 59.945 0:00:04 66 _july14 2006-07-06 22:09:00 22:10:46 40 123 163 40 123 163 100.00 100.00 100.00 59.937 0:00:30 67 _july15 2006-07-06 23:11:00 23:11:58 0 14 14 40 123 163 0.00 11.38 8.59 59.949 0:00:00 68 _july16 2006-07-07 00:08:00 00:18:10 40 123 163 40 123 163 100.00 100.00 100.00 59.945 0:00:20 69 _july17 2006-07-07 07:03:00 07:04:14 40 120 160 40 123 163 100.00 97.56 98.16 59.921 0:00:34 70 _july18 2006-07-09 00:58:00 00:58:10 35 102 137 40 123 163 87.50 82.93 84.05 59.947 0:00:05 71 _july19 2006-07-10 00:08:00 00:11:54 40 130 170 40 130 170 100.00 100.00 100.00 59.946 0:00:02 72 _july20 2006-07-11 13:37:00 13:37:58 39 130 169 40 130 170 97.50 100.00 99.41 59.938 0:00:11 73a _july21a 2006-07-13 08:13:00 08:36:27 39 130 169 40 130 170 97.50 100.00 99.41 59.930 0:00:10 73b _july21b 2006-07-13 08:13:00 08:36:27 39 127 166 40 130 170 97.50 97.69 97.65 59.918 0:00:16 74 _july22 2006-07-13 16:15:00 16:19:45 39 130 169 40 130 170 97.50 100.00 99.41 59.883 0:01:44

PNNL-17079
A.4
Table A.1. Grid Friendly Demonstration Underfrequency Events and Corresponding Appliance Controller Responses (May 14, 2006 through December 11, 2007) (10 pages)
Event Number Event Date Event Time Stamp Response "Available" Percent Response Frequency
Depth Event
Duration
fevent_2ndset No. yyyy-mm-dd
Start (hh:mm:ss)
End (hh:mm:ss)
Water Heater Dry Total
Water Heater Dryer Total
Water Heater
(%) Dryer (%)
Total (%) (Hz)
Time Below
59.95 Hz (hh:mm:ss)
75 _july23 2006-07-15 07:39:00 07:39:56 33 114 147 40 123 163 82.50 92.68 90.18 59.947 0:00:06 76 _july24 2006-07-17 07:37:00 07:37:35 39 125 164 40 130 170 97.50 96.15 96.47 59.940 0:00:06 77 _july25 2006-07-21 09:51:00 09:51:58 40 130 170 40 130 170 100.00 100.00 100.00 59.921 0:00:19 78 _july26 2006-07-22 13:09:00 13:09:49 40 127 167 40 130 170 100.00 97.69 98.24 59.931 0:00:11 79 _july27 2006-07-22 17:03:00 17:03:59 1 11 12 40 130 170 2.50 8.46 7.06 59.949 0:00:00 80 _july28 2006-07-23 06:56:00 06:56:21 40 130 170 40 130 170 100.00 100.00 100.00 59.937 0:00:11 81a _july29a 2006-07-24 07:53:00 07:53:59 40 130 170 41 130 171 97.56 100.00 99.42 59.922 0:00:26 81b _july29b 2006-07-24 07:53:00 07:53:59 20 44 64 41 130 171 48.78 33.85 37.43 59.948 0:00:03 82 _july30 2006-07-24 10:37:00 10:38:13 39 124 163 41 130 171 95.12 95.38 95.32 59.924 0:00:14 83 _july31 2006-07-24 11:25:00 11:25:17 40 129 169 41 130 171 97.56 99.23 98.83 59.929 0:00:18 84 _july32 2006-07-24 12:24:00 12:24:21 40 130 170 41 130 171 97.56 100.00 99.42 59.934 0:00:10 85a _july33a 2006-07-24 15:29:00 15:41:05 41 130 171 41 130 171 100.00 100.00 100.00 59.826 0:01:58 85b _july33b 2006-07-24 15:29:00 15:41:05 41 130 171 41 130 171 100.00 100.00 100.00 59.935 0:00:40 85c _july33c 2006-07-24 15:29:00 15:41:05 39 130 169 41 130 171 95.12 100.00 98.83 59.917 0:00:30 86a _july34a 2006-07-25 21:29:00 21:35:19 40 124 164 41 130 171 97.56 95.38 95.91 59.945 0:00:09 86b _july34b 2006-07-25 21:29:00 21:35:19 41 125 166 41 130 171 100.00 96.15 97.08 59.928 0:00:20 87 _july35 2006-07-26 00:03:00 00:11:44 40 130 170 41 130 171 97.56 100.00 99.42 59.935 0:01:10 88 _july36 2006-07-26 01:14:00 01:15:20 41 130 171 41 130 171 100.00 100.00 100.00 59.927 0:00:30 89 _july37 2006-07-26 07:34:00 07:36:47 41 130 171 41 130 171 100.00 100.00 100.00 59.868 0:01:24 90 _july38 2006-07-26 15:18:00 15:18:42 41 127 168 41 130 171 100.00 97.69 98.25 59.942 0:00:07 91 _july39 2006-07-28 00:28:00 00:28:45 37 93 130 41 130 171 90.24 71.54 76.02 59.946 0:00:05 92 _july40 2006-07-29 13:11:14 13:11:14 ? ? ? 41 130 171 ? ? ? 59.941 0:00:00 93 _july41 2006-07-29 23:13:00 23:13:17 40 130 170 41 130 171 97.56 100.00 99.42 59.943 0:00:10 94a _july42a 2006-07-30 00:12:00 00:49:14 40 121 161 41 123 164 97.56 98.37 98.17 59.943 0:00:35 94b _july42b 2006-07-30 00:12:00 00:49:14 40 121 161 41 123 164 97.56 98.37 98.17 59.941 0:00:06 95 _july43 2006-07-30 01:55:00 01:55:08 5 12 17 41 123 164 12.20 9.76 10.37 59.949 0:00:01 96a _aub1a 2006-08-01 00:10:00 00:21:54 28 79 107 41 123 164 68.29 64.23 65.24 59.947 0:00:05

PNNL-17079
A.5
Table A.1. Grid Friendly Demonstration Underfrequency Events and Corresponding Appliance Controller Responses (May 14, 2006 through December 11, 2007) (10 pages)
Event Number Event Date Event Time Stamp Response "Available" Percent Response Frequency
Depth Event
Duration
fevent_2ndset No. yyyy-mm-dd
Start (hh:mm:ss)
End (hh:mm:ss)
Water Heater Dry Total
Water Heater Dryer Total
Water Heater
(%) Dryer (%)
Total (%) (Hz)
Time Below
59.95 Hz (hh:mm:ss)
96b _aug1b 2006-08-01 00:10:00 00:21:54 40 121 161 41 123 164 97.56 98.37 98.17 59.944 0:00:14 97 _aug2 2006-08-02 16:13:00 16:13:43 41 123 164 41 123 164 100.00 100.00 100.00 59.929 0:00:14 98 _aug3 2006-08-02 19:58:00 20:00:00 39 117 156 41 123 164 95.12 95.12 95.12 59.934 0:00:13 99 _aug4 2006-08-02 20:00:00 20:10:44 40 125 165 41 125 166 97.56 100.00 99.40 59.907 0:10:12
100 _aug5 2006-08-04 12:50:00 12:50:12 7 30 37 41 123 164 17.07 24.39 22.56 59.948 0:00:02 101 _aug6 2006-08-04 13:44:35 13:44:36 4 19 23 41 123 164 9.76 15.45 14.02 59.948 0:00:01 102 _aug7 2006-08-06 04:12:00 04:12:49 38 122 160 39 123 162 97.44 99.19 98.77 59.946 0:00:04 103 _aug8 2006-08-06 05:11:00 05:11:06 3 23 26 39 123 162 7.69 18.70 16.05 59.949 0:00:00 104 _aug9 2006-08-06 06:48:00 06:48:27 39 119 158 39 123 162 100.00 96.75 97.53 59.947 0:00:05 105a _aug10a 2006-08-06 07:30:00 07:49:27 39 130 169 39 130 169 100.00 100.00 100.00 59.944 0:00:10 105b _aug10b 2006-08-06 07:30:00 07:49:27 39 128 167 39 130 169 100.00 98.46 98.82 59.947 0:00:05 106 _aug11 2006-08-06 08:45:00 08:45:36 5 12 17 39 130 169 12.82 9.23 10.06 59.949 0:00:00 107 _aug12 2006-08-06 21:20:00 21:20:33 38 127 165 39 130 169 97.44 97.69 97.63 59.918 0:00:14 108 _aug13 2006-08-09 06:33:00 06:33:00 ? ? ? 39 130 169 ? ? ? 59.929 0:00:00 109 _aug14 2006-08-11 23:27:25 23:27:33 38 130 168 39 130 169 97.44 100.00 99.41 59.940 0:00:07 110 _aug15 2006-08-11 00:09:05 00:09:11 22 39 61 39 130 169 56.41 30.00 36.09 59.948 0:00:03 111 _aug16 2006-08-11 01:25:15 01:25:29 39 129 168 39 130 169 100.00 99.23 99.41 59.941 0:00:13 112 _aug17 2006-08-11 22:06:34 22:06:37 39 130 169 39 130 169 100.00 100.00 100.00 59.949 0:00:00 113 _aug18 2006-08-12 17:26:24 17:26:41 39 130 169 39 130 169 100.00 100.00 100.00 59.903 0:00:16 114 _aug19 2006-08-13 06:05:24 06:05:25 ? ? ? 39 130 169 ? ? ? 59.930 0:00:00 115 _aug20 2006-08-15 14:36:18 14:36:27 39 130 169 39 130 169 100.00 100.00 100.00 59.943 0:00:08 116 _aug21 2006-08-18 23:11:04 23:11:04 0 2 2 39 130 169 0.00 1.54 1.18 59.949 0:00:00 117 _aug22 2006-08-19 23:07:04 23:46:21 39 130 169 39 130 169 100.00 100.00 100.00 59.925 0:00:14 118 _aug23 2006-08-20 07:15:38 07:16:15 38 129 167 39 130 169 97.44 99.23 98.82 59.935 0:00:31 119 _aug24 2006-08-21 12:41:01 12:41:12 39 130 169 39 130 169 100.00 100.00 100.00 59.939 0:00:09 120 _aug25 2006-08-22 13:10:10 13:15:10 39 128 167 39 130 169 100.00 98.46 98.82 59.937 0:00:00 121 _aug26 2006-08-22 22:06:06 22:06:09 0 13 13 39 130 169 0.00 10.00 7.69 59.949 0:00:00

PNNL-17079
A.6
Table A.1. Grid Friendly Demonstration Underfrequency Events and Corresponding Appliance Controller Responses (May 14, 2006 through December 11, 2007) (10 pages)
Event Number Event Date Event Time Stamp Response "Available" Percent Response Frequency
Depth Event
Duration
fevent_2ndset No. yyyy-mm-dd
Start (hh:mm:ss)
End (hh:mm:ss)
Water Heater Dry Total
Water Heater Dryer Total
Water Heater
(%) Dryer (%)
Total (%) (Hz)
Time Below
59.95 Hz (hh:mm:ss)
122 _aug27 2006-08-23 00:20:03 00:20:09 36 130 166 37 130 167 97.30 100.00 99.40 59.944 0:00:05 123 _aug28 2006-08-24 08:45:36 08:45:36 0 1 1 37 130 167 0.00 0.77 0.60 59.949 0:00:00 124 _aug29 2006-08-25 22:04:35 22:05:03 25 57 82 37 130 167 67.57 43.85 49.10 59.947 0:00:06 125 _aug30 2006-08-26 01:35:58 01:36:00 39 130 169 39 130 169 100.00 100.00 100.00 59.947 0:00:02 126 _aug31 2006-08-26 14:30:40 14:30:46 39 130 169 39 130 169 100.00 100.00 100.00 59.945 0:00:04 127 _aug32 2006-08-27 19:31:24 19:53:25 38 128 166 39 130 169 97.44 98.46 98.22 59.942 0:00:10 128a _aug33a 2006-08-28 00:06:54 00:27:48 34 123 157 35 123 158 97.14 100.00 99.37 59.920 0:02:43 128b _aug33b 2006-08-28 00:06:54 00:27:48 34 123 157 35 123 158 97.14 100.00 99.37 59.945 0:00:10 128c _aug33c 2006-08-28 00:06:54 00:27:48 34 102 136 35 123 158 97.14 82.93 86.08 59.947 0:00:07 128d _aug33d 2006-08-28 00:06:54 00:27:48 35 98 133 35 123 158 100.00 79.67 84.18 59.947 0:00:03 129 _aug34 2006-08-29 10:35:48 10:35:48 1 2 3 35 123 158 2.86 1.63 1.90 59.948 0:00:00 130 _aug35 2006-08-29 20:31:48 20:31:53 35 118 153 35 123 158 100.00 95.93 96.84 59.945 0:00:03 131 _aug36 2006-08-29 22:03:01 22:03:32 35 121 156 35 123 158 100.00 98.37 98.73 59.941 0:00:16 132 _aug37 2006-08-30 00:08:55 00:09:26 0 1 1 35 123 158 0.00 0.81 0.63 59.948 0:00:01 133 _aug38 2006-08-31 02:05:19 02:05:21 ? ? ? 35 123 158 ? ? ? 59.948 0:00:00 134 _sept1 2006-09-01 07:01:22 07:03:11 ? ? ? 35 123 158 ? ? ? 59.945 0:00:17 135 _sept2 2006-09-03 14:02:27 14:02:45 ? ? ? 35 123 158 ? ? ? 59.915 0:00:17 136 _sept3 2006-09-03 22:32:46 22:33:04 38 129 167 39 130 169 97.44 99.23 98.82 59.943 0:00:17 137 _sept4 2006-09-04 23:43:21 23:44:32 39 126 165 39 130 169 100.00 96.92 97.63 59.907 0:00:41 138 _sept5 2006-09-04 05:28:52 05:28:52 23 69 92 39 130 169 58.97 53.08 54.44 59.942 0:00:00 139a _sept6a 2006-09-04 15:29:08 15:38:04 37 130 167 37 130 167 100.00 100.00 100.00 59.939 0:01:20 139b _sept6b 2006-09-04 15:29:08 15:38:04 37 128 165 37 130 167 100.00 98.46 98.80 59.944 0:01:22 139c _sept6c 2006-09-04 15:29:08 15:38:04 36 127 163 37 130 167 97.30 97.69 97.60 59.945 0:00:18 140 _sept7 2006-09-05 03:03:36 03:03:59 39 130 169 39 130 169 100.00 100.00 100.00 59.941 0:00:14 141 _sept8 2006-09-05 04:15:00 04:15:47 36 118 154 37 123 160 97.30 95.93 96.25 59.930 0:00:33 142 _sept9 2006-09-07 17:44:05 17:44:25 36 118 154 37 123 160 97.30 95.93 96.25 59.914 0:00:19 143 _sept10 2006-09-08 11:03:34 11:03:34 ? ? ? 37 123 160 ? ? ? 59.933 0:00:00

PNNL-17079
A.7
Table A.1. Grid Friendly Demonstration Underfrequency Events and Corresponding Appliance Controller Responses (May 14, 2006 through December 11, 2007) (10 pages)
Event Number Event Date Event Time Stamp Response "Available" Percent Response Frequency
Depth Event
Duration
fevent_2ndset No. yyyy-mm-dd
Start (hh:mm:ss)
End (hh:mm:ss)
Water Heater Dry Total
Water Heater Dryer Total
Water Heater
(%) Dryer (%)
Total (%) (Hz)
Time Below
59.95 Hz (hh:mm:ss)
144 _sept11 2006-09-08 13:45:20 13:45:24 1 0 1 37 123 160 2.70 0.00 0.63 59.947 0:00:00 145 _sept12 2006-09-09 00:47:03 00:47:21 36 123 159 37 123 160 97.30 100.00 99.38 59.927 0:00:18 146 _sept13 2006-09-09 04:18:00 04:18:17 37 121 158 37 123 160 100.00 98.37 98.75 59.939 0:00:16 147 _sept14 2006-09-10 07:00:18 07:00:50 36 122 158 37 123 160 97.30 99.19 98.75 59.942 0:00:20 148a _sept15a 2006-09-11 02:59:40 02:59:48 36 123 159 36 123 159 100.00 100.00 100.00 59.940 0:00:02 148b _sept15b 2006-09-11 02:59:40 02:59:48 36 119 155 36 123 159 100.00 96.75 97.48 59.947 0:00:04 149 _sept16 2006-09-11 03:00:04 03:04:19 36 123 159 36 123 159 100.00 100.00 100.00 59.940 0:00:43 150 _sept17 2006-09-11 04:29:26 04:44:55 36 123 159 36 123 159 100.00 100.00 100.00 59.943 0:00:22 151 _sept18 2006-09-11 05:22:15 05:26:26 36 130 166 36 130 166 100.00 100.00 100.00 59.946 0:00:09 152 _sept19 2006-09-16 04:06:01 04:06:02 0 3 3 36 130 166 ? ? ? 59.949 0:00:00 153 _sept20 2006-09-17 08:13:35 08:14:47 36 128 164 36 130 166 100.00 98.46 98.80 59.919 0:01:03 154 _sept21 2006-09-19 00:51:35 00:51:45 36 126 162 36 130 166 100.00 96.92 97.59 59.944 0:00:08 155 _sept22 2006-09-19 02:56:05 02:56:33 36 123 159 36 123 159 100.00 100.00 100.00 59.940 0:00:25 156 _sept23 2006-09-19 22:16:23 22:16:26 1 10 11 36 123 159 2.78 8.13 6.92 59.948 0:00:00 157 _sept24 2006-09-21 08:01:37 08:01:37 ? ? ? 38 123 161 ? ? ? 59.945 0:00:00 158a _sept25a 2006-09-27 11:28:21 11:34:26 38 128 166 38 130 168 100.00 98.46 98.81 59.921 0:00:22 158b _sept25b 2006-09-27 11:28:21 11:34:26 38 127 165 38 130 168 100.00 97.69 98.21 59.942 0:00:30 159 _sept26 2006-09-27 13:35:01 13:35:03 1 4 5 38 130 168 2.63 3.08 2.98 59.948 0:00:01 160 _sept27 2006-09-28 02:02:42 02:04:40 38 127 165 38 130 168 100.00 97.69 98.21 59.895 0:01:45 161 _sept28 2006-09-28 12:29:07 12:29:41 38 124 162 38 130 168 100.00 95.38 96.43 59.937 0:00:11 162 _sept29 2006-09-30 07:18:05 07:45:04 6 44 50 38 130 168 15.79 33.85 29.76 59.947 0:00:02 163 _sept30 2006-09-30 08:51:36 08:51:52 38 126 164 38 130 168 100.00 96.92 97.62 59.946 0:00:06 164a _oct1a 2006-10-02 06:02:42 06:07:26 21 39 60 41 130 171 51.22 30.00 35.09 59.947 0:00:02 164b _oct1b 2006-10-02 06:02:42 06:07:26 39 127 166 41 130 171 95.12 97.69 97.08 59.929 0:01:00 164c _oct1c 2006-10-02 06:02:42 06:07:26 39 130 169 41 130 171 95.12 100.00 98.83 59.944 0:00:10 165 _oct2 2006-10-02 09:47:40 09:47:49 41 130 171 41 130 171 100.00 100.00 100.00 59.939 0:00:08 166 _oct3 2006-10-03 12:03:35 12:03:48 40 130 170 41 130 171 97.56 100.00 99.42 59.940 0:00:12

PNNL-17079
A.8
Table A.1. Grid Friendly Demonstration Underfrequency Events and Corresponding Appliance Controller Responses (May 14, 2006 through December 11, 2007) (10 pages)
Event Number Event Date Event Time Stamp Response "Available" Percent Response Frequency
Depth Event
Duration
fevent_2ndset No. yyyy-mm-dd
Start (hh:mm:ss)
End (hh:mm:ss)
Water Heater Dry Total
Water Heater Dryer Total
Water Heater
(%) Dryer (%)
Total (%) (Hz)
Time Below
59.95 Hz (hh:mm:ss)
167 _oct4 2006-10-03 22:08:13 22:08:35 ? ? ? 41 130 171 ? ? ? 59.944 0:00:18 168 _oct5 2006-10-05 06:07:02 06:07:04 12 28 40 41 130 171 29.27 21.54 23.39 59.949 0:00:00 169 _oct6 2006-10-05 12:46:44 12:46:53 40 127 167 41 130 171 97.56 97.69 97.66 59.942 0:00:08 170 _oct7 2006-10-05 17:11:23 17:15:27 40 128 168 41 130 171 97.56 98.46 98.25 59.865 0:02:52 171 _oct8 2006-10-06 06:50:26 06:50:37 38 126 164 39 126 165 97.44 100.00 99.39 59.934 0:00:11 172 _oct9 2006-10-07 01:31:44 01:34:31 39 124 163 39 126 165 100.00 98.41 98.79 59.898 0:01:14 173 _oct10 2006-10-07 03:54:23 03:55:12 38 124 162 39 126 165 97.44 98.41 98.18 59.943 0:00:30 174a _oct11a 2006-10-07 05:14:11 05:17:13 39 124 163 39 126 165 100.00 98.41 98.79 59.945 0:00:09 174b _oct11b 2006-10-07 05:14:11 05:17:13 39 123 162 39 126 165 100.00 97.62 98.18 59.945 0:00:09 175 _oct12 2006-10-09 01:00:56 01:01:15 39 124 163 39 126 165 100.00 98.41 98.79 59.938 0:00:18 176 _oct13 2006-10-10 07:31:22 07:31:35 40 126 166 41 130 171 97.56 96.92 97.08 59.923 0:00:12 177 _oct14 2006-10-11 15:14:14 15:14:52 41 130 171 41 130 171 100.00 100.00 100.00 59.895 0:00:27 178 _oct15 2006-10-11 20:33:50 20:34:06 40 125 165 41 130 171 97.56 96.15 96.49 59.922 0:00:15 179 _oct16 2006-10-12 09:40:16 09:40:25 41 128 169 41 130 171 100.00 98.46 98.83 59.943 0:00:08 180 _oct17 2006-10-12 15:32:57 15:33:06 41 128 169 41 130 171 100.00 98.46 98.83 59.942 0:00:08 181 _oct18 2006-10-12 16:58:05 16:58:10 41 127 168 41 130 171 100.00 97.69 98.25 59.946 0:00:04 182 _oct19 2006-10-12 17:02:05 17:02:36 15 60 75 41 130 171 36.59 46.15 43.86 59.948 0:00:02 183 _oct20 2006-10-18 00:17:03 00:18:05 41 126 167 41 130 171 100.00 96.92 97.66 59.892 0:00:59 184a _oct21a 2006-10-19 11:46:56 11:53:45 39 129 168 40 130 170 97.50 99.23 98.82 59.848 0:01:30 184b _oct21b 2006-10-19 11:46:56 11:53:45 39 128 167 40 130 170 97.50 98.46 98.24 59.941 0:31:00 185 _oct22 2006-10-21 15:49:41 15:54:02 39 127 166 40 130 170 97.50 97.69 97.65 59.828 0:03:41 186 _oct23 2006-10-22 00:09:38 00:09:51 39 127 166 40 130 170 97.50 97.69 97.65 59.944 0:00:10 187 _oct24 2006-10-24 00:06:51 00:35:48 2 6 8 40 130 170 5.00 4.62 4.71 59.949 0:00:00 188 _oct25 2006-10-24 02:41:52 02:42:37 39 124 163 40 130 170 97.50 95.38 95.88 59.943 0:00:42 189a _oct26a 2006-10-24 03:16:51 03:39:33 39 126 165 40 127 167 97.50 99.21 98.80 59.945 0:00:09 189b _oct26b 2006-10-24 03:16:51 03:39:33 39 123 162 40 127 167 97.50 96.85 97.01 59.946 0:00:04 190 _oct27 2006-10-24 04:12:47 04:12:51 4 8 12 40 127 167 10.00 6.30 7.19 59.948 0:00:02

PNNL-17079
A.9
Table A.1. Grid Friendly Demonstration Underfrequency Events and Corresponding Appliance Controller Responses (May 14, 2006 through December 11, 2007) (10 pages)
Event Number Event Date Event Time Stamp Response "Available" Percent Response Frequency
Depth Event
Duration
fevent_2ndset No. yyyy-mm-dd
Start (hh:mm:ss)
End (hh:mm:ss)
Water Heater Dry Total
Water Heater Dryer Total
Water Heater
(%) Dryer (%)
Total (%) (Hz)
Time Below
59.95 Hz (hh:mm:ss)
191 _oct28 2006-10-28 01:45:07 01:46:24 40 125 165 40 127 167 100.00 98.43 98.80 59.943 0:00:26 192 _oct29 2006-10-28 03:16:02 03:25:35 40 126 166 40 127 167 100.00 99.21 99.40 59.942 0:00:16 193a _oct30a 2006-10-28 04:07:25 04:26:55 40 124 164 40 127 167 100.00 97.64 98.20 59.945 0:00:10 193b _oct30b 2006-10-28 04:07:25 04:26:55 40 125 165 40 127 167 100.00 98.43 98.80 59.944 0:00:07 194 _oct31 2006-10-29 01:08:30 01:09:02 ? ? ? 40 127 167 ? ? ? 59.946 0:00:06 195 _oct32 2006-10-29 02:03:14 02:06:20 38 124 162 38 125 163 100.00 99.20 99.39 59.934 0:00:35 196 _oct33 2006-10-30 04:30:22 04:30:37 37 122 159 38 125 163 97.37 97.60 97.55 59.944 0:00:14 197 _oct34 2006-10-31 04:45:28 04:46:58 37 123 160 38 125 163 97.37 98.40 98.16 59.873 0:01:30 198a _oct35a 2006-10-31 09:06:06 09:08:22 37 123 160 38 125 163 97.37 98.40 98.16 59.939 0:00:12 198b _oct35b 2006-10-31 09:06:06 09:08:22 24 82 106 38 125 163 63.16 65.60 65.03 59.947 0:00:03 199 _nov1 2006-11-02 10:49:34 10:49:58 38 122 160 38 125 163 100.00 97.60 98.16 59.903 0:00:24 200 _nov2 2006-11-03 05:40:11 05:40:11 err err err 38 125 163 err err err 59.917 0:00:00 201 _nov3 2006-11-03 22:08:48 22:10:51 40 120 160 40 125 165 100.00 96.00 96.97 59.947 0:00:14 202 _nov4 2006-11-04 00:34:11 00:34:19 39 124 163 40 125 165 97.50 99.20 98.79 59.945 0:00:07 203 _nov5 2006-11-04 10:40:20 10:40:31 37 123 160 38 125 163 97.37 98.40 98.16 59.932 0:00:10 204 _nov6 2006-11-05 00:40:14 00:40:23 18 65 83 38 125 163 47.37 52.00 50.92 59.948 0:00:04 205 _nov7 2006-11-06 20:52:43 20:52:59 37 123 160 38 125 163 97.37 98.40 98.16 59.940 0:00:11 206 _nov8 2006-11-07 02:45:45 02:45:45 err err err 38 125 163 err err err 59.931 0:00:00 207 _nov9 2006-11-08 09:49:31 09:49:50 37 120 157 38 121 159 97.37 99.17 98.74 59.919 0:00:19 208 _nov10 2006-11-09 22:06:52 22:07:42 37 120 157 38 121 159 97.37 99.17 98.74 59.946 0:00:22 209 _nov11 2006-11-10 06:02:52 06:03:02 ? ? ? 38 121 159 err err err 59.947 0:00:06 210 _nov12 2006-11-12 03:56:23 03:56:36 37 116 153 38 118 156 97.37 98.31 98.08 59.934 0:00:13 211 _nov13 2006-11-13 08:19:44 08:20:10 37 116 153 38 118 156 97.37 98.31 98.08 59.902 0:00:21 212 _nov14 2006-11-14 00:07:10 00:07:52 37 116 153 38 116 154 97.37 100.00 99.35 59.935 0:00:42 213 _nov15 2006-11-14 03:05:51 03:05:58 37 114 151 38 116 154 97.37 98.28 98.05 59.946 0:00:06 214 _nov16 2006-11-14 04:02:53 04:48:09 37 116 153 38 116 154 97.37 100.00 99.35 59.934 0:01:31 215 _nov17 2006-11-14 09:37:24 09:37:32 37 116 153 38 116 154 97.37 100.00 99.35 59.946 0:00:04

PNNL-17079
A.10
Table A.1. Grid Friendly Demonstration Underfrequency Events and Corresponding Appliance Controller Responses (May 14, 2006 through December 11, 2007) (10 pages)
Event Number Event Date Event Time Stamp Response "Available" Percent Response Frequency
Depth Event
Duration
fevent_2ndset No. yyyy-mm-dd
Start (hh:mm:ss)
End (hh:mm:ss)
Water Heater Dry Total
Water Heater Dryer Total
Water Heater
(%) Dryer (%)
Total (%) (Hz)
Time Below
59.95 Hz (hh:mm:ss)
216 _nov18 2006-11-15 06:59:04 06:59:23 38 115 153 38 116 154 100.00 99.14 99.35 59.892 0:00:19 217 _nov19 2006-11-15 07:02:35 07:02:37 ? ? ? 38 116 154 ? ? ? 59.947 0:00:01 218 _nov20 2006-11-16 22:10:17 22:10:20 err err err 38 116 154 err err err 59.949 0:00:00 219 _nov21 2006-11-18 00:09:56 00:10:07 35 116 151 35 116 151 100.00 100.00 100.00 59.942 0:00:10 220 _nov22 2006-11-18 16:43:51 16:44:08 35 116 151 35 116 151 100.00 100.00 100.00 59.925 0:00:17 221 _nov23 2006-11-19 06:46:27 06:46:36 34 113 147 35 116 151 97.14 97.41 97.35 59.946 0:00:08 222 _nov24 2006-11-20 21:07:26 21:08:55 35 116 151 35 116 151 100.00 100.00 100.00 59.921 0:00:33 223 _nov25 2006-11-22 10:24:02 10:24:11 35 113 148 35 116 151 100.00 97.41 98.01 59.939 0:00:08 224a _nov26a 2006-11-29 04:38:22 04:41:25 35 114 149 35 116 151 100.00 98.28 98.68 59.937 0:00:21 224b _nov26b 2006-11-29 04:38:22 04:41:25 35 112 147 35 116 151 100.00 96.55 97.35 59.945 0:00:20 225 _nov27 2006-11-29 16:47:48 16:47:51 err err err 35 116 151 err err err 59.948 0:00:00 226 _nov28 2006-11-30 05:18:35 05:20:43 35 113 148 35 116 151 100.00 97.41 98.01 59.900 0:01:06 227a _dec1a 2006-12-01 03:33:17 03:37:42 35 114 149 35 116 151 100.00 98.28 98.68 59.926 0:00:35 227b _dec1b 2006-12-01 03:33:17 03:37:42 35 113 148 35 116 151 100.00 97.41 98.01 59.940 0:00:15 228 _dec2 2006-12-01 09:51:42 09:51:56 35 109 144 35 110 145 100.00 99.09 99.31 59.932 0:00:13 229 _dec3 2006-12-03 03:47:55 03:48:09 35 105 140 35 110 145 100.00 95.45 96.55 59.942 0:00:10 230 _dec4 2006-12-04 23:11:47 23:11:47 err err err 36 110 146 err err err 59.812 0:00:00 231 _dec5 2006-12-04 09:33:43 09:34:00 ? ? ? 37 110 147 ? ? ? 59.913 0:00:16 232 _dec6 2006-12-07 09:49:18 09:49:36 34 106 140 35 110 145 97.14 96.36 96.55 59.924 0:00:17 233 _dec7 2006-12-11 00:18:56 00:19:08 35 110 145 35 110 145 100.00 100.00 100.00 59.944 0:00:08 234 _dec8 2006-12-11 02:43:09 02:43:33 22 63 85 35 110 145 62.86 57.27 58.62 59.947 0:00:05 235 _dec9 2006-12-12 12:40:17 12:40:37 35 110 145 35 110 145 100.00 100.00 100.00 59.923 0:00:19 236 _dec10 2006-12-14 00:30:06 00:30:22 35 108 143 35 110 145 100.00 98.18 98.62 59.943 0:00:11

PNNL-17079
A.11
Table A.2. A list of Grid Friendly Demonstration Underfrequency Events and Corresponding Appliance Controller Responses (December 12, 2006 through March 31, 2007) (four pages)
Event
Number Event Date Event Time Stamp Response "Available" Percent Response Event Depth
Event Duration
fevent_2ndset No. yyyy-mm-dd
First Recorded
(hh:mm:ss)
Last Recorded
(hh:mm:ss) Water Heater Dryer Total
Water Heater Dryer Total
Water Heater
(%) Dryer (%)
Total (%) (Hz)
Time Below 59.95Hz
(hh:mm:ss) 1 _dec9 2006-12-12 12:40:17 12:40:37 35 110 145 35 110 145 100.00 100.00 100.00 59.923 0:00:20 2 _dec10 2006-12-14 00:30:06 00:30:22 35 108 143 35 110 145 100.00 98.18 98.62 59.943 0:00:16 3 _dec11 2006-12-14 21:26:02 21:26:02 30 100 130 30 100 130 100.00 100.00 100.00 59.932 0:00:00 4 _dec12 2006-12-15 01:53:59 01:54:00 29 86 115 30 100 130 96.67 86.00 88.46 59.948 0:00:01 5 _dec13 2006-12-15 02:31:46 02:32:03 30 100 130 30 100 130 100.00 100.00 100.00 59.944 0:00:17 6 _dec14 2006-12-15 04:52:48 04:59:33 29 98 127 30 100 130 96.67 98.00 97.69 59.848 0:06:45 7 _dec15 2006-12-15 05:12:06 05:51:12 29 96 125 30 100 130 96.67 96.00 96.15 59.942 0:00:54 8 _dec16 2006-12-18 16:47:48 16:47:55 30 100 130 30 100 130 100.00 100.00 100.00 59.946 0:00:07 9 _dec17 2006-12-18 23:40:51 23:40:59 30 97 127 30 100 130 100.00 97.00 97.69 59.940 0:00:08 10 _dec18 2006-12-22 11:41:51 11:42:08 30 100 130 30 100 130 100.00 100.00 100.00 59.915 0:00:17 11 _dec19 2006-12-22 13:08:05 13:08:19 30 100 130 30 100 130 100.00 100.00 100.00 59.915 0:00:14 12 _dec20 2006-12-22 15:37:34 15:37:34 0 0 0 30 100 130 0.00 0.00 0.00 59.949 0:00:00 13 _dec21 2006-12-24 01:54:32 01:54:50 30 100 130 30 100 130 100.00 100.00 100.00 59.929 0:00:18 14 _jan1 2007-01-03 12:31:09 12:31:20 29 99 128 30 100 130 96.67 99.00 98.46 59.940 0:00:11 15 _jan2 2007-01-04 16:22:53 16:48:49 29 100 129 30 100 130 96.67 100.00 99.23 59.945 0:00:11 16 _jan3 2007-01-04 18:34:16 18:34:25 29 97 126 30 100 130 96.67 97.00 96.92 59.942 0:00:09 17 _jan4 2007-01-05 19:38:21 19:38:36 29 97 126 30 100 130 96.67 97.00 96.92 59.923 0:00:15 18 _jan5 2007-01-06 00:32:54 00:33:11 29 98 127 30 100 130 96.67 98.00 97.69 59.911 0:00:17 19 _jan6 2007-01-07 09:03:28 09:05:22 29 100 129 30 100 130 96.67 100.00 99.23 59.924 0:00:16 20 _jan7 2007-01-07 23:05:14 23:08:28 29 98 127 30 100 130 96.67 98.00 97.69 59.927 0:00:12 21 _jan8 2007-01-08 05:59:10 06:04:18 30 100 130 30 100 130 100.00 100.00 100.00 59.939 0:00:28 22 _jan9 2007-01-10 09:13:03 09:13:16 30 97 127 30 100 130 100.00 97.00 97.69 59.918 0:00:13 23 _jan10 2007-01-11 19:21:59 19:22:06 30 96 126 30 100 130 100.00 96.00 96.92 59.947 0:00:07 24 _jan11 2007-01-12 06:06:38 06:06:42 9 15 24 30 100 130 30.00 15.00 18.46 59.948 0:00:05 25 _jan12 2007-01-15 02:31:18 02:31:32 30 100 130 30 100 130 100.00 100.00 100.00 59.933 0:00:14 26 _jan13 2007-01-16 10:50:48 10:50:57 30 100 130 30 100 130 100.00 100.00 100.00 59.941 0:00:09 27 _jan14 2007-01-17 10:10:19 10:11:01 30 100 130 30 100 130 100.00 100.00 100.00 59.901 0:00:42

PNNL-17079
A.12
Table A.2. A list of Grid Friendly Demonstration Underfrequency Events and Corresponding Appliance Controller Responses (December 12, 2006 through March 31, 2007) (four pages)
Event
Number Event Date Event Time Stamp Response "Available" Percent Response Event Depth
Event Duration
fevent_2ndset No. yyyy-mm-dd
First Recorded
(hh:mm:ss)
Last Recorded
(hh:mm:ss) Water Heater Dryer Total
Water Heater Dryer Total
Water Heater
(%) Dryer (%)
Total (%) (Hz)
Time Below 59.95Hz
(hh:mm:ss) 28 _jan15 2007-01-17 22:54:46 22:55:53 30 99 129 30 100 130 100.00 99.00 99.23 59.926 0:00:17 29 _jan16 2007-01-18 11:08:27 11:09:43 30 100 130 30 100 130 100.00 100.00 100.00 59.909 0:00:23 30 _jan17 2007-01-18 21:05:24 21:05:33 30 98 128 30 100 130 100.00 98.00 98.46 59.944 0:00:09 31 _jan18 2007-01-19 06:03:58 06:04:05 30 100 130 30 100 130 100.00 100.00 100.00 59.938 0:00:07 32 _jan19 2007-01-20 09:19:29 09:19:45 30 100 130 30 100 130 100.00 100.00 100.00 59.918 0:00:16 33 _jan20 2007-01-23 13:46:14 13:55:18 30 100 130 30 100 130 100.00 100.00 100.00 59.765 0:09:04 34 _jan21 2007-01-25 00:51:14 00:51:17 3 22 25 30 100 130 10.00 22.00 19.23 59.948 0:00:01 35 _jan22 2007-01-25 13:48:03 13:48:12 30 100 130 30 100 130 100.00 100.00 100.00 59.941 0:00:09 36 _jan23 2007-01-29 15:12:27 15:12:46 30 100 130 30 100 130 100.00 100.00 100.00 59.900 0:00:19 37 _jan24 2007-01-30 17:50:14 17:50:15 8 18 26 30 100 130 26.67 18.00 20.00 59.949 0:00:01 38 _feb1 2007-02-01 05:30:49 05:49:24 35 105 140 35 106 141 100.00 99.06 99.29 59.894 0:05:12 39 _feb2 2007-02-01 11:13:42 11:21:50 35 103 138 35 106 141 100.00 97.17 97.87 59.880 0:03:11 40 _feb3 2007-02-02 03:23:21 03:24:17 34 106 140 35 106 141 97.14 100.00 99.29 59.902 0:00:56 41 _feb4 2007-02-02 16:48:32 16:50:50 35 106 141 35 106 141 100.00 100.00 100.00 59.869 0:02:18 42 _feb5 2007-02-04 13:44:56 13:45:05 35 106 141 35 106 141 100.00 100.00 100.00 59.938 0:00:09 43 _feb6 2007-02-04 16:39:25 16:48:29 22 63 85 35 106 141 62.86 59.43 60.28 59.947 0:00:04 44 _feb7 2007-02-04 19:01:37 19:01:48 35 106 141 35 106 141 100.00 100.00 100.00 59.942 0:00:11 45 _feb8 2007-02-07 00:58:28 01:05:03 35 106 141 35 106 141 100.00 100.00 100.00 59.838 0:02:32 46 _feb9 2007-02-10 05:58:44 05:59:39 35 106 141 35 106 141 100.00 100.00 100.00 59.911 0:00:29 47 _feb10 2007-02-10 06:00:25 06:03:46 35 106 141 35 106 141 100.00 100.00 100.00 59.904 0:01:00 48 _feb11 2007-02-11 02:34:03 02:36:18 35 106 141 35 106 141 100.00 100.00 100.00 59.895 0:01:18 49 _feb12 2007-02-12 07:48:50 07:49:42 35 106 141 35 106 141 100.00 100.00 100.00 59.926 0:00:52 50 _feb13 2007-02-12 19:22:58 19:23:08 35 106 141 35 106 141 100.00 100.00 100.00 59.938 0:00:10 51 _feb14 2007-02-14 01:37:12 01:37:25 34 104 138 35 106 141 97.14 98.11 97.87 59.933 0:00:13 52 _feb15 2007-02-16 06:46:46 06:46:58 35 104 139 35 106 141 100.00 98.11 98.58 59.941 0:00:12 53 _feb16 2007-02-16 22:10:35 22:10:41 35 104 139 35 106 141 100.00 98.11 98.58 59.946 0:00:06 54 _feb17 2007-02-17 03:12:28 03:12:35 34 104 138 35 106 141 97.14 98.11 97.87 59.945 0:00:07

PNNL-17079
A.13
Table A.2. A list of Grid Friendly Demonstration Underfrequency Events and Corresponding Appliance Controller Responses (December 12, 2006 through March 31, 2007) (four pages)
Event
Number Event Date Event Time Stamp Response "Available" Percent Response Event Depth
Event Duration
fevent_2ndset No. yyyy-mm-dd
First Recorded
(hh:mm:ss)
Last Recorded
(hh:mm:ss) Water Heater Dryer Total
Water Heater Dryer Total
Water Heater
(%) Dryer (%)
Total (%) (Hz)
Time Below 59.95Hz
(hh:mm:ss) 55 _feb18 2007-02-17 10:13:45 10:13:46 2 5 7 35 106 141 5.71 4.72 4.96 59.949 0:00:01 56 _feb19 2007-02-19 00:29:49 00:29:56 34 106 140 35 106 141 97.14 100.00 99.29 59.942 0:00:07 57 _feb20 2007-02-19 06:33:15 06:33:32 34 106 140 35 106 141 97.14 100.00 99.29 59.909 0:00:17 58 _feb21 2007-02-20 03:56:45 03:57:20 34 106 140 35 106 141 97.14 100.00 99.29 59.918 0:00:35 59 _feb22 2007-02-22 17:49:55 17:49:58 2 9 11 35 106 141 5.71 8.49 7.80 59.949 0:00:03 60 _mar1 2007-03-01 13:49:30 13:49:58 35 99 134 35 100 135 100.00 99.00 99.26 59.927 0:00:16 61 _mar2 2007-03-04 01:23:53 01:24:08 35 100 135 35 100 135 100.00 100.00 100.00 59.943 0:00:15 62 _mar3 2007-03-04 03:10:45 03:10:57 34 98 132 35 100 135 97.14 98.00 97.78 59.928 0:00:12 63 _mar4 2007-03-04 12:14:23 12:14:35 34 98 132 35 100 135 97.14 98.00 97.78 59.927 0:00:12 64 _mar5 2007-03-06 12:58:23 12:58:37 34 97 131 35 100 135 97.14 97.00 97.04 59.928 0:00:14 65 _mar6 2007-03-06 16:52:35 16:53:35 35 99 134 35 100 135 100.00 99.00 99.26 59.891 0:00:34 66 _mar7 2007-03-08 05:52:35 05:53:09 34 96 130 35 100 135 97.14 96.00 96.30 59.946 0:00:09 67 _mar8 2007-03-10 05:15:37 05:15:44 34 98 132 35 100 135 97.14 98.00 97.78 59.945 0:00:07 68 _mar9 2007-03-11 11:17:47 11:17:57 34 98 132 35 100 135 97.14 98.00 97.78 59.940 0:00:10 69 _mar10 2007-03-11 16:06:07 16:06:28 35 98 133 35 100 135 100.00 98.00 98.52 59.914 0:00:21 70 _mar11 2007-03-11 19:33:46 19:34:08 35 99 134 35 100 135 100.00 99.00 99.26 59.898 0:00:22 71 _mar12 2007-03-13 07:19:15 07:19:22 35 99 134 35 100 135 100.00 99.00 99.26 59.940 0:00:07 72 _mar13 2007-03-15 05:36:35 05:36:53 35 98 133 35 100 135 100.00 98.00 98.52 59.927 0:00:18 73 _mar14 2007-03-15 12:33:16 12:33:34 35 98 133 35 100 135 100.00 98.00 98.52 59.920 0:00:18 74 _mar15 2007-03-15 14:32:45 14:32:45 0 16 16 35 100 135 0.00 16.00 11.85 59.949 0:00:00 75 _mar16 2007-03-16 01:13:53 01:18:03 35 95 130 35 95 130 100.00 100.00 100.00 59.871 0:02:43 76 _mar17 2007-03-18 19:03:18 19:03:23 35 95 130 35 95 130 100.00 100.00 100.00 59.946 0:00:05 77 _mar18 2007-03-21 07:40:31 07:40:46 30 93 123 31 95 126 96.77 97.89 97.62 59.930 0:00:15 78 _mar19 2007-03-21 10:39:41 10:39:52 30 93 123 31 95 126 96.77 97.89 97.62 59.937 0:00:11 79 _mar20 2007-03-21 13:32:42 13:32:55 30 93 123 31 95 126 96.77 97.89 97.62 59.916 0:00:13 80 _mar21 2007-03-21 16:05:24 16:05:35 31 93 124 31 95 126 100.00 97.89 98.41 59.924 0:00:11 81 _mar22 2007-03-22 08:52:55 08:53:08 31 93 124 31 95 126 100.00 97.89 98.41 59.924 0:00:13

PNNL-17079
A.14
Table A.2. A list of Grid Friendly Demonstration Underfrequency Events and Corresponding Appliance Controller Responses (December 12, 2006 through March 31, 2007) (four pages)
Event
Number Event Date Event Time Stamp Response "Available" Percent Response Event Depth
Event Duration
fevent_2ndset No. yyyy-mm-dd
First Recorded
(hh:mm:ss)
Last Recorded
(hh:mm:ss) Water Heater Dryer Total
Water Heater Dryer Total
Water Heater
(%) Dryer (%)
Total (%) (Hz)
Time Below 59.95Hz
(hh:mm:ss) 82 _mar23 2007-03-22 15:11:20 15:11:29 31 91 122 31 91 122 100.00 100.00 100.00 59.941 0:00:09 83 _mar24 2007-03-22 16:41:12 16:41:27 31 91 122 31 91 122 100.00 100.00 100.00 59.915 0:00:15 84 _mar25 2007-03-23 05:40:14 05:40:25 31 91 122 31 91 122 100.00 100.00 100.00 59.944 0:00:11 85 _mar26 2007-03-24 05:04:20 05:04:30 22 51 73 31 91 122 70.97 56.04 59.84 59.947 0:00:10 86 _mar27 2007-03-26 02:09:11 02:09:18 31 89 120 31 91 122 100.00 97.80 98.36 59.946 0:00:07 87 _mar28 2007-03-26 17:57:23 17:59:20 31 91 122 31 91 122 100.00 100.00 100.00 59.932 0:01:10 88 _mar29 2007-03-26 18:00:07 18:12:44 31 91 122 31 91 122 100.00 100.00 100.00 59.893 0:10:58 89 _mar30 2007-03-26 21:18:13 21:18:06 31 90 121 31 91 122 100.00 98.90 99.18 59.921 0:03:52 90 _mar31 2007-03-27 06:07:09 06:37:50 31 91 122 31 91 122 100.00 100.00 100.00 59.936 0:00:17 91 _mar32 2007-03-28 08:37:10 08:48:20 31 90 121 31 91 122 100.00 98.90 99.18 59.921 0:00:20 92 _mar33 2007-03-28 21:10:48 21:13:28 31 91 122 31 91 122 100.00 100.00 100.00 59.921 0:01:54 93 _mar34 2007-03-28 22:40:51 22:40:58 31 91 122 31 91 122 100.00 100.00 100.00 59.939 0:00:07 94 _mar35 2007-03-29 09:41:27 09:41:37 31 91 122 31 91 122 100.00 100.00 100.00 59.934 0:00:10

PNNL-17079
A.15
Figure A.1. Example Automated Qualification Flow Chart
Participation Criteria – Gresham
EnterZip
Zip Code = 97030,97080
Thank you for your interest in the GridWise Testbed program.
Please enter your zip code below to determine eligibility.
The zip code you provided is not in our testing area. If you have typed your zip code correctly, then we are sorry but your home is not in an eligible location for our program.
No
General –
1) Is your utility company Portland General Electric?2) Do you own your residence?3) Will this be your primary residence from now through October 2006?4) Will your residence be occupied by three or more residents from now until October 2006?5) Are you 18 years of age or older?6) Would you agree to respond to two short surveys concerning your residence’s electrical energy consumption over the next year?7) Can you welcome qualified installation electricians into your home for scheduled visits during normal business hours?
Clothes Dryer –
1) If a new clothes dryer were offered to you, would you accept it? (You may be required to participate until October 2006 to earn the dryer. You may keep and store your old clothes dryer , or you may have the installer take yours away .)
2) Is your dryer located in a dry, indoor location?3) Is there a 220V electrical power outlet within 2 feet of either side of your dryer’s present location serviced by a dedicated 30-ampere breaker?4) Is the floor under your clothes dryer flat, dry, and level?5) Would the floor under your dryer support over 200 pounds?6) Is your clothes dryer properly vented outdoors by a 4” vent system?7) If your clothes dryer venting system were found to be improper or inadequate, would you agree to improve, at your cost, your dryer venting system to meet code and product specifications?
Communication Access –
1) Do you have access to cable TV at your residence?2) Do you have access to broadband internet service?3) Are you currently purchasing broadband internet service at your residence?
Introduction and sign up athttp://gridwise.pnl.gov/testbed
Yes
Thank you for completing the survey. Someone will be in
contact with you to go over the details of this program and to
answer any questions you may have.
Yes
Contact Information:
Name, Address, State, Zip, Contact Phone, and Email
Yes, Don’t Know, or No
Yes, Don’t
Know, or No
“No” Reponses Question sets
1 & 2
Thank you for taking the time to participate in our survey. At this time your
responses did not meet our minimum requirements for program involvement. We regret to inform you that you will not
be able to participate in the Testbed Program.
Possible zip codes: 97030 and 97080
Yes, Don’t Know, or No Response
1
2Question set
3
3
Yes, Don’t KnowReponses

PNNL-17079
A.16
Table A.3. Preliminary Survey Text Example
Name (First Last); Address; City, State, Zip; Home Phone; Work Phone; Email (Answers not retained)
What type of system do you use the most for heating your home? (Check one) 25% - Electric, central forced air 235 – Sample size
3% - Electric baseboard 37% - Electric heat pump, central forced air 2% - Electric radiant heating 0% - Portable electric heater(s) 31% - Gas, oil, or propane central forced air 1% - Woodstove or fireplace 1% - Other
Do you have a second heating system for your home? (Check all that apply) 3% - Electric, central forced air 235 – Sample size (total responses) 4% - Electric baseboard 0% - Electric heat pump, forced air 1% - Electric radiant heating 11% - Portable electric heater(s) 2% - Gas, oil, or propane central forced air 45% - Woodstove or fireplace 6% - Other
During the winter my thermostat setting during the daytime is usually daytime nighttime range (°F)
1% 0% 3% 4% 6%
13% 32% 25% 12% 3% 0% 0%
8% 3%
17% 9% 9%
18% 21% 9% 4% 2% 0% 0%
<56 56-58 58-60 60-62 62-64 64-66 66-68 68-70 70-72 72-74 74-76 >76
My home’s temperature in the winter time is (Check one) 3% - Too warm 236 – Sample size 70% - Just right 28% - Too cool
My home has a programmable thermostat (Circle one) 69% - Yes 239 – Sample size 28% - No 3% - Not sure

PNNL-17079
A.17
The month I usually start heating my home is ___ The month I usually stop heating my home is ___ start stop month 231 / 222 – Sample sizes 1% 0% 0% 0% 0% 0% 0% 0%
14% 60% 23% 0%
0% 1%
12% 32% 34% 16% 3% 0% 0% 0% 0% 1%
January February
March April May June July
August September
October November December
How many thermostats do you have in your home? (Check one) 91% - 1 235 – Sample size 4% - 2 4% - More than 2
Where is the location of the thermostat(s)? (Main floor, hallway, second floor hallway, basement, etc.) Answers varied greatly to this open-ended question.
What type of air conditioning do you have, if any? (Check one) 25% - None 238 – Sample size 39% - Heat pump 24% - Central forced air 11% - Wall or window unit(s) 0% - Other
During the summer, I use my air conditioner (Check one) 9% - Never 240 – Sample size 42% - Occasionally 28% - Routinely 21% - Don’t have one
During the summer, my thermostat setting during the daytime is usually __°F; nighttime is usually __ °F daytime nighttime range (°F) 171 / 154 – Sample sizes
9% 1% 6% 1% 2% 5%
10% 14% 14% 10%
12% 1%
10% 3% 3% 8% 6%
16% 10% 10%
<56 56-58 58-60 60-62 62-64 64-66 66-68 68-70 70-72 72-74
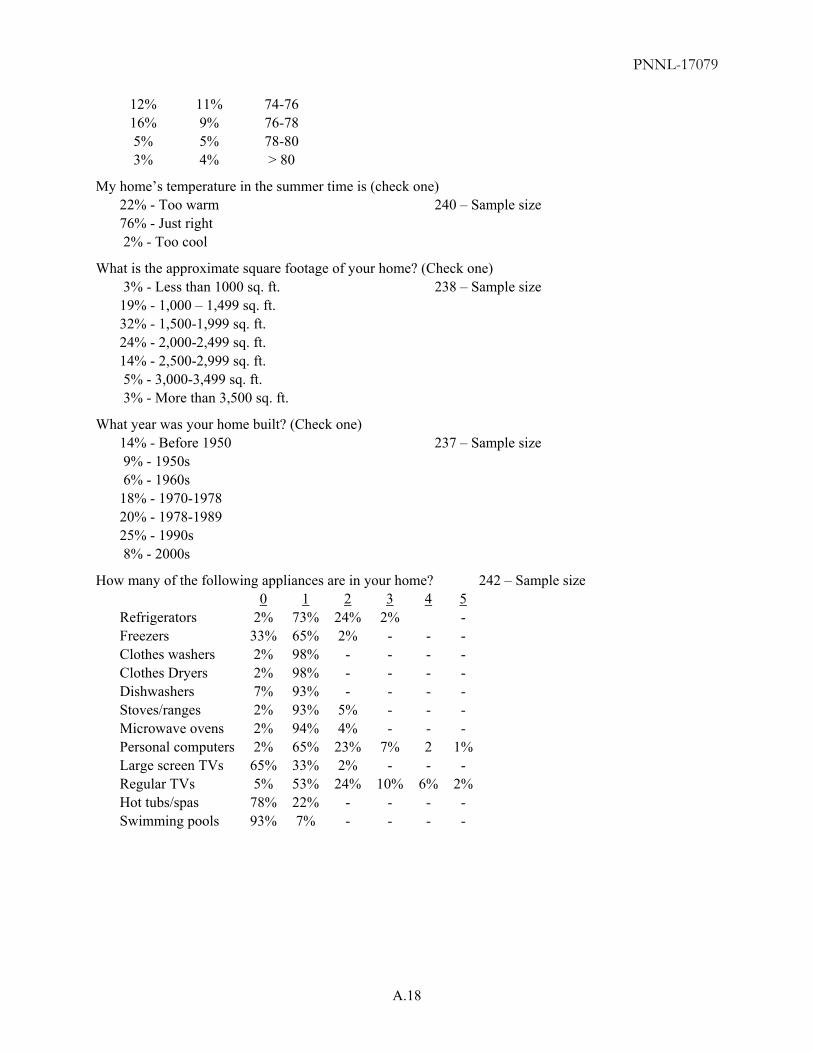
PNNL-17079
A.18
12% 16% 5% 3%
11% 9% 5% 4%
74-76 76-78 78-80 > 80
My home’s temperature in the summer time is (check one) 22% - Too warm 240 – Sample size 76% - Just right 2% - Too cool
What is the approximate square footage of your home? (Check one) 3% - Less than 1000 sq. ft. 238 – Sample size 19% - 1,000 – 1,499 sq. ft. 32% - 1,500-1,999 sq. ft. 24% - 2,000-2,499 sq. ft. 14% - 2,500-2,999 sq. ft. 5% - 3,000-3,499 sq. ft. 3% - More than 3,500 sq. ft.
What year was your home built? (Check one) 14% - Before 1950 237 – Sample size 9% - 1950s 6% - 1960s 18% - 1970-1978 20% - 1978-1989 25% - 1990s 8% - 2000s
How many of the following appliances are in your home? 242 – Sample size 0 1 2 3 4 5
Refrigerators Freezers Clothes washers Clothes Dryers Dishwashers Stoves/ranges Microwave ovens Personal computers Large screen TVs Regular TVs Hot tubs/spas Swimming pools
2% 33% 2% 2% 7% 2% 2% 2%
65% 5%
78% 93%
73% 65% 98% 98% 93% 93% 94% 65% 33% 53% 22% 7%
24% 2%
- - -
5% 4%
23% 2%
24% - -
2% - - - - - -
7% -
10% - -
- - - - - - 2 -
6% - -
- - - - - - -
1% -
2% - -

PNNL-17079
A.19
I would consider changing the times we use these appliances to save money (Check all that apply) Dishwasher 92% - Yes 4% - No 4% - Not sure
Stove/range 35% - Yes 45% - No 20% - Not sure
Microwave oven 34% - Yes 48% - No 17% - Not sure
Personal computer 27% - Yes 54% - No 18% - Not sure
Large screen TV 22% - Yes 53% - No 25% - Not sure
Regular TV 34% - Yes 45% - No 21% - Not sure
Hot tub/spa 66% - Yes 20% - No 14% - Not sure
How many loads of laundry per week do you do at home? (Check one) 0% - None 238 – Sample size 25% - 1-3 45% - 4-6 16% - 7-9 13% - 10 or more
What temperature settings are used most often when washing clothes? (Check one) 27% - Cold / Cold 237 – Sample size 68% - Warm / Cold 4% - Warm / Hot 0% - Hot / Hot
We usually do our laundry. (check one) 10% - At the same time of day 237 – Sample size 90% - At various times
I would consider changing our laundry schedule to save money. (Circle one) 86% - Yes 238 – Sample size 2% - No 12% - Not sure
How many total showers or baths does your household take at home in a typical week? (Check one) 10% - 0-5 237 – Sample size
26% - 6-10 27% - 11-15 15% - 16-20 21% - 20 or more
Are your showers equipped with a low-flow shower head? (Circle one) 49% - Yes 238 - Sample size 24% - No 27% - Not sure

PNNL-17079
A.20
I would consider changing the times we shower or bathe to save money. (Circle one) 34% - Yes 239 – Sample size 37% - No 29% - Not sure
Our water heater has a timer that turns it off when we’re not home. (Circle one) 3% - Yes 239 – Sample size 79% - No 18% - Not sure
The amount of hot water I have is (Check one) 91% - Usually sufficient 234 – Sample size 6% - Sometimes sufficient 3% - Not usually sufficient
My water heater is set (Check one) 7% - As hot as possible (160°F or more) 230 – Sample size 45% - For the dishwasher/clothes washer (about 140°F) 45% - To prevent scalding (about 120°F) 3% - To wash hands comfortably (less than 120°F)
How many water heaters do you have in your home? (Check one) 94% - 1 234 – Sample size 6% - 2 0% - more than 2
Where is the location of your water heater(s)? (Garage, basement, etc.) Answers to this open-ended question varied greatly.
Including yourself, how many people have lived in the household at least half of the last 12 months? (Age No. Person)
7% - 0-11 571 – Sample population 12% - 12-18 8% - 18-25 9% - 26-35 12% - 36-45 25% - 46-55 15% - 55-65 13% - 66 or older
What is the total combined income for your household before taxes? (Check one) 2% - Up to $19,000 216 – Sample size 14% - $20,000 to $39,999 25% - $40,000 to $59,999 28% - $60,000 to $79,999 13% - $80,000 to $99,999 17% - $100,000 or more

PNNL-17079
A.21
The last questions refer to the occupant responsible for participating in the demonstration program: (Check one)
43% - Female 238 – Sample size 57% - Male
Age (Check one) 0% - 18-25 238 – Sample size 8% - 26-35 18% - 36-45 33% - 46-55 22% - 55-65 18% - 66 or older
Highest level of education completed (Check one) 0% - Never attended 238 – Sample size 0% - Elementary school 0% - Junior high school 3% - Some high school 6% - High school 6% - Trade or technical school 30% - Some college 32% - Graduated college 24% - Graduate college/professional school
Comfort level using the internet (Check one) 0% - Never use it 237 – Sample size 1% - Not comfortable 14% - A little comfortable 85% - Very comfortable


PNNL-17079
A.23
Table A.4. Final Survey Summary
I received sufficient information to understand the project goals and my part in the GridWise Testbed Program.
44% - Strongly agree 151 - Sample size 50% - Agree 4.4 - Average on scale of 5 3% - Neutral 0.67 - Standard deviation on scale of 5 0% - Disagree 0% - Strongly disagree
Regarding your personal experience with the new clothes dryer, how satisfied were you with the installation of your dryer?
83% - Very satisfied 139 - Sample size 14% - Somewhat satisfied 4.8 - Average on scale of 5 1% - Neither satisfied nor dissatisfied 0.56 - Standard deviation on scale of 5 2% - Somewhat dissatisfied 0% - Very dissatisfied
How acceptable was it to have your clothes dryer cycle run a few minutes longer, occasionally, in response to power grid needs?
79% - Very acceptable, we didn't notice any change 139 – Sample size 11% - Somewhat acceptable 4.7 – Average on scale of 5 7% - Acceptable 0.74 – Standard deviation on scale of 5 3% - Somewhat unacceptable 0% - Unacceptable
Which of these conditions, if any, did you observe on your clothes dryer? (Check all that apply) 37% - "Pr" (Price Response) signal on appliance 227 – Sample size (total responses) 38% - Had to push start button twice to start the dryer 25% - Audible signal (beep) with the "Pr" (Price Response)
Assume you are planning to purchase a new clothes dryer. Which of the following would most strongly influence your decision to purchase a Grid Friendly clothes dryer instead of a standard model? (Check all that apply)
23% - Help the environment 349 – Sample size (total responses) 36% - Reduce my electrical costs 20% - Help the electric power grid 18% - Price 3% - Other (please explain)
What is the likelihood that you would purchase a Grid Friendly clothes dryer? 28% - Definitely would 139 – Sample size 47% - Probably would 4.0 – Average on scale of 5 22% - Might or might not 0.80 – Standard deviation on scale of 5 2% - Probably would not 1% - Definitely would not
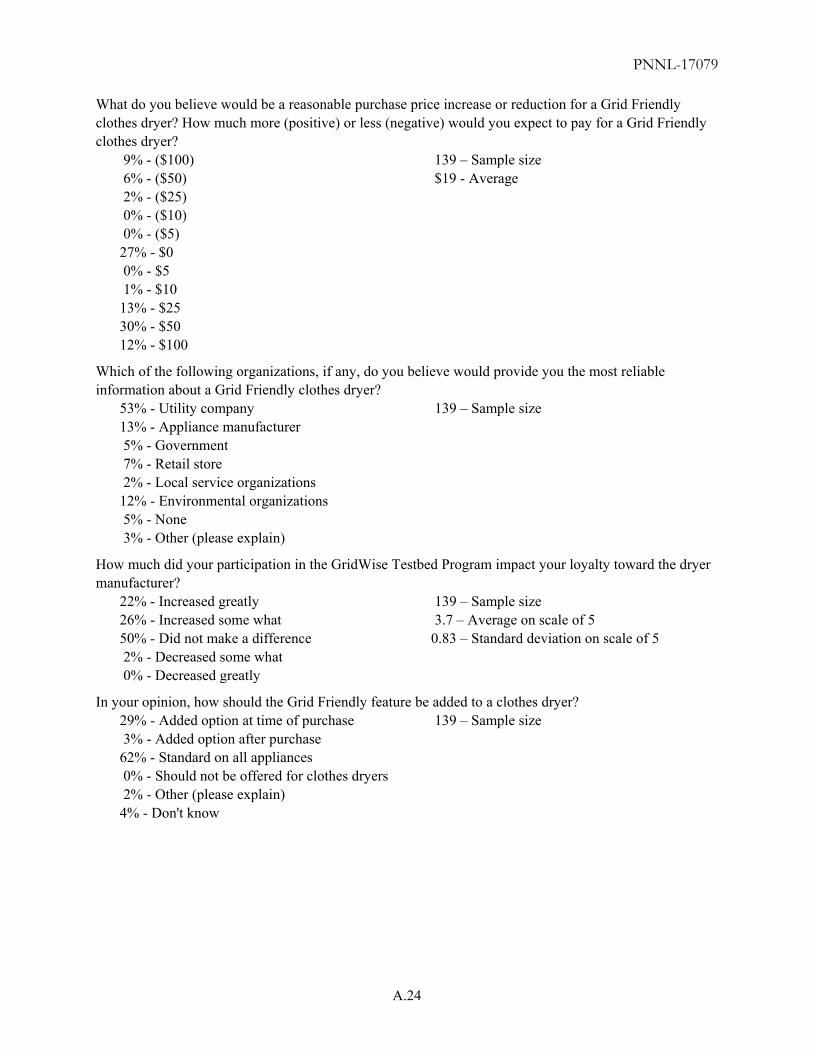
PNNL-17079
A.24
What do you believe would be a reasonable purchase price increase or reduction for a Grid Friendly clothes dryer? How much more (positive) or less (negative) would you expect to pay for a Grid Friendly clothes dryer?
9% - ($100) 139 – Sample size 6% - ($50) $19 - Average 2% - ($25) 0% - ($10) 0% - ($5) 27% - $0 0% - $5 1% - $10 13% - $25 30% - $50 12% - $100
Which of the following organizations, if any, do you believe would provide you the most reliable information about a Grid Friendly clothes dryer?
53% - Utility company 139 – Sample size 13% - Appliance manufacturer 5% - Government 7% - Retail store 2% - Local service organizations 12% - Environmental organizations 5% - None 3% - Other (please explain)
How much did your participation in the GridWise Testbed Program impact your loyalty toward the dryer manufacturer?
22% - Increased greatly 139 – Sample size 26% - Increased some what 3.7 – Average on scale of 5 50% - Did not make a difference 0.83 – Standard deviation on scale of 5 2% - Decreased some what 0% - Decreased greatly
In your opinion, how should the Grid Friendly feature be added to a clothes dryer? 29% - Added option at time of purchase 139 – Sample size 3% - Added option after purchase 62% - Standard on all appliances 0% - Should not be offered for clothes dryers 2% - Other (please explain) 4% - Don't know
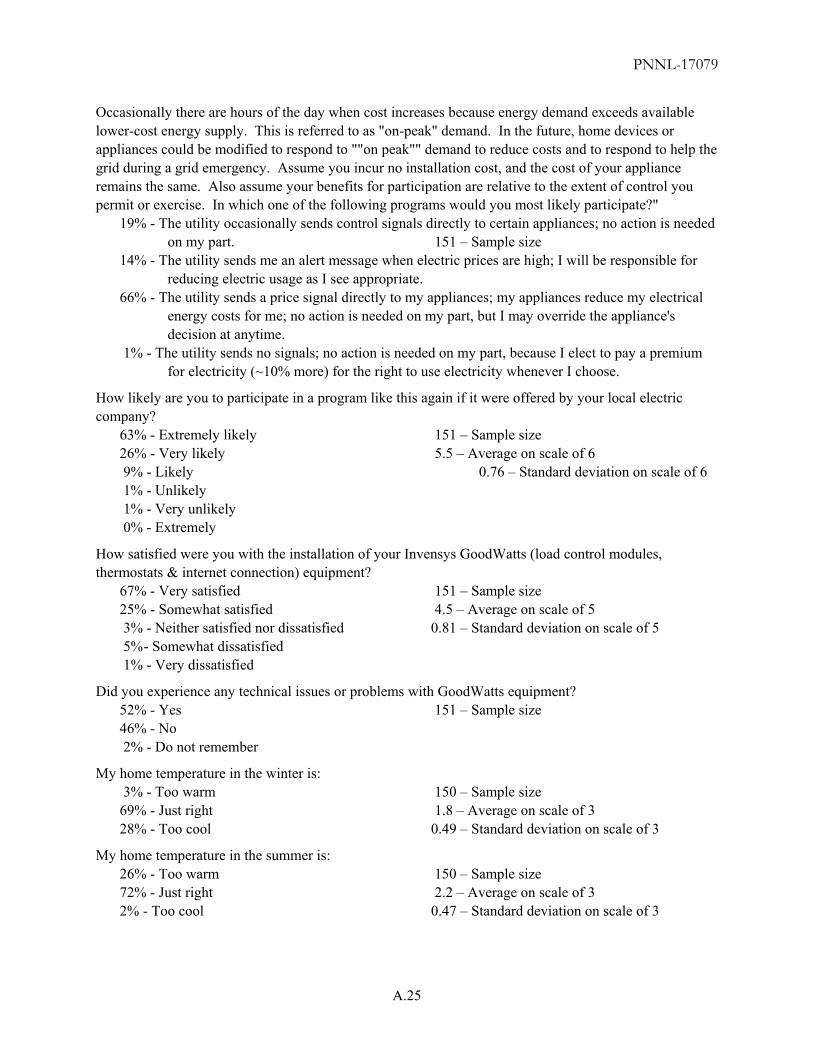
PNNL-17079
A.25
Occasionally there are hours of the day when cost increases because energy demand exceeds available lower-cost energy supply. This is referred to as "on-peak" demand. In the future, home devices or appliances could be modified to respond to ""on peak"" demand to reduce costs and to respond to help the grid during a grid emergency. Assume you incur no installation cost, and the cost of your appliance remains the same. Also assume your benefits for participation are relative to the extent of control you permit or exercise. In which one of the following programs would you most likely participate?"
19% - The utility occasionally sends control signals directly to certain appliances; no action is needed on my part. 151 – Sample size
14% - The utility sends me an alert message when electric prices are high; I will be responsible for reducing electric usage as I see appropriate.
66% - The utility sends a price signal directly to my appliances; my appliances reduce my electrical energy costs for me; no action is needed on my part, but I may override the appliance's decision at anytime.
1% - The utility sends no signals; no action is needed on my part, because I elect to pay a premium for electricity (~10% more) for the right to use electricity whenever I choose.
How likely are you to participate in a program like this again if it were offered by your local electric company?
63% - Extremely likely 151 – Sample size 26% - Very likely 5.5 – Average on scale of 6 9% - Likely 0.76 – Standard deviation on scale of 6 1% - Unlikely 1% - Very unlikely 0% - Extremely
How satisfied were you with the installation of your Invensys GoodWatts (load control modules, thermostats & internet connection) equipment?
67% - Very satisfied 151 – Sample size 25% - Somewhat satisfied 4.5 – Average on scale of 5 3% - Neither satisfied nor dissatisfied 0.81 – Standard deviation on scale of 5 5% - Somewhat dissatisfied 1% - Very dissatisfied
Did you experience any technical issues or problems with GoodWatts equipment? 52% - Yes 151 – Sample size 46% - No 2% - Do not remember
My home temperature in the winter is: 3% - Too warm 150 – Sample size 69% - Just right 1.8 – Average on scale of 3 28% - Too cool 0.49 – Standard deviation on scale of 3
My home temperature in the summer is: 26% - Too warm 150 – Sample size 72% - Just right 2.2 – Average on scale of 3 2% - Too cool 0.47 – Standard deviation on scale of 3
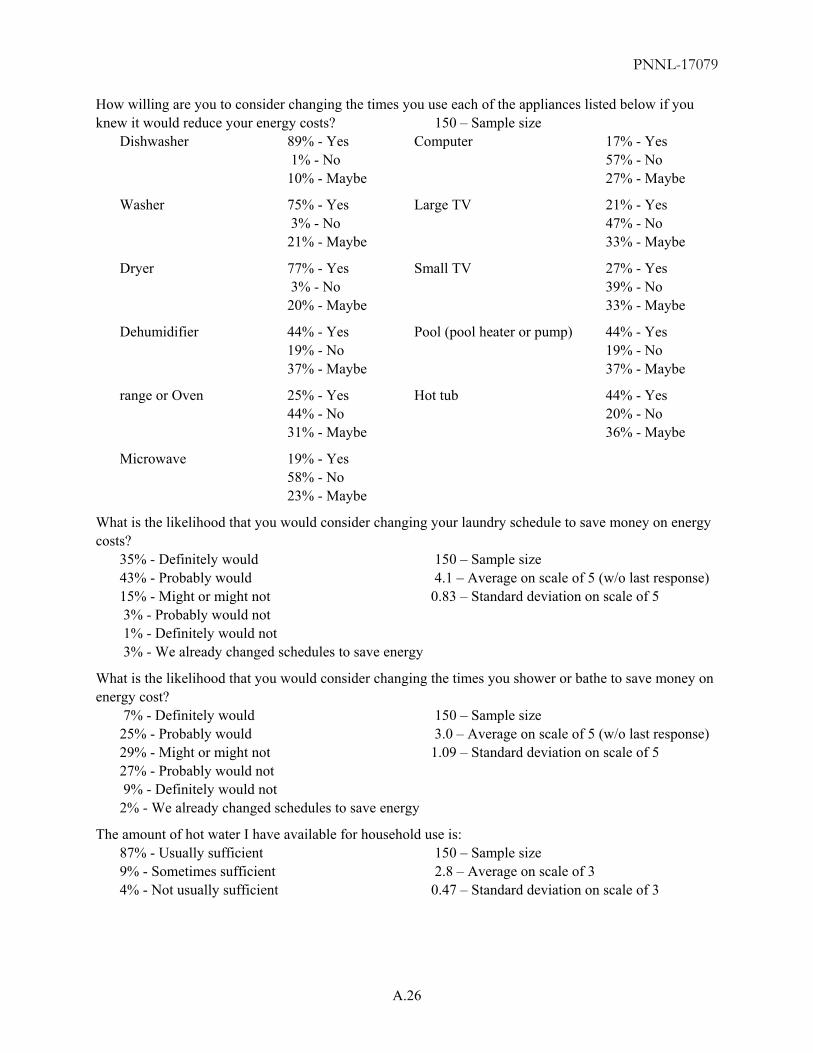
PNNL-17079
A.26
How willing are you to consider changing the times you use each of the appliances listed below if you knew it would reduce your energy costs? 150 – Sample size Dishwasher 89% - Yes 1% - No 10% - Maybe
Washer 75% - Yes 3% - No 21% - Maybe
Dryer 77% - Yes 3% - No 20% - Maybe
Dehumidifier 44% - Yes 19% - No 37% - Maybe
range or Oven 25% - Yes 44% - No 31% - Maybe
Microwave 19% - Yes 58% - No 23% - Maybe
Computer 17% - Yes 57% - No 27% - Maybe
Large TV 21% - Yes 47% - No 33% - Maybe
Small TV 27% - Yes 39% - No 33% - Maybe
Pool (pool heater or pump) 44% - Yes 19% - No 37% - Maybe
Hot tub 44% - Yes 20% - No 36% - Maybe
What is the likelihood that you would consider changing your laundry schedule to save money on energy costs?
35% - Definitely would 150 – Sample size 43% - Probably would 4.1 – Average on scale of 5 (w/o last response) 15% - Might or might not 0.83 – Standard deviation on scale of 5 3% - Probably would not 1% - Definitely would not 3% - We already changed schedules to save energy
What is the likelihood that you would consider changing the times you shower or bathe to save money on energy cost?
7% - Definitely would 150 – Sample size 25% - Probably would 3.0 – Average on scale of 5 (w/o last response) 29% - Might or might not 1.09 – Standard deviation on scale of 5 27% - Probably would not 9% - Definitely would not 2% - We already changed schedules to save energy
The amount of hot water I have available for household use is: 87% - Usually sufficient 150 – Sample size 9% - Sometimes sufficient 2.8 – Average on scale of 3 4% - Not usually sufficient 0.47 – Standard deviation on scale of 3
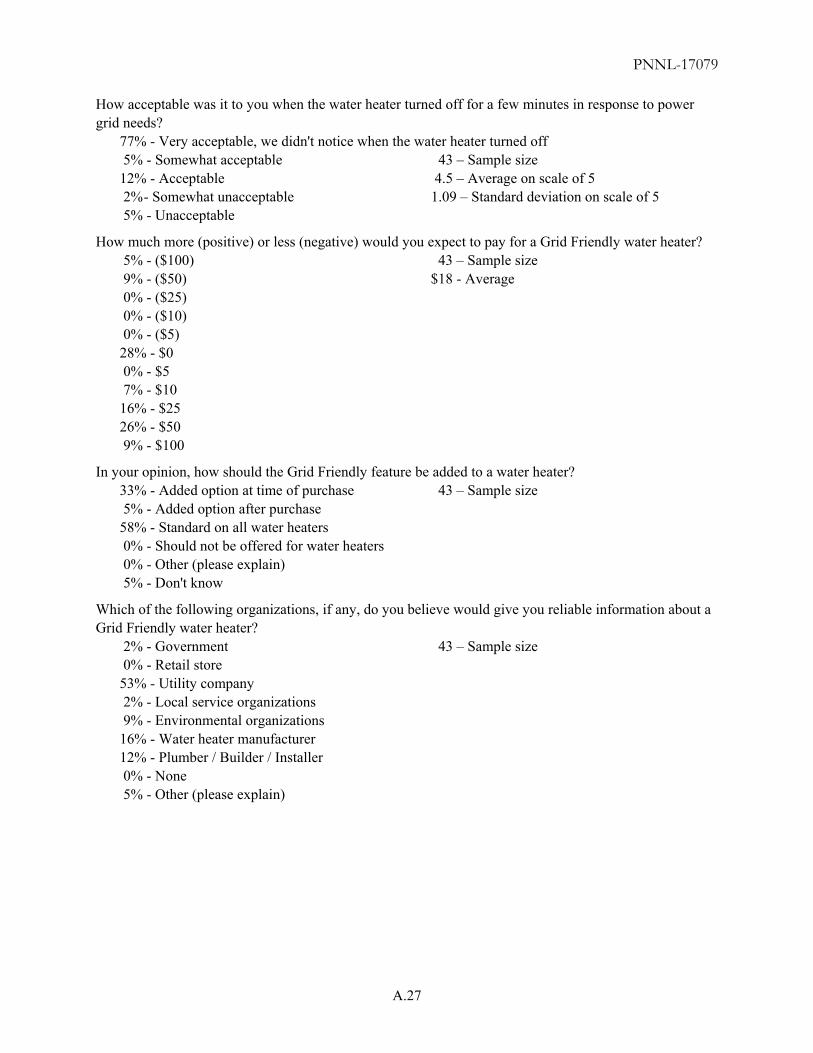
PNNL-17079
A.27
How acceptable was it to you when the water heater turned off for a few minutes in response to power grid needs?
77% - Very acceptable, we didn't notice when the water heater turned off 5% - Somewhat acceptable 43 – Sample size 12% - Acceptable 4.5 – Average on scale of 5 2% - Somewhat unacceptable 1.09 – Standard deviation on scale of 5 5% - Unacceptable
How much more (positive) or less (negative) would you expect to pay for a Grid Friendly water heater? 5% - ($100) 43 – Sample size 9% - ($50) $18 - Average 0% - ($25) 0% - ($10) 0% - ($5) 28% - $0 0% - $5 7% - $10 16% - $25 26% - $50 9% - $100
In your opinion, how should the Grid Friendly feature be added to a water heater? 33% - Added option at time of purchase 43 – Sample size 5% - Added option after purchase 58% - Standard on all water heaters 0% - Should not be offered for water heaters 0% - Other (please explain) 5% - Don't know
Which of the following organizations, if any, do you believe would give you reliable information about a Grid Friendly water heater?
2% - Government 43 – Sample size 0% - Retail store 53% - Utility company 2% - Local service organizations 9% - Environmental organizations 16% - Water heater manufacturer 12% - Plumber / Builder / Installer 0% - None 5% - Other (please explain)
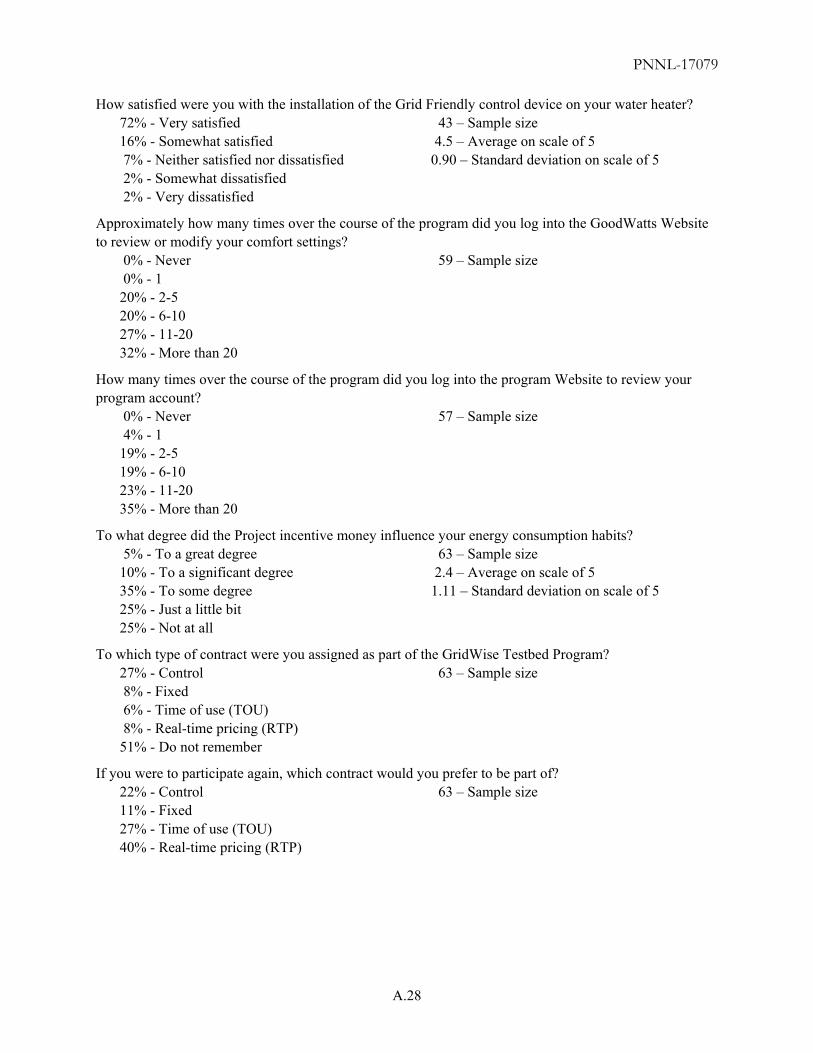
PNNL-17079
A.28
How satisfied were you with the installation of the Grid Friendly control device on your water heater? 72% - Very satisfied 43 – Sample size 16% - Somewhat satisfied 4.5 – Average on scale of 5 7% - Neither satisfied nor dissatisfied 0.90 – Standard deviation on scale of 5 2% - Somewhat dissatisfied 2% - Very dissatisfied
Approximately how many times over the course of the program did you log into the GoodWatts Website to review or modify your comfort settings?
0% - Never 59 – Sample size 0% - 1 20% - 2-5 20% - 6-10 27% - 11-20 32% - More than 20
How many times over the course of the program did you log into the program Website to review your program account?
0% - Never 57 – Sample size 4% - 1 19% - 2-5 19% - 6-10 23% - 11-20 35% - More than 20
To what degree did the Project incentive money influence your energy consumption habits? 5% - To a great degree 63 – Sample size 10% - To a significant degree 2.4 – Average on scale of 5 35% - To some degree 1.11 – Standard deviation on scale of 5 25% - Just a little bit 25% - Not at all
To which type of contract were you assigned as part of the GridWise Testbed Program? 27% - Control 63 – Sample size 8% - Fixed 6% - Time of use (TOU) 8% - Real-time pricing (RTP) 51% - Do not remember
If you were to participate again, which contract would you prefer to be part of? 22% - Control 63 – Sample size 11% - Fixed 27% - Time of use (TOU) 40% - Real-time pricing (RTP)

PNNL-17079
A.29
With respect to the money you earned during this experiment, which of the following most closely represents your experience?
29% - The money I received was well worth the effort. 63 – Sample size 27% - The money I received was worth the effort 32% - The money I received was about right for the effort. 3% - The money I received was not worth the effort. 10% - I have no idea how much money I made.
What is the current thermostat configuration setting for your home? 3% - No Price Reaction 63 – Sample size 0% - Maximum comfort 13% - Balanced comfort 37% - Economical comfort 10% - Comfortable economy 11% - Balanced economy 8% - Maximum economy 19% - Do not know
How well did you like using your home computer to control energy consumption? 51% - I really liked it. 63 – Sample size 29% - I liked it. 4.3 – Average on scale of 5 19% - I neither liked nor disliked it. 0.82 – Standard deviation on scale of 5 2% - I disliked it. 0% - I really disliked it