pacific gas and electric company 2023 general rate …
TRANSCRIPT
Application: 21-06-021 (U 39 M) Exhibit No.: (PG&E-4) Date: November 5, 2021 Witness(es): Various
PACIFIC GAS AND ELECTRIC COMPANY
2023 GENERAL RATE CASE
EXHIBIT (PG&E-4)
ELECTRIC DISTRIBUTION
CHAPTERS 16-APPENDIX A
[INCLUDES NOVEMBER 5, 2021 ERRATA]
VOLUME 3 OF 3
(PUBLIC VERSION)
(PG&E-4)
-i-
PACIFIC GAS AND ELECTRIC COMPANY 2023 GENERAL RATE CASE
EXHIBIT (PG&E-4) ELECTRIC DISTRIBUTION
TABLE OF CONTENTS
Chapter Title Witness
1 ELECTRIC DISTRIBUTION POLICY AND INTRODUCTION
Debbie W. Powell
2 ELECTRIC DISTRIBUTION FORECAST AND
INVESTMENT PLANNING [INCLUDES NOVEMBER 5, 2021 ERRATA]
Tatjana Rmus
Attachment A OVERVIEW AND DEMONSTRATION OF
INCREMENTALITY FOR THE RECOVERY OF COSTS RECORDED IN THE WILDFIRE MITIGATION PLAN MEMORANDUM ACCOUNT AND FIRE RISK MITIGATION MEMORANDUM ACCOUNT
Matthew Whorton
3 ELECTRIC DISTRIBUTION RISK MANAGEMENT
[INLUDES NOVEMBER 5, 2021 ERRATA] Paul McGregor
4 WILDFIRE RISK MITIGATIONS [INLUDES
NOVEMBER 5, 2021 ERRATA] Matthew T. Pender
4.1 SITUATIONAL AWARENESS AND
FORECASTING [INLUDES NOVEMBER 5, 2021 ERRATA]
Ben Almario
4.2 PSPS OPERATIONS Shawn Holder
4.3 SYSTEM HARDENING, ENHANCED
AUTOMATION, AND PSPS IMPACT MITIGATIONS [INLUDES NOVEMBER 5, 2021 ERRATA]
Mark Esguerra
Attachment A RECOVERY OF SYSTEM HARDENING,
ENHANCED AUTOMATION, AND PSPS IMPACT MITIGATIONS COSTS RECORDED IN THE WILDFIRE MITIGATION PLAN MEMORANDUM ACCOUNT AND FIRE RISK MITIGATION MEMORANDUM ACCOUNT
Mark Esguerra
4.4 COMMUNITY WILDFIRE SAFETY PROGRAM
PMO [INLUDES NOVEMBER 5, 2021 ERRATA] Matthew T. Pender

(PG&E-4) PACIFIC GAS AND ELECTRIC COMPANY
2023 GENERAL RATE CASE EXHIBIT (PG&E-4)
ELECTRIC DISTRIBUTION
TABLE OF CONTENTS (CONTINUED)
-ii-
Chapter Title Witness
Attachment A RECOVERY OF COMMUNITY WILDFIRE SAFETY
PROGRAM PMO COSTS RECORDED IN THE FIRE RISK MITIGATION MEMORANDUM ACCOUNT
Matthew T. Pender
4.5 INFORMATION TECHNOLOGY FOR WILDFIRE
MITIGATIONS Tahir Paroo
Attachment A RECOVERY OF INFORMATION TECHNOLOGY
COSTS RECORDED IN THE WILDFIRE MITIGATION PLAN MEMORANDUM ACCOUNT
Tahir Paroo
5 EMERGENCY PREPAREDNESS AND
RESPONSE [INLUDES NOVEMBER 5, 2021 ERRATA]
Angelina M. Gibson
6 ELECTRIC EMERGENCY RECOVERY [INLUDES
NOVEMBER 5, 2021 ERRATA] Angelina M. Gibson Marcus Wendler
Attachment A RECOVERY OF ELECTRIC EMERGENCY
RECOVERY COSTS RECORDED IN THE WILDFIRE MITIGATION PLAN MEMORANDUM ACCOUNT
Marcus Wendler
7 DISTRIBUTION SYSTEM OPERATIONS Kari Chester
8 FIELD METERING Craig W. Kurtz
9 VEGETATION MANAGEMENT [INLUDES NOVEMBER 5, 2021 ERRATA]
Kamran Rasheed
10 OVERHEAD AND UNDERGROUND ELECTRIC
ASSET INSPECTIONS [INLUDES NOVEMBER 5, 2021 ERRATA]
Mark Esguerra
Attachment A RECOVERY OF OVERHEAD ELECTRIC ASSET
INSPECTIONS COSTS RECORDED IN THE Mark Esguerra
(PG&E-4) PACIFIC GAS AND ELECTRIC COMPANY
2023 GENERAL RATE CASE EXHIBIT (PG&E-4)
ELECTRIC DISTRIBUTION
TABLE OF CONTENTS (CONTINUED)
-iii-
Chapter Title Witness
WILDFIRE MITIGATION PLAN MEMORANDUM ACCOUNT
11 OVERHEAD AND UNDERGROUND ELECTRIC
DISTRIBUTION MAINTENANCE [INLUDES NOVEMBER 5, 2021 ERRATA]
Mark Esguerra1
Attachment A RECOVERY OF OVERHEAD ELECTRIC
DISTRIBUTION MAINTENANCE COSTS RECORDED IN THE WILDFIRE MITIGATION PLAN MEMORANDUM ACCOUNT
Deanna (Trish) Fabris
12 POLE ASSET MANAGEMENT [INLUDES
NOVEMBER 5, 2021 ERRATA] Mark Esguerra1
Attachment A RECOVERY OF POLE ASSET MANAGEMENT
COSTS RECORDED IN THE WILDFIRE MITIGATION PLAN MEMORANDUM ACCOUNT
Jeffrey P. Borders
13 OVERHEAD AND UNDERGROUND ASSET
MANAGEMENT AND RELIABILITY [INLUDES NOVEMBER 5, 2021 ERRATA]
Mark Esguerra1
14 NETWORK ASSET MANAGEMENT [INLUDES
NOVEMBER 5, 2021 ERRATA] Mark Esguerra1
15 SUBSTATION ASSET MANAGEMENT [INLUDES
NOVEMBER 5, 2021 ERRATA] Maria P. Ly
Attachment A RECOVERY OF SUBSTATION ASSET
MANAGEMENT COSTS RECORDED IN THE WILDFIRE MITIGATION PLAN MEMORANDUM ACCOUNT
Maria P. Ly
1 New witness from the June 30, 2021 submission.
(PG&E-4) PACIFIC GAS AND ELECTRIC COMPANY
2023 GENERAL RATE CASE EXHIBIT (PG&E-4)
ELECTRIC DISTRIBUTION
TABLE OF CONTENTS (CONTINUED)
-iv-
Chapter Title Witness
16 DISTRIBUTION SYSTEM AUTOMATION AND PROTECTION [INLUDES NOVEMBER 5, 2021 ERRATA]
David Carroll
17 ELECTRIC DISTRIBUTION CAPACITY,
ENGINEERING, AND PLANNING [INLUDES NOVEMBER 5, 2021 ERRATA]
Satvir Nagra
18 NEW BUSINESS AND WORK AT THE REQUEST
OF OTHERS [INLUDES NOVEMBER 5, 2021 ERRATA]
Josh Jones
19 RULE 20A Tamon Norimoto
20 ELECTRIC DISTRIBUTION DATA MANAGEMENT AND TECHNOLOGY [INLUDES NOVEMBER 5, 2021 ERRATA]
Jadwindar Singh
21 INTEGRATED GRID PLATFORM AND GRID MODERNIZATION PLAN [INLUDES NOVEMBER 5, 2021 ERRATA]
Quinn Nakayama Elaine Reusing
Attachment
21A GRID MODERNIZATION PLAN – 10 YEAR VISION Quinn Nakayama
Attachment
21A1 GRID MODERNIZATION PLAN – UPGRADES INITIATED OR COMPLETED TO DATE
Quinn Nakayama
Attachment
21A2 DER-RELATED RESEARCH, DEVELOPMENT AND DEMONSTRATION (RD&D) PROJECTS
Quinn Nakayama
Attachment
21A3 COMMUNITY MICROGRID ENABLEMENT PROGRAM EVALUATION
Quinn Nakayama
22 ELECTRIC DISTRIBUTION SUPPORT
ACTIVITIES Tatjana Rmus
23 COMMUNITY REBUILD PROGRAM [INLUDES
NOVEMBER 5, 2021 ERRATA] Marcela Fox
(PG&E-4) PACIFIC GAS AND ELECTRIC COMPANY
2023 GENERAL RATE CASE EXHIBIT (PG&E-4)
ELECTRIC DISTRIBUTION
TABLE OF CONTENTS (CONTINUED)
-v-
Chapter Title Witness
Appendix A CONFIDENTIAL COSTS FOR THE ELKHORN BATTERY ENERGY STORAGE SYSTEM
Quinn Nakayama
(PG&E-4)
PACIFIC GAS AND ELECTRIC COMPANY
CHAPTER 16
DISTRIBUTION SYSTEM AUTOMATION AND PROTECTION
[INCLUDES NOVEMBER 5, 2021 ERRATA]
(PG&E-4)
16-i
PACIFIC GAS AND ELECTRIC COMPANY CHAPTER 16
DISTRIBUTION SYSTEM AUTOMATION AND PROTECTION
TABLE OF CONTENTS
A. Introduction ..................................................................................................... 16-1
1. Scope and Purpose ................................................................................. 16-1
2. Summary of Request ............................................................................... 16-1
3. Overview of Recorded and Forecast Costs .............................................. 16-1
a. Expense ............................................................................................. 16-2
b. Capital ............................................................................................... 16-3
4. Support for Request ................................................................................. 16-4
5. Organization of the Remainder of This Chapter ....................................... 16-4
B. Program and Risk Overview ........................................................................... 16-5
1. Program Description ................................................................................ 16-5
a. Program Overview ............................................................................. 16-5
b. Management Structure ...................................................................... 16-5
c. Key Metrics and Other Performance Measures ................................. 16-6
2. Risk Integration ........................................................................................ 16-6
a. RAMP Risk – Failure of ED Overhead (OH) Assets .......................... 16-7
1) Risk Overview ............................................................................. 16-7
2) Risk Mitigations and Controls ...................................................... 16-7
3) Changes to Controls ................................................................... 16-8
4) Cost Tables ................................................................................. 16-8
C. Activities, Costs, and Forecast Drivers by MWC ............................................ 16-8
1. Expense – MWC HX ................................................................................ 16-8
a. Automation Engineering Support ....................................................... 16-9
b. Protection Engineering Support ......................................................... 16-9
c. Automation Specialist Support ......................................................... 16-10
(PG&E-4) PACIFIC GAS AND ELECTRIC COMPANY
CHAPTER 16 DISTRIBUTION SYSTEM AUTOMATION AND PROTECTION
TABLE OF CONTENTS
(CONTINUED)
16-ii
d. Estimating Method ........................................................................... 16-10
2. Capital – MWC 09 .................................................................................. 16-10
a. Replace Substation SCADA (MAT 09B) .......................................... 16-11
b. Install Substation SCADA (MAT 09D) ............................................. 16-12
c. Replace Substation Protective Relays (MAT 09E) .......................... 16-13
d. Miscellaneous/Emergency SCADA Equipment Replacement (MAT 09F) ................................................................. 16-15
e. Estimating Method ........................................................................... 16-15
f. MWC 09 Forecast Summary ........................................................... 16-16
D. Compliance with Section 5.2 of the 2020 GRC Settlement Agreement (“Deferred Work Principles”) ......................................................................... 16-18
E. Cost Tables .................................................................................................. 16-19
(PG&E-4)
16-1
PACIFIC GAS AND ELECTRIC COMPANY 1
CHAPTER 16 2
DISTRIBUTION SYSTEM AUTOMATION AND PROTECTION 3
A. Introduction 4
1. Scope and Purpose 5
The purpose of this chapter is to demonstrate that Pacific Gas and 6
Electric Company’s (PG&E or the Company) expense and capital 7
expenditure forecasts for its Electric Distribution (ED) System Automation 8
and Protection (DSAP or ED SAP) Program activities are reasonable and 9
should be adopted by the California Public Utilities Commission 10
(Commission). 11
2. Summary of Request 12
PG&E requests that the Commission adopt its 2023 expense forecast 13
for the DSAP Program of $3.0 million which is $0.7 million more than 14
recorded 2020 expenses of $2.3 million.1 15
PG&E further requests that the Commission adopt its capital 16
expenditure forecasts for the DSAP Program of $25.5 million for 2021, 17
$26.4 million for 2022, $27.0 million for 2023, $27.8 million for 2024, 18
$28.5 million for 2025, and $29.3 million for 2026.2 The 2023 capital 19
forecast is $10.4 million, or 28 percent, lower than the 2020 recorded costs 20
of $37.4 million.3 21
Forecasts in this chapter are shown with escalation at the Major Work 22
Category (MWC) level and included in all expense and capital totals. For 23
more information on escalation, please refer to Chapter 2 of this exhibit. 24
3. Overview of Recorded and Forecast Costs 25
PG&E records and forecasts capital and expense DSAP Program 26
activities in the MWCs shown in Table 16-1. 27
1 Exhibit (PG&E-4), WP 16-5, line 5. 2 Exhibit (PG&E-4), WP 16-6, line 2. 3 Exhibit (PG&E-4), WP 16-6, line 2.

(PG&E-4)
16-2
TABLE 16-1 DSAP
MAJOR WORK CATEGORIES
Line No. MWCs Description
1 Expense MWC 2 HX DSAP Support 3 Capital MWC 4 09 ED SAP
Work in MWC 09 is further broken down into Maintenance Activity Type 1
(MAT) codes, as described in Section C.2. MWC HX does not use MAT 2
codes, but uses planning orders to further itemize expenditures as described 3
in Section C.1.4 4
a. Expense 5
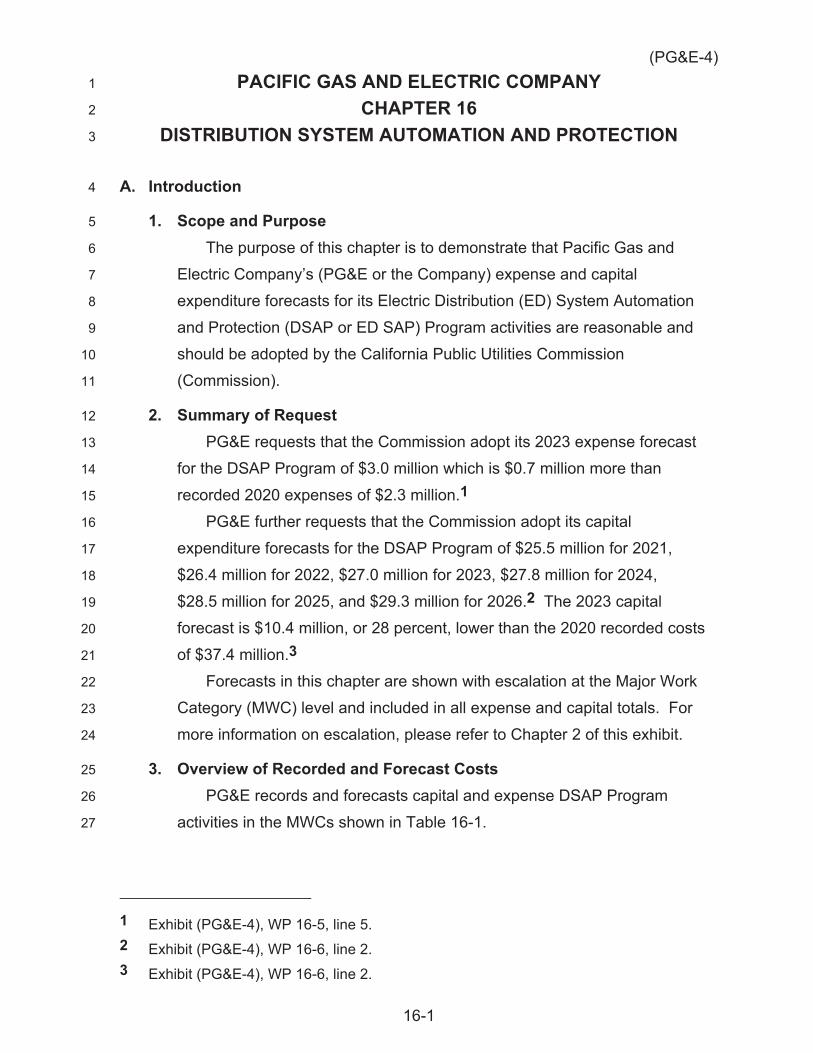
Figure 16-1 shows the walk from 2020 recorded expenses in 6
MWC HX to the 2023 expense forecast. The forecast expenses will 7
provide engineering support for automation and protection equipment. 8
The 2023 forecast of $3.0 million for MWC HX is $0.7 million higher than 9
the 2020 recorded expenses of $2.3 million.5 The variance reflects an 10
increase to review protective relay settings for distribution feeder circuits 11
in support of Public Safety Power Shutoff (PSPS), outage reviews, 12
standards development, Rule 21 compliance, Distributed Generation 13
(DG) support, mobile generators and islanding initiative. Supervisory 14
Control and Data Acquisition (SCADA) software license fees previously 15
recorded in MWC HX will be recorded in MWC HG beginning in 2021.6 16
4 PG&E used MAT HXA solely for the purpose of running risk model as noted in
Tables 16-2 and 16-3. 5 Exhibit (PG&E-4), WP 16-5, line 5. 6 Exhibit (PG&E-4), Ch. 7, Section C.1.c.
(PG&E-4)
16-3
FIGURE 16-1 MWC HX EXPENSE WALK 2020-2023
(THOUSANDS OF NOMINAL DOLLARS)
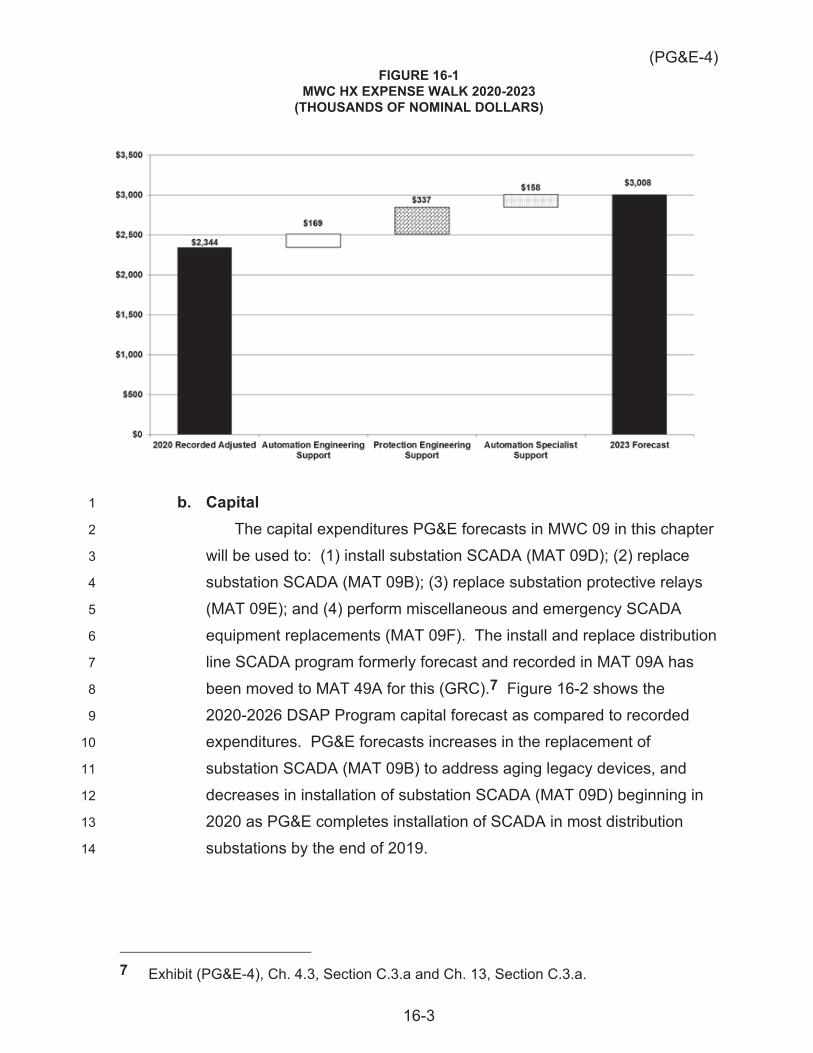
b. Capital 1
The capital expenditures PG&E forecasts in MWC 09 in this chapter 2
will be used to: (1) install substation SCADA (MAT 09D); (2) replace 3
substation SCADA (MAT 09B); (3) replace substation protective relays 4
(MAT 09E); and (4) perform miscellaneous and emergency SCADA 5
equipment replacements (MAT 09F). The install and replace distribution 6
line SCADA program formerly forecast and recorded in MAT 09A has 7
been moved to MAT 49A for this (GRC).7 Figure 16-2 shows the 8
2020-2026 DSAP Program capital forecast as compared to recorded 9
expenditures. PG&E forecasts increases in the replacement of 10
substation SCADA (MAT 09B) to address aging legacy devices, and 11
decreases in installation of substation SCADA (MAT 09D) beginning in 12
2020 as PG&E completes installation of SCADA in most distribution 13
substations by the end of 2019. 14
7 Exhibit (PG&E-4), Ch. 4.3, Section C.3.a and Ch. 13, Section C.3.a.

(PG&E-4)
16-4
FIGURE 16-2 DSAP
MWC 09 CAPITAL RECORDED AND FORECAST BY SUBPROGRAM 2020-2026 (THOUSANDS OF NOMINAL DOLLARS)
4. Support for Request 1
Work in the DSAP Program supports the safe, reliable, efficient 2
operation of ED substations. PG&E’s capital and expense expenditure 3
forecasts for the DSAP Program are reasonable because the Company: 4
Manages its automation and protection equipment assets effectively to 5
maintain safe and reliable service for PG&E customers; 6
Forecasts expenditures to replace aging and obsolete assets; 7
Provides efficiency and flexibility for electric operations (EO) by using 8
SCADA; 9
Provides engineering support for the maintenance and operation of 10
automation and protection equipment; and 11
Controls Risk Assessment and Mitigation Phase (RAMP) risk Failure of 12
ED Overhead Assets. 13
5. Organization of the Remainder of This Chapter 14
This chapter will discuss the expense and capital program activities and 15
costs associated with the DSAP program including estimating methods and 16
costs. The remainder of this chapter is organized as follows: 17
Section B – Program and Risk Overview; 18
(PG&E-4)
16-5
Section C – Activities, Costs, and Forecast Drivers by MWC; 1
Section D – Compliance with Section 5.2 of the 2020 GRC Settlement 2
Agreement (“Deferred Work Principles”); and 3
Section E – Cost Tables. 4
B. Program and Risk Overview 5
1. Program Description 6
a. Program Overview 7
The DSAP Program covers the installation, upgrade, and 8
replacement of remotely controlled automation and protection 9
equipment in distribution substations. As PG&E has reached near 10
100 percent substation SCADA penetration in 2019, the DSAP 11
Program’s primary focus will shift to replacing obsolete SCADA and 12
protection equipment. This work will improve operating efficiency, 13
enable better outage response and diagnosis, improve system 14
protection, and improve employee and public safety by enabling PG&E 15
to automatically and remotely shut off electricity during emergencies as 16
well as disabling circuit breaker reclosing during periods of high fire risk. 17
b. Management Structure 18
PG&E’s Vice President (VP) of Asset Risk Management leads an 19
organization responsible for the activities discussed in this chapter. 20
A Senior Director of Electric Asset Strategy reports to the VP of Asset 21
Risk Management. The Senior Director of Electric Asset Strategy 22
oversees a team of Directors and Managers who lead the development 23
of PG&E’s ED substation and storage strategies. These groups’ roles 24
are to manage and improve the safety and reliability of PG&E’s electric 25
assets. They partner with other PG&E departments and 26
cross-functional teams to address electric infrastructure system needs, 27
including system protection and automation. 28
The System Automation department, led by a Senior Manager, 29
manages and executes the substation automation and protection 30
programs covered in this chapter. Members of this group work with 31
various PG&E groups to refine specific projects. Execution of the work 32
(PG&E-4)
16-6
is coordinated by project managers and performed by PG&E employees 1
and contract personnel. 2
c. Key Metrics and Other Performance Measures 3
Key metrics by which the various subprograms are measured within 4
this chapter are categorized by completed and forecasted units. These 5
unit measures are specific to each subprogram and are defined as 6
follows: 7
Replace Substation SCADA (MAT 09B) – The number of distribution 8
Remote Terminal Units (RTU), Human Machine Interface (HMI) and 9
circuit breaker intelligent electronic devices in which SCADA 10
functionality is replaced; 11
Install Substation SCADA (MAT 09D) – The number of distribution 12
circuit breakers for which SCADA functionality is installed; 13
Replace Substation Protective Relays (MAT 09E) – The number of 14
distribution transformer protective packages replaced; and 15
Miscellaneous/Emergency SCADA Equipment Replacement 16
(MAT 09F) – No units are tracked because this subprogram 17
represents unplanned emergency replacement work which varies 18
significantly in scope. 19
2. Risk Integration 20
Chapter 3 of this exhibit describes how EO uses the Enterprise and 21
Operational Risk Management program to manage electric system risks. 22
Table 16-2 below shows the EO risk associated with the forecasts discussed 23
in this chapter. 24
TABLE 16-2 RISKS DISCUSSED IN THIS CHAPTER
Line No. Risk Name Risk ID Type of Risk MAT
1 Failure of ED Overhead Assets DOVHD RAMP 09B, 09D, 09E, 09F, HXA, HX#
(PG&E-4)
16-7
a. RAMP Risk – Failure of ED Overhead (OH) Assets 1
1) Risk Overview 2
The Failure of ED OH Assets risk is defined as the failure of 3
distribution OH assets or lack of remote operation functionality that 4
may result in public or employee safety issues, property damage, 5
environmental damage, or inability to deliver energy. Failure of ED 6
OH Assets was one of PG&E’s 2020 RAMP risks.8 7
In Chapter 3 of this Exhibit, PG&E described how management 8
of the Failure of ED OH Assets risk has changed since the filing of 9
the 2020 RAMP Report, listed each EO mitigation and control and 10
indicated if it has changed since the 2020 RAMP Report filing, and 11
provided updated Risk Spend Efficiency scores. In this chapter 12
PG&E provides more information about the control and the work 13
forecast in this chapter needed for implementation. 14
2) Risk Mitigations and Controls 15
As shown in the Table 16-3 below, PG&E has one control—16
Supervisory Control and Data Acquisition—related to work forecast 17
in this chapter. This program was determined to reduce the 18
frequency or consequence of risk of failure of distribution substation 19
assets. A brief description of the control is provided in the table 20
below. More detail is included in the 2020 RAMP Report.9 21
8 PG&E’s RAMP Report (June 30, 2020), Ch. 11. 9 PG&E’s RAMP Report (June 30, 2020), Ch. 11, starting at p. 11-14.

(PG&E-4)
16-8
TABLE 16-3 FAILURE OF ED OH ASSETS
FORECAST CONTROL
Line No.
Control Number
Control Name Description
Risk Drivers Addressed
Additional Information
MAT Code
1 DOVHD-C007 SCADA Replace outmoded SCADA/RTU in ED substations to provide visibility and remote controllability to Operations; engineering support for the maintenance and operation of automation and protection equipment; upgrade/replace banks, relays and associated equipment; ED Sub Emergency replacement work.
Foundational See Section C.1 for information on expense activities and C.2 for information on capital activities
09B, 09D, 09E, 09F, HXA, HX#
3) Changes to Controls 1
PG&E has not modified its portfolio of controls related to work 2
forecast in this chapter since filing the RAMP Report. 3
In RAMP, PG&E described this control as including the 4
installation, upgrade and replacement of remotely controlled 5
automation and protection equipment in distribution substations and 6
on feeder circuits. PG&E has updated the definition to include 7
“circuit breakers” as part of the program to provide clarity. 8
4) Cost Tables 9
Forecast costs for the SCADA control are shown in 10
workpapers.10 11
C. Activities, Costs, and Forecast Drivers by MWC 12
1. Expense – MWC HX 13
PG&E describes below the major expense drivers to the forecast shown 14
in Figure 16-1. Work in MWC HX includes engineering and technical 15
support for PG&E’s automation and protection equipment. In addition, it 16
includes the service and software costs associated with distribution 17
automation equipment. The engineering support consists of three key 18
10 Exhibit (PG&E-4), WP 3-9, line 32.
(PG&E-4)
16-9
components: (1) Automation Engineering support; (2) Protection 1
Engineering support; and (3) Automation Specialist support, which includes 2
the wildfire risk mitigation including PSPS. 3
a. Automation Engineering Support 4
PG&E’s 2023 forecast for Automation Engineering Support 5
is $0.8 million, which is $0.2 million higher than 2020 recorded costs of 6
$0.6 million.11 This minor increase is associated with a headcount 7
increase to support PSPS and other emergent technology driven 8
programs. 9
The Automation Engineering Support group assists operations and 10
maintenance (O&M) teams with the implementation of substation 11
automation equipment. This group works with engineering and 12
construction groups to oversee substation automation projects and 13
perform functions such as specifying RTU configurations and 14
telecommunications requirements. 15
b. Protection Engineering Support 16
PG&E’s 2023 forecast for Protection Engineering Support 17
is $1.6 million, which is $0.3 million higher than 2020 recorded costs of 18
$1.2 million.12 The increase is to review protective relay settings for 19
distribution feeder circuits in support of PSPS, and provide support to 20
perform annual audits on distribution feeders in order to capture 21
efficiency and improve system reliability, annual training for distribution 22
planners/operations, outage reviews, standards development, Rule 21 23
compliance, DG support, mobile generators and islanding initiative. 24
The Protection Engineering Support group helps the O&M teams 25
with the implementation of substation protection equipment. This group 26
is responsible for relaying and protecting all distribution substation 27
assets, including providing protection requirements for distribution 28
automation projects, participating in substation project related on-site 29
meetings, reviewing engineering drawings, and providing day-to-day 30
support of protective systems, including PSPS. 31
11 Exhibit (PG&E-4), WP 16-5, line 1. 12 Exhibit (PG&E-4), WP 16-5, line 2.

(PG&E-4)
16-10
c. Automation Specialist Support 1
The Automation Specialist support group assists with the 2
deployment, operation, and maintenance of distribution automation 3
systems associated with the implementation of substation automation 4
appliances including but not limited to HMIs. 5
Prior to 2020, PG&E recorded costs in MWC HX for SCADA 6
Specialists. These SCADA Specialists programmed both SCADA and 7
substation HMI. In 2020, the SCADA Specialists who work on SCADA 8
were moved to the Business Applications department. Labor costs 9
associated with their work are being recorded in MWC HG as of 2020 10
and the forecast for that work is discussed in Distribution System 11
Operations chapter of this exhibit.13 The remaining SCADA Specialists, 12
who work on substation HMI, have been reclassified as Automation 13
Specialists; costs for these Automation Specialists continue to be 14
recorded and forecast in MWC HX. PG&E’s 2020 recorded costs in 15
MWC HX also include the 2020 license fee for the RT-SCADA 16
application; future RT-SCADA license fees will be funded from 17
MWC HG. 18
PG&E’s 2023 forecast in this area is $0.7 million, which is 19
$0.2 million higher than 2020 recorded costs of $0.5 million.14 The 20
increase is due to a small increase in headcount. 21
d. Estimating Method 22
PG&E developed its expense expenditures forecast based on 23
historical data and anticipated labor forecast adjustments. 24
2. Capital – MWC 09 25
MWC 09 includes capital expenditures for installing new and replacing 26
obsolete substation automation equipment and deficient protective relays.15 27
PG&E is nearing 100 percent SCADA penetration in substations. As a 28
13 Exhibit (PG&E-4), Ch. 7. 14 Exhibit (PG&E-4), WP 16-5, line 3. 15 The installation/replacement of new line SCADA, which was historically forecasted and
recorded in MAT 09A, is now part of MAT 49A, which is discussed in Exhibit (PG&E-4), Ch. 4.3 and 13.
(PG&E-4)
16-11
result, PG&E’s forecast for new substation SCADA installation in MAT 09D 1
is lower than in the past. However, PG&E forecasts increased lifecycle 2
replacements in MAT 09B for this GRC period. PG&E describes below the 3
major capital drivers to the forecast shown in Figure 16-2. 4
a. Replace Substation SCADA (MAT 09B) 5
A substation RTU is a microprocessor controlled electronic device 6
located in a substation that controls and collects equipment operating 7
information from various sensors, and then transmits it to one of PG&E’s 8
distribution control centers. A substation may contain multiple RTUs 9
depending on the original installation design requirements and 10
operational needs. 11
Because PG&E reached near 100 percent substation SCADA 12
penetration in 2019, the DSAP Program’s primary focus has shifted to 13
replacing obsolete SCADA equipment. PG&E’s existing substation 14
SCADA system is composed of equipment from several companies, and 15
includes RTUs and electronic components of various vintages, some as 16
old as 25 years. A growing number of existing substation RTUs are 17
either obsolete, reaching the end of their operational lives, or are not 18
functional and cannot be repaired due to the unavailability of spare 19
parts. As technology advances, it is often not feasible to maintain 20
compatibility with these legacy RTUs when installing required new 21
instrumentation and software. When a component of the SCADA 22
system fails, it often jeopardizes PG&E’s ability to operate the electric 23
facility remotely and properly gather data for system operators. 24
Work in MAT 09B targets the replacement of obsolete RTUs; 25
associated peripheral devices and circuit breaker protective relays within 26
distribution substations may also be replaced to ensure compatibility 27
with new automation systems. PG&E replaced 133 units in 30 electric 28
substations throughout its service territory between 2016 and 2020. 29
PG&E forecasts replacement of 392 legacy SCADA systems from 2021 30
(PG&E-4)
16-12
to 2026 with an estimated average cost of $211,000 per unit.16 This 1
unit cost is a significant increase over the unit cost forecast in 2020 2
GRC due to the increased complexity of the projects.17 3
PG&E’s forecast for MAT 09B is $10.3 million in 2021, $12.2 million 4
in 2022, $18.2 million in 2023, $18.5 million in 2024, $16.4 million in 5
2025, and $16.9 million in 2026.18 PG&E’s 2023 forecast is $6.8 million 6
more than 2020 recorded capital expenditures of $11.4 million.19 The 7
increase is due to the need to proactively replace legacy substation 8
RTUs and associated peripheral devices to maintain SCADA system 9
reliability and Fault Location, Isolation and Service Restoration (FLISR) 10
scheme operability. The subprogram is primarily composed of projects 11
less than $3 million. 12
b. Install Substation SCADA (MAT 09D) 13
PG&E’s forecast for MAT 09D is $6.8 million in 2021, $6.3 million in 14
2022, $0.5 million in 2023, $3.0 thousand in 2024, $3.3 million in 2025, 15
and $3.0 million in 2026.20 The 2023 forecast is $13.8 million less than 16
2020 recorded capital expenditures of $14.3 million.21 The variance is 17
primarily due to the fact that PG&E’s multi-year substation SCADA 18
installation program achieved nearly 100 percent completion by the end 19
of 2019. PG&E’s 2021 and 2022 forecasts reflect the cost of projects 20
scheduled to be completed by 2023.22 The 2023 forecast reflects 21
close-out costs associated with projects which are forecasted to become 22
operational in 2022 and earlier. The 2024-2026 forecasts are primarily 23
16 Units are defined as the replacement work necessary to remove existing SCADA
equipment and design, purchase, install and release fully operational remote control over a distribution feeder’s circuit breaker, motor operator air switches and transformers.
17 Exhibit (PG&E-4), WP 16-15, line 29, WP 16-16, and WP 16-18. 18 Exhibit (PG&E-4), WP 16-12, line 1. 19 Exhibit (PG&E-4), WP 16-12, line 1. 20 Exhibit (PG&E-4), WP 16-12, line 2. 21 Exhibit (PG&E-4), WP 16-12, line 2. 22 Exhibit (PG&E-4), WP 16-12, line 2.
(PG&E-4)
16-13
focused on the installation of SCADA at Oakland L Substation, a 1
substation that does not currently have SCADA installed.23 2
PG&E has deployed SCADA at most of its substations, and 3
proposes to continue these installations to further capture benefits and 4
address a number of important issues. First, addressing public and 5
system safety risk is PG&E’s highest priority, and SCADA technology 6
provides the ability for remote distribution operators to operate relays 7
and quickly de-energize downed lines and equipment in support of 8
wildfire risk management. Second, operational improvements are 9
gained through remotely switching substation equipment, obtaining 10
real-time information about the condition of the system, and providing 11
historical data to examine line loading trends, forecast future loading, 12
and perform outage investigations. Finally, substation SCADA 13
deployments are foundational to Smart Grid technologies such as the 14
deployment of FLISR to quickly and automatically restore customers’ 15
service after an outage. In 2020, PG&E installed SCADA on 50 circuit 16
breakers at 15 PG&E substations throughout its service territory, 17
increasing the distribution SCADA circuit breaker penetration from 18
97.9 percent to 99.5 percent. PG&E plans to complete the remaining 19
0.5 percent of circuit breakers in conjunction with programs in other lines 20
of business such as asset management circuit breaker and switchgear 21
replacement programs. There will continue to be forecasts in this 22
subprogram to coordinate the installation of SCADA with other line of 23
business programs. The majority of the subprogram is composed of 24
projects less than $3 million. 25
c. Replace Substation Protective Relays (MAT 09E) 26
MAT 09E covers the proactive replacement of aging substation 27
protective relays. These relays serve the purpose of tripping substation 28
circuit breakers when faults are detected, such as in cases of wires 29
down resulting in over-current events. PG&E’s forecast is $2.6 million in 30
2021, $2.5 million in 2022, $2.9 million in 2023, $3.7 million in 2024, 31
23 Exhibit (PG&E-4), WP 16-14, line 1.
(PG&E-4)
16-14
$3.1 million in 2025, and $3.4 million in 2026.24 PG&E’s 2023 forecast 1
is $0.5 million less than 2020 recorded capital expenditures of 2
$3.4 million.25 3
PG&E’s distribution system has approximately 14,985 distribution 4
electromechanical relays throughout its service territory in which 5
approximately 2,408 are associated with distribution transformer 6
protection with an average age of 27 years. It is estimated that poor 7
performing relay types account for only 2 percent of the relay population 8
but cause 32 percent of relay failure trips. Some driving factors are age 9
of relays combined with other technical evaluation factors (e.g., Current 10
Transformer saturation), criticality of the station, number of customers 11
that could be affected, and type of customers. PG&E estimates that 12
27 percent of the relay population is at or near the end of its service life 13
and proposes to replace older mechanical relays with new 14
microprocessor relays that have integrated protection, automation and 15
control functionality. This integrated replacement approach allows for 16
more cost-effective installation and testing, and standardizes design, 17
which leads to better operability compared to separately installed 18
systems. PG&E’s System Protection Department manages a relay 19
replacement list, and prioritizes replacements based on age and other 20
technical evaluation factors including but not limited to criticality of the 21
station, number of customers that could be affected, and type of 22
customers. 23
PG&E expects that unit costs will remain similar to historical 24
averages but is forecasting more units for the 2023 GRC cycle. PG&E 25
proposes to replace protective relays on an average of 30 substation 26
transformers annually from 2020 through 2026.26 27
24 Exhibit (PG&E-4), WP 16-12, line 3. 25 Exhibit (PG&E-4), WP 16-12, line 3. 26 Exhibit (PG&E-4), WP 16-17.
(PG&E-4)
16-15
d. Miscellaneous/Emergency SCADA Equipment 1
Replacement (MAT 09F) 2
The work in MAT 09F involves replacing inoperable automation and 3
protection equipment (RTUs, peripheral boards, and protective relays) 4
on an emergency basis. The forecast covers in-service failures as well 5
as emergency replacements of equipment whose risk of failure is 6
imminent. While PG&E’s substation SCADA strategy is to proactively 7
replace RTUs and associated equipment on a scheduled basis prior to 8
failure (as part of work in MAT 09B discussed above), some 9
unanticipated failures do occur requiring emergency replacement. The 10
amount of work that PG&E needs to perform in this category is 11
forecasted with historical failure expenditures in relation to the number 12
of automation and protection devices in electric substation and feeder 13
circuits. 14
PG&E’s 2023 forecast of $5.4 million is $2.9 million less than 2020 15
recorded expenditures of $8.3 million.27 PG&E’s 2020 recorded 16
expenditures were higher than forecast in the 2020 GRC and higher 17
than historical trends; PG&E’s 2023 forecast is consistent with a 18
three-year (2018-2020) average of historical costs. PG&E’s 2021 19
forecast is $5.8 million, 2022 forecast is $5.3 million, 2024 forecast is 20
$5.6 million, 2025 forecast is $5.7 million, and 2026 forecast is 21
$5.9 million.28 22
e. Estimating Method 23
PG&E developed its capital expenditures forecast based on 24
determining the number of work units to be performed and multiplying 25
them by the appropriate unit cost. Determining the number of units is 26
based on program objectives, specific project requirements identified by 27
field personnel, PG&E standards and guidelines, and estimates based 28
on historical data, such as actual units completed. Asset Management 29
27 Exhibit (PG&E-4), WP 16-12, line 4. 28 Exhibit (PG&E-4), WP 16-12, line 4.
(PG&E-4)
16-16
determined the most appropriate unit cost to use in each case. Please 1
refer to WPs for more details.29 2
f. MWC 09 Forecast Summary 3
Table 16-4 provides forecast capital expenditures for MWC 09 by 4
sub-program.5
29 Exhibit (PG&E-4), WP 16-15, WP 16-16, and WP 16-18.

16-17
(PG&E-4) TA
BLE
16-
4 M
WC
09
CA
PITA
L EX
PEN
DIT
UR
E R
ECO
RD
ED A
ND
FO
REC
AST
(T
HO
USA
ND
S O
F N
OM
INA
L D
OLL
AR
S)
Line
N
o.
Subp
rogr
am/T
itle
MAT
C
ode
2020
R
ecor
ded
Adju
sted
20
21
Fore
cast
20
22
Fore
cast
20
23
Fore
cast
20
24
Fore
cast
20
25
Fore
cast
20
26
Fore
cast
1 R
epla
ce S
ubst
atio
n SC
ADA
09B
$11,
417
$10,
292
$12,
228
$18,
210
$18,
465
$16,
426
$16,
944
2 In
stal
l Sub
stat
ion
SCAD
A 09
D
14,3
07
6,84
1 6,
329
470
3 3,
301
3,04
0 3
Rep
lace
Sub
stat
ion
Prot
ectiv
e R
elay
s 09
E 3,
399
2,58
0 2,
540
2,90
8 3,
714
3,10
0 3,
430
4 M
isce
llane
ous/
Emer
genc
y SC
ADA
Equi
pmen
t Rep
lace
men
t 09
F 8,
314
5,76
9 5,
274
5,41
6 5,
563
5,71
3 5,
867
5 To
tal
$3
7,43
7 $2
5,48
3 $2
6,37
1 $2
7,00
3 $2
7,74
5 $2
8,54
0 $2
9,28
1
(PG&E-4)
16-18
D. Compliance with Section 5.2 of the 2020 GRC Settlement Agreement 1
(“Deferred Work Principles”) 2
The 2020 GRC Settlement Agreement requires PG&E to include testimony 3
in this GRC on deferred work if the following criteria are met: 4
1) The work was requested and authorized based on representations that it 5
was needed to provide safe and reliable service (Check 1); 6
2) PG&E did not perform all of the authorized and funded work, as measured 7
by authorized (explicit or imputed) units of work (Check 2); and 8
3) PG&E continues to represent that the curtailed work is necessary to provide 9
safe and reliable service (Check 3). 10
For work covered in this Chapter, Check 1 was deemed to apply for all 11
MWCs. Under PG&E’s analysis, Check 2 does not apply as work in this chapter 12
is not unitized. 13
Work that was authorized in the 2020 GRC for MWCs in this chapter is 14
needed to provide safe and reliable service, however there was not work that 15
met the criteria for deferred work as described in the Settlement Agreement. 16
This analysis is presented in the workpapers supporting Chapter 2 of this 17
Exhibit.30 18
19
30 Exhibit (PG&E-4) WP 2-13.
(PG&E-4)
16-19
E. Cost Tables 1
The capital and expense forecasts for the DSAP Program are summarized 2
in the following tables: 3
Table 16-5 below lists the expense MWC, showing 2016 through 2020 4
recorded expenditures and 2021 through 2023 forecast expenditures. 5
Table 16-6 below lists the capital MWC, showing 2016 through 2020 6
recorded expenditures and 2021 through 2026 forecast expenditures.7
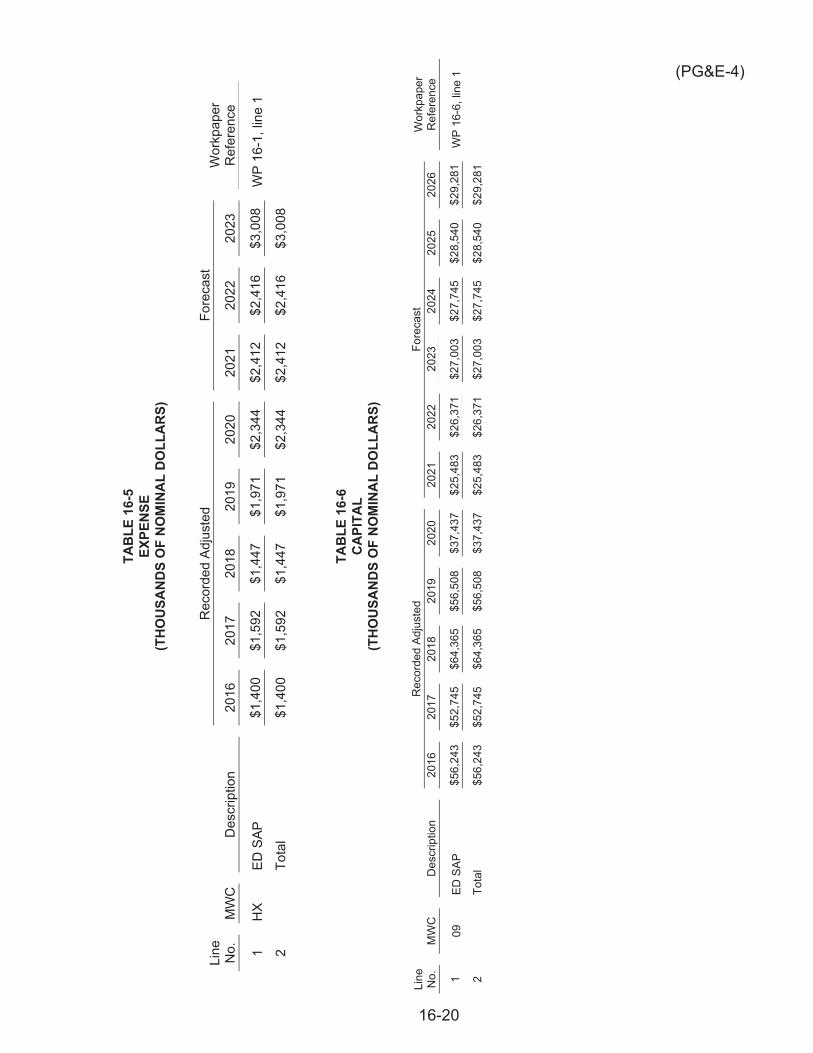
16-20
(PG&E-4)
TAB
LE 1
6-5
EXPE
NSE
(T
HO
USA
ND
S O
F N
OM
INA
L D
OLL
AR
S)
Line
N
o.
MW
C
Des
crip
tion
Rec
orde
d Ad
just
ed
Fore
cast
W
orkp
aper
R
efer
ence
20
16
2017
20
18
2019
20
20
2021
20
22
2023
1 H
X ED
SAP
$1
,400
$1
,592
$1
,447
$1
,971
$2
,344
$2
,412
$2
,416
$3
,008
W
P 16
-1, l
ine
1
2
Tota
l $1
,400
$1
,592
$1
,447
$1
,971
$2
,344
$2
,412
$2
,416
$3
,008
TAB
LE 1
6-6
CA
PITA
L (T
HO
USA
ND
S O
F N
OM
INA
L D
OLL
AR
S)
Line
N
o.
MW
C
Des
crip
tion
Rec
orde
d Ad
just
ed
Fore
cast
W
orkp
aper
R
efer
ence
20
16
2017
20
18
2019
20
20
2021
20
22
2023
20
24
2025
20
26
1 09
ED
SAP
$5
6,24
3 $5
2,74
5 $6
4,36
5 $5
6,50
8 $3
7,43
7 $2
5,48
3 $2
6,37
1 $2
7,00
3 $2
7,74
5 $2
8,54
0 $2
9,28
1 W
P 16
-6, l
ine
1
2
Tota
l $5
6,24
3 $5
2,74
5 $6
4,36
5 $5
6,50
8 $3
7,43
7 $2
5,48
3 $2
6,37
1 $2
7,00
3 $2
7,74
5 $2
8,54
0 $2
9,28
1
(PG&E-4)
-i-
PACIFIC GAS AND ELECTRIC COMPANY 2023 GENERAL RATE CASE
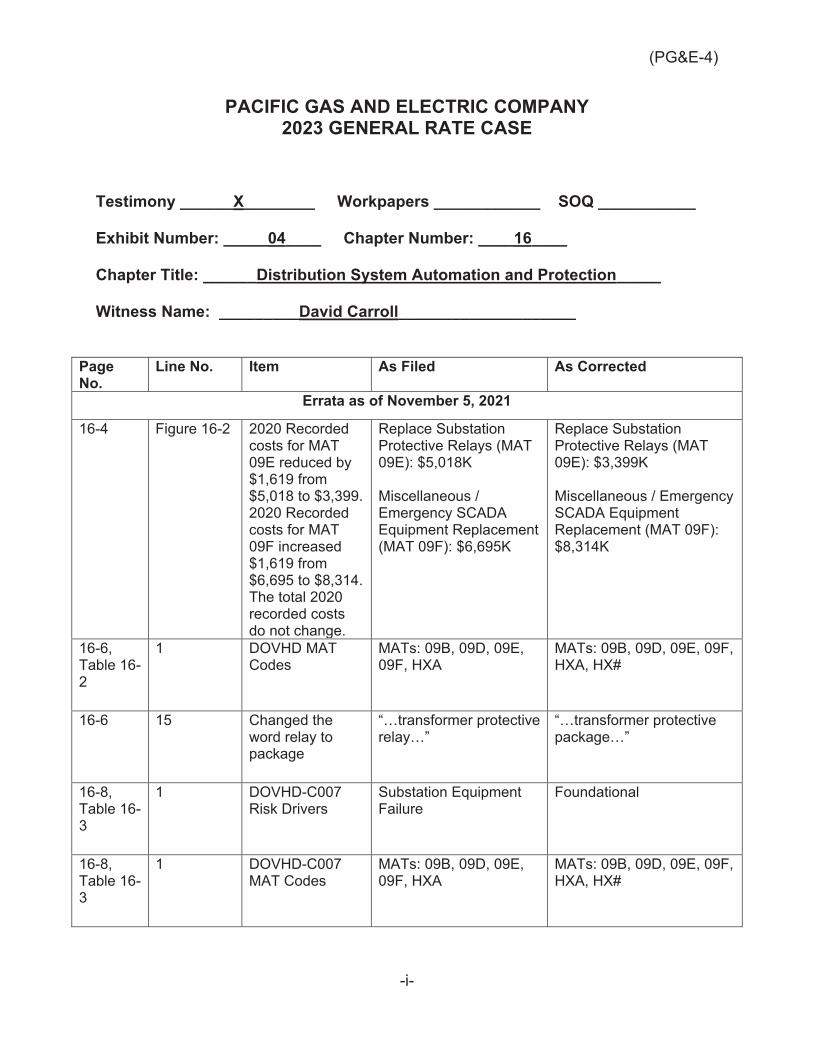
Testimony ______X________ Workpapers ____________ SOQ ___________ Exhibit Number: _____04____ Chapter Number: ____16____ Chapter Title: ______Distribution System Automation and Protection_____ Witness Name: _________David Carroll____________________
Page No.
Line No. Item As Filed As Corrected
Errata as of November 5, 2021
16-4 Figure 16-2 2020 Recorded costs for MAT 09E reduced by $1,619 from $5,018 to $3,399. 2020 Recorded costs for MAT 09F increased $1,619 from $6,695 to $8,314. The total 2020 recorded costs do not change.
Replace Substation Protective Relays (MAT 09E): $5,018K Miscellaneous / Emergency SCADA Equipment Replacement (MAT 09F): $6,695K
Replace Substation Protective Relays (MAT 09E): $3,399K Miscellaneous / Emergency SCADA Equipment Replacement (MAT 09F): $8,314K
16-6, Table 16-2
1 DOVHD MAT Codes
MATs: 09B, 09D, 09E, 09F, HXA
MATs: 09B, 09D, 09E, 09F, HXA, HX#
16-6 15 Changed the word relay to package
“…transformer protective relay…”
“…transformer protective package…”
16-8, Table 16-3
1 DOVHD-C007 Risk Drivers
Substation Equipment Failure
Foundational
16-8, Table 16-3
1 DOVHD-C007 MAT Codes
MATs: 09B, 09D, 09E, 09F, HXA
MATs: 09B, 09D, 09E, 09F, HXA, HX#
(PG&E-4)
-ii-
16-14 2-3 Updated 2020 recorded costs
“…forecast is $2.1…”, “…of $5.0…”
“…forecast is $0.5…”, “…of $3.4…”
16-15 15-16 Updated 2020 recorded costs
“…is $1.3…”, “…of $6.7…”
“…is $2.9…”, “…of $8.3…”
16-15 20 Updated 2021 forecast
$5.7 $5.8
16-17 Table 16-4 3&4
2020 Recorded Adjusted costs for MAT 09E & 09F
MAT 09E: $5,018 MAT 09F: $6,695
MAT 09E: $3,399 MAT 09F: $8,314
16-17 Table 16-4 3&4
2021 Forecast for MAT 09E & 09F
MAT 09E: $2,603 MAT 09F: $5,747
MAT 09E: $2,580 MAT 09F: $5,769
(PG&E-4)
PACIFIC GAS AND ELECTRIC COMPANY
CHAPTER 17
ELECTRIC DISTRIBUTION CAPACITY,
ENGINEERING, AND PLANNING
[INCLUDES NOVEMBER 5, 2021 ERRATA]
(PG&E-4)
17-i
PACIFIC GAS AND ELECTRIC COMPANY CHAPTER 17
ELECTRIC DISTRIBUTION CAPACITY, ENGINEERING, AND PLANNING
TABLE OF CONTENTS
A. Introduction ..................................................................................................... 17-4
1. Scope and Purpose ................................................................................. 17-4
1. Summary of Request ............................................................................... 17-4
2. Overview of Recorded and Forecast Costs .............................................. 17-6
a. Expense (Engineering and Planning Program) .................................. 17-6
b. Capital (Capacity Program) ............................................................... 17-7
3. Support for Request ................................................................................. 17-9
4. Organization of the Remainder of This Chapter ....................................... 17-9
B. Program and Risk Overview ........................................................................... 17-9
1. Program Description ................................................................................ 17-9
a. Program Overview ............................................................................. 17-9
1) Identify Need ............................................................................. 17-10
2) Evaluate Alternatives ................................................................ 17-12
3) Estimate Costs .......................................................................... 17-13
4) Project Consolidation and Prioritization ..................................... 17-13
5) Finalize Plan .............................................................................. 17-14
6) Ongoing Evaluation ................................................................... 17-14
b. Management Structure .................................................................... 17-14
c. Key Metrics and Other Performance Measures ............................... 17-15
2. Risk Integration ...................................................................................... 17-15
a. RAMP Risk – Failure of Distribution Overhead Assets .................... 17-16
1) Risk Overview ........................................................................... 17-16
2) GRC Risk Mitigations and Controls ........................................... 17-16

(PG&E-4) PACIFIC GAS AND ELECTRIC COMPANY
CHAPTER 17 ELECTRIC DISTRIBUTION CAPACITY,
ENGINEERING, AND PLANNING
TABLE OF CONTENTS (CONTINUED)
17-ii
3) Changes to Controls ................................................................. 17-18
4) Cost Tables ............................................................................... 17-18
C. Activities, Costs, and Forecast Drivers by MWC .......................................... 17-18
1. Expense (MWC FZ) ............................................................................... 17-18
a. General Engineering (MAT FZA) ..................................................... 17-18
b. Voltage Complaint Investigation (MAT FZB) .................................... 17-19
c. Transformer Reports Management (MAT FZC) ............................... 17-19
d. Field Work Plans (MAT FZD) ........................................................... 17-20
e. Troublemen Field Work (FZE) ......................................................... 17-20
f. Estimating Method ........................................................................... 17-20
g. MWC FZ Forecast Summary ........................................................... 17-20
2. Capital MWCs ........................................................................................ 17-21
a. Distribution Substation Capacity (MWC 46) ..................................... 17-21
1) Normal Capacity Deficiencies (MAT 46A and 46#) ................... 17-22
2) Emergency and Operational Capacity (MAT 46F) ..................... 17-24
3) New Business-Related Capacity (Includes Emergent Work Program and Electrification Capacity) (MAT 46H) ..................... 17-26
4) Land Purchases and New Distribution Substations (MAT 46N) ................................................................................. 17-28
5) Support for Transmission and Substation-Related Work (MAT 46T) ................................................................................. 17-28
6) MWC 46 Distribution Substation Capacity Forecast Summary . 17-28
b. Distribution Line Capacity (MWC 06) ............................................... 17-30
1) Feeder Projects Associated with Substation Work (MAT 06A) .. 17-31
(PG&E-4) PACIFIC GAS AND ELECTRIC COMPANY
CHAPTER 17 ELECTRIC DISTRIBUTION CAPACITY,
ENGINEERING, AND PLANNING
TABLE OF CONTENTS (CONTINUED)
17-iii
2) Overloaded Line Transformers (MAT 06B) ............................... 17-31
3) Circuit Reinforcement–DP Managed (MAT 06D) ...................... 17-32
4) Circuit Reinforcement–PS Managed (MAT 06E) ....................... 17-33
5) Voltage Complaint Projects Involving Secondary Distribution (MAT 06G) ................................................................................ 17-33
6) NB-Related Capacity Work (MAT 06H) ..................................... 17-34
7) Operational Capacity Projects (MAT 06I) .................................. 17-35
8) Power Factor Management (MAT 06K) ..................................... 17-36
9) Enable Distributed Generation (DG) Distribution Line (MAT 06P) ................................................................................. 17-37
10) Line Voltage Regulator Revolving Stock (MAT 06#) ................. 17-38
11) MWC 06 Distribution Line Capacity Forecast Summary ........... 17-38
c. Estimating Method ........................................................................... 17-40
D. Compliance With Section 5.2 of the 2020 GRC Settlement Agreement (“Deferred Work Principles”) ......................................................................... 17-40
E. Cost Tables .................................................................................................. 17-41
(PG&E-4)
17-4
PACIFIC GAS AND ELECTRIC COMPANY 1
CHAPTER 17 2
ELECTRIC DISTRIBUTION CAPACITY, 3
ENGINEERING, AND PLANNING 4
A. Introduction 5
1. Scope and Purpose 6
The purpose of this chapter is to demonstrate that Pacific Gas and 7
Electric Company’s (PG&E) expense and capital expenditure forecasts for 8
its Engineering and Planning Program (Engineering and Planning Program) 9
and its Electric Distribution Capacity Program (Capacity Program) are 10
reasonable and should be adopted by the California Public Utilities 11
Commission (CPUC or Commission). The Engineering and Planning 12
Program supports a variety of asset management and operating activities 13
and is necessary to plan, design, and operate PG&E’s electric distribution 14
system. PG&E uses the Capacity Program to manage substation and 15
distribution line investments necessary to meet customer demand. 16
The Commission’s approval of this forecast will allow PG&E to fulfill its 17
obligation to serve customers, meet regulatory and industry standards, 18
cost-effectively mitigate equipment overload conditions, and provide safe 19
and reliable service to customers. 20
1. Summary of Request 21
PG&E requests that the Commission adopt its 2023 expense forecast of 22
$19.9 million for the Engineering and Planning Program.1 PG&E’s 2023 23
expense forecast is $4.7 million higher than recorded expenses in 2020.2 24
The purpose of this program is provide the engineering resources necessary 25
to address increasing requirements by customers regarding the quantity and 26
type of their electric service, increases in connected generation, and to 27
support necessary improvements for an electric distribution infrastructure 28
that is both aging and expanding. The Engineering and Planning Program 29
1 Exhibit (PG&E-4), WP 17-1, line 1. 2 Exhibit (PG&E-4) WP 17-1, line 1.
(PG&E-4)
17-5
also supports distribution system improvements required to meet 1
commitments in PG&E’s Wildfire Mitigation Plan (WMP). 2
PG&E requests that the Commission adopt its capital expenditure 3
forecasts of the Capacity Program of $312.6 million in 2021, $215.7 million 4
in 2022, $195.7 million in 2023, $231.2 million in 2024, $248.3 million in 5
2025, and $262.2 million in 2026.3 The purpose of these expenditures is to 6
upgrade or install new substation and distribution line equipment to serve 7
the electric loads of new and existing customers. PG&E’s 2023 forecast is 8
$52.2 million higher than its 2020 recorded costs of $143.5 million.4 The 9
increase is primarily driven by an increase in new applications for service 10
and added loads that require capacity work to serve, especially in the areas 11
of transportation electrification, internet-based distribution centers, data 12
centers, high tech campuses, state and local infrastructure, agricultural well 13
pumping, dairy bio digesters, and indoor cultivation. The Capacity Program 14
projects discussed in this chapter support the normal, emergency, and 15
operational capacity necessary to satisfy customer load demands and 16
reliability expectations. This includes off-peak analysis using recorded 17
values to identify system needs associated with back flow from Distributed 18
Energy Resources (DER). 19
The 2020 recorded expenditures of $143.5 million for the 20
Capacity Program were higher than the imputed authorized amounts from 21
the 2020 General Rate Case (GRC) decision of $124.5 million.5 This is due 22
to the completion in 2020 of capacity projects from previous years that were 23
rescheduled due to emergency repair and wildfire hardening work as well as 24
an increase in the number of new business applications for service that 25
required capacity work to serve these loads. 26
Forecasts in this chapter are shown with escalation at the Major Work 27
Category (MWC) level, and escalation is included in all MWC capital totals. 28
For more information on escalation, please refer to Chapter 2 of this exhibit. 29
3 Exhibit (PG&E-4), WP 17-6, line 3. 4 Exhibit (PG&E-4), WP 17-6, line 3. 5 See PG&E’s 2020 Risk Spending Accountability Report for year 2020 (March 21, 2021),
p. 3-3, lines 2 and 18. PG&E’s MWC 46 2020 recorded amount in this GRC includes MAT 46# for the Renz Energy Storage project.

(PG&E-4)
17-6
2. Overview of Recorded and Forecast Costs 1
a. Expense (Engineering and Planning Program) 2
All expenses for the Engineering and Planning Program are 3
recorded in MWC FZ, as shown in Table 17-1. Work in MWC FZ is 4
further categorized into Maintenance Activity Type (MAT) codes, as 5
described in Section C.1. 6
TABLE 17-1 ENGINEERING AND PLANNING MAJOR WORK CATEGORIES
Line No. MWCs Description
1 Expense MWC
2 FZ Electric Engineering and Planning
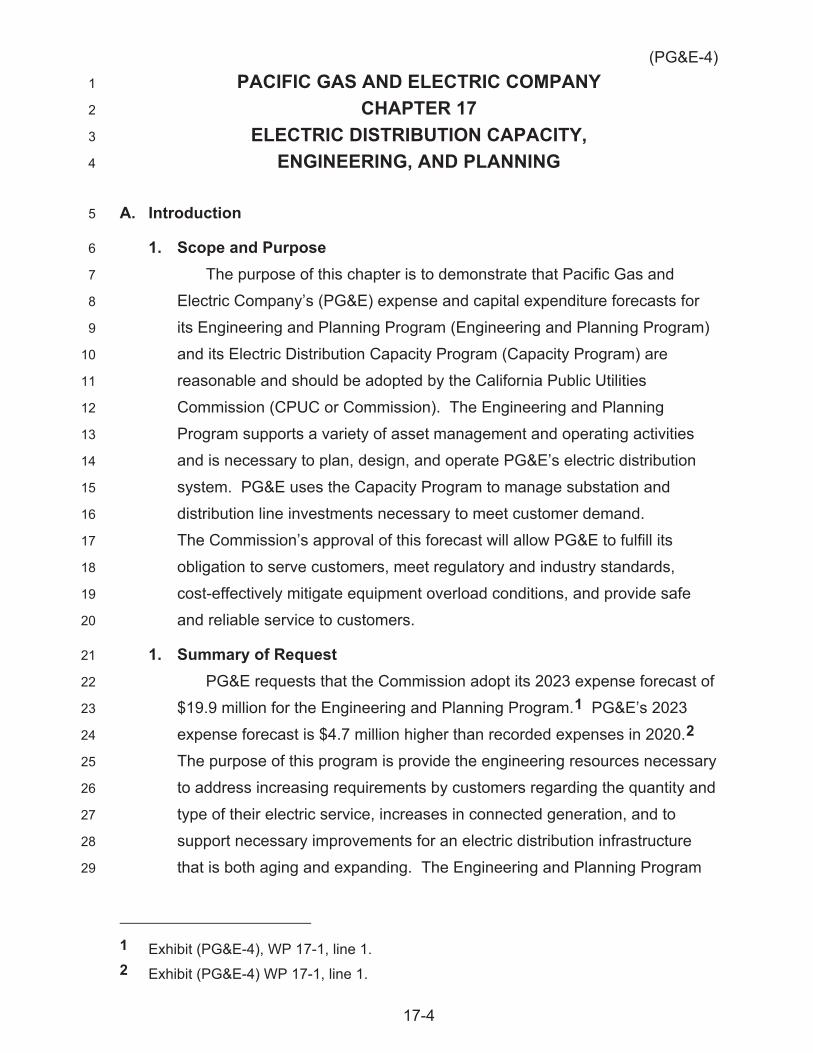
Figure 17-1 below shows the expense walk from the 2020 recorded 7
expense to the 2023 forecast by subprogram. The net increase in 8
forecast costs as compared to recorded amounts is primarily due to 9
increased Distribution Engineering headcount within MAT FZA (General 10
Engineering) to facilitate local presence at the regional level and support 11
increased workload. 12
(PG&E-4)
17-7
FIGURE 17-1 ENGINEERING AND PLANNING PROGRAM
EXPENSE WALK BY PROGRAM AREA 2020-2023 (THOUSANDS OF NOMINAL DOLLARS)
The 2023 forecast for each program area is primarily based on 2020 1
recorded expenses, adjusted for escalation and forecast increases in 2
MAT FZA to account for higher distribution engineering headcount and 3
APC costs. 4
b. Capital (Capacity Program) 5
All capital costs for the Capacity Program are recorded in MWC 06, 6
Distribution Line Capacity, and MWC 46, Distribution Substation 7
Capacity, as shown in Table 17-2. 8
TABLE 17-2 DISTRIBUTION CAPACITY MAJOR WORK CATEGORIES
Line No.
Capital MWCs Description
1 06 Distribution Line Capacity 2 46 Distribution Substation Capacity
Work in the Capacity Program is further categorized into MAT 9
codes, as described in Section C.2. 10
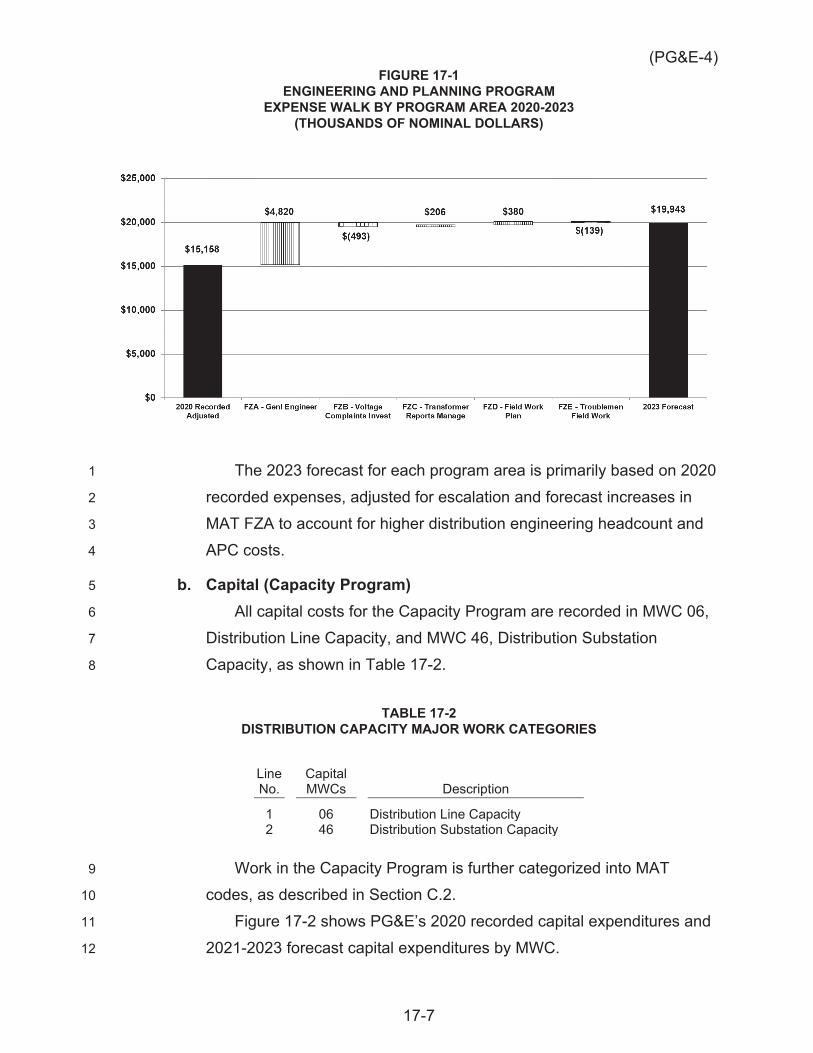
Figure 17-2 shows PG&E’s 2020 recorded capital expenditures and 11
2021-2023 forecast capital expenditures by MWC. 12
(PG&E-4)
17-8
FIGURE 17-2 CAPITAL RECORDED AND FORECAST BY MWC 2020-2026
(THOUSANDS OF NOMINAL DOLLARS)
The key drivers of the increase in 2023 forecast spending over 1
2020 recorded amounts are as follows: 2
In MWC 46, the increase is primarily driven by new applications for 3
service and added loads that require capacity work to serve industrial, 4
agricultural, and high-tech facilities as well as state and local 5
infrastructure. PG&E also anticipates additional capacity work to 6
support a substantial increase in electric vehicle (EV) fast charging and 7
fleet charging applications. 8
In MWC 06, the increase is primarily driven by an anticipated 9
increase in emergent capacity work to serve new business applications, 10
a significant increase in the overloaded transformer replacement 11
program, and higher project costs. 12
It should be noted that PG&E is not requesting approval in this GRC 13
for specific distribution capacity projects but is requesting funding for 14
overall distribution capacity needs based on the major work categories 15
associated with its overall forecast of loads and needs throughout the 16
system. 17

(PG&E-4)
17-9
3. Support for Request 1
PG&E’s expense forecast for the Engineering and Planning Program is 2
reasonable to address increasing requirements by customers regarding the 3
quantity and type of their electric service, increases in connected 4
generation, and to support necessary improvements for an electric 5
distribution infrastructure that is both aging and expanding. The Engineering 6
and Planning Program also supports distribution system improvements 7
required to meet commitments in PG&E’s WMP. 8
PG&E’s capital expenditure forecast for the Electric Distribution 9
Capacity Program is reasonable because the forecast work: 10
Is consistent with PG&E planning and design standards; 11
Provides adequate capacity to meet Electric Rule 2 service 12
requirements; 13
Is efficiently managed through centralized program management; and 14
Mitigates conditions that could negatively affect public and employee 15
safety. 16
4. Organization of the Remainder of This Chapter 17
The remainder of this chapter is organized as follows: 18
Section B – Program and Risk Overview; 19
Section C – Activities and Costs, and Forecast Drivers by MWC; 20
Section D – Compliance with Section 5.2 of the 2020 GRC Settlement 21
Agreement (“Deferred Work Principles”); and 22
Section E – Cost Tables. 23
B. Program and Risk Overview 24
1. Program Description 25
a. Program Overview 26
The Engineering and Planning Program primarily covers electric 27
distribution engineering and planning services labor which supports a 28
variety of asset management activities. The Engineering and Planning 29
Program provides support to capital expenditure programs such as 30
Electric Distribution Capacity, Overhead Asset Management, 31
Underground Asset Management, Distribution Reliability, Distribution 32
Automation, Wildfire Risk Mitigation, Grid Modernization, Community 33

(PG&E-4)
17-10
Rebuild, Rule 20A, and New Business and Work at the Request of 1
Others (NB/WRO). 2
The key objectives of the Capacity Program are to address: 3
(1) capacity expansion necessary to meet customer demand growth; 4
(2) potential equipment overload conditions; and (3) voltage and power 5
factor compliance requirements. 6
The Capacity Program’s objectives and its procedures for identifying 7
forecast work are generally the same as in the 2020 GRC and are 8
described in the rest of this section. 9
Each year, PG&E analyzes the distribution summer peak electric 10
demand by comparing future load forecasts against available capacity. 11
This annual process begins after the yearly system peak has occurred, 12
and after load forecasting is complete. Prior to proposing equipment 13
upgrades, to the extent possible, overload or capacity deficiencies and 14
low-voltage conditions are mitigated through available system 15
reconfiguration, such as switching between substation transformers and 16
circuits. PG&E then identifies specific capacity projects for the following 17
3-5 years, and identifies annual work based on the system forecast. 18
The Capacity Program management process involves six general 19
steps, described below: 20
1) Identify Need 21
PG&E’s service territory consists of approximately 22
3,200 feeders and 1,300 distribution substation transformers under 23
the responsibility of ten local area planning groups. Each year, the 24
area planning groups prepare load growth forecasting studies which 25
include individual DER forecasts by feeder. These forecasts are 26
used to identify equipment overloads and quantify capacity 27
deficiencies. Using uniform capacity planning guidelines and 28
engineering standards, the local area planning groups identify 29
potential mitigations. The area planning groups also prepare 30
detailed forecasts for the subsequent three years and provisional 31
forecasts for large-scale individual capacity projects (such as 32
substation transformer, distribution circuit, or other large projects to 33
increase capacity) for years four and five. The projects forecast in 34
(PG&E-4)
17-11
this chapter are based on PG&E’s current load forecasting 1
methodology. The current forecast incorporates the effect of 2
existing DERs to the extent that DER load reduction is reflected in 3
historical peak loads. All feeder load forecasts consider DER 4
growth scenarios in future years. 5
System capacity deficiency projects identified during the 6
2019 forecasting process were part of the 2020 Distribution 7
Investment Deferral Framework (DIDF) and were the basis for the 8
2020 Grid Needs Assessment (GNA) report issued by PG&E on 9
August 15, 2020.6 These projects will appear again in the 10
2021 GNA report and be more fully developed and scoped than the 11
newer emergent projects identified during the 2020 forecasting 12
process. These emergent projects will be identified in the 13
2021 GNA report to be issued by PG&E on August 15, 2021. 14
Emergent projects are identified in a separate section of the 15
Chapter 17 workpapers, WP 17-21, lines 86-123 and WP 17-22, 16
lines 86-123 and have rough dates, scope, and forecasted dollars 17
associated with them. These project attributes will be better defined 18
and scoped by the time of the 2021 DIDF Filing. Emergent projects 19
will be funded from the MAT 06H and MAT 46H emergent capacity 20
buckets.7 21
In addition, changing customer needs can cause ongoing 22
updates to the forecast, including New Business applications for 23
single large customer service locations. As a result of these 24
updates and new loads, the list and timing of projects discussed in 25
the 2023 GRC Workpapers may change prior to the publication of 26
the 2021 Distribution Deferral Opportunity Report (DDOR)8 on 27
August 15, 2021 28
6 See R.14-08-013; Electric Distribution Resources Plan 2015 OIR; PG&E’s 2018 GNA
Report. 7 Exhibit (PG&E-4), WP 17-73 to WP 17-76. 8 The GNA is the basis for the projects identified in the DDOR. The DDOR presents
PG&E’s planned investments that provide one or more of the distribution services adopted by D.16-12-036, as well as the resulting shortlist of candidate deferral projects after applying the initial deferral screens to the planned investments.

(PG&E-4)
17-12
2) Evaluate Alternatives 1
Many larger distribution line projects and most substation 2
projects generally have more than one alternative for mitigating an 3
overload condition, including potential DERs that meet PG&E’s 4
reliability, operating, and safety criteria within the affected local 5
planning areas. Project initiation starts with a detailed analysis of 6
the cost and system benefit of various alternatives. Generally, 7
substation equipment upgrades are multi-year projects that require 8
three years or more to design, procure the necessary material, and 9
construct, though some minor substation upgrades take less time. 10
New substations generally take 5-7 years to build, due to permitting 11
requirements.9 12
a) Evaluate DER Alternatives 13
As part of the annual DIDF, each capacity deficiency 14
identified for a given equipment upgrade project is screened for 15
potential DER deployment. Timing, cost effectiveness, and 16
forecast uncertainty are all used to identify projects that may 17
present good DER deferral opportunities Candidates for DER 18
deferral are reviewed by the Distribution Planning Advisory 19
Group (DPAG), which provides advisory input on the selection 20
of projects to be considered for DER deferral. 21
The Commission has adopted cost recovery standards that 22
address how the costs of PG&E’s distribution capacity projects 23
included in a GRC will be recovered if those projects become 24
subject to potential or actual deferral by DER projects procured 25
by PG&E under its Distribution Resources Plan. Under the 26
Commission’s guidelines, PG&E tracks existing DER contract 27
payments for deferral of distribution capacity projects in its 28
Distribution Deferral balancing account for recovery in its next 29
9 Detailed alternatives for projects beyond the 3-year window are generally evaluated for
new substation projects only. Detailed analysis of out years for other capacity projects that are not expected to incur significant expenditures in the near-term would be premature because the distribution system is dynamic; forecast deficiencies may not materialize and the system may change for other reasons.

(PG&E-4)
17-13
GRC. Neither DER payments nor the avoided costs of 1
traditional investments are reduced from previously adopted 2
revenue requirements in PG&E’s prior GRCs. If PG&E includes 3
a specific distribution capacity project in its GRC capital request 4
at the same time the project is being considered as a DER 5
candidate deferral project, the Commission may consider 6
adjusting PG&E’s GRC revenue requirement to reflect any 7
savings from the DER deferral project. Where the Commission 8
approves a DER project to defer a specific investment that has 9
been explicitly approved in PG&E’s most recent GRC (and is 10
included in PG&E’s GRC revenue requirement), PG&E may 11
recover these costs through its GRC revenues, and may not 12
book payments for the corresponding DER project to its 13
Distribution Deferral balancing account. Such a cost recovery 14
criteria only applies through the DER contract period during 15
which PG&E collects a revenue requirement for the approved 16
traditional investment. 17
On November 16, 2020, PG&E filed Advice Letter 6003-E to 18
inform the CPUC that seven capacity projects were considered 19
candidates for DER deferral and that PG&E recommended 20
pursuing competitive solicitations for all seven projects. 21
Ultimately, PG&E did not receive enough offers to meet the full 22
grid need at any deferral location. Therefore, PG&E has 23
decided to conclude the first phase of the 2020 DIDF. 24
3) Estimate Costs 25
Based on project alternatives being evaluated, the area 26
planning groups then develop project cost estimates. For most 27
projects, the area planners develop costs using either estimates of 28
specific equipment and unit costs for work required, or historical 29
costs from completed projects. 30
4) Project Consolidation and Prioritization 31
Projects from the ten area planning groups are consolidated for 32
evaluation and prioritization. With input from Staff Engineers and 33
(PG&E-4)
17-14
other Managers, a Lead Engineer reviews each project and 1
examines the historic spending trends of the smaller recurring 2
projects. The Lead Engineer assesses projects based on the 3
forecast deficiency or overload, as well as costs, then makes 4
preliminary scheduling and budgeting recommendations for both 5
large projects (e.g., substation transformers and distribution circuits) 6
and smaller recurring projects (e.g., voltage complaints, 7
reconductoring projects, and overloaded distribution line 8
transformers). 9
5) Finalize Plan 10
After further evaluation of the preliminary plan, supplemented by 11
any new information from the local planning groups and the DPAG, 12
the Lead Engineer develops a detailed plan for the subsequent 13
three years and a provisional plan for years four and five. This plan 14
is then provided to the work execution teams for implementation. 15
6) Ongoing Evaluation 16
The funding plan is reprioritized as required throughout the year 17
to: (1) confirm completion of high priority work; (2) monitor spending; 18
and (3) maintain an accurate forecast of year-end expenditures. 19
Depending on the timing of a potential DER deferral opportunity, a 20
contingency plan may be required to ensure the system can meet 21
the capacity need if further evaluation determines the DER 22
opportunity cannot meet the needs of the system, or if the selected 23
opportunity does not obtain the necessary approval. 24
b. Management Structure 25
The Engineering and Planning Program is part of the Asset Risk 26
Management Department in Electric Operations. Engineering and 27
Planning Program employees, who carry the title of Electric Distribution 28
Engineer, focus on: 29
Performing engineering analysis to support capital project needs for 30
Electric Distribution Capacity, Overhead Asset Management, 31
Underground Asset Management, Distribution Reliability, 32
(PG&E-4)
17-15
Distribution Automation, Wildfire Risk Mitigation, Grid Modernization, 1
Community Rebuild, Rule 20A, NB/WRO, and operations; 2
Performing studies, based on customer requests, to interconnect 3
DERs to PG&E’s distribution system; 4
Responding to customer inquiries regarding electric and magnetic 5
fields and reliability problems; 6
Providing protective device settings and voltage control device 7
settings for equipment installations; and 8
10-year protection reviews. 9
PG&E’s Vice President (VP) of Asset Risk Management leads the 10
organization responsible for the Capacity Program investment plan. The 11
Director of Asset Planning reports to this VP. Two Managers of Electric 12
Distribution Planning report to the Director of Asset Planning. The 13
ten local area planning groups and other Staff Engineers collectively 14
report to these Managers and work together to identify deficiencies, 15
configuration changes, and capital projects, as necessary, to maintain 16
distribution system integrity. 17
c. Key Metrics and Other Performance Measures 18
The Engineering and Planning Program primarily covers electric 19
distribution engineering and planning services labor and therefore does 20
not include any specific key metrics. 21
2. Risk Integration 22
Chapter 3 of this exhibit describes how Electric Operations (EO) uses 23
the Enterprise and Operational Risk Management (EORM) Program to 24
manage electric system risks. Table 17-3 below shows the EO risks 25
associated with the forecasts discussed in this chapter. 26
TABLE 17-3 RISKS DISCUSSED IN THIS CHAPTER
Line No. Risk Name Risk ID
Type of Risk MAT
1 Failure of Distribution Overhead Assets DOVHD RAMP FZA, 06B
(PG&E-4)
17-16
a. RAMP Risk – Failure of Distribution Overhead Assets 1
1) Risk Overview 2
The Failure of Electric Distribution Overhead Assets risk is 3
defined as the failure of distribution overhead assets or lack of 4
remote operation functionality may result in public or employee 5
safety issues, property damage, environmental damage, or inability 6
to deliver energy. Failure of Electric Distribution Overhead Assets 7
was one of PG&E’s 2020 RAMP risks.10 8
In Chapter 3 PG&E describes how management of the risk has 9
changed since the filing of the 2020 RAMP Report; lists each 10
mitigation and control, indicating if it has changed since the 11
2020 RAMP Report filing; and provides updated RSEs. In this 12
chapter PG&E provides more information about the controls related 13
to work forecast in this chapter and the work needed to implement 14
them. 15
2) GRC Risk Mitigations and Controls 16
As shown in the tables below, PG&E is forecasting two controls 17
related to work forecast in this chapter. PG&E is not forecasting any 18
mitigations related to work forecast in this chapter. The control 19
programs were determined to reduce the frequency or consequence 20
of risk of failure of electric distribution overhead assets. A brief 21
description of these controls is provided in the table below. More 22
detail is included in the 2020 RAMP Report.11 23
10 Application (A.) 20-06-012, PG&E’s 2020 RAMP Report, Ch. 11. 11 A.20-06-012, Controls and Mitigations, starting at p. 11-14.
(PG&E-4)
17-17
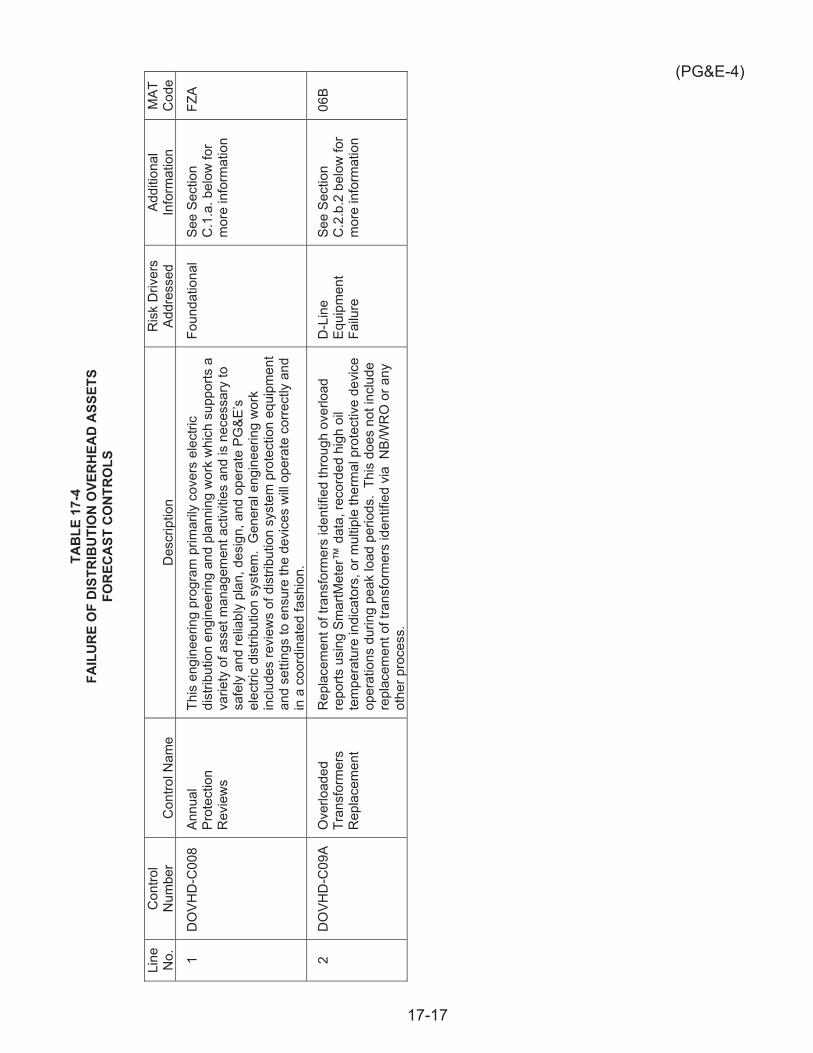
TAB
LE 1
7-4
FAIL
UR
E O
F D
ISTR
IBU
TIO
N O
VER
HEA
D A
SSET
S FO
REC
AST
CO
NTR
OLS
Line
N
o.
Con
trol
Num
ber
Con
trol N
ame
Des
crip
tion
Ris
k D
river
s Ad
dres
sed
Addi
tiona
l In
form
atio
n M
AT
Cod
e
1 D
OVH
D-C
008
Annu
al
Prot
ectio
n R
evie
ws
This
eng
inee
ring
prog
ram
prim
arily
cov
ers
elec
tric
dist
ribut
ion
engi
neer
ing
and
plan
ning
wor
k w
hich
sup
ports
a
varie
ty o
f ass
et m
anag
emen
t act
iviti
es a
nd is
nec
essa
ry to
sa
fely
and
relia
bly
plan
, des
ign,
and
ope
rate
PG
&E’s
el
ectri
c di
strib
utio
n sy
stem
. G
ener
al e
ngin
eerin
g w
ork
incl
udes
revi
ews
of d
istri
butio
n sy
stem
pro
tect
ion
equi
pmen
t an
d se
tting
s to
ens
ure
the
devi
ces
will
oper
ate
corre
ctly
and
in
a c
oord
inat
ed fa
shio
n.
Foun
datio
nal
See
Sect
ion
C.1
.a. b
elow
for
mor
e in
form
atio
n
FZA
2 D
OVH
D-C
09A
Ove
rload
ed
Tran
sfor
mer
s R
epla
cem
ent
Rep
lace
men
t of t
rans
form
ers
iden
tifie
d th
roug
h ov
erlo
ad
repo
rts u
sing
Sm
artM
eter
™ d
ata,
reco
rded
hig
h oi
l te
mpe
ratu
re in
dica
tors
, or m
ultip
le th
erm
al p
rote
ctiv
e de
vice
op
erat
ions
dur
ing
peak
load
per
iods
. Th
is d
oes
not i
nclu
de
repl
acem
ent o
f tra
nsfo
rmer
s id
entif
ied
via
NB/
WR
O o
r any
ot
her p
roce
ss.
D-L
ine
Equi
pmen
t Fa
ilure
See
Sect
ion
C.2
.b.2
bel
ow fo
r m
ore
info
rmat
ion
06B
(PG&E-4)
17-18
3) Changes to Controls 1
Since filing the 2020 RAMP Report, PG&E modified its portfolio 2
of controls related to work forecast in this chapter by removing a 3
control related to Electric Distribution Line Operational Capacity 4
Projects which was discussed in the 2020 RAMP as 5
(DOVHD-C09B). PG&E has concluded that this control does not 6
materially reduce risk of asset failure, though it does improve 7
operational functionality and the ability to deliver power under 8
abnormal conditions. This control has been excluded from the 9
GRC. 10
4) Cost Tables 11
Forecast costs for controls are shown in supporting 12
workpapers.12 13
C. Activities, Costs, and Forecast Drivers by MWC 14
1. Expense (MWC FZ) 15
All the expense work discussed in this chapter relates to the 16
Engineering and Planning program and is tracked in five MATs within 17
MWC FZ. PG&E describes these five MATs and the major expense drivers 18
to the forecast below. These MATs are listed in order of the walk shown in 19
Figure 17-1. 20
a. General Engineering (MAT FZA) 21
General engineering work primarily covers electric distribution 22
engineering and planning services labor required to support many types 23
of projects such as capacity, NB/WRO, generation interconnection, 24
reliability, overhead asset management, underground asset 25
management, grid modernization, community rebuild, and wildfire risk 26
mitigation. This engineering labor also covers developing electronic 27
control settings for protective and voltage support equipment, as well as 28
responding to customer inquiries regarding electromagnetic field (EMF) 29
and reliability concerns. 30
12 Exhibit (PG&E-4), WP 3-9, line 33.

(PG&E-4)
17-19
General engineering also includes the Asset Performance Center, 1
which performs diagnostics on data from automated field equipment to 2
support PG&E’s Distribution Control Centers and wildfire risk mitigation 3
activities.13 4
PG&E’s 2023 forecast for MAT FZA is $16.7 million, which is 5
$4.8 million higher than 2020 recorded costs of $11.9 million.14 The net 6
increase, relative to recorded amounts, is primarily due to escalation 7
and additional Distribution Engineering headcount. 8
The increase in Distribution Engineering headcount is to facilitate 9
local presence at the regional level and support increased workload 10
which created the need for two additional engineering planning offices to 11
improve local engineering presence and accountability. 12
b. Voltage Complaint Investigation (MAT FZB) 13
Voltage complaint investigation work involves investigating 14
secondary voltage complaints that Troublemen cannot resolve on the 15
first visit and setting recording voltage meters to measure the actual 16
voltage at the sites underlying these voltage complaints. PG&E’s 17
2023 forecast in this area is $0.6 million, which is $0.5 million less than 18
2020 recorded costs which were unusually high relative to historical 19
spending.15 20
c. Transformer Reports Management (MAT FZC) 21
Transformer reports management work involves investigating 22
potentially overloaded distribution line transformers. PG&E’s 23
2023 forecast for this work is $0.2 million to cover any investigations 24
required to support the Capacity Program MAT 06B, and any various 25
unplanned investigations.16 26
13 See Exhibit (PG&E-4), Ch. 4.3, section C.3.c.1 for a more detailed discussion of the
APC’s activities and associated forecast. 14 Exhibit (PG&E-4), WP 17-5, line 1. 15 Exhibit (PG&E-4), WP 17-5, line 2. 16 Exhibit (PG&E-4), WP 17-5, line 3.
(PG&E-4)
17-20
d. Field Work Plans (MAT FZD) 1
Field work plans involves supporting operational field work initiated 2
by engineering personnel, such as phase balancing, and replacing fuses 3
that are projected to be overloaded. PG&E’s 2023 forecast in this area 4
is $0.8 million, which is $0.3 million higher than 2020 recorded costs of 5
$0.5 million.17 The net increase relative to recorded amounts is 6
primarily due to an increase in phase balancing work. 7
e. Troublemen Field Work (FZE) 8
Troublemen field work includes implementing load transfers, control 9
device setting changes/downloads, and other specific field 10
investigations. PG&E’s 2023 forecast in this area is $1.5 million, 11
which is roughly equivalent to 2020 recorded amounts.18 12
f. Estimating Method 13
The forecasts in MWC FZ are generally based on historical average 14
spending, with adjustments for areas where PG&E is expecting 15
increased spending (e.g., increased headcount in MAT FZA to facilitate 16
local presence at the regional level and support increased workload, 17
additional transformer investigation work in FZC, additional phase 18
balancing work in FZD). PG&E has also incorporated a cost-savings 19
initiative into MWC FZ for years 2021 and 2022.19 20
g. MWC FZ Forecast Summary 21
Table 17-5 summarizes 2020 recorded expenditures and 2021-2023 22
forecasts for MWC FZ. 23
17 Exhibit (PG&E-4), WP 17-5, line 4. 18 Exhibit (PG&E-4), WP 17-5, line 5. 19 As explained in Exhibit (PG&E-2) Ch. 3, PG&E prepared its 2023 GRC forecast, starting
first with the Plan of Reorganization forecast for the work included in the 2023 GRC and then adding updates to address company-wide work needs and priorities, risk mitigations, and cost-savings initiatives. Through the process of prioritizing the Electric Distribution portfolio and in accordance with the 2023 GRC forecast guidelines outlined in Exhibit (PG&E-2) Ch. 3, this forecast prioritizes funding for the most critical work and incorporates a cost-savings initiative which is identified as a reduction to the forecast. EO’s work portfolio planning and prioritization process is discussed further in Exhibit (PG&E-4) Ch. 2.
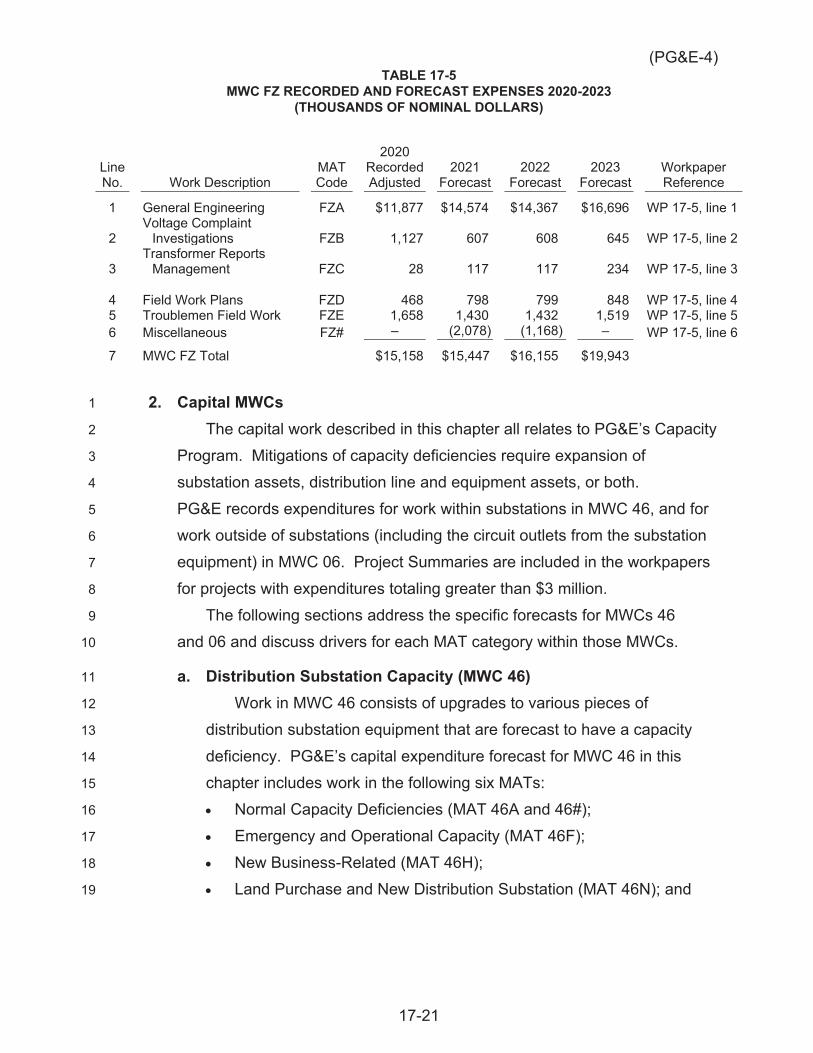
(PG&E-4)
17-21
TABLE 17-5 MWC FZ RECORDED AND FORECAST EXPENSES 2020-2023
(THOUSANDS OF NOMINAL DOLLARS)
Line No. Work Description
MAT Code
2020 Recorded Adjusted
2021 Forecast
2022 Forecast
2023 Forecast
Workpaper Reference
1 General Engineering FZA $11,877 $14,574 $14,367 $16,696 WP 17-5, line 1
2 Voltage Complaint
Investigations FZB 1,127 607 608 645 WP 17-5, line 2
3 Transformer Reports
Management FZC 28 117 117 234 WP 17-5, line 3
4 Field Work Plans FZD 468 798 799 848 WP 17-5, line 4 5 Troublemen Field Work FZE 1,658 1,430 1,432 1,519 WP 17-5, line 5 6 Miscellaneous FZ# – (2,078) (1,168) – WP 17-5, line 6
7 MWC FZ Total $15,158 $15,447 $16,155 $19,943
2. Capital MWCs 1
The capital work described in this chapter all relates to PG&E’s Capacity 2
Program. Mitigations of capacity deficiencies require expansion of 3
substation assets, distribution line and equipment assets, or both. 4
PG&E records expenditures for work within substations in MWC 46, and for 5
work outside of substations (including the circuit outlets from the substation 6
equipment) in MWC 06. Project Summaries are included in the workpapers 7
for projects with expenditures totaling greater than $3 million. 8
The following sections address the specific forecasts for MWCs 46 9
and 06 and discuss drivers for each MAT category within those MWCs. 10
a. Distribution Substation Capacity (MWC 46) 11
Work in MWC 46 consists of upgrades to various pieces of 12
distribution substation equipment that are forecast to have a capacity 13
deficiency. PG&E’s capital expenditure forecast for MWC 46 in this 14
chapter includes work in the following six MATs: 15
Normal Capacity Deficiencies (MAT 46A and 46#); 16
Emergency and Operational Capacity (MAT 46F); 17
New Business-Related (MAT 46H); 18
Land Purchase and New Distribution Substation (MAT 46N); and 19
(PG&E-4)
17-22
Support of Transmission and Substation-Related Work 1
(MAT 46T).20 2
PG&E’s forecast for Distribution Substation Capacity in MWC 46 is 3
$78.9 million in 2021, $65.2 million in 2022, $58.0 million in 2023, 4
$68.0 million in 2024, 72.0 million in 2025, and $74.7 million in 2026. 5
PG&E’s 2023 forecast is $22.4 million more than 2020 recorded 6
expenditures of $36.3 million.21 The increase is largely driven by: 7
A marked increase in the number of EV fast charging and fleet 8
charging applications for service that require capacity work to serve 9
new load; 10
An increase in new applications for service and added load, 11
especially in the areas of internet delivery distribution centers, data 12
centers, high tech campuses, state and local infrastructure, 13
agricultural well pumping, dairy bio digesters, and indoor cultivation 14
customers that require capacity work to serve new load; 15
An increasingly high level of utilization of existing assets, which 16
PG&E anticipates will result in more capacity work to serve new 17
applications for service. In 2017 there were 167 banks and 18
323 circuits loaded above 90 percent. In 2020, this number had 19
risen to 185 banks and 345 circuits; and 20
Higher than historical costs for comparable work.22 21
A summary of the forecast expenditures for all distribution 22
substation capacity work in MWC 46 is in Table 17-6 at the end of this 23
section. 24
1) Normal Capacity Deficiencies (MAT 46A and 46#) 25
MAT 46A includes projects to support general distribution 26
substation capacity increases. MAT 46# includes a portion of 27
20 This MAT code structure is the same one used in the 2020 GRC. Prior to the
2020 GRC, MWC 46 MAT assignments were based on the type of equipment identified for replacement rather than the type of capacity project, which resulted in a mix of justification drivers within each MAT. The current MAT categories are organized to better align with project justification supporting the work.
21 Exhibit (PG&E-4), WP 17-16, line 9. 22 Exhibit (PG&E-4), WP 17-16, line 9.
(PG&E-4)
17-23
historic spend for the Renz Energy Storage project.23 PG&E’s 1
forecast for MAT 46A and 46# is $34.8 million in 2021, $28.9 million 2
in 2022, $15.8 million in 2023, $8.3 million in 2024, 5.6 million in 3
2025, and $0.8 million in 2026. PG&E’s 2023 forecast is 4
$8.7 million higher than its 2020 recorded capital expenditures of 5
$7.1 million.24 PG&E’s spending in 2020 was relatively low, 6
because fewer MAT 46A projects were completed so that funding 7
could be moved to MAT 46H to support New Business capacity 8
projects to cover an increasing number of customer applications. 9
Normal capacity deficiencies are identified based on peak 10
forecast load or off-peak forecast back-flow compared to normal 11
capacity ratings of the various pieces of substation equipment. 12
The 2023 GRC forecast is driven by specifically identified projects. 13
The number of normal capacity projects may increase due to future 14
substation transformer capacity de-rates required to reduce loading 15
of aging and deteriorated substation transformers and voltage 16
regulators. Any future transformer de-rates will reduce available 17
substation transformer capability and may require additional 18
projects, which would be funded from emergent dollars to address 19
newly created deficiencies 20
The MAT 46A forecast includes the Renz Energy Storage 21
project to mitigate the forecast overload of Llagas Bank 3 by 22
installing energy storage to offset demand and reduce loading. The 23
Renz Energy Storage project has a forecast in MWC 46A of 24
$26.3 million in 2021 and $0.2 million in 2022.25 The Renz Energy 25
Storage project will capture the market value of this resource when it 26
is not prioritized to provide distribution reliability services, and to use 27
that value to reduce the costs that will be borne by customers. 28
23 In the 2020 GRC, the Renz Energy Storage project was called the Llagas Energy
Storage Project. 24 Exhibit (PG&E-4), WP 17-16, lines 1 and 2. 25 Exhibit (PG&E-4), WP 17-20, Table 17-18, line 62.
(PG&E-4)
17-24
2) Emergency and Operational Capacity (MAT 46F) 1
MAT 46F includes: (1) work to address emergency capacity 2
deficiencies; and (2) operational capacity work to reduce the number 3
of customers on a circuit to no more than 6,000 and circuit loading 4
to a maximum of 600 amperes (amps). 5
PG&E’s forecast for MAT 46F is $17.8 million in 2021, 6
$8.8 million in 2022, $1.0 million in 2023, $3.2 million in 2024, 7
$5.0 million in 2025, and $0 in 2026. PG&E’s 2023 forecast is 8
$10.9 million less than 2020 recorded capital expenditures of 9
$11.9 million.26 The decrease is primarily due to the planned 10
completion of MAT 46F projects identified in the 2020 GRC and 11
PG&E’s decision to prioritize New Business-related capacity 12
projects over the identification of new MAT 46F-type projects for the 13
2023 GRC period. 14
a) Emergency Capacity 15
Substation emergency capacity deficiencies occur when a 16
transformer is removed from service during an unplanned event, 17
and the remaining capacity is insufficient to serve the load.27 18
Projects identified to mitigate emergency deficiencies will: 19
Reduce the risk of an extended outage to a critical piece of 20
substation equipment in an urban and suburban area; 21
Improve operating and maintenance flexibility; 22
Provide a buffer for instances when actual peak loads 23
exceed forecast peaks; and 24
Reduce reliance on mobile transformers, which can take up 25
to 24 hours to install. 26
The one new project28 included in this GRC forecast has 27
been evaluated based on current forecasts and has an 28
26 Exhibit (PG&E-4), WP 17-16, line 3. 27 An emergency deficiency exists when the forecast peak load exceeds the available
emergency capacity with the largest “non-firm” substation transformer removed from service. A substation transformer is considered “non-firm” if there is no spare transformer available to be placed into service at the substation during an emergency.
28 Exhibit (PG&E-4), WP 17-19, Table 17-18, line 68; and, WP 17-53 to WP 17-56.
(PG&E-4)
17-25
emergency deficiency of 14.9 megawatts (MW) if the largest 1
transformer at the substation is lost. The customer count 2
associated with this emergency deficiency is 2,214 customers. 3
Three other emergency capacity projects included in the 4
forecast are ongoing projects, with forecast completion dates in 5
2021, that were previously included in 2020 GRC. 6
b) Operational Capacity – Reduce Customer Count 7
Operational capacity projects are identified to increase 8
reliability by providing additional capacity in strategic locations 9
to improve system flexibility to switch load between feeders and 10
during planned clearance or outage events. The forecast 11
includes projects to limit the number of customers on a circuit to 12
no more than 6,000 and projects to maintain circuit loading to a 13
maximum of 600 amps. Feeders that serve large numbers of 14
customers or are highly loaded pose two issues: (1) a large 15
number of customers are affected when an outage occurs, due 16
to a circuit breaker opening; and (2) typical loading limits on 17
adjacent circuits could hinder the ability to reconfigure highly 18
loaded circuits. These issues negatively affect both customer 19
outage frequency and duration. 20
Project work to address capacity deficiencies also 21
contributes to greater switching flexibility, which enables 22
location-specific reductions in customer counts by feeder. 23
The three substation projects included in this GRC forecast are 24
necessary to reduce the number of customers served by 25
feeders located in urban or suburban areas and enable an 26
average reduction of roughly 1,200 customers per feeder.29 27
All three of the substation projects were included in 2020 GRC, 28
with projected completion dates between 2020 and 2022. 29
PG&E currently estimates that these projects will be completed 30
in 2021 and 2022. 31
29 Exhibit (PG&E-4), WP 17-20, lines 3, 4, and 25; and, WP 17-57 to WP 17-60 (list of
projects at WP 17-58, Project Description Table.
(PG&E-4)
17-26
c) Operational Capacity – Reduce High Loading 1
Project work to reduce loading on feeders to 600 amps or 2
less also helps maintain operational flexibility in the system. 3
Typically, most feeders in PG&E’s system have a maximum 4
capacity limit of 600 amps or less due to standard equipment 5
limitations. As of the end of 2020, 49 of PG&E’s approximately 6
3,200 feeders were loaded to more than 600 amps. These 7
highly-loaded circuits constrain switching flexibility to adjacent 8
circuits for planned or unplanned outage events. There are 9
three substation jobs of this type included in the MAT 46F 10
forecast.30 All three of the projects were included in 2020 GRC, 11
with projected completion dates between 2021 and 2022. 12
PG&E currently estimates that these projects will be completed 13
in 2022 and 2023. 14
3) New Business-Related Capacity (Includes Emergent Work 15
Program and Electrification Capacity) (MAT 46H) 16
MAT 46H includes projects which address capacity deficiencies 17
for New Business customer demand increases. PG&E’s forecast for 18
MAT 46H is $26.2 million in 2021, $27.5 million in 2022, 19
$41.4 million in 2023, $56.5 million in 2024, $61.4 million in 2025, 20
and $73.9 million in 2026. PG&E’s 2023 forecast is $24.1 million 21
more than 2020 recorded capital expenditures of $17.2 million.31 22
The increase is largely driven by identified projects (based on new 23
business applications for service) to provide capacity for internet 24
delivery distribution centers, data centers, high-tech campuses, 25
state and local infrastructure, agricultural well pumping, and indoor 26
agriculture customers. 27
PG&E also anticipates that the construction of EV fast charging 28
stations and EV fleet charging stations, in as yet undetermined 29
locations, will create a need for system upgrades at those locations 30
30 Exhibit (PG&E-4), WP 17-20, lines 12, 57 and 63; and, WP 17-61 to WP 17-64 list of
projects at WP 17-62, Project Description Table. 31 Exhibit (PG&E-4), WP 17-16, lines 4-5.
(PG&E-4)
17-27
within the next two to five years. This is based on input from 1
EV charging station providers as well as discussions with internet 2
delivery services intending to begin electrification of their vehicle 3
fleet. One well-known EV network plans to increase annual stall 4
installation from 600 stalls per year to 1,200 stalls per year by 2023. 5
At 97 kilowatts (kW) per charger, this is a load increase of 58 MW 6
per year. 7
Former Governor Brown’s Executive Order B-48-1832 set a 8
goal of having 250,000 EV chargers installed by 2025. The 9
January 2021 Electric Vehicle Charging Infrastructure Assessment 10
for Assembly Bill (AB) 2127 finds that, at the present time, California 11
has only 67,000 public and shared chargers installed, of which 12
5,000 are DC fast chargers. The report anticipates that by 2030, 13
968,000 chargers will be needed to support 5 million EVs. 14
As it did in the 2020 GRC, PG&E is including separate forecasts 15
in MWC 46H for known New Business-related (NB-related) capacity 16
projects and for “Unidentified, Emergent Work.” Forecasting 17
emergent work in this way allows the Capacity Program to reduce 18
changes in its work plan and more efficiently plan projects from start 19
to finish. 20
The Emergent Work funding for substation projects is forecast 21
based upon the increasing rate of new applications for service that 22
require capacity work to serve. Of the emergent funding for 23
2023-2026, 79 percent has already been allocated to 24
newly-identified emergent projects.33 The Emergent Work funding 25
forecast in MWC 46 is less in the near-term, and increases in later 26
years, because more of the near-term work has already been 27
specifically identified. This is because customers requesting new 28
service for single, large-demand locations historically submit 29
applications 1-3 years prior to their anticipated in-service date. 30
32 Executive Order B-48-18, adopted January 26, 2018. 33 Exhibit (PG&E-4) WP 17-20, line 80, and WP 17-22, line 124.
(PG&E-4)
17-28
4) Land Purchases and New Distribution Substations (MAT 46N) 1
The work in MAT 46N consists of constructing new substations 2
to increase capacity. 3
PG&E’s forecast for MAT 46N is close to $0 for the entire 4
2021-2026 time period. PG&E’s 2023 forecast of $0 is $0.05 million 5
less than 2020 recorded capital expenditures of $0.05 million.34 6
The reason for the decrease is that PG&E is not forecasting any 7
new substation projects in 2023-2026. 8
5) Support for Transmission and Substation-Related Work 9
(MAT 46T) 10
PG&E’s 2023 forecast for this area is $0. Projects in MAT 46T 11
are specifically identified for the transmission- or substation-related 12
project they support. Currently, PG&E has not identified any 13
projects in MAT 46T and is not forecasting any expenditures in the 14
2021-2026 timeframe. 15
6) MWC 46 Distribution Substation Capacity Forecast Summary 16
Table 17-6 summarizes PG&E’s forecasts and historical 17
expenditures for MWC 46.35 18
34 Exhibit (PG&E-4), WP 17-16, line 6. 35 The substantial increase in the MWC 46A forecast in 2021 is due to the $27.7 million
projected cost of the Renz Energy Storage project at Llagas Substation.
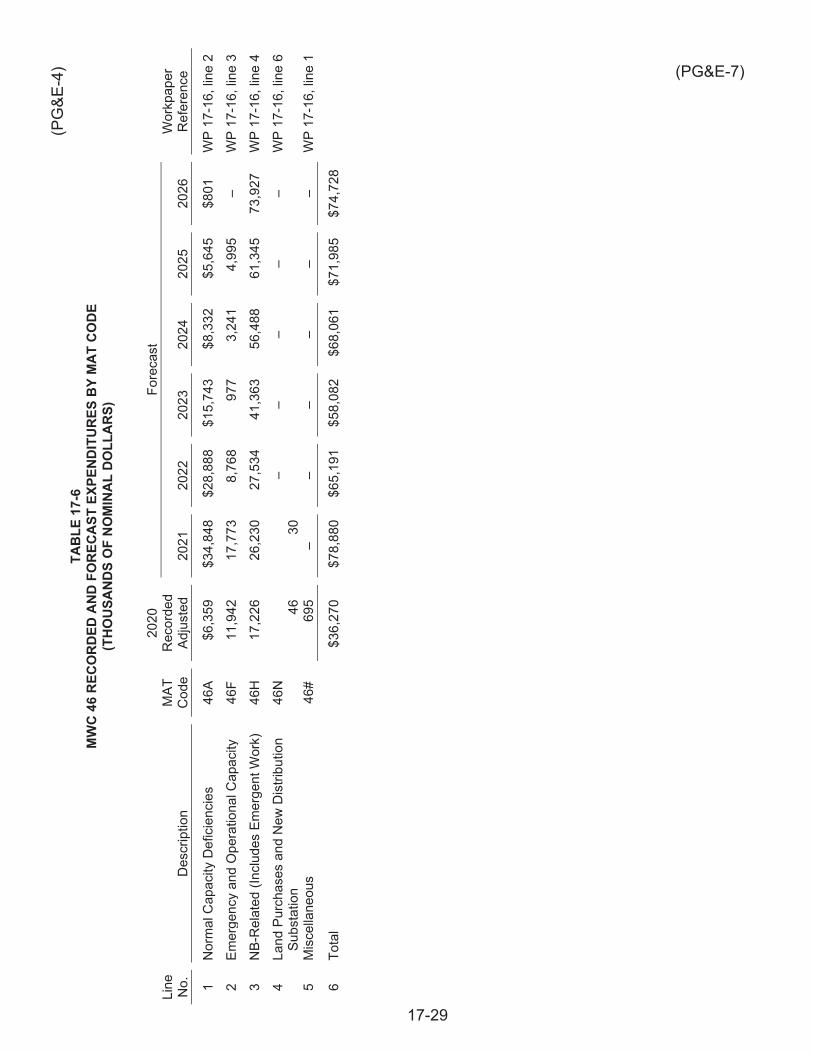
(PG
&E-4
)
(PG&E-7)
17-29
TAB
LE 1
7-6
MW
C 4
6 R
ECO
RD
ED A
ND
FO
REC
AST
EXP
END
ITU
RES
BY
MA
T C
OD
E (T
HO
USA
ND
S O
F N
OM
INA
L D
OLL
AR
S)
Line
N
o.
Des
crip
tion
MAT
C
ode
2020
R
ecor
ded
Adju
sted
Fore
cast
W
orkp
aper
R
efer
ence
20
21
2022
20
23
2024
20
25
2026
1 N
orm
al C
apac
ity D
efic
ienc
ies
46A
$6,3
59
$34,
848
$28,
888
$15,
743
$8,3
32
$5,6
45
$801
W
P 17
-16,
line
2
2 Em
erge
ncy
and
Ope
ratio
nal C
apac
ity
46F
11,9
42
17,7
73
8,76
8 97
7 3,
241
4,99
5 –
WP
17-1
6, li
ne 3
3 N
B-R
elat
ed (I
nclu
des
Emer
gent
Wor
k)
46H
17
,226
26
,230
27
,534
41
,363
56
,488
61
,345
73
,927
W
P 17
-16,
line
4
4 La
nd P
urch
ases
and
New
Dis
tribu
tion
Subs
tatio
n 46
N
46
30
– –
– –
– W
P 17
-16,
line
6
5 M
isce
llane
ous
46#
695
– –
– –
– –
WP
17-1
6, li
ne 1
6 To
tal
$3
6,27
0 $7
8,88
0 $6
5,19
1 $5
8,08
2 $6
8,06
1 $7
1,98
5 $7
4,72
8
(PG&E-4)
17-30
b. Distribution Line Capacity (MWC 06) 1
MWC 06 includes capacity expansion work outside of substations. 2
Projects in MWC 06 address specific capacity deficiencies or overload 3
conditions, as well as voltage conditions outside of Electric Rule 2 4
criteria on distribution lines and equipment. PG&E performs this work to 5
prevent equipment damage or failure due to excessive heating and to 6
prevent outages. 7
PG&E’s forecast for MWC 06 is $233.7 million in 2021, 8
$150.5 million in 2022, $137.7 million in 2023, $163.2 million in 2024, 9
176.3 million in 2025, and $187.5 million in 2026. PG&E’s 2023 forecast 10
for this area is $29.9 million more than 2020 recorded expenditures of 11
$107.3 million due to increasing levels of emergent capacity work, 12
an expansion of the overloaded transformer replacement program, and 13
higher project costs.36 14
PG&E separates MWC 06 work into the following MATs: 15
Feeder Projects Associated with Substation Work (MAT 06A); 16
Overloaded Line Transformers (MAT 06B); 17
Circuit Reinforcement – Distribution Planning (DP) Managed 18
(MAT 06D); 19
Circuit Reinforcement – Project Services (PS) Managed (MAT 06E); 20
Voltage Complaint Projects Involving Secondary Distribution 21
(MAT 06G); 22
NB-Related Capacity Increase (MAT 06H); 23
Operational Capacity Projects (MAT 06I); 24
Power Factor Management (MAT 06K); 25
Enable Distributed Generation (DG) Distribution Line (MAT 06P); 26
and 27
Line Voltage Regulator Revolving Stock (MAT 06#). 28
PG&E coordinates projects in these categories, to the extent 29
possible, with substation work under MWC 46 to jointly address specific 30
overloads or capacity deficiencies. 31
36 Exhibit (PG&E-4), WP 17-15, line 14.
(PG&E-4)
17-31
A summary of the forecast expenditures for all distribution line 1
capacity work in MWC 06 is in Table 17-7 at the end of this section. 2
PG&E describes below the major drivers for the forecast capital 3
expenditures. 4
1) Feeder Projects Associated with Substation Work (MAT 06A) 5
The work in MAT 06A encompasses installing and/or replacing 6
underground cable and overhead conductor associated with new 7
substation transformers and feeders. The forecast is based on 8
specifically identified projects for normal load growth type capacity 9
work or other drivers. The workpapers supporting this chapter list 10
the projects included in the forecast.37 11
PG&E’s forecast for MAT 06A is $39.8 million in 2021, 12
$23.3 million in 2022, $10.1 million in 2023, $10.6 million in 2024, 13
11.6 million in 2025, and $12.3 million in 2026.38 PG&E’s 2023 14
forecast for MAT 06A is $10.1 million, including escalation, which is 15
$3.7 million less than 2020 recorded capital expenditures of 16
$13.8 million.39 The 2023 forecast is based on projects that were 17
specifically identified at the time; the Emergent Work forecast in 18
MWC 06H contains funding for additional, similar projects not 19
specifically identified at the time of the forecast. 20
2) Overloaded Line Transformers (MAT 06B) 21
Line transformers convert primary voltages—4 kilovolts (kV) and 22
above—to standard secondary customer service voltages, such as 23
120/240 volts (V). Overloaded overhead and underground line 24
transformer replacement work in MAT 06B corrects capacity 25
deficiencies on distribution line transformers, either by replacing the 26
overloaded line transformer with a larger transformer, or by adding 27
an additional transformer and transferring load. PG&E identifies line 28
transformer projects by overload reports using SmartMeter™ data. 29
37 Exhibit (PG&E-4), WP 17-17, lines 1-18; and, pages WP 17-19 to WP 17-20 of Table
17-18. 38 Exhibit (PG&E-4), WP 17-15, line 1. 39 Id.
(PG&E-4)
17-32
PG&E is placing increased focus on replacing overloaded 1
transformers due to its recognition that overloaded transformers can 2
become potential ignition sources and can contribute to the effects 3
of global climate change. In certain rare circumstances, overloaded 4
transformers can fail and start ignitions with serious consequences, 5
especially in High Fire Threat District (HFTD) areas. Global 6
temperature rise has also increased the need for air conditioning in 7
temperate PG&E communities that historically did not have 8
significant air conditioning electrical demands. 9
Starting in April 2020, PG&E conducted a pilot in North Valley to 10
evaluate costs and best practices to address overloaded 11
transformers in HFTD areas. An Overloaded Transformer Action 12
Plan was to address these evolving conditions on PG&E’s system. 13
This GRC forecast now encompasses existing transformer 14
replacement, but also includes replacements to address HFTD 15
ignitions and climate vulnerability and is included as part of the 16
Overloaded Transformer Action Plan. PG&E is forecasting an 17
increase for this program from its 2020 recorded costs of 18
$0.9 million to $5.0 million in 2021, $4.7 million in 2022, $8.2 million 19
in 2023, $10.7 million in 2024, $11.3 million in 2025, and 20
$11.7 million in 2026.40 This represents a replacement rate of 21
150-200 transformers per year in 2021 and 2022 and 350-400 per 22
year for 2023 through 2026.41 23
3) Circuit Reinforcement–DP Managed (MAT 06D) 24
The work in MAT 06D encompasses installing and/or replacing 25
underground cables, overhead conductors, line switches, protective 26
devices, and voltage regulating devices to meet voltage, operational 27
and capacity needs. Work in this category is for smaller projects. 28
40 Exhibit (PG&E-4), WP 17-15, line 2; and, WP 17-28, line 24. 41 PG&E also replaces overloaded transformers that have failed or present an imminent
hazard as part of the Emergency Recovery Program (see Ch. 6 of this exhibit, Electric Emergency Recovery). Forecasts in that program are not duplicative of forecasts in the Capacity Program.
(PG&E-4)
17-33
PG&E’s forecast for MAT 06D is $0.7 million in 2021, 1
$4.0 million in 2022, $4.5 million in 2023, $5.3 million in 2024, 2
5.8 million in 2025, and $6.1 million in 2026.42 PG&E’s 2023 3
forecast is $2.5 million higher than the 2020 recorded amount of 4
$2.0 million.43 PG&E’s recorded expenditures in 2018-2020 were 5
low by historical standards; PG&E’s 2023 forecast returns to 6
historical trends. 7
4) Circuit Reinforcement–PS Managed (MAT 06E) 8
Projects in MAT 06E involve the same type of work as 9
MWC 06D, but generally have a larger scope and are managed by 10
Project Services personnel, rather than by Distribution Planning. 11
PG&E’s forecast for MAT 06E is $27.5 million in 2021, 12
$17.0 million in 2022, $24.0 million in 2023, $29.6 million in 2024, 13
32.2 million in 2025, and $34.3 million in 2026. PG&E’s 2023 14
forecast for MAT 06E is $3.9 million more than 2020 recorded 15
capital expenditures of $21.1 million.44 PG&E’s 2023 forecast is 16
higher than 2020 costs due to a shift from 06D to 06E due to more 17
PS Managed Work. 18
5) Voltage Complaint Projects Involving Secondary Distribution 19
(MAT 06G) 20
Work in MAT 06G typically consists of adding or upgrading: 21
(1) existing transformers; (2) secondary distribution conductors; 22
and/or (3) secondary service wires. PG&E conducts this work to 23
comply with the voltage requirements of Electric Rule 2. PG&E 24
typically identifies this work from customer complaints. PG&E then 25
sets a recording voltmeter at the service delivery point to confirm the 26
problem. If a voltage problem is identified, PG&E personnel 27
evaluate potential solutions and determine a cost-effective remedy. 28
PG&E’s forecast for MAT 06G is $2.9 million in 2021, 29
$3.0 million in 2022, $2.8 million in 2023, $3.3 million in 2024, 30
42 Exhibit (PG&E-4), WP 17-15, line 3. 43 Id. 44 Exhibit (PG&E-4), WP 17-15, line 4.
(PG&E-4)
17-34
3.5 million in 2025, and $3.7 million in 2026. PG&E’s 2023 forecast 1
is $0.6 million more than 2020 recorded capital expenditures of 2
$2.2 million.45 PG&E’s forecast is based roughly on a 3-year 3
(2017-2019) historical average. 4
6) NB-Related Capacity Work (MAT 06H) 5
PG&E performs capacity reinforcement projects under MAT 06H 6
to eliminate overloads, due to an individual new development or an 7
existing customer’s load increase. PG&E’s local area planners 8
forecast the need for these projects, based on current requests for 9
service and building activity. 10
Over the last few years, a significant portion of PG&E’s overall 11
capacity growth has been from large load increases for individual 12
customers, such as electric vehicle charging, internet delivery 13
services, data centers, drought-related pumping loading, expansion 14
of tech company facilities, and indoor agriculture customers. These 15
types of specific individualized capacity projects lead to significant 16
variations in the capacity driven work in a particular location from 17
year-to-year and are difficult to forecast and plan far in advance. 18
Consistent with the forecast for MAT 46H, PG&E includes a 19
forecast in MWC 06H for “Unidentified, Emergent Work.” 20
The Emergent Work funding for distribution line projects is forecast 21
based upon 2020 spend with increasing year-over-year spending to 22
account for the number of new business applications for service that 23
require capacity work to serve these loads. 24
PG&E’s forecast for MAT 06H is $140.9 million in 2021, 25
$84.0 million in 2022, $71.9 million in 2023, $84.3 million in 2024, 26
$90.9 million in 2025, and $96.9 million in 2026. PG&E’s 2023 27
forecast is $20.9 million more than 2020 recorded capital 28
expenditures of $51.0 million.46 The 2023 increase over historic 29
spend is due to an increase in the number of new business 30
45 Exhibit (PG&E-4), WP 17-15, line 5. 46 Exhibit (PG&E-4), WP 17-15, line 13.
(PG&E-4)
17-35
applications for service that require capacity work to serve these 1
loads. 2
7) Operational Capacity Projects (MAT 06I) 3
MAT 06I generally includes two distinct types of work: 4
(1) completing mainline loops or installing mainline back-ties; and 5
(2) operational capacity projects to reduce the number of customers 6
or the load on certain heavily loaded circuits. Additionally, there are 7
some projects in MAT 06I to install switches or reconductor existing 8
distribution line to increase local operational capacity, based on 9
input from field personnel or engineers who operate the system. 10
PG&E’s forecast for MAT 06I is $5.8 million in 2021, $5.3 million 11
in 2022, $6.7 million in 2023, $8.0 million in 2024, $8.7 million in 12
2025, and $9.2 million in 2026. PG&E’s 2023 forecast is 13
$2.2 million more than 2020 recorded capital expenditures of 14
$4.5 million.47 PG&E’s forecast is based roughly on a 3-year 15
(2018-2020) historical average. 16
a) Complete Mainline Loops to Comply with Design Standards 17
PG&E’s primary mainline system is designed so that, when 18
completed, each mainline section is connected (with an 19
adequately-sized conductor) to the mainline system at both 20
ends. Both sources to a mainline section must be completed 21
and energized as soon as the connected energized 22
transformers served from any continuous section of that same 23
main-line section total more than 1,500 kV-amperes 24
(nameplate) or serve more than 100 customers. Completion of 25
mainline loops provides two primary paths of service for 26
reliability purposes. PG&E has identified 120 locations that do 27
not meet these design criteria. PG&E’s forecast for this work is 28
$2.0 million in 2021, $2.8 million in 2022, $2.8 million in 2023, 29
$2.8 million in 2024, $2.8 million in 2025, and $2.8 million in 30
2026.48 31
47 Exhibit (PG&E-4), WP 17-15, line 9. 48 Exhibit (PG&E-4), WP 17-29.
(PG&E-4)
17-36
b) Reducing the Number of Customers Per Circuit to Fewer 1
Than 6,000 or Reducing the Load to 600 Amperes or Less 2
Feeders with 6,000 or more customers per circuit, or with a 3
load of more than 600 amps, pose two issues: (1) a large 4
number of customers are affected when an outage occurs, due 5
to a circuit breaker opening; and (2) typical loading limits on 6
adjacent circuits could hinder the ability to reconfigure 7
highly-loaded circuits. These issues negatively affect service 8
reliability in both customer outage frequency and duration. 9
For the 2023 GRC cycle, PG&E has identified 10
11 distribution line only projects (no associated substation work) 11
to reduce the number of customers per circuit to less than 12
6,00049 at a cost of $1.6 million per year from 2023-2026, and 13
two distribution line only projects50 to reduce loading to 14
600 amps or less at a cost of $0.6 million per year from 15
2023-2026. 16
Additional forecasted spend in 06I comes from mainline tie 17
projects. These projects typically allow for improved ability to 18
reconfigure circuits in emergencies and for planned clearances. 19
These projects are specifically identified by operational or 20
planning engineers and then funded from emergent operational 21
capacity funds. 22
8) Power Factor Management (MAT 06K) 23
The 2023 forecast for MAT 06K will allow PG&E to continue 24
installing System Control and Data Acquisition (SCADA) controls on 25
strategically located distribution capacitor banks. Remote capacitor 26
operability will allow control setting changes to be made remotely, 27
ensuring greater operational flexibility for better power factor 28
management, as well as increased voltage and reactive power 29
support of the system. 30
49 Exhibit (PG&E-4), WP 17-30. 50 Exhibit (PG&E-4), WP 17-31.
(PG&E-4)
17-37
PG&E’s forecast for MAT 06K is $0 million in 2021, $0.6 million 1
in 2022, $1.1 million in 2023, $1.3 million in 2024, $1.4 million in 2
2025, and $1.5 million in 2026.51 PG&E’s 2023 forecast is 3
$1.1 million more than 2020 recorded capital expenditures of 4
$0.04 million.52 5
In 2017-2021, spending in this program was re-allocated to 6
other, higher priority capacity work such as customer-driven new 7
business capacity. The 2022-2026 forecast assumes 0 units in 8
2021, 20 units in 2022, 34 units in 2023, 40 units in 2024, 44 units in 9
2025, and 46 units in 2026. This forecast assumes a cost of 10
$33,000 per capacitor bank to enable SCADA which is based on the 11
updated cost to replace a capacitor unit with a unit that can 12
accommodate a SCADA control.53 13
9) Enable Distributed Generation (DG) Distribution Line (MAT 06P) 14
Work in MAT 06P includes distribution upgrades for DERs. 15
The primary purpose of the program is to upgrade the distribution 16
system to enable two-way power flow in order to facilitate 17
interconnection by DER customers. Voltage regulating devices 18
located in a mainline section with control settings that allow 19
cogeneration operation when the mainline is temporarily 20
reconfigured require the cogeneration setting to be disabled to 21
ensure proper bi-directional operation. To facilitate the setting 22
change, these regulators need remote control and access via 23
SCADA. The forecast in MAT 06P is for funding to install SCADA 24
on existing regulators that meet the criteria. PG&E has identified 25
304 mainline regulators with recorded backflow of 10 amps or 26
greater that have the potential for temporary reconfiguration 27
requiring a control setting change prior to switching. 28
PG&E’s 2023-2026 forecast for this area is approximately 29
$1.6 million annually. PG&E’s 2023 forecast is $0.4 million more 30
51 Exhibit (PG&E-4), WP 17-15, line 10. 52 Id. 53 Exhibit (PG&E-4), WP 17-25 and WP 17-32, line 18.
(PG&E-4)
17-38
than 2020 recorded capital expenditures of $0.9 million.54 1
The funding forecast is sufficient to install SCADA operability on 2
0 units in 2021, 5 units in 2022, 9 units in 2023, 10 units in 2024, 3
11 units in 2025, and 12 units in 2026. This forecast assumes a 4
cost of $150,000 per regulator bank to enable SCADA which is 5
based on the updated cost to replace a regulator unit with a unit that 6
can accommodate a SCADA control.55 7
10) Line Voltage Regulator Revolving Stock (MAT 06#) 8
The purpose of the line voltage regulator revolving stock 9
process is to centrally manage equipment stock to use as needed, 10
and to minimize surplus stock. Some of the revolving stock consists 11
of overhauled or repaired units that can be reused. 12
PG&E’s forecast for purchase of line voltage regulators in 13
MAT 06# is $11.1 million in 2021, $7.9 million in 2022, $7.1 million 14
in 2023, $8.4 million in 2024, 9.2 million in 2025, and $9.8 million in 15
2026. PG&E’s 2023 forecast for this area is $7.1 million, including 16
escalation, which is $3.6 million less than 2020 recorded capital 17
expenditures of $10.7 million.56 The 2020 recorded spend was 18
abnormally high and reflects carryover from 2019 when only 19
$2.4 million was spent on voltage regulator purchases. 20
11) MWC 06 Distribution Line Capacity Forecast Summary 21
Table 17-7 summarizes PG&E’s forecasts and historical 22
expenditures for Distribution Line Capacity in MWC 06. 23
54 Exhibit (PG&E-4), WP 17-15, line 11. 55 Exhibit (PG&E-4), WP 17-26. 56 Exhibit (PG&E-4), WP 17-15, line 12.
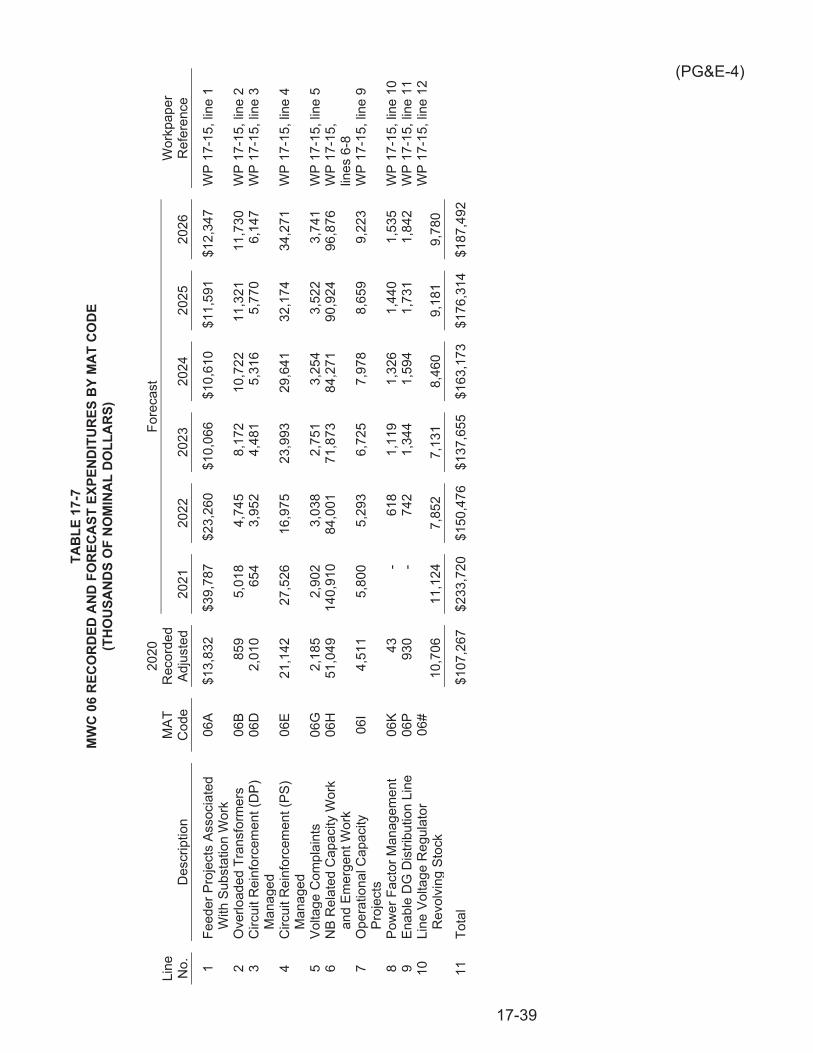
(PG&E-4)
17-39
TAB
LE 1
7-7
MW
C 0
6 R
ECO
RD
ED A
ND
FO
REC
AST
EXP
END
ITU
RES
BY
MA
T C
OD
E (T
HO
USA
ND
S O
F N
OM
INA
L D
OLL
AR
S)
Line
N
o.
Des
crip
tion
MAT
C
ode
2020
R
ecor
ded
Adju
sted
Fore
cast
W
orkp
aper
R
efer
ence
20
21
2022
20
23
2024
20
25
2026
1 Fe
eder
Pro
ject
s As
soci
ated
W
ith S
ubst
atio
n W
ork
06A
$13,
832
$39,
787
$23,
260
$10,
066
$10,
610
$11,
591
$12,
347
WP
17-1
5, li
ne 1
2 O
verlo
aded
Tra
nsfo
rmer
s 06
B 85
9 5,
018
4,74
5 8,
172
10,7
22
11,3
21
11,7
30
WP
17-1
5, li
ne 2
3
Circ
uit R
einf
orce
men
t (D
P)
Man
aged
06
D
2,01
0 65
4 3,
952
4,48
1 5,
316
5,77
0 6,
147
WP
17-1
5, li
ne 3
4 C
ircui
t Rei
nfor
cem
ent (
PS)
Man
a ged
06
E 21
,142
27
,526
16
,975
23
,993
29
,641
32
,174
34
,271
W
P 17
-15,
line
4
5 Vo
ltage
Com
plai
nts
06G
2,
185
2,90
2 3,
038
2,75
1 3,
254
3,52
2 3,
741
WP
17-1
5, li
ne 5
6
NB
Rel
ated
Cap
acity
Wor
k an
d Em
erge
nt W
ork
06H
51
,049
14
0,91
0 84
,001
71
,873
84
,271
90
,924
96
,876
W
P 17
-15,
lin
es 6
-8
7 O
pera
tiona
l Cap
acity
Pr
ojec
ts
06I
4,51
1 5,
800
5,29
3 6,
725
7,97
8 8,
659
9,22
3 W
P 17
-15,
line
9
8 Po
wer
Fac
tor M
ana g
emen
t 06
K 43
-
618
1,11
9 1,
326
1,44
0 1,
535
WP
17-1
5, li
ne 1
0 9
Enab
le D
G D
istri
butio
n Li
ne
06P
930
- 74
2 1,
344
1,59
4 1,
731
1,84
2 W
P 17
-15,
line
11
10
Line
Vol
tage
Reg
ulat
or
Rev
olvi
ng S
tock
06
# 10
,706
11
,124
7,
852
7,13
1 8,
460
9,18
1 9,
780
WP
17-1
5, li
ne 1
2
11
Tota
l
$107
,267
$2
33,7
20
$150
,476
$1
37,6
55
$163
,173
$1
76,3
14
$187
,492
(PG&E-4)
17-40
c. Estimating Method 1
PG&E used two methods to develop its capital expenditure 2
forecasts for the traditional distribution capacity. 3
1) Specifically identified projects and identified emergent projects make 4
up over 87 percent of the total MWC 46 2023-2026 capital forecast 5
in the Capacity Program57. For these projects, PG&E relied on 6
individual job forecasts using engineering estimates of the 7
necessary work and unit cost data or costs from similar projects; 8
and 9
2) For smaller, re-occurring type of similar projects as well as emergent 10
MWC 06 projects, PG&E based its forecast on a 3-year average of 11
recorded expenditures, the increasing number of customer 12
applications for service that require capacity work, and engineering 13
judgment. 14
D. Compliance With Section 5.2 of the 2020 GRC Settlement Agreement 15
(“Deferred Work Principles”) 16
The 2020 GRC Settlement Agreement requires PG&E to include 17
testimony in this GRC on deferred work if the following criteria are met: 18
(a) The work was requested and authorized based on representations that it 19
was needed to provide safe and reliable service (Check 1); 20
(b) PG&E did not perform all of the authorized and funded work, as 21
measured by authorized (explicit or imputed) units of work (Check 2); 22
and 23
(c) PG&E continues to represent that the curtailed work is necessary to 24
provide safe and reliable service (Check 3). 25
Work that was authorized in the 2020 GRC for MWCs is this chapter is 26
needed to provide safe and reliable service, however there was no work that 27
met the criteria for deferred work as described in the Settlement Agreement. 28
This analysis is presented in the workpapers supporting Chapter 2 of this 29
Exhibit.58 30
57 Exhibit (PG&E-4) WP 17-14, line 29; WP 17-20, Table 17-18, line 81; and, WP 17-22,
Table 17-18, line 124. 58 See Exhibit (PG&E-4), WP 2-13.
(PG&E-4)
17-41
E. Cost Tables 1
The expense and capital forecasts for Electric Distribution Capacity related 2
activities are summarized in the following tables: 3
Table 17-8 shows 2016 through 2020 recorded expenses and 2021 through 4
2023 forecast expenses; and 5
Table 17-9 shows 2016 through 2020 recorded expenditures and 2021 6
through 2026 forecast expenditures. 7
(PG&E-4)
17-42
TAB
LE 1
7-8
EXPE
NSE
(T
HO
USA
ND
S O
F N
OM
INA
L D
OLL
AR
S)
Line
N
o.
MW
C
Des
crip
tion
Rec
orde
d Ad
just
ed
Fore
cast
W
orkp
aper
R
efer
ence
20
16
2017
20
18
2019
20
20
2021
20
22
2023
1 FZ
El
ectri
c En
gine
erin
g an
d Pl
anni
ng
$11,
715
$12,
118
$11,
332
$10,
651
$15,
158
$15,
447
$16,
155
$19,
943
WP
17-1
, lin
e 1
2
Tota
l $1
1,71
5 $1
2,11
8 $1
1,33
2 $1
0,65
1 $1
5,15
8 $1
5,44
7 $1
6,15
5 $1
9,94
3
TAB
LE 1
7-9
CA
PITA
L (T
HO
USA
ND
S O
F N
OM
INA
L D
OLL
AR
S)
Line
No.
MW
C D
escr
iptio
n
Rec
orde
d Ad
just
ed
Fore
cast
W
orkp
aper
R
efer
ence
20
16
2017
20
18
2019
20
20
2021
20
22
2023
20
24
2025
20
26
1 06
E
Dis
t Lin
e C
apac
ity
$91,
361
$55,
960
$67,
746
$73,
444
$107
,255
$2
33,7
20
$150
,476
$1
37,6
55
$163
,173
$1
76,3
14
$187
,492
W
P 17
-6, l
ine
1
2 46
E
Dis
t Sub
st C
apac
ity
42,8
62
17,3
54
12,3
76
17,9
00
36,2
70
78,8
80
65,1
91
58,0
82
68,0
61
71,9
85
74,7
28
WP
17-6
, lin
e 2
3
Tota
l $1
34,2
23
$73,
314
$80,
122
$91,
344
$143
,525
$3
12,6
00
$215
,667
$1
95,7
38
$231
,234
$2
48,2
99
$262
,219
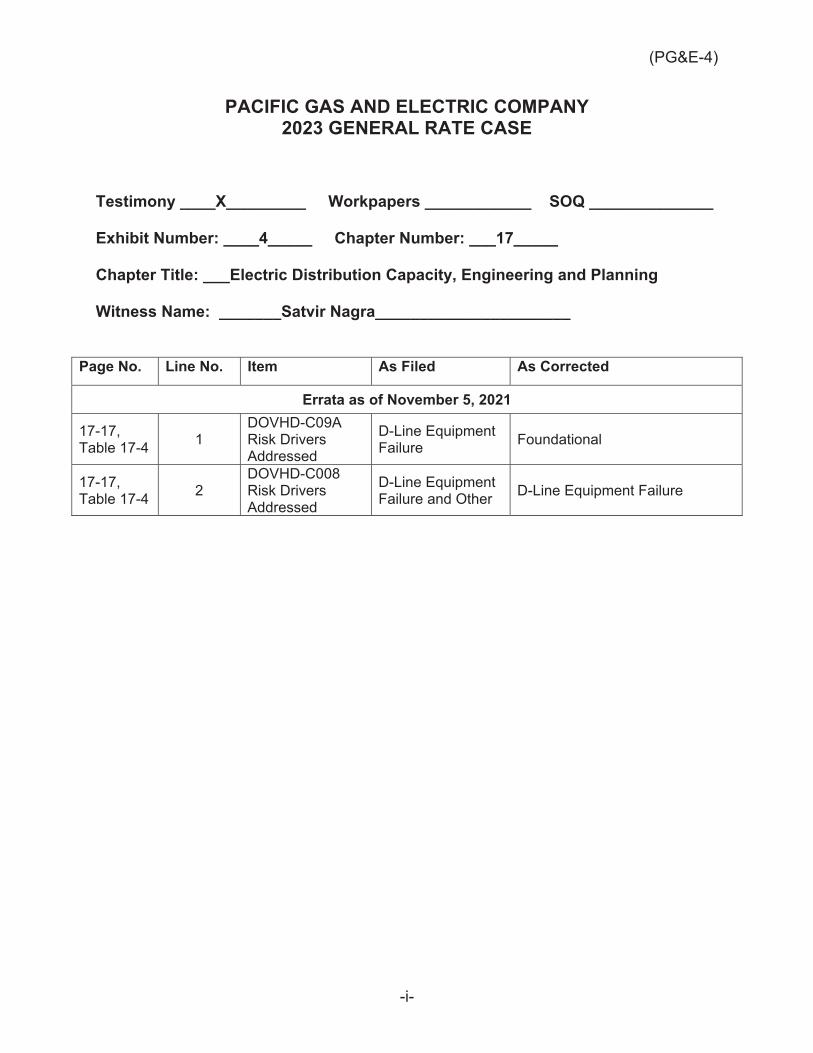
(PG&E-4)
-i-
PACIFIC GAS AND ELECTRIC COMPANY 2023 GENERAL RATE CASE
Testimony ____X_________ Workpapers ____________ SOQ ______________ Exhibit Number: ____4_____ Chapter Number: ___17_____ Chapter Title: ___Electric Distribution Capacity, Engineering and Planning Witness Name: _______Satvir Nagra______________________
Page No. Line No. Item As Filed As Corrected
Errata as of November 5, 2021
17-17, Table 17-4 1
DOVHD-C09A Risk Drivers Addressed
D-Line Equipment Failure Foundational
17-17, Table 17-4 2
DOVHD-C008 Risk Drivers Addressed
D-Line Equipment Failure and Other D-Line Equipment Failure

(PG&E-4)
PACIFIC GAS AND ELECTRIC COMPANY
CHAPTER 18
NEW BUSINESS AND WORK AT THE REQUEST OF OTHERS
[INCLUDES NOVEMBER 5, 2021 ERRATA]
(PG&E-4)
18-i
PACIFIC GAS AND ELECTRIC COMPANY CHAPTER 18
NEW BUSINESS AND WORK AT THE REQUEST OF OTHERS
TABLE OF CONTENTS
A. Introduction ..................................................................................................... 18-1
1. Scope and Purpose ................................................................................. 18-1
2. Summary of Request ............................................................................... 18-2
a. Expense ............................................................................................. 18-2
b. Capital ............................................................................................... 18-3
3. Overview of Recorded and Forecast Costs .............................................. 18-4
a. Expense ............................................................................................. 18-5
1) MWC EV – NB Service Inquiry .................................................... 18-5
2) MWC EW – Expense WRO ......................................................... 18-7
b. Capital ............................................................................................. 18-10
1) MWC 16 – Electric NB .............................................................. 18-10
2) MWC 10 – Electric WRO ........................................................... 18-14
4. Support for Request ............................................................................... 18-17
5. Organization of the Remainder of This Chapter ..................................... 18-18
B. Program and Risk Overview ......................................................................... 18-18
1. Program Description .............................................................................. 18-18
a. Program Overview ........................................................................... 18-18
b. Management Structure .................................................................... 18-18
c. Key Metrics and Other Performance Measures ............................... 18-19
2. Risk Integration ...................................................................................... 18-19
C. Activities, Costs, and Forecast Drivers by MWC .......................................... 18-19
1. Expense ................................................................................................. 18-19
a. MWC EV – NB Services Inquiry ...................................................... 18-19
1) MWC EVA – NB Service Inquiry ............................................... 18-19
(PG&E-4) PACIFIC GAS AND ELECTRIC COMPANY
CHAPTER 18 NEW BUSINESS AND WORK AT THE REQUEST OF OTHERS
TABLE OF CONTENTS
(CONTINUED)
18-ii
2) MAT EVB – OK to Serve Routine .............................................. 18-20
3) MAT EVB – OK to Serve PEV ................................................... 18-21
4) MWC EV – NB Service Inquiry Forecast Summary ................... 18-22
b. MWC EW – Expense WRO ............................................................. 18-23
1) Relocations ............................................................................... 18-23
2) Electric Grid Interconnection ..................................................... 18-24
3) MWC EW Electric WRO Expense Forecast Summary .............. 18-24
2. Capital MWCs ........................................................................................ 18-25
a. MWC 16 – Electric NB ..................................................................... 18-25
1) MWC 16 – Residential Connects .............................................. 18-25
2) MWC 16 – Non-Residential Connects ....................................... 18-28
3) MWC 16 – PEV ......................................................................... 18-30
4) MWC 16 – Transformer Purchases ........................................... 18-33
5) MWC 16 – Transformer Scrapping ............................................ 18-35
6) MWC 16 – Electric NB Forecast Summary ............................... 18-37
b. MWC 10 – Electric WRO ................................................................. 18-39
1) MWC 10 – NB Related WRO .................................................... 18-39
2) MWC 10 – Government-Related WRO ..................................... 18-41
3) MWC 10 – Major Projects ......................................................... 18-43
4) MWC 10 – State Infrastructure Projects .................................... 18-43
D. Compliance with Prior Commission Decisions ............................................. 18-46
1. Compliance with Section 5.2 of the 2020 GRC Settlement Agreement (“Deferred Work Principles”) .................................................................. 18-46
2. Decision (D.) 20-05-008 - Caltrain Settlement ....................................... 18-46

(PG&E-4) PACIFIC GAS AND ELECTRIC COMPANY
CHAPTER 18 NEW BUSINESS AND WORK AT THE REQUEST OF OTHERS
TABLE OF CONTENTS
(CONTINUED)
18-iii
E. Cost Tables .................................................................................................. 18-49
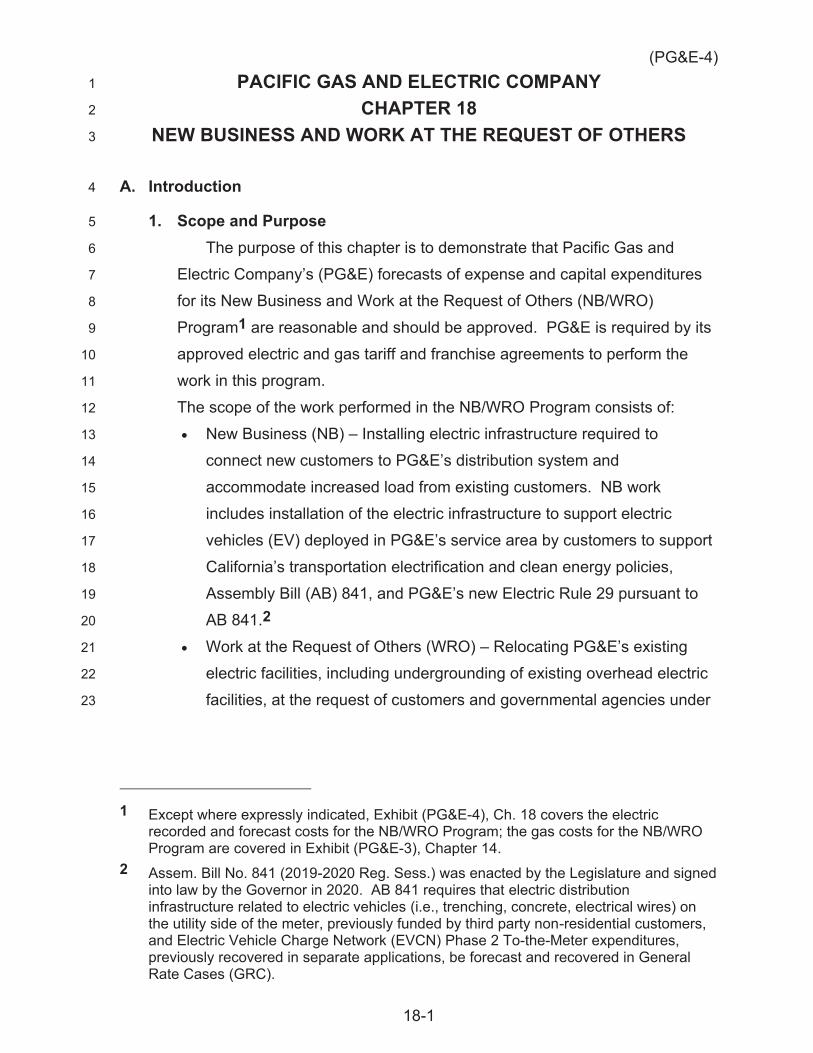
(PG&E-4)
18-1
PACIFIC GAS AND ELECTRIC COMPANY 1
CHAPTER 18 2
NEW BUSINESS AND WORK AT THE REQUEST OF OTHERS 3
A. Introduction 4
1. Scope and Purpose 5
The purpose of this chapter is to demonstrate that Pacific Gas and 6
Electric Company’s (PG&E) forecasts of expense and capital expenditures 7
for its New Business and Work at the Request of Others (NB/WRO) 8
Program1 are reasonable and should be approved. PG&E is required by its 9
approved electric and gas tariff and franchise agreements to perform the 10
work in this program. 11
The scope of the work performed in the NB/WRO Program consists of: 12
New Business (NB) – Installing electric infrastructure required to 13
connect new customers to PG&E’s distribution system and 14
accommodate increased load from existing customers. NB work 15
includes installation of the electric infrastructure to support electric 16
vehicles (EV) deployed in PG&E’s service area by customers to support 17
California’s transportation electrification and clean energy policies, 18
Assembly Bill (AB) 841, and PG&E’s new Electric Rule 29 pursuant to 19
AB 841.2 20
Work at the Request of Others (WRO) – Relocating PG&E’s existing 21
electric facilities, including undergrounding of existing overhead electric 22
facilities, at the request of customers and governmental agencies under 23
1 Except where expressly indicated, Exhibit (PG&E-4), Ch. 18 covers the electric
recorded and forecast costs for the NB/WRO Program; the gas costs for the NB/WRO Program are covered in Exhibit (PG&E-3), Chapter 14.
2 Assem. Bill No. 841 (2019-2020 Reg. Sess.) was enacted by the Legislature and signed into law by the Governor in 2020. AB 841 requires that electric distribution infrastructure related to electric vehicles (i.e., trenching, concrete, electrical wires) on the utility side of the meter, previously funded by third party non-residential customers, and Electric Vehicle Charge Network (EVCN) Phase 2 To-the-Meter expenditures, previously recovered in separate applications, be forecast and recovered in General Rate Cases (GRC).

(PG&E-4)
18-2
the provisions of PG&E’s Electric Rule 20B (Rule 20B) and Electric 1
Rule 20C (Rule 20C).3 2
Work in the NB/WRO Program includes customer contact, design and 3
engineering, job cost estimation, contract preparation, construction, 4
inspection of third-party work, and facility mapping. Even though new 5
customers may select a party other than PG&E to design and/or construct 6
portions of the work covered by the NB/WRO Program (such as a new 7
customer connection), PG&E must still perform the cost estimate, third-party 8
design check, inspection of third-party construction work, construction tie-in, 9
contract preparation, billing, mapping, and reimbursement of third-party work 10
in accordance with its electric tariff. 11
2. Summary of Request 12
a. Expense 13
PG&E requests that the California Public Utilities Commission 14
(CPUC or Commission) adopt its 2023 expense forecast for the 15
NB/WRO Program of $24.2 million, shown in Table 18-1. The costs for 16
this program are tracked in Major Work Categories (MWC) EV and EW. 17
As shown in Figure 18-1, PG&E’s expense forecast for 2023 is 18
$4.3 million (or 15 percent) less than PG&E’s 2020 recorded expenses.4 19
This decrease is due to lower forecast costs for Expense Relocations 20
and Electric Grid Interconnection as well as affordability initiatives. 21
3 Undergrounding of existing overhead electric facilities under the provisions of PG&E’s
Electric Tariff Rule 20A is covered under Exhibit (PG&E-4), Ch. 19, Rule 20A. On May 11, 2017, the CPUC opened Order Instituting Rulemaking R.17-05-010 to Consider Revisions to Electric Rule 20 and Related Matters (Rule 20 OIR) to review and revise the Rule 20 Program statewide. On June 3, 2021, the Commission approved a final decision on Phase 1 of the Rule 20 OIR which, among other things, requires PG&E to create a balancing account for all its Rule 20 programs, including the Rule 20B and 20C programs. The Rule 20 OIR remains open and may require additional changes to Rule 20. PG&E will update its 2023 GRC content as needed to comply with the final decision on Phase 1 of the Rule 20 OIR and any subsequent decisions.
4 See Exhibit (PG&E-4), WP 18-1, line 3.
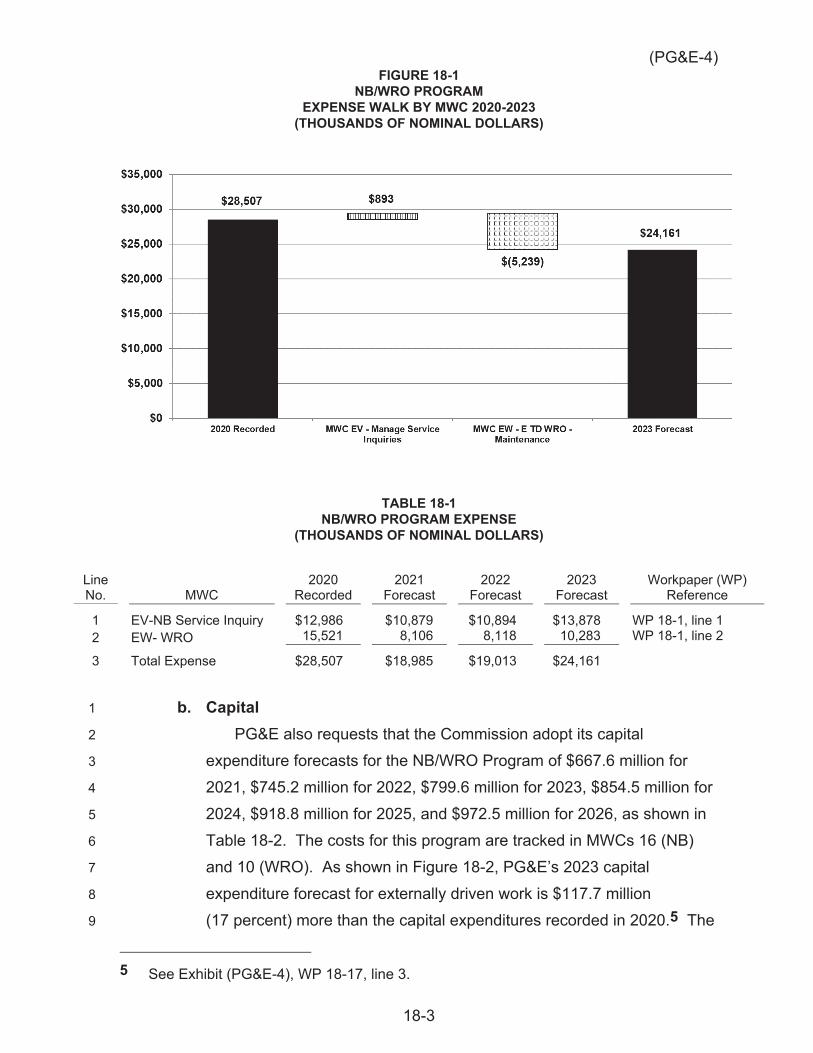
(PG&E-4)
18-3
FIGURE 18-1 NB/WRO PROGRAM
EXPENSE WALK BY MWC 2020-2023 (THOUSANDS OF NOMINAL DOLLARS)
TABLE 18-1 NB/WRO PROGRAM EXPENSE
(THOUSANDS OF NOMINAL DOLLARS)
Line No. MWC
2020 Recorded
2021 Forecast
2022 Forecast
2023 Forecast
Workpaper (WP) Reference
1 EV-NB Service Inquiry $12,986 $10,879 $10,894 $13,878 WP 18-1, line 1 2 EW- WRO 15,521 8,106 8,118 10,283 WP 18-1, line 2
3 Total Expense $28,507 $18,985 $19,013 $24,161
b. Capital 1
PG&E also requests that the Commission adopt its capital 2
expenditure forecasts for the NB/WRO Program of $667.6 million for 3
2021, $745.2 million for 2022, $799.6 million for 2023, $854.5 million for 4
2024, $918.8 million for 2025, and $972.5 million for 2026, as shown in 5
Table 18-2. The costs for this program are tracked in MWCs 16 (NB) 6
and 10 (WRO). As shown in Figure 18-2, PG&E’s 2023 capital 7
expenditure forecast for externally driven work is $117.7 million 8
(17 percent) more than the capital expenditures recorded in 2020.5 The 9
5 See Exhibit (PG&E-4), WP 18-17, line 3.
(PG&E-4)
18-4
increase is driven primarily by a projected increase in demand for new 1
residential customer connections and the inclusion in the GRC forecast 2
of some EV charging infrastructure costs that were historically covered 3
by customers or recovered in other proceedings. 4
FIGURE 18-2 NB/WRO PROGRAM
CAPITAL EXPENDITURES 2020-2026 (THOUSANDS OF NOMINAL DOLLARS)
TABLE 18-2 NB/WRO PROGRAM
CAPITAL FORECAST BY MWC 2020-2026 (THOUSANDS OF NOMINAL DOLLARS)
Line No. MWC
2020 Recorded
2021 Forecast
2022 Forecast
2023 Forecast
2024 Forecast
2025 Forecast
2026 Forecast
WP Reference
1 16 – Electric NB $536,190 $511,868 $600,122 $666,795 $714,625 $767,943 $796,132 WP 18-17, line 2
2 10 – Electric WRO 145,630 155,690 145,048 132,769 139,842 150,827 176,341 WP 18-17, line 1
3 Total $681,819 $667,558 $745,170 $799,564 $854,467 $918,770 $972,473
3. Overview of Recorded and Forecast Costs 5
The NB/WRO program consists of two expense MWCs—MWC EV 6
(Electric NB Service Inquiry) and MWC EW (Expense WRO)—and 7
two capital MWCs—MWC 16 (Electric NB) and MWC 10 (Electric WRO). 8
Each of these MWCs will be discussed below. 9
(PG&E-4)
18-5
a. Expense 1
1) MWC EV – NB Service Inquiry 2
MWC EV includes work associated with processing customer 3
applications for new gas and electric services6 and coordinating 4
requests from existing customers for additional load and 5
re-arrangements on existing services.7 PG&E tracks costs in 6
MWC EV by using two Maintenance Activity Types (MAT), and 7
three forecasting categories which are summarized in Table 18-3 8
and explained in further detail below. 9
TABLE 18-3 MWC EV FORECAST CATEGORIES AND MAT DESCRIPTIONS
Line No. Description MAT Forecast Category
1 New Customer Service Inquiry EVA EVA – Service Inquiry 2 OK to Serve – Added Load Coordination Routine EVB OK to Serve – Routine 3 OK to Serve – Added Load Coordination Plug in
Electric Vehicles (PEV) EVB OK to Serve – PEV
For 2023, MWC EV expenditures are forecast to increase by 10
$0.9 million (7 percent) over recorded expenditures in 2020.8 This 11
change is mainly driven by an increase in projected electric 12
customers and an increase in Plug-in Electric Vehicle (PEV) 13
applications related to AB 841. The change in expenditures by 14
forecasting category is summarized in Figure 18-3 15
6 MWC EV supports both gas and electric service-related inquiries. Both gas and electric
recorded and forecast expenditures for MWC EV are covered in this chapter; 55 percent of these expenditures are allocated to electric and 45 percent to gas based on the ratio of PGE’s total electric customers to total gas customers.
7 The NB Program supports service upgrades to facilities serving existing individual customers. Upgrades to PG&E facilities that serve multiple customers are considered upgrades to the distribution system and are normally handled by the Capacity program. See Exhibit (PG&E-4), Ch. 17.
8 See Exhibit (PG&E-4), WP 18-1, line 1.

(PG&E-4)
18-6
FIGURE 18-3 NB/WRO PROGRAM
EXPENSE WALK MWC EV 2020-2023 (THOUSANDS OF NOMINAL DOLLARS)
a) MAT EVA – NB Service Inquiry 1
PG&E provides customer assistance to every applicant who 2
requests a new connection. MAT EVA – NB Service Inquiry 3
includes all expenditures related to PG&E’s Contact Center 4
operations, which receives and processes NB applications. 5
b) MAT EVB – OK to Serve – Routine 6
MAT EVB tracks PG&E’s expenses for reviewing customer 7
inquiries with respect to existing services. PG&E analyzes 8
facilities that may be affected by proposed load increases or 9
customer facility changes to prevent overloading, which can 10
affect PG&E’s ability to provide safe and reliable service to the 11
customer and others in the vicinity of the change. Load checks 12
can also find pre-existing overload conditions, which are then 13
corrected to prevent issues arising from further load additions or 14
facility changes. This load analysis work is charged to 15
MAT EVB – OK to Serve whether or not further construction 16
(PG&E-4)
18-7
work is needed. If construction work is required, the 1
construction work is charged to the appropriate capital or 2
expense work category. 3
c) MAT EVB – OK to Serve – PEVs 4
Starting in late 2011, PG&E began receiving large volumes 5
of added load service requests involving the purchase of PEVs. 6
In response, PG&E began to separately track and forecast load 7
checks specifically related to PEV purchases. Depending upon 8
the charging selection made by the consumer (typically a 9
120-volt, 240-volt, or fast charge option), the additional load to a 10
single service, or local distribution system, can be substantial. 11
The volume of load service requests is forecasted to increase in 12
large part due to AB841. 13
2) MWC EW – Expense WRO 14
MWC EW covers the electric WRO expense work required by 15
tariffs and franchise agreements. This work includes non-plant 16
relocations and alterations of electric facilities (such as raising 17
covers and frames for a street repaving project), as well as 18
third-party Electric Grid Interconnection (EGI) activities. PG&E 19
tracks costs in MWC EW by using eight MAT work types, which are 20
grouped into three forecasting categories as summarized in 21
Table 18-4, Figure 18-4, and explained in further detail below. 22
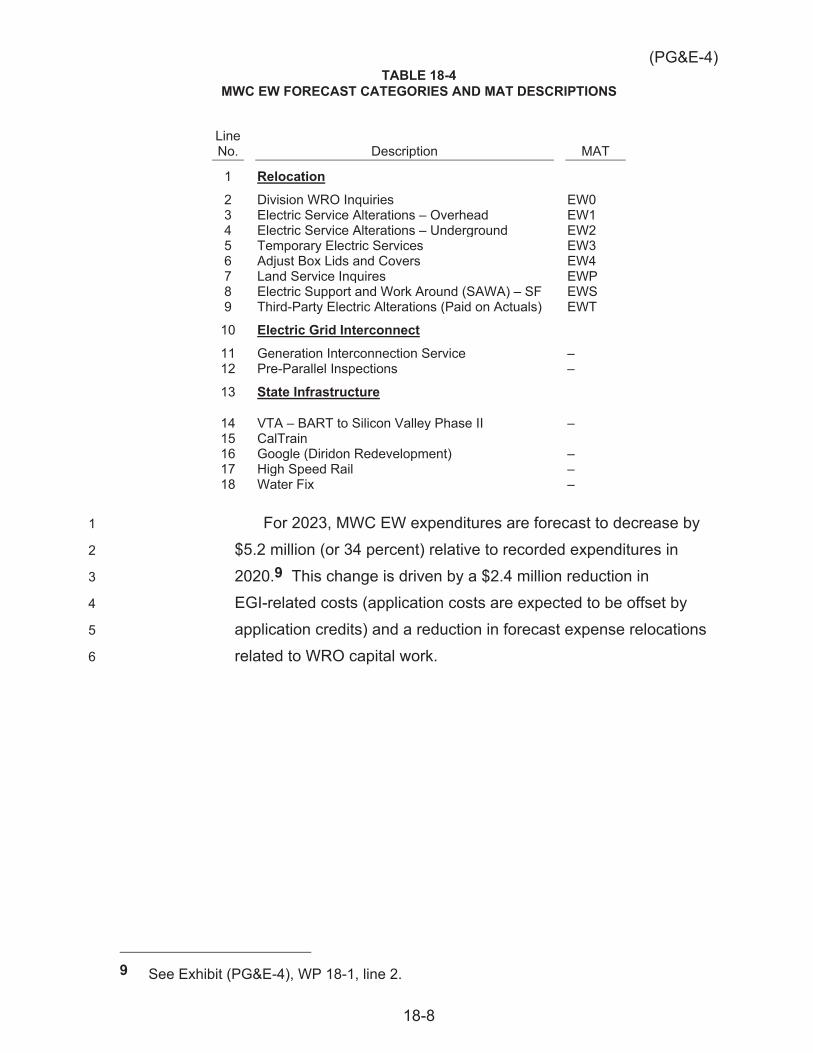
(PG&E-4)
18-8
TABLE 18-4 MWC EW FORECAST CATEGORIES AND MAT DESCRIPTIONS
Line No. Description MAT
1 Relocation
2 Division WRO Inquiries EW0 3 Electric Service Alterations – Overhead EW1 4 Electric Service Alterations – Underground EW2 5 Temporary Electric Services EW3 6 Adjust Box Lids and Covers EW4 7 Land Service Inquires EWP 8 Electric Support and Work Around (SAWA) – SF EWS 9 Third-Party Electric Alterations (Paid on Actuals) EWT
10 Electric Grid Interconnect
11 Generation Interconnection Service – 12 Pre-Parallel Inspections –
13 State Infrastructure
14 VTA – BART to Silicon Valley Phase II – 15 CalTrain 16 Google (Diridon Redevelopment) – 17 High Speed Rail – 18 Water Fix –
For 2023, MWC EW expenditures are forecast to decrease by 1
$5.2 million (or 34 percent) relative to recorded expenditures in 2
2020.9 This change is driven by a $2.4 million reduction in 3
EGI-related costs (application costs are expected to be offset by 4
application credits) and a reduction in forecast expense relocations 5
related to WRO capital work. 6
9 See Exhibit (PG&E-4), WP 18-1, line 2.

(PG&E-4)
18-9
FIGURE 18-4 NB/WRO PROGRAM
EXPENSE WALK MWC EW 2020-2023 (THOUSANDS OF NOMINAL DOLLARS)
a) MWC EW – Relocations 1
The MWC EW Relocations forecast covers MATs that relate 2
to a wide variety of work including: non-plant-related relocations 3
of electric facilities, temporary electric services provided to 4
customers during construction projects, and Land Department 5
right-of-way record research requested by third parties that 6
cannot be charged to a specific project. 7
b) MWC EW – Electric Grid Interconnection 8
PG&E’s EGI Department manages the electric 9
interconnection process for all generation projects 10
interconnected at PG&E’s distribution service. EGI projects 11
may include retail tariff programs, compliance with Electric 12
Rule 21, and interconnection applications for Federal Energy 13
Regulatory Commission (FERC)-jurisdictional projects under the 14
(PG&E-4)
18-10
Wholesale Distribution Tariff seeking Power Purchase 1
Agreements (PPA).10 2
b. Capital 3
1) MWC 16 – Electric NB 4
As discussed in Section A.1, Electric NB consists of installing 5
the electric infrastructure required to connect new customers to 6
PG&E’s distribution system or to accommodate increased load from 7
existing customers. The total cost of installing new electric 8
infrastructure is shared between PG&E and the customer requesting 9
the service. The cost sharing is detailed in Electric Rules 2, 15, 16 10
and 29. PG&E’s forecasts are net of customer contributions. PG&E 11
forecasts MWC 16 work in five forecasting categories – Residential 12
Connects, Non-Residential Connects, PEV Expenditures, 13
Distribution Transformer Purchases, and Distribution Transformer 14
Scrapping – which are summarized in Table 18-5 and explained in 15
further detail below. 16
10 PPAs include offerings such as the Renewable Market Adjusting Tariff Feed-in Tariff
established under D.12-05-035 and D.13-05-034 to implement Sen. Bill No. 32 (2015-2016 Reg. Sess.).
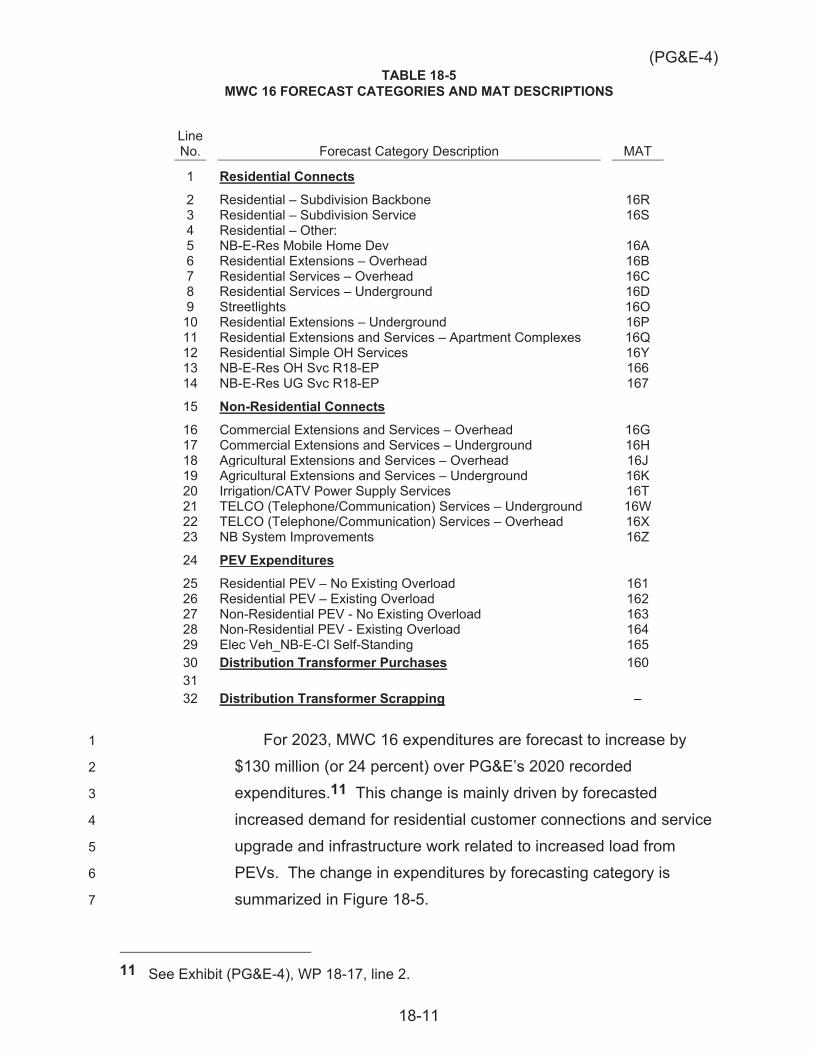
(PG&E-4)
18-11
TABLE 18-5 MWC 16 FORECAST CATEGORIES AND MAT DESCRIPTIONS
Line No. Forecast Category Description MAT
1 Residential Connects
2 Residential – Subdivision Backbone 16R 3 Residential – Subdivision Service 16S 4 Residential – Other: 5 NB-E-Res Mobile Home Dev 16A 6 Residential Extensions – Overhead 16B 7 Residential Services – Overhead 16C 8 Residential Services – Underground 16D 9 Streetlights 16O 10 Residential Extensions – Underground 16P 11 Residential Extensions and Services – Apartment Complexes 16Q 12 Residential Simple OH Services 16Y 13 NB-E-Res OH Svc R18-EP 166 14 NB-E-Res UG Svc R18-EP 167
15 Non-Residential Connects
16 Commercial Extensions and Services – Overhead 16G 17 Commercial Extensions and Services – Underground 16H 18 Agricultural Extensions and Services – Overhead 16J 19 Agricultural Extensions and Services – Underground 16K 20 Irrigation/CATV Power Supply Services 16T 21 TELCO (Telephone/Communication) Services – Underground 16W 22 TELCO (Telephone/Communication) Services – Overhead 16X 23 NB System Improvements 16Z
24 PEV Expenditures
25 Residential PEV – No Existing Overload 161 26 Residential PEV – Existing Overload 162 27 Non-Residential PEV - No Existing Overload 163 28 Non-Residential PEV - Existing Overload 164 29 Elec Veh_NB-E-CI Self-Standing 165 30 Distribution Transformer Purchases 160 31 32 Distribution Transformer Scrapping –
For 2023, MWC 16 expenditures are forecast to increase by 1
$130 million (or 24 percent) over PG&E’s 2020 recorded 2
expenditures.11 This change is mainly driven by forecasted 3
increased demand for residential customer connections and service 4
upgrade and infrastructure work related to increased load from 5
PEVs. The change in expenditures by forecasting category is 6
summarized in Figure 18-5. 7
11 See Exhibit (PG&E-4), WP 18-17, line 2.
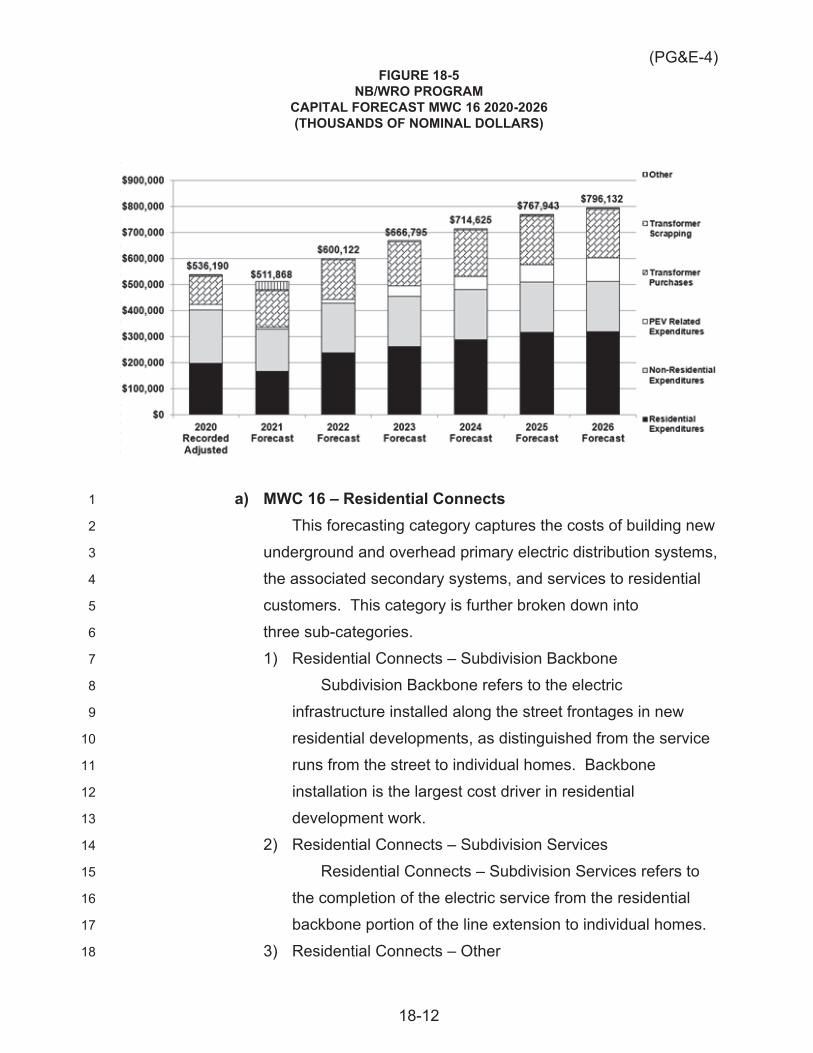
(PG&E-4)
18-12
FIGURE 18-5 NB/WRO PROGRAM
CAPITAL FORECAST MWC 16 2020-2026 (THOUSANDS OF NOMINAL DOLLARS)
a) MWC 16 – Residential Connects 1
This forecasting category captures the costs of building new 2
underground and overhead primary electric distribution systems, 3
the associated secondary systems, and services to residential 4
customers. This category is further broken down into 5
three sub-categories. 6
1) Residential Connects – Subdivision Backbone 7
Subdivision Backbone refers to the electric 8
infrastructure installed along the street frontages in new 9
residential developments, as distinguished from the service 10
runs from the street to individual homes. Backbone 11
installation is the largest cost driver in residential 12
development work. 13
2) Residential Connects – Subdivision Services 14
Residential Connects – Subdivision Services refers to 15
the completion of the electric service from the residential 16
backbone portion of the line extension to individual homes. 17
3) Residential Connects – Other 18

(PG&E-4)
18-13
The Residential Connects – Other category includes all 1
other residential line extension and service work not 2
included in the two categories above. This includes all work 3
not related to new services to a subdivision, such as line 4
extensions and service installations to individual residential 5
customers, multi-family homes, and apartment buildings. 6
b) MWC 16 – Non-Residential Connects 7
This category captures the costs of building new 8
underground and overhead primary electric distribution 9
systems, and the associated secondary systems, and services 10
to non-residential customers. PG&E forecasts non-residential 11
work in the aggregate because work varies considerably 12
between MATs from year to year and there are no statistically 13
proven economic indicators upon which to base a more 14
granular forecast. 15
c) MWC 16 – PEV 16
This work category includes all distribution transformer, 17
secondary and service upgrade work to serve increased loads 18
related to PEVs. It includes electric distribution infrastructure 19
(i.e., trenching, concrete, electrical wires) on the utility side of 20
the meter, previously funded by third party non-residential 21
customers, and EVCN Phase 2 To-the-Meter expenditures, 22
previously recovered in separate applications. It also includes 23
upgrades for existing overload conditions identified through load 24
analysis. Upgrades to PG&E’s high-voltage primary system, or 25
those resulting from voltage complaints, are funded as capacity 26
upgrades under MWC 06 (see Exhibit (PG&E-4), Chapter 17, 27
Electric Distribution Capacity). 28
d) MWC 16 – Transformer Purchases 29
PG&E purchases all the distribution transformers that are 30
installed as part of any capital project through the NB program. 31
(PG&E-4)
18-14
Transformers are revolving stock12 and the transformer forecast 1
includes not only transformers installed in NB projects but also 2
transformers used to replace transformers that fail in the field, 3
transformers used in relocation work, and transformers used as 4
part of conversion of overhead to underground facilities. 5
e) MWC 16 – Transformer Scrapping 6
Final scrapping, or retirement of distribution transformer 7
units, is also captured in the NB Program.13 8
2) MWC 10 – Electric WRO 9
MWC 10 covers capital expenditures for relocating electric 10
distribution and service facilities at the request of a government 11
agency or other third party (e.g., private parties and developers), 12
and for the conversion of overhead electric facilities to underground 13
covered by Electric Rules 20B and 20C. These third-party requests 14
often depend on funding available to governmental agencies for 15
road widening or other infrastructure improvements, where franchise 16
and master agreements provide the method of cost sharing between 17
PG&E and the customer. 18
As with NB work, the cost of WRO work can be shared between 19
PG&E and the customer requesting the work. The degree to which 20
costs are shared for a given project is driven by the electric tariff 21
(Electric Rules 15 and 16), franchise and master agreements, the 22
party requesting the work, the location of the existing facilities, and 23
the land rights applicable to those facilities. All calculations and 24
forecasts presented here represent costs net of customer 25
contributions or reimbursements. 26
PG&E’s WRO capital expenditures forecast reflects its share of 27
costs related to: (a) non-reimbursed; (b) partially reimbursed; and 28
12 Revolving stock refers to a unit of plant that is capitalized upon purchase rather than
installation. This is done to prevent multiple capitalizations of equipment that includes both newly purchased units and refurbished units.
13 Any salvage value received from scrapped transformers settles to Accumulated Depreciation.
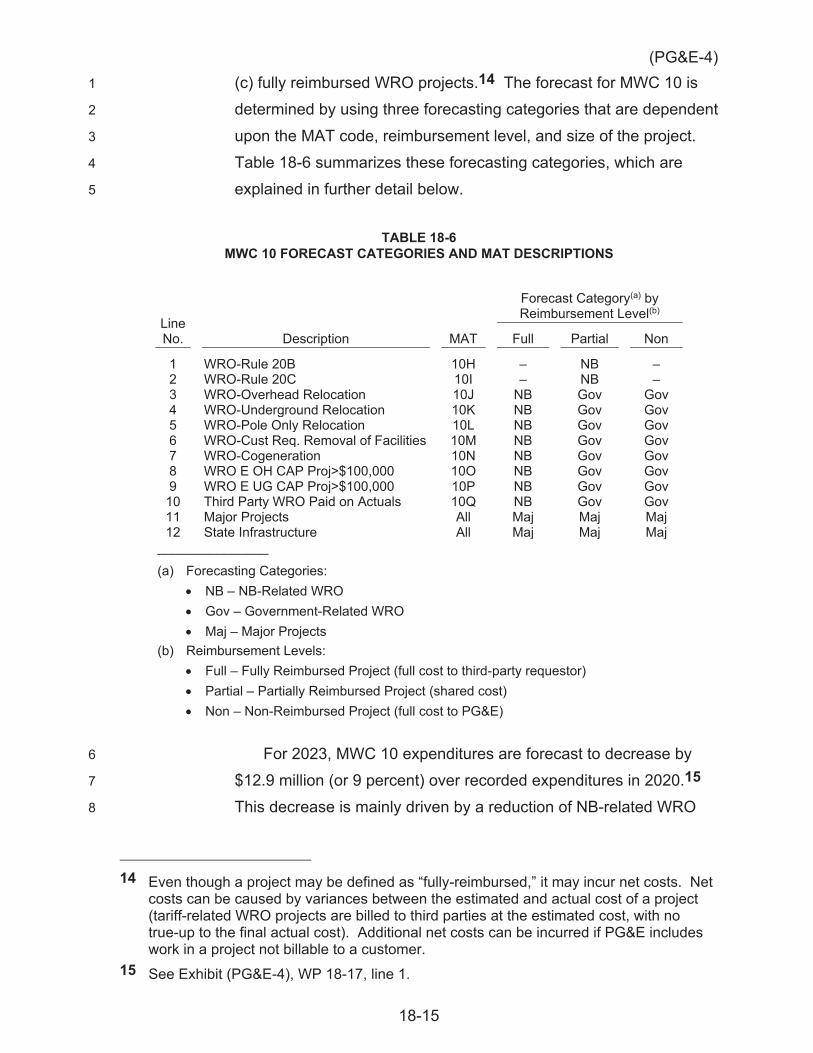
(PG&E-4)
18-15
(c) fully reimbursed WRO projects.14 The forecast for MWC 10 is 1
determined by using three forecasting categories that are dependent 2
upon the MAT code, reimbursement level, and size of the project. 3
Table 18-6 summarizes these forecasting categories, which are 4
explained in further detail below. 5
TABLE 18-6 MWC 10 FORECAST CATEGORIES AND MAT DESCRIPTIONS
Line No. Description MAT
Forecast Category(a) by Reimbursement Level(b)
Full Partial Non
1 WRO-Rule 20B 10H – NB – 2 WRO-Rule 20C 10I – NB – 3 WRO-Overhead Relocation 10J NB Gov Gov 4 WRO-Underground Relocation 10K NB Gov Gov 5 WRO-Pole Only Relocation 10L NB Gov Gov 6 WRO-Cust Req. Removal of Facilities 10M NB Gov Gov 7 WRO-Cogeneration 10N NB Gov Gov 8 WRO E OH CAP Proj>$100,000 10O NB Gov Gov 9 WRO E UG CAP Proj>$100,000 10P NB Gov Gov 10 Third Party WRO Paid on Actuals 10Q NB Gov Gov 11 Major Projects All Maj Maj Maj 12 State Infrastructure All Maj Maj Maj
_______________
(a) Forecasting Categories: NB – NB-Related WRO Gov – Government-Related WRO Maj – Major Projects
(b) Reimbursement Levels: Full – Fully Reimbursed Project (full cost to third-party requestor) Partial – Partially Reimbursed Project (shared cost) Non – Non-Reimbursed Project (full cost to PG&E)
For 2023, MWC 10 expenditures are forecast to decrease by 6
$12.9 million (or 9 percent) over recorded expenditures in 2020.15 7
This decrease is mainly driven by a reduction of NB-related WRO 8
14 Even though a project may be defined as “fully-reimbursed,” it may incur net costs. Net
costs can be caused by variances between the estimated and actual cost of a project (tariff-related WRO projects are billed to third parties at the estimated cost, with no true-up to the final actual cost). Additional net costs can be incurred if PG&E includes work in a project not billable to a customer.
15 See Exhibit (PG&E-4), WP 18-17, line 1.
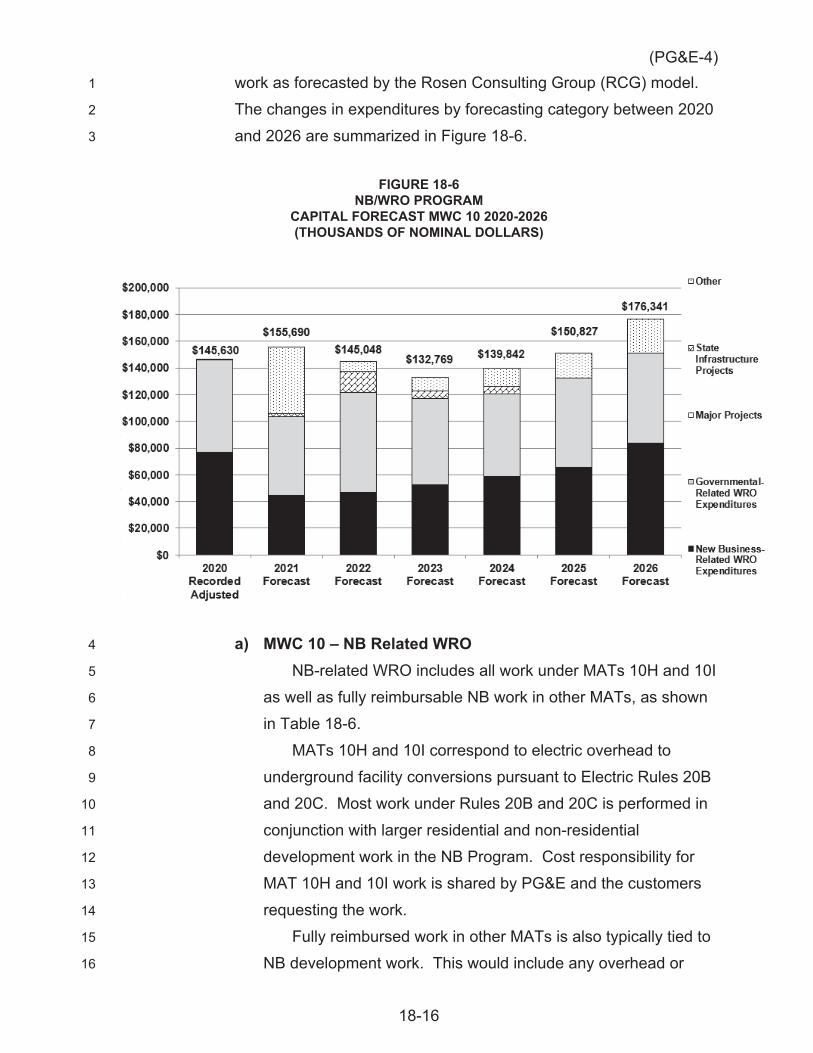
(PG&E-4)
18-16
work as forecasted by the Rosen Consulting Group (RCG) model. 1
The changes in expenditures by forecasting category between 2020 2
and 2026 are summarized in Figure 18-6. 3
FIGURE 18-6 NB/WRO PROGRAM
CAPITAL FORECAST MWC 10 2020-2026 (THOUSANDS OF NOMINAL DOLLARS)
a) MWC 10 – NB Related WRO 4
NB-related WRO includes all work under MATs 10H and 10I 5
as well as fully reimbursable NB work in other MATs, as shown 6
in Table 18-6. 7
MATs 10H and 10I correspond to electric overhead to 8
underground facility conversions pursuant to Electric Rules 20B 9
and 20C. Most work under Rules 20B and 20C is performed in 10
conjunction with larger residential and non-residential 11
development work in the NB Program. Cost responsibility for 12
MAT 10H and 10I work is shared by PG&E and the customers 13
requesting the work. 14
Fully reimbursed work in other MATs is also typically tied to 15
NB development work. This would include any overhead or 16
(PG&E-4)
18-17
underground relocations where PG&E’s facilities are in an 1
easement or right of way, and projects where PG&E facilities 2
are located in city or county franchise areas but the third party 3
requesting the work is not the governmental entity who is party 4
to the franchise agreement. 5
b) MWC 10 – Government-Related WRO 6
Government-related WRO includes work performed at the 7
request of a governmental entity (except undergrounding 8
covered in MATs 10H and 10I). This work is either partially 9
reimbursable or non-reimbursable. Non-reimbursed 10
government related WRO projects normally cover work where 11
PG&E’s facilities are located in a franchise controlled by the 12
requesting governmental entity. 13
c) MWC 10 – Major Projects 14
In addition to the NB and government-related WRO 15
forecast, expenditures for large projects unrelated to Caltrans 16
work historically have been forecast and recorded in MWC 10 – 17
Major Projects. PG&E recorded only $0.3 million of Major 18
Projects expenditures in 2020 and is not forecasting any 19
expenditures on these types of projects between 2021 and 20
2026. 21
d) MWC 10 – State Infrastructure Projects 22
The State Infrastructure Projects portfolio has large-scale 23
projects with schedules and scope dictated by third parties, 24
typically state and local governments. The portfolio request for 25
MWC 10 includes forecasted costs for relocation of electric 26
distribution assets for three projects: California High-Speed 27
Rail, Google, and VTA BART. These projects are discussed in 28
greater detail in Section C.2.b.4, below. 29
4. Support for Request 30
Work in the NB/WRO Program is performed at the request of PG&E’s 31
customers or governmental agencies. PG&E is required to perform this 32
work under its obligation to serve, its tariffs, and its franchise agreements 33
(PG&E-4)
18-18
with local governments. PG&E’s forecast methodology utilizes leading 1
economic indicators for its service territory. See Section C – Activities and 2
Costs, and Forecast Drivers by MWC. 3
5. Organization of the Remainder of This Chapter 4
The remainder of this chapter is organized as follows: 5
Section B – Program and Risk Overview 6
Section C – Activities and Costs, and Forecast Drivers by MWC 7
Section D – Compliance with Prior Commission Decisions 8
Section E – Cost Tables 9
B. Program and Risk Overview 10
1. Program Description 11
a. Program Overview 12
The Program Management group budgets, tracks costs for, and 13
forecasts NB/WRO expenditures. In addition, the Program Management 14
group manages the NB/WRO Program by: 15
Allocating budgets on an annual basis to PG&E’s 19 divisions to 16
perform NB/WRO work. 17
Monitoring the volume of work by forecasting category using MAT 18
codes in PG&E’s SAP system to analyze trends and changes in 19
NB/WRO work distribution. 20
Tracking unit cost performance by forecasting category using MAT 21
codes for NB/WRO capital and expense categories. 22
Identifying and communicating best practices from individual 23
divisions and other programs to enhance efficiency system wide and 24
to improve customer satisfaction. 25
b. Management Structure 26
PG&E manages its NB Program through the Work Planning, 27
Program Management and Performance organization located within the 28
Electric Distribution Operations line of business (LOB); PG&E manages 29
its WRO Program through the Electric Core Programs organization 30
located within the Major Projects and Programs LOB. While the 31
NB/WRO Program Managers provide direct program support for 32
NB/WRO activities, they also work closely with the Service Planning and 33
(PG&E-4)
18-19
Design organization (within Distribution Operations) that provides 1
design, estimating and technical support functions for all distribution 2
programs within Gas and Electric Operations. Service Planning and 3
Design has a strong customer focus that drives performance of many of 4
the metrics, initiatives, and strategies discussed in the next sections. 5
The NB Program also works closely with the Clean Energy 6
Transportation department to evaluate, forecast and support 7
PEV-related NB upgrades and planning. 8
c. Key Metrics and Other Performance Measures 9
PG&E uses a customer survey as a key indicator to measure 10
performance and customer satisfaction. A Project Satisfaction Survey is 11
sent out at three key stages for all NB Projects. The three stages of the 12
project that triggers the deployment of a survey are Application 13
Submittal Phase, Design Completion Phase, and Construction 14
Completion Phase. All survey questions center around communication, 15
timely scheduling and execution of the project, and quality of service. 16
All Project Satisfaction Survey results are measured on a monthly and 17
year over year basis and serve as the driver for key initiatives and 18
process improvement efforts based on the results. 19
2. Risk Integration 20
Risk controls and mitigations are aligned to various MWCs and MATs in 21
Electric Distribution. None of the MWCs presented in this chapter 22
correspond to a risk mitigation or risk control that address a risk on Electric 23
Operations’ Corporate Risk Register. More information about risk 24
mitigations and controls is in PG&E’s Electric Distribution Risk Management 25
testimony (Exhibit (PG&E-4), Chapter 3). 26
C. Activities, Costs, and Forecast Drivers by MWC 27
1. Expense 28
a. MWC EV – NB Services Inquiry 29
1) MWC EVA – NB Service Inquiry 30
NB service inquiry expenditures (MAT EVA) are driven by the 31
total number of customer service applications and are not 32
(PG&E-4)
18-20
significantly impacted by the type of application (residential or 1
non-residential). The average ratio of connects to applications 2
remains fairly constant from year-to-year; therefore, the 3
forecast percent change in total connects (contained in the capital 4
NB forecast) is a good gauge of the expected change in total service 5
applications received. PG&E’s total forecast for service applications 6
is calculated using the total forecast for gas and electric connects 7
divided by the average ratio of connects to applications over the 8
past three years, including the addition of PEV-related connects now 9
required by AB 841 to be included in the GRC instead of in separate 10
applications.16 11
The forecast for MAT EVA, based on the methodology 12
described above, is shown in Table 18-7. 13
TABLE 18-7 MWC EV/MAT EVA – NB SERVICE INQUIRY FORECAST
(THOUSANDS OF NOMINAL DOLLARS)
Line No. Line Description
2020 Recorded
2021 Forecast
2022 Forecast
2023 Forecast WP Reference
1 MAT EVA – Service Inquiry Expenditure/Forecast
$2,975 $3,811 $3,435 $4,990 WP 18-6, line 1
The main driver of the 2023 forecast increase is a higher 14
volume of applications and cost escalation.17 15
2) MAT EVB – OK to Serve Routine 16
MAT EVB – OK to Serve Routine is driven by existing 17
customers either adding load or upgrading their service facilities 18
(e.g., an electric service panel), where that work does not result in 19
any capital work by PG&E, or work that can be billed to a customer 20
under PG&E’s tariffs. The forecast for MAT EVB – OK to Serve 21
Routine is indexed to the average annual percent change in PG&E’s 22
electric customer base.18 The small increase shown in the table 23
16 See Exhibit (PG&E-4), WP 18-7, line 6. 17 See Exhibit (PG&E-4), WP 18-7, line 10. 18 See Exhibit (PG&E-4), WP 18-8, line 2.
(PG&E-4)
18-21
below is driven by a combination of an expected increase in the 1
number of electric customers and escalation. 2
Table 18-8 summarizes the MAT EVB expense forecast for 3
routine requests. 4
TABLE 18-8 MWC EV/MAT EVB – OK TO SERVE ROUTINE
(THOUSANDS OF NOMINAL DOLLARS)
Line No. Line Description
2020 Recorded
2021 Forecast
2022 Forecast
2023 Forecast WP Reference
1 EVB OK to Serve – Routine Expenditure/Forecast
$9,363 $6,871 $6,733 $7,999 WP 18-6, line 2
Affordability initiatives are forecasted to reduce costs by 5
$1.4 million (or 14 percent) in the 2023 forecast when compared to 6
PG&E’s 2020 recorded expenses.19 7
3) MAT EVB – OK to Serve PEV 8
In addition to the routine MAT EVB OK to Serve Routine work 9
described above, PG&E forecasts an increase in customer load 10
check activities driven by customer PEV purchases. For the 11
purposes of this forecast, PG&E used a projection of expected PEV 12
sales in PG&E’s service territory provided by PG&E’s Clean Energy 13
Transportation Department.20 This PEV sales volume is then 14
adjusted by the percentage of customers expected to be placed on 15
PG&E’s residential or non-residential EV service rate schedules21 16
to estimate the number of customers likely to contact PG&E after 17
purchasing a PEV. The forecast’s higher demand for 18
non-residential EV customers load analysis is driven by AB 841 19
19 See Exhibit (PG&E-4), WP 18-8, line 6. 20 After the MAT EVB forecast was finalized, PG&E concluded that it would be more
appropriate to base its assumptions about PEV deployment on internal modelling and data which has been shared with the Commission. PG&E will file errata updating the assumptions and recalculating its forecast as necessary.
21 Electric Schedule E-9: Experimental Residential Time-of-Use Service for Low Emission Vehicle Customers.

(PG&E-4)
18-22
PEV-related expenditures under MAT EVB summarized in 1
Table 18-9. 2
TABLE 18-9 MWC EV/MAT EVB – OK TO SERVE PEV (THOUSANDS OF NOMINAL DOLLARS)
Line No. Line Description
2020 Recorded
2021 Forecast
2022 Forecast
2023 Forecast WP Reference
1 EVB OK to Serve PEV Expenditure/Forecast
$40 $1,405 $726 $889 WP 18-6, line 3
The primary driver for the increase in the forecast is the 3
projected growth in the number of PEVs in PG&E’s service territory. 4
PEV ownership and deployment is expected to grow based on State 5
transportation electrification and clean energy goals and mandates 6
on sales targets, including Governor Newsom’s executive order 7
requiring the phase-out of non-EV vehicle sales by 2035.22 This will 8
result in an increase of owners using an EV rate, and a 9
corresponding increase in EVB OK to Serve PEV spend overall. 10
4) MWC EV – NB Service Inquiry Forecast Summary 11
Table 18-10 shows a summary of the forecast for MWC EV as a 12
sum of major components of the programs. This includes a 13
breakout by MATs EVA and EVB. 14
22 See Exhibit (PG&E-4), WP 18-9, Assumptions and Details, fn.3. [mm] Governor’s Exec.
Order No. N-79-20 (Sept. 23, 2020), at <https://www.gov.ca.gov/wp-content/uploads/2020/09/9.23.20-EO-N-79-20-Climate.pdf.> Accessed May 23, 2021.
(PG&E-4)
18-23
TABLE 18-10 MWC EV SUMMARY OF EXPENSE FORECAST
(THOUSANDS OF NOMINAL DOLLARS)
Line No. Description
2020 Recorded
2021 Forecast
2022 Forecast
2023 Forecast
WP Reference
1 MAT EVA – Service Inquiry $2,975 $3,811 $3,435 $4,990 WP 18-6, line 1 2 MAT EVB – OK to Serve Routine 9,363 6,871 6,733 7,999 WP 18-6, line 2 3 MAT EVB – OK to Serve PEV 40 1,405 726 889 WP 18-6, line 3 4 Other 608 WP 18-6, line 4 5 Aligned to 2021 Budget (1,208) WP 18-6, line 6
6 Total $12,986 $10,879 $10,894 $13,878
b. MWC EW – Expense WRO 1
1) Relocations 2
MWC EW Relocations includes a wide variety of work in various 3
MATs including: non-plant-related relocations of electric facilities; 4
temporary electric services provided to customers during the 5
construction of their projects; and Land Department right-of-way 6
record research requested by third parties that cannot be charged to 7
a specific project. The forecast for relocation-related expenditures 8
in MWC EW is indexed to capital WRO expenditures (MWC 10) for 9
the same period. 10
Table 18-11 shows a summary of the forecast for MWC EW. 11
TABLE 18-11 MWC EW – EXPENSE RELOCATIONS FORECAST
(THOUSANDS OF NOMINAL DOLLARS)
Line No. Line Description
2020 Recorded
2021 Forecast
2022 Forecast
2023 Forecast
WP Reference
1 EW – Expense Relocations Expenditure/Forecast
$13,878 $14,550 $12,242 $12,056 WP 18-13, line 1
The main driver of the decrease between 2020 and 2023 is 12
corresponding forecast decrease in MWC 10 (WRO Capital) spend, 13
because the expense relocation forecast is indexed to the WRO 14
(PG&E-4)
18-24
Capital forecast, specifically the portion of WRO forecast that is 1
decreasing based on the RCG economic forecast model.23 2
2) Electric Grid Interconnection 3
PG&E’s EGI Department manages the electric interconnection 4
process for CPUC and FERC jurisdictional customer generation 5
projects connected at PG&E’s distribution service level. 6
Interconnection customers pay various fees to PG&E for 7
these services. 8
PG&E had $2.4 million in recorded costs for this program in 9
2020 but, based on current assumptions, PG&E anticipates that 10
application fees will offset PG&E’s expenses for providing services 11
in the 2021-2023 period and PG&E is not including a forecast for 12
this program in the 2023 GRC. 13
A summary of EGI-related MWC EW expenditures is shown in 14
Table 18-12. 15
TABLE 18-12 MWC EW – EGI FORECAST
Line No.
Line Description
2020 Recorded
2021 Forecast
2022 Forecast
2023 Forecast
WP Reference
1 EW – EGI Expenditure/Forecast $2,353 – – – WP 18-13, line 2
3) MWC EW Electric WRO Expense Forecast Summary 16
Table 18-13 shows a summary of the forecast for MWC EW as 17
a sum of the major components of the program: Relocation and 18
EGI. PG&E is also forecasting $0.1 million per year in 2022 and 19
2023 for expense work in support of Electric WRO – State 20
Infrastructure Projects capital work, which is recorded in MWC 10 21
and discussed in Section C.2.b.4 below. 22
23 See Exhibit (PG&E-4), WP 18-33.
(PG&E-4)
18-25
TABLE 18-13 MWC EW – SUMMARY
(THOUSANDS OF NOMINAL DOLLARS)
Line No. Description
2020 Recorded
2021 Forecast
2022 Forecast
2023 Forecast
WP Reference
1 EW – Expense Relocations $13,878 $14,550 $12,242 $12,056 WP 18-13, line 1 2 EW – EGI 2,353 – – – WP 18-13, line 2 3 EW – State Infrastructure – 177 177 177 WP 18-13, line 3 4 Other (709) WP 18-13, line 4 5 Forecasting & Escalation Adjustments (6,620) (4,300) (1,950) WP 18-13, line 5
6 Total $15,521 $8,106 $8,118 $10,283 WP 18-13, line 6
2. Capital MWCs 1
a. MWC 16 – Electric NB 2
1) MWC 16 – Residential Connects 3
PG&E forecasts electric NB residential connect expenditures by 4
multiplying the projected volume of work (measured by forecasting 5
new connects to PG&E’s distribution system) and the corresponding 6
unit cost. 7
As in the 2017 and 2020 GRCs, the new connects forecast was 8
developed using a proprietary econometric model developed by 9
RCG, a leading independent real estate economics consulting firm 10
that specializes in California and Bay Area markets. The RCG 11
model analyzes PG&E historic NB connects data in relation to 12
historic leading economic indicator data.24 13
RCG used a multiple linear regression technique to construct a 14
forecast of NB connects. Separate forecasts were made for 15
two connect types: residential and non-residential. The 16
four relevant indicator variables used in the forecasting models 17
were: payroll employment growth; unemployment insurance initial 18
claims; residential permits (units); and non-residential permits, 19
excluding alterations (valuation). 20
PG&E further breaks down residential connects into three 21
subcategories: Subdivision Backbone, Subdivision Services, and 22
24 See Exhibit (PG&E-4), WP 18-29.
(PG&E-4)
18-26
Other Residential. These subcategories have different unit costs. 1
The relative volume of work between these three subcategories is 2
expected to vary during the forecast period. PG&E forecast 3
volumes of work in each of the three residential subcategories 4
based on a 3-year (2018-2020) average of the historical ratios 5
between those categories. 6
Unit costs are based on historical 3-year (2018-2020) averages, 7
adjusted to nominal 2020 dollars.25 The increase in the forecast 8
period related to residential spend is mainly driven by escalation. 9
Table 18-14 shows a summary of the forecast units, unit costs, 10
and expenditures by sub-category for residential connects.26 11
25 See Exhibit (PG&E-4), WP 18-28. 26 See Exhibit (PG&E-4), WP 18-26, for additional detail.
18-27
(PG&E-4) TA
BLE
18-
14
MW
C 1
6 –
RES
IDEN
TIA
L C
ON
NEC
TS
UN
IT, U
NIT
CO
ST A
ND
EXP
END
ITU
RES
FO
REC
AST
Li
ne
No.
Li
ne D
escr
iptio
n 20
20
Rec
orde
d 20
21
Fore
cast
20
22
Fore
cast
20
23
Fore
cast
20
24
Fore
cast
20
25
Fore
cast
20
26
Fore
cast
W
P R
efer
ence
1 U
nits
(Con
nect
s)
2 R
esid
entia
l – S
ubdi
visi
on
Back
bone
12
,852
11
,546
16
,330
17
,778
19
,492
21
,167
21
,173
W
P 18
-26,
line
1
3 R
esid
entia
l – S
ubdi
visi
on
Serv
ices
12,8
52
11,5
46
16,3
30
17,7
78
19,4
92
21,1
67
21,1
73
WP
18-2
6, li
ne 4
4 R
esid
entia
l – O
ther
28
,669
25
,757
36
,426
39
,656
43
,481
47
,217
47
,230
W
P 18
-26,
line
7
5 U
nit C
osts
6 R
esid
entia
l – S
ubdi
visi
on
Back
bone
$3
,052
$2
,714
$2
,787
$2
,862
$2
,939
$3
,018
$3
,099
W
P 18
-26,
line
2
7 R
esid
entia
l – S
ubdi
visi
on
Serv
ices
1,
119
1,06
7 1,
096
1,12
6 1,
156
1,18
7 1,
219
WP
18-2
6, li
ne 5
8 R
esid
entia
l – O
ther
$5
,020
$4
,808
$4
,808
$4
,808
$4
,808
$4
,808
$4
,808
W
P 18
-26,
line
8
9 Ex
pend
iture
/For
ecas
t (T
hous
ands
of
Nom
inal
Dol
lars
)
10
Res
iden
tial –
Su
bdiv
isio
n Ba
ckbo
ne
$39,
221
$31,
335
$45,
511
$50,
881
$57,
287
$63,
882
$65,
615
WP
18-2
6, li
ne 3
11
Res
iden
tial –
Sub
divi
sion
Se
rvic
es
$14,
377
$12,
320
$17,
898
$20,
018
$22,
533
$25,
125
$25,
810
WP
18-2
6, li
ne 6
12
Res
iden
tial –
Oth
er
$143
,915
$1
23,8
40
$175
,136
$1
90,6
66
$209
,057
$2
27,0
19
$227
,082
W
P 18
-26,
line
9
13
Tota
l – R
esid
entia
l $1
97,5
13
$167
,495
$2
38,5
45
$261
,565
$2
88,8
77
$316
,026
$3
18,5
07
WP
18-2
6, li
ne 1
4
(PG&E-4)
18-28
2) MWC 16 – Non-Residential Connects 1
PG&E’s forecast for non-residential connects follows the same 2
process as the forecast for residential connects except that 3
subcategories are not used. The forecast number of connects is 4
based on the RCG model. Unit costs are based on historical 3-year 5
averages (2018-2020), adjusted to nominal 2020 dollars. The 6
increase in spend is driven mainly by escalation, not by an increase 7
in units. 8
Table 18-15 shows a summary of the forecast units, nominal 9
unit costs, and expenditures for non-residential connects. 10
18-29
(PG&E-4) TA
BLE
18-
15
MW
C 1
6 –
NO
N-R
ESID
ENTI
AL
CO
NNEC
TS U
NIT
, U
NIT
CO
ST A
ND
EXP
END
ITU
RES
FO
REC
AST
Line
N
o.
Line
D
escr
iptio
n 20
20
Rec
orde
d 20
21
Fore
cast
20
22
Fore
cast
20
23
Fore
cast
20
24
Fore
cast
20
25
Fore
cast
20
26
Fore
cast
W
P R
efer
ence
1 N
on-re
side
ntia
l Con
nect
s 8,
456
7,02
5 8,
278
8,34
3 8,
363
8,35
1 8,
357
WP
18-2
6, li
ne 1
1 2
Non
-resi
dent
ial U
nit C
ost
$24,
404
$23,
115
$23,
115
$23,
115
$23,
115
$23,
115
$23,
115
WP
18-2
6, li
ne 1
2
3 N
on-re
side
ntia
l Con
nect
s Ex
pend
iture
/For
ecas
t (Th
ousa
nds
of N
omin
al D
olla
rs)
$206
,357
$1
62,3
83
$191
,346
$1
92,8
48
$193
,311
$1
93,0
33
$193
,172
W
P 18
-26,
line
13

(PG&E-4)
18-30
3) MWC 16 – PEV 1
PG&E’s forecast for capital improvements related to PEVs in 2
MWC 16 is like the forecast under MWC EV for PEV load checks. 3
PEV capital improvements can be caused directly by new PEV load 4
or may be made in response to a PEV-related load check that finds 5
an existing overload situation on PG&E’s service and distribution 6
facilities. PG&E forecasts the number of customers that will engage 7
with PG&E regarding their PEV service based on projections of: 8
(1) expected PEV sales in PG&E’s service territory27; (2) the 9
number of PEV owners that will be placed on PG&E’s residential or 10
non-residential EV rates provided by PG&E’s Clean Transportation 11
Department; and (3) projections of the expected PEV sales and 12
upgrade customer requests in PG&E’s service territory. The 13
forecast now includes the cost of electric distribution infrastructure 14
(i.e., trenching, concrete, electrical wires) on the utility side of the 15
meter, previously funded by third party non-residential customers, 16
and EVCN Phase 2 To-the-Meter expenditures, previously 17
recovered in separate applications. PG&E then calculates a 18
forecast upgrade reinforcement rate based on the 3-year historical 19
(2018-2020) average of PEV service upgrades initiated per number 20
of customers on PG&E’s EV Rates. This upgrade reinforcement 21
rate, times the 3-year average cost per upgrade and AB 841 22
forecast, is then applied to the projected new PEV accounts on EV 23
rate to derive expected capital costs associated with service 24
upgrades for new PEVs in PG&E’s service territory. 25
PG&E’s forecast for PEV-related capital expenditures is shown 26
in Table 18-16. The forecast increase in capital PEV costs is due to 27
27 The forecast here is based on PEV sales data supplied by PG&E’s Clean Energy
Transportation Department which is based on California Energy Commission's 2019 Integrated Energy Policy Report. After the MWC 16 forecast was finalized, PG&E concluded that it would be more appropriate to base its assumptions about PEV deployment on internal modelling and data which has been shared with the Commission. PG&E will file errata updating the assumptions and recalculating its forecast as necessary.

(PG&E-4)
18-31
a projected increase in the number of PEVs within PG&E’s service 1
territory and escalation. 2

18-32
(PG&E-4) TA
BLE
18-
16
MW
C 1
6 –
PEV-
REL
ATE
D IM
PRO
VEM
ENTS
(T
HO
USA
ND
S O
F N
OM
INA
L D
OLL
AR
S) F
OR
ECA
ST
Line
N
o.
Line
D
escr
iptio
n 20
20
Rec
orde
d 20
21
Fore
cast
20
22
Fore
cast
20
23
Fore
cast
20
24
Fore
cast
20
25
Fore
cast
20
26
Fore
cast
W
P R
efer
ence
1 PE
V R
elat
ed U
pgra
de C
osts
$1
9,27
7 $5
,173
$1
4,04
4 $4
0,06
1 $5
0,27
3 $6
6,48
0 $9
0,01
6 W
P 18
-42,
line
24
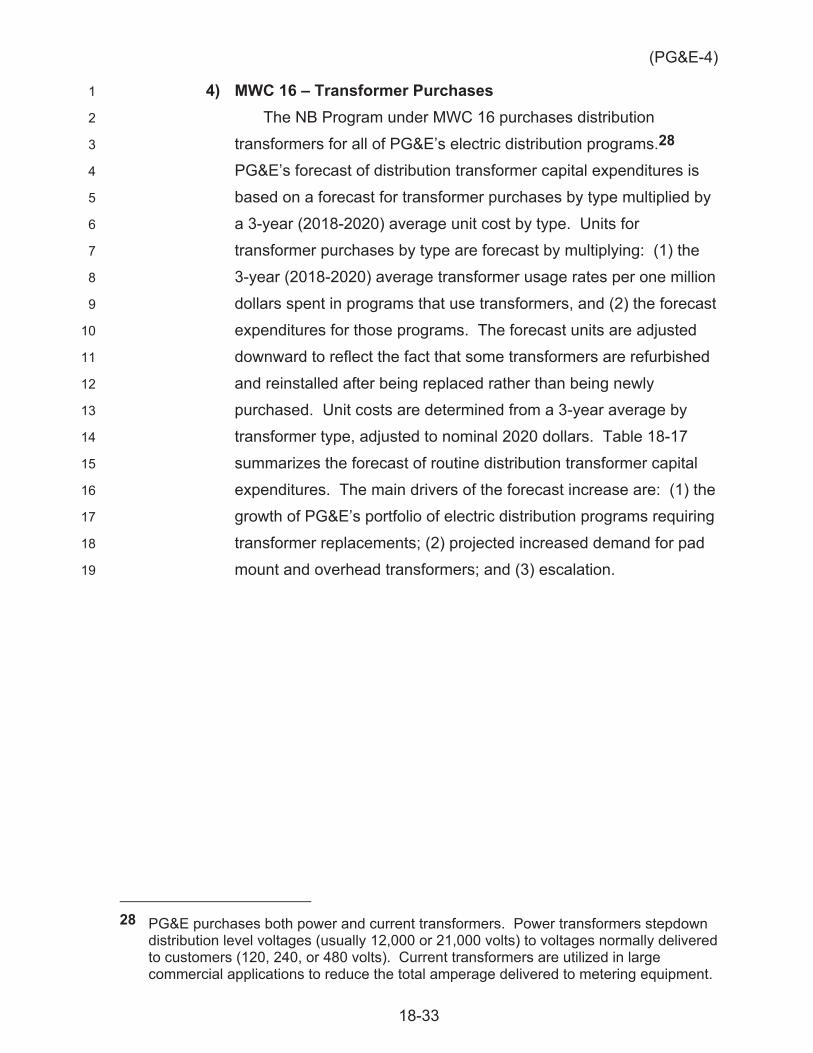
(PG&E-4)
18-33
4) MWC 16 – Transformer Purchases 1
The NB Program under MWC 16 purchases distribution 2
transformers for all of PG&E’s electric distribution programs.28 3
PG&E’s forecast of distribution transformer capital expenditures is 4
based on a forecast for transformer purchases by type multiplied by 5
a 3-year (2018-2020) average unit cost by type. Units for 6
transformer purchases by type are forecast by multiplying: (1) the 7
3-year (2018-2020) average transformer usage rates per one million 8
dollars spent in programs that use transformers, and (2) the forecast 9
expenditures for those programs. The forecast units are adjusted 10
downward to reflect the fact that some transformers are refurbished 11
and reinstalled after being replaced rather than being newly 12
purchased. Unit costs are determined from a 3-year average by 13
transformer type, adjusted to nominal 2020 dollars. Table 18-17 14
summarizes the forecast of routine distribution transformer capital 15
expenditures. The main drivers of the forecast increase are: (1) the 16
growth of PG&E’s portfolio of electric distribution programs requiring 17
transformer replacements; (2) projected increased demand for pad 18
mount and overhead transformers; and (3) escalation.19
28 PG&E purchases both power and current transformers. Power transformers stepdown
distribution level voltages (usually 12,000 or 21,000 volts) to voltages normally delivered to customers (120, 240, or 480 volts). Current transformers are utilized in large commercial applications to reduce the total amperage delivered to metering equipment.
18-34
(PG&E-4) TA
BLE
18-
17
MW
C 1
6 –
DIS
TRIB
UTI
ON
TR
AN
SFO
RM
ER P
UR
CH
ASE
S (T
HO
USA
ND
S O
F N
OM
INA
L D
OLL
AR
S)
Line
N
o.
Line
Des
crip
tion
2020
R
ecor
ded
2021
Fo
reca
st
2022
Fo
reca
st
2023
Fo
reca
st
2024
Fo
reca
st
2025
Fo
reca
st
2026
Fo
reca
st
WP
Ref
eren
ce
1 To
tal T
rans
form
er P
urch
ase
Expe
nditu
res
$107
,281
$1
41,5
70
$151
,725
$1
69,0
68
$177
,997
$1
86,7
89
$186
,981
W
P 18
-48,
line
8
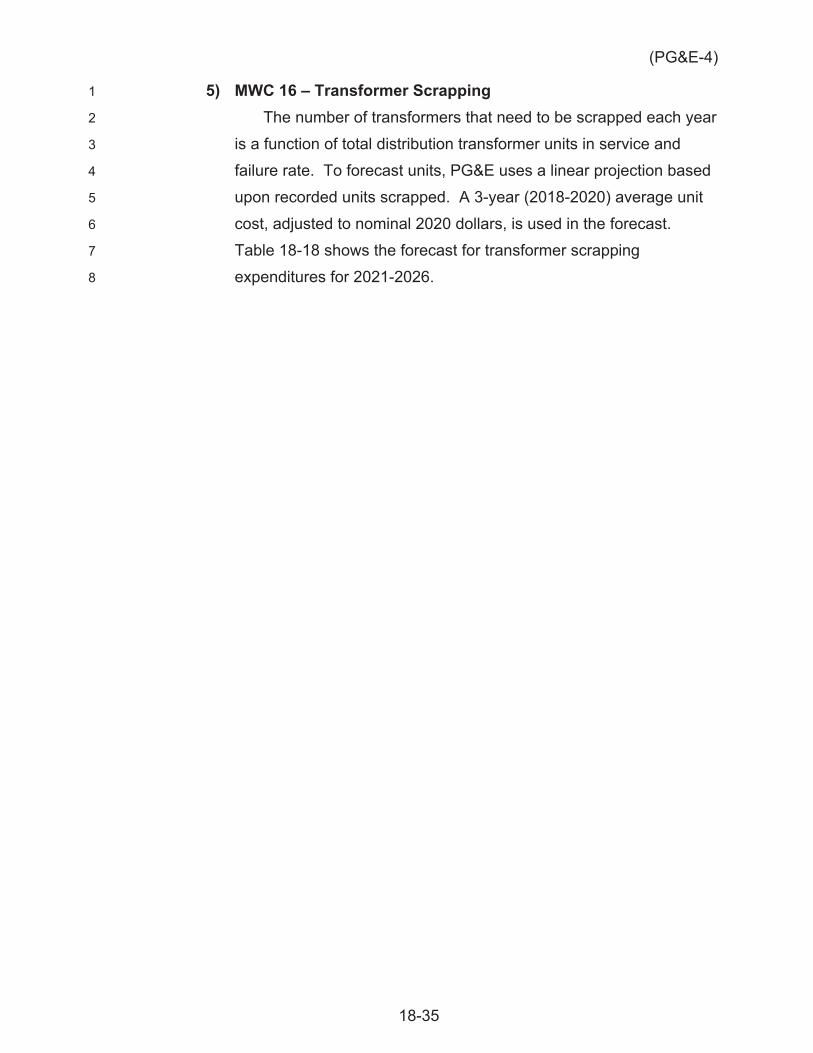
(PG&E-4)
18-35
5) MWC 16 – Transformer Scrapping 1
The number of transformers that need to be scrapped each year 2
is a function of total distribution transformer units in service and 3
failure rate. To forecast units, PG&E uses a linear projection based 4
upon recorded units scrapped. A 3-year (2018-2020) average unit 5
cost, adjusted to nominal 2020 dollars, is used in the forecast. 6
Table 18-18 shows the forecast for transformer scrapping 7
expenditures for 2021-2026.8
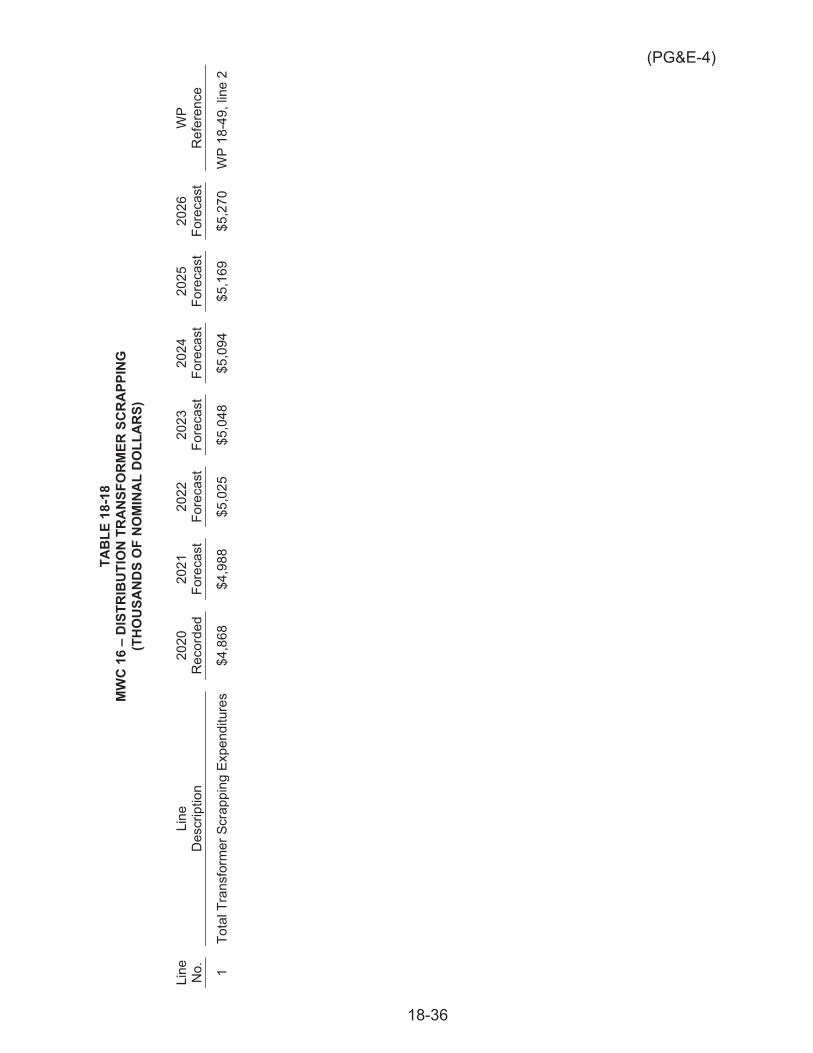
18-36
(PG&E-4)
TAB
LE 1
8-18
M
WC
16
– D
ISTR
IBU
TIO
N T
RA
NSF
OR
MER
SC
RA
PPIN
G
(TH
OU
SAN
DS
OF
NO
MIN
AL
DO
LLA
RS)
Line
N
o.
Line
D
escr
iptio
n 20
20
Rec
orde
d 20
21
Fore
cast
20
22
Fore
cast
20
23
Fore
cast
20
24
Fore
cast
20
25
Fore
cast
20
26
Fore
cast
W
P R
efer
ence
1 To
tal T
rans
form
er S
crap
ping
Exp
endi
ture
s $4
,868
$4
,988
$5
,025
$5
,048
$5
,094
$5
,169
$5
,270
W
P 18
-49,
line
2
(PG&E-4)
18-37
6) MWC 16 – Electric NB Forecast Summary 1
Table 18-19 shows a summary of the forecast for MWC 16 as a 2
sum of major forecasting categories of the program. 3
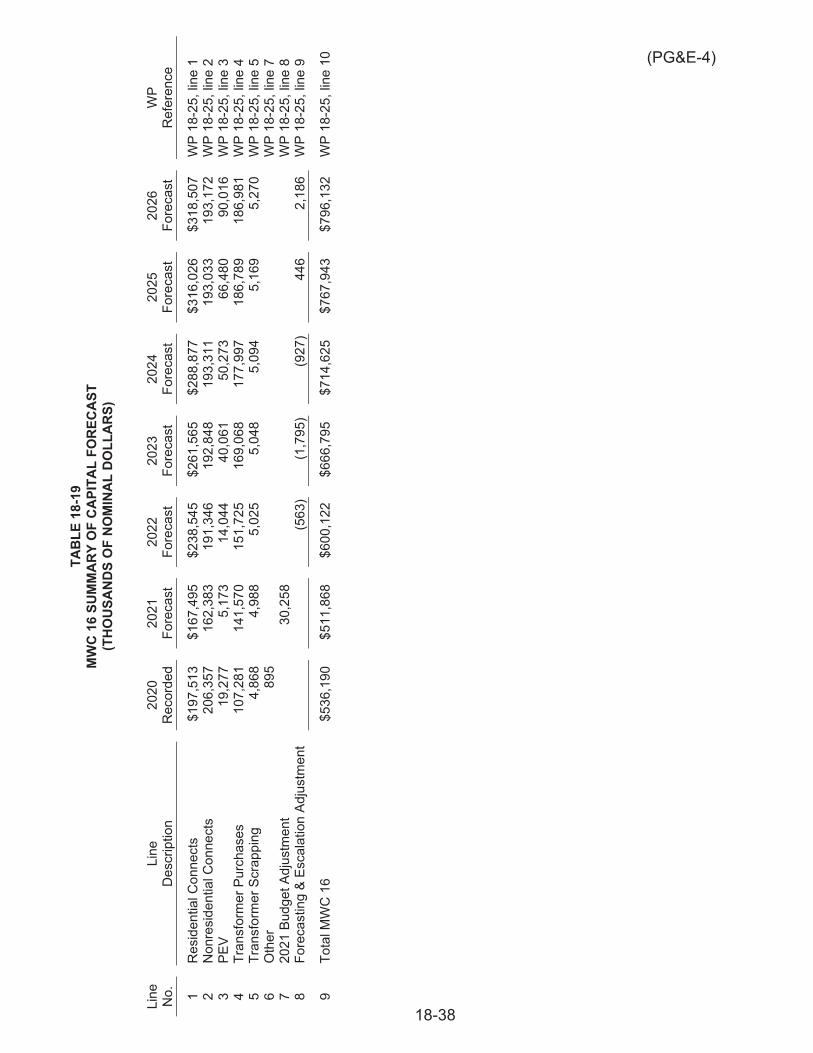
18-38
(PG&E-4) TA
BLE
18-
19
MW
C 1
6 SU
MM
AR
Y O
F C
API
TAL
FOR
ECA
ST
(TH
OU
SAN
DS
OF
NO
MIN
AL
DO
LLA
RS)
Line
N
o.
Line
D
escr
iptio
n 20
20
Rec
orde
d 20
21
Fore
cast
20
22
Fore
cast
20
23
Fore
cast
20
24
Fore
cast
20
25
Fore
cast
20
26
Fore
cast
W
P R
efer
ence
1 R
esid
entia
l Con
nect
s $1
97,5
13
$167
,495
$2
38,5
45
$261
,565
$2
88,8
77
$316
,026
$3
18,5
07
WP
18-2
5, li
ne 1
2
Non
resi
dent
ial C
onne
cts
206,
357
162,
383
191,
346
192,
848
193,
311
193,
033
193,
172
WP
18-2
5, li
ne 2
3
PEV
19,2
77
5,17
3 14
,044
40
,061
50
,273
66
,480
90
,016
W
P 18
-25,
line
3
4 Tr
ansf
orm
er P
urch
ases
10
7,28
1 14
1,57
0 15
1,72
5 16
9,06
8 17
7,99
7 18
6,78
9 18
6,98
1 W
P 18
-25,
line
4
5 Tr
ansf
orm
er S
crap
ping
4,
868
4,98
8 5,
025
5,04
8 5,
094
5,16
9 5,
270
WP
18-2
5, li
ne 5
6
Oth
er
895
WP
18-2
5, li
ne 7
7
2021
Bud
get A
djus
tmen
t
30,2
58
W
P 18
-25,
line
8
8 Fo
reca
stin
g &
Esca
latio
n Ad
just
men
t
(5
63)
(1,7
95)
(927
) 44
6 2,
186
WP
18-2
5, li
ne 9
9 To
tal M
WC
16
$536
,190
$5
11,8
68
$600
,122
$6
66,7
95
$714
,625
$7
67,9
43
$796
,132
W
P 18
-25,
line
10

(PG&E-4)
18-39
b. MWC 10 – Electric WRO 1
Capital WRO projects in MWC 10 are forecast based on three 2
categories: NB-related, Government-related, and State Infrastructure 3
projects.29 4
The forecast methodology for the NB-related and 5
Government-related WRO is based on specific economic indicators tied 6
to PG&E’s service territory as opposed to California as a whole. This 7
forecast is based a proprietary economic model developed by RCG, the 8
same economic consultants that PG&E uses to help prepare its forecast 9
for MWC 16 NB connects forecast. The RCG model analyzes PG&E 10
historic NB-related and Government-related WRO data in relation to 11
historic leading economic indicator data.30 12
1) MWC 10 – NB Related WRO 13
The forecast methodology for NB-related WRO is based on 14
RCG’s WRO model, and then adjusted to account for 15
reimbursements from customers. The RCG model, which is a 16
function of multifamily permitting, PPI inflation, and a seasonal 17
adjustment factor, uses a multiple linear regression technique to 18
construct a forecast of gross expenditures for NB-related WRO 19
work.31 However, because customers share some of the cost of 20
NB-related WRO projects, the output of the RCG model is adjusted 21
by subtracting out forecast annual reimbursements from customers, 22
based on a 3-year (2018-2020) historical average. 23
Based on the RCG model and forecast reimbursements, PG&E 24
forecasts that its 2023 capital expenditures will be $24.2 million less 25
than 2020 recorded expenditures. 26
Table 18-20 shows the forecast of NB-related WRO using this 27
methodology. 28
29 In previous GRCs, PG&E used a fourth forecasting category – Major Projects.
However, PG&E is not forecasting any expenditures in Major Projects during the 2023 GRC time period.
30 See Exhibit (PG&E-4), WP 18-56. 31 See Exhibit (PG&E-4), WP 18-56.
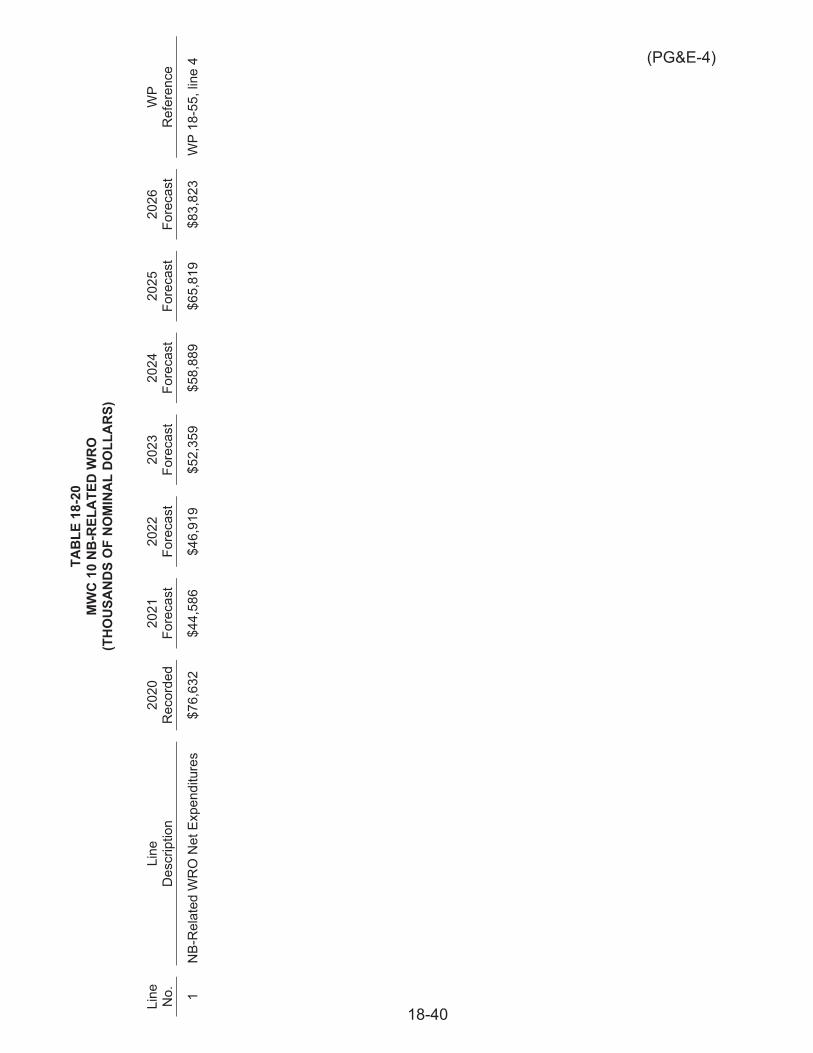
(PG&E-4)
18-40
TAB
LE 1
8-20
M
WC
10
NB
-REL
ATE
D W
RO
(T
HO
USA
ND
S O
F N
OM
INA
L D
OLL
AR
S)
Line
N
o.
Line
D
escr
iptio
n 20
20
Rec
orde
d 20
21
Fore
cast
20
22
Fore
cast
20
23
Fore
cast
20
24
Fore
cast
20
25
Fore
cast
20
26
Fore
cast
W
P R
efer
ence
1 N
B-R
elat
ed W
RO
Net
Exp
endi
ture
s $7
6,63
2 $4
4,58
6 $4
6,91
9 $5
2,35
9 $5
8,88
9 $6
5,81
9 $8
3,82
3 W
P 18
-55,
line
4
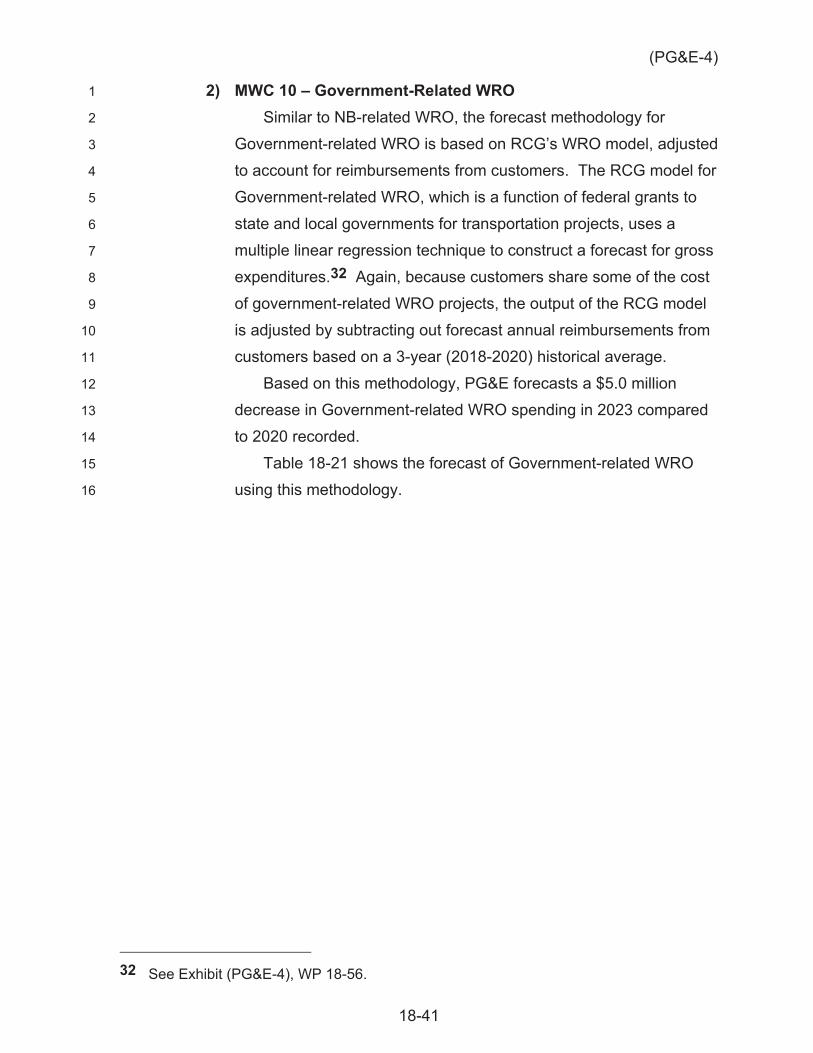
(PG&E-4)
18-41
2) MWC 10 – Government-Related WRO 1
Similar to NB-related WRO, the forecast methodology for 2
Government-related WRO is based on RCG’s WRO model, adjusted 3
to account for reimbursements from customers. The RCG model for 4
Government-related WRO, which is a function of federal grants to 5
state and local governments for transportation projects, uses a 6
multiple linear regression technique to construct a forecast for gross 7
expenditures.32 Again, because customers share some of the cost 8
of government-related WRO projects, the output of the RCG model 9
is adjusted by subtracting out forecast annual reimbursements from 10
customers based on a 3-year (2018-2020) historical average. 11
Based on this methodology, PG&E forecasts a $5.0 million 12
decrease in Government-related WRO spending in 2023 compared 13
to 2020 recorded. 14
Table 18-21 shows the forecast of Government-related WRO 15
using this methodology. 16
32 See Exhibit (PG&E-4), WP 18-56.
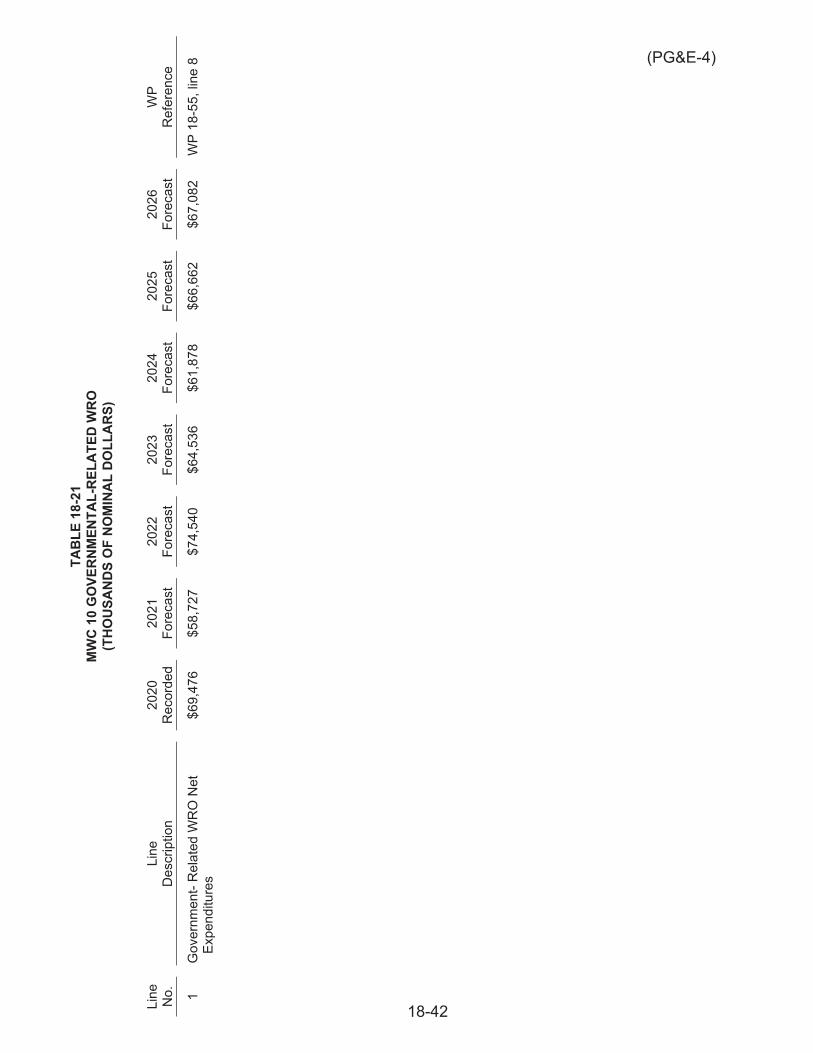
(PG&E-4)
18-42
TAB
LE 1
8-21
M
WC
10
GO
VER
NM
ENTA
L-R
ELA
TED
WR
O
(TH
OU
SAN
DS
OF
NO
MIN
AL
DO
LLA
RS)
Line
N
o.
Line
D
escr
iptio
n 20
20
Rec
orde
d 20
21
Fore
cast
20
22
Fore
cast
20
23
Fore
cast
20
24
Fore
cast
20
25
Fore
cast
20
26
Fore
cast
W
P R
efer
ence
1 G
over
nmen
t- R
elat
ed W
RO
Net
Ex
pend
iture
s $6
9,47
6 $5
8,72
7 $7
4,54
0 $6
4,53
6 $6
1,87
8 $6
6,66
2 $6
7,08
2 W
P 18
-55,
line
8
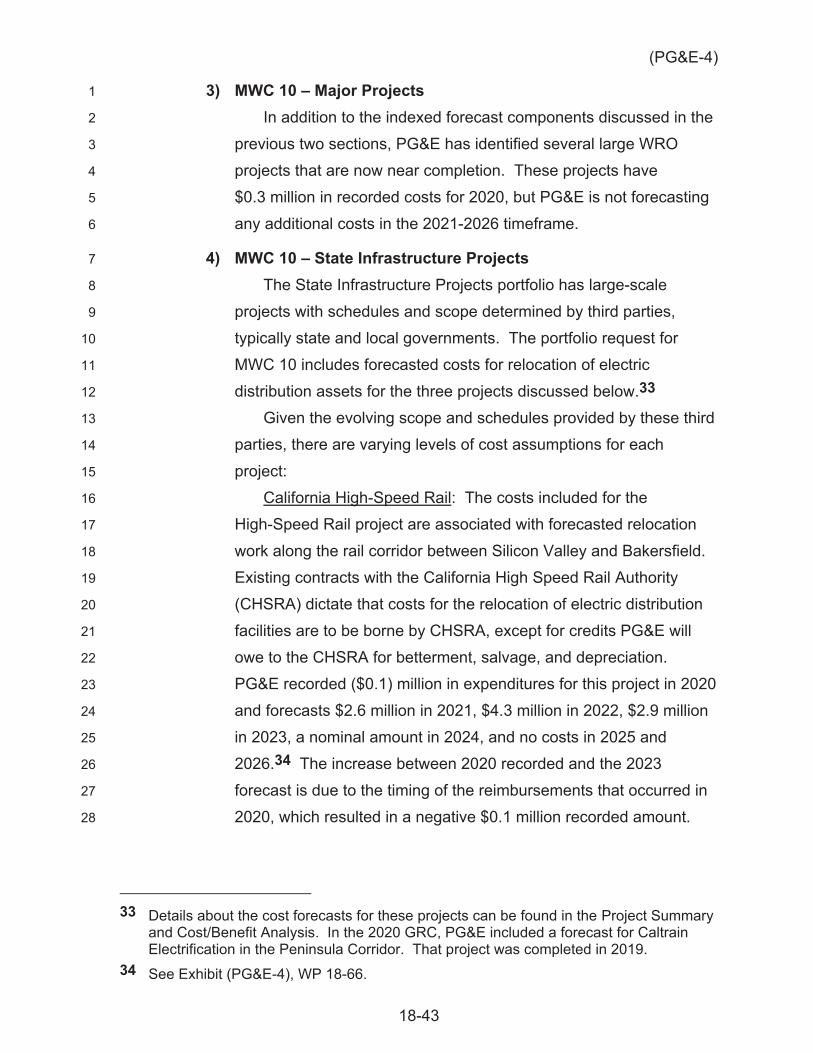
(PG&E-4)
18-43
3) MWC 10 – Major Projects 1
In addition to the indexed forecast components discussed in the 2
previous two sections, PG&E has identified several large WRO 3
projects that are now near completion. These projects have 4
$0.3 million in recorded costs for 2020, but PG&E is not forecasting 5
any additional costs in the 2021-2026 timeframe. 6
4) MWC 10 – State Infrastructure Projects 7
The State Infrastructure Projects portfolio has large-scale 8
projects with schedules and scope determined by third parties, 9
typically state and local governments. The portfolio request for 10
MWC 10 includes forecasted costs for relocation of electric 11
distribution assets for the three projects discussed below.33 12
Given the evolving scope and schedules provided by these third 13
parties, there are varying levels of cost assumptions for each 14
project: 15
California High-Speed Rail: The costs included for the 16
High-Speed Rail project are associated with forecasted relocation 17
work along the rail corridor between Silicon Valley and Bakersfield. 18
Existing contracts with the California High Speed Rail Authority 19
(CHSRA) dictate that costs for the relocation of electric distribution 20
facilities are to be borne by CHSRA, except for credits PG&E will 21
owe to the CHSRA for betterment, salvage, and depreciation. 22
PG&E recorded ($0.1) million in expenditures for this project in 2020 23
and forecasts $2.6 million in 2021, $4.3 million in 2022, $2.9 million 24
in 2023, a nominal amount in 2024, and no costs in 2025 and 25
2026.34 The increase between 2020 recorded and the 2023 26
forecast is due to the timing of the reimbursements that occurred in 27
2020, which resulted in a negative $0.1 million recorded amount. 28
33 Details about the cost forecasts for these projects can be found in the Project Summary
and Cost/Benefit Analysis. In the 2020 GRC, PG&E included a forecast for Caltrain Electrification in the Peninsula Corridor. That project was completed in 2019.
34 See Exhibit (PG&E-4), WP 18-66.
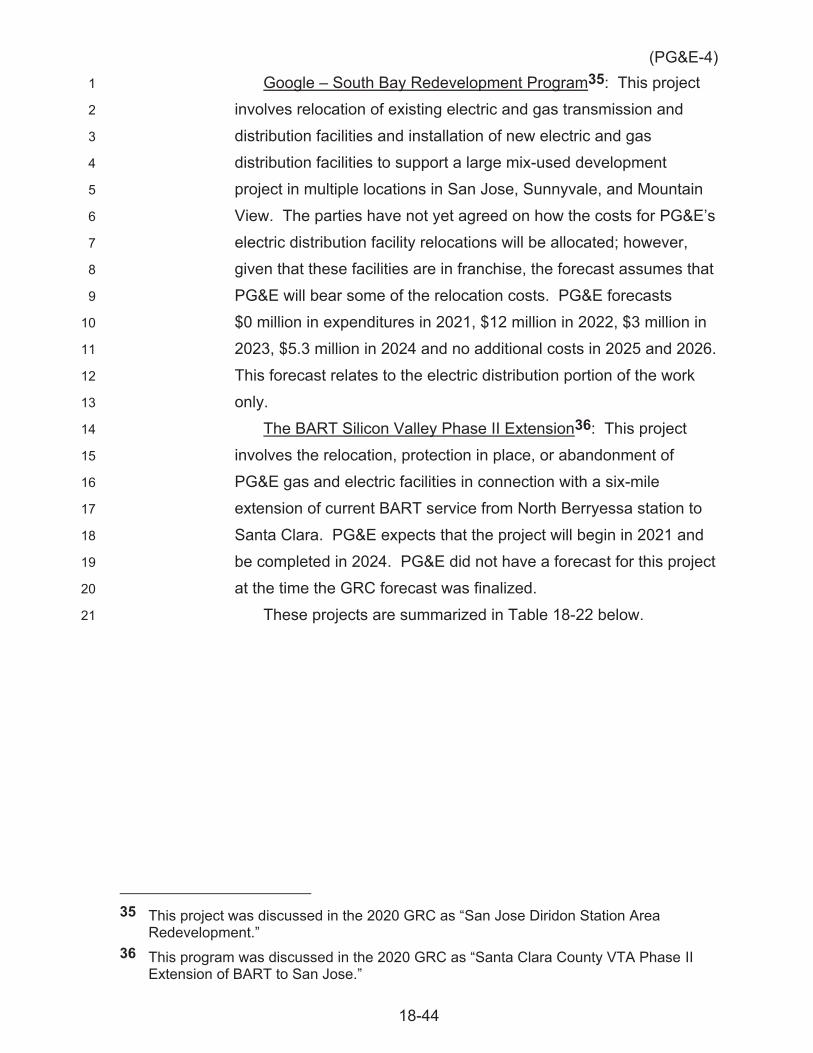
(PG&E-4)
18-44
Google – South Bay Redevelopment Program35: This project 1
involves relocation of existing electric and gas transmission and 2
distribution facilities and installation of new electric and gas 3
distribution facilities to support a large mix-used development 4
project in multiple locations in San Jose, Sunnyvale, and Mountain 5
View. The parties have not yet agreed on how the costs for PG&E’s 6
electric distribution facility relocations will be allocated; however, 7
given that these facilities are in franchise, the forecast assumes that 8
PG&E will bear some of the relocation costs. PG&E forecasts 9
$0 million in expenditures in 2021, $12 million in 2022, $3 million in 10
2023, $5.3 million in 2024 and no additional costs in 2025 and 2026. 11
This forecast relates to the electric distribution portion of the work 12
only. 13
The BART Silicon Valley Phase II Extension36: This project 14
involves the relocation, protection in place, or abandonment of 15
PG&E gas and electric facilities in connection with a six-mile 16
extension of current BART service from North Berryessa station to 17
Santa Clara. PG&E expects that the project will begin in 2021 and 18
be completed in 2024. PG&E did not have a forecast for this project 19
at the time the GRC forecast was finalized. 20
These projects are summarized in Table 18-22 below.21
35 This project was discussed in the 2020 GRC as “San Jose Diridon Station Area
Redevelopment.” 36 This program was discussed in the 2020 GRC as “Santa Clara County VTA Phase II
Extension of BART to San Jose.”
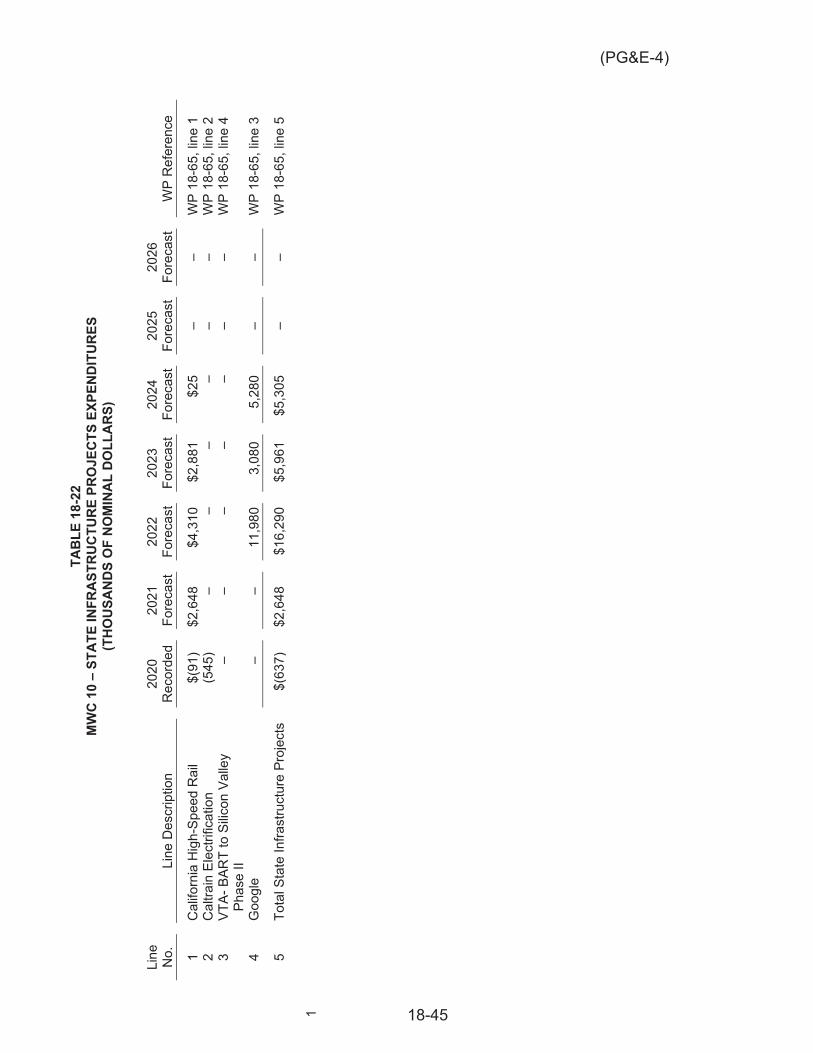
(PG&E-4)
18-45
TAB
LE 1
8-22
M
WC
10
– ST
ATE
INFR
AST
RU
CTU
RE
PRO
JECT
S EX
PEN
DIT
UR
ES
(TH
OU
SAN
DS
OF
NO
MIN
AL
DO
LLA
RS)
Line
N
o.
Line
Des
crip
tion
2020
R
ecor
ded
2021
Fo
reca
st
2022
Fo
reca
st
2023
Fo
reca
st
2024
Fo
reca
st
2025
Fo
reca
st
2026
Fo
reca
st
WP
Ref
eren
ce
1 C
alifo
rnia
Hig
h-Sp
eed
Rai
l $(
91)
$2,6
48
$4,3
10
$2,8
81
$25
– –
WP
18-6
5, li
ne 1
2
Cal
train
Ele
ctrif
icat
ion
(545
) –
– –
– –
– W
P 18
-65,
line
2
3 VT
A- B
ART
to S
ilicon
Val
ley
Phas
e II
– –
– –
– –
– W
P 18
-65,
line
4
4 G
oogl
e –
– 11
,980
3,
080
5,28
0 –
– W
P 18
-65,
line
3
5 To
tal S
tate
Infra
stru
ctur
e Pr
ojec
ts
$(63
7)
$2,6
48
$16,
290
$5,9
61
$5,3
05
– –
WP
18-6
5, li
ne 5
1
(PG&E-4)
18-46
D. Compliance with Prior Commission Decisions 1
1. Compliance with Section 5.2 of the 2020 GRC Settlement Agreement 2
(“Deferred Work Principles”) 3
The 2020 GRC Settlement Agreement requires PG&E to include 4
testimony in this GRC on deferred work if the following criteria are met: 5
(a) The work was requested and authorized based on representations that it 6
was needed to provide safe and reliable service (Check 1); 7
(b) PG&E did not perform all of the authorized and funded work, as 8
measured by authorized (explicit or imputed) units of work (Check 2); 9
and 10
(c) PG&E continues to represent that the curtailed work is necessary to 11
provide safe and reliable service (Check 3). 12
Work that was authorized in the 2020 GRC for the MWCs in this chapter 13
was not represented as needed to provide safe and reliable service, 14
therefore Check 1 does not apply. Based on the results of this analysis, this 15
chapter does not include deferred work as defined by the 2020 GRC 16
Settlement Agreement.37 17
2. Decision (D.) 20-05-008 - Caltrain Settlement 18
In D.20-05-008, issued on May 14, 2020, the Commission approved a 19
settlement agreement between PG&E and the Peninsula Corridor Joint 20
Powers Board (Caltrain) (Settlement or Settlement Agreement) regarding 21
allocation of the capital costs required for PG&E to convert and upgrade two 22
PG&E substations – FMC in San Jose and East Grand in South San 23
Francisco – with breaker-and-a-half configurations. Caltrain provides 24
commuter rail service between San Jose and San Francisco and the 25
substation construction is associated with the Caltrain electrification project 26
which will displace the current diesel fuel source with electricity. 27
The Caltrain electrification project will further California’s energy policy 28
priorities to reduce greenhouse gas emissions and to electrify the 29
37 See Exhibit (PG&E-4), WP 2-13.

(PG&E-4)
18-47
transportation sector.38 In particular, by its displacement of diesel fuel, the 1
electrification project will reduce greenhouse gas emissions by up to 2
97 percent as compared to the current diesel service, and thus improve 3
regional air quality. Additionally, electrification will reduce noise along the 4
Peninsula corridor and it will enable Caltrain to run more trains per hour, 5
which will benefit commuters. In addition to the direct project benefits, 6
PG&E’s customers will also receive general operating benefits from 7
upgrading and modernizing the 70-year-old East Grand and 40-year-old 8
FMC substations. 9
Under the terms of the PG&E/Caltrain agreements, Caltrain has had the 10
obligation to advance all funds necessary for PG&E to construct the 11
facilities. Caltrain has also paid PG&E an additional amount on these 12
capital costs to reimburse PG&E for the Income Tax Component of 13
Contributions (ITCC) associated with Caltrain’s funding. As of May 31, 14
2021, Caltrain will have paid PG&E just under $95 million in construction 15
costs and associated ITCC. 16
In Resolution E-4886, the Commission ordered PG&E to file an 17
application to address the manner in which the ultimate financial 18
responsibility for the capital costs to be incurred for the Caltrain 19
electrification project should be allocated between PG&E and Caltrain. In 20
December 2018, PG&E filed Application 18-12-017 in response to 21
Resolution E-4886. After substantial negotiations, PG&E and Caltrain 22
entered into the Settlement Agreement, which the Commission approved in 23
D.20-05-008. 24
The Settlement provides that Caltrain shall retain the financial 25
responsibility for 40 percent of the capital costs of PG&E’s 26
substation-related construction activities and that the remaining 60 percent 27
of costs shall be allocated to and recovered from PG&E’s other customers. 28
To the extent that Caltrain has paid PG&E more than its 40 percent share of 29
capital costs, PG&E must reimburse these capital costs to Caltrain. The 30
38 The Clean Energy and Pollutions Reduction Act of 2015, Sen. Bill No. 350 (2015-2016
Reg. Sess.) (De Leon); see also Pub. Util. Code § 740.12(B) (“Widespread transportation electrification is needed to achieve the goals of the Charge Ahead California Initiative . . .”).
(PG&E-4)
18-48
Settlement Agreement also provides that Caltrain remains obligated for the 1
full ITCC rate on the amount of its capital cost payments. Importantly, 2
although Caltrain began making payments in 2017, and has already paid 3
PG&E more than 40 percent of the estimated cost of the projects, the 4
Settlement provides that PG&E shall not reimburse Caltrain any amount 5
until both this Commission and the FERC authorize PG&E’s rate recovery 6
associated with its reimbursement obligation to Caltrain. Additionally, under 7
the terms of the Settlement, PG&E has no obligation to pay any interest on 8
the reimbursed amount. 9
In approving the Settlement Agreement, the Commission added as a 10
condition of PG&E being authorized rate recovery that the Energy Division 11
would retain and oversee an independent third-party auditor to assess 12
PG&E’s construction costs and that “the results of the audit will inform the 13
prudency of [the PG&E-incurred] costs.”39 The Commission explained that 14
the decision was intended “to enable PG&E to seek recovery of [the Caltrain 15
electrification] project costs in its 2023 GRC but still ensure the audit results 16
will be available for parties’ and the Commission’s examination during that 17
proceeding; and to clarify that PG&E may seek recovery of the costs of the 18
audit.”40 19
PG&E estimates that the total cost of the Caltrain electrification project 20
will be approximately $139 million.41 More than 90 percent of project costs 21
are attributable to PG&E’s transmission assets; PG&E will seek to recover 22
this portion of the costs at the FERC in its upcoming 2022 Transmission 23
Owner rate proceeding. In this GRC, PG&E is only seeking recovery for 24
costs attributable to PG&E’s electric distribution CPUC-jurisdictional system. 25
39 D.20-05-008, p. 10. 40 D.20-05-008, pp. 15-16. 41 The decision approving the Settlement Agreement ordered PG&E to provide an
estimate of the total costs of the Caltrain electrification project. D.20-05-008, p. 18, OP 3 (ordering PG&E to file within 10 days of the D.20-05-008 decision a Tier 1 advice letter “detailing its current estimate of the total project costs as of the issue date of this decision.”) PG&E complied with this requirement by filing Advice Letter 5833-E. In that filing, PG&E submitted the cost estimates reflected in the Settlement Agreement, which indicated at the AACE Class 3 level that the total capital costs of the Caltrain electrification project would be approximately $106.9 million and that, with an AACE Class 3 contingency of 30 percent, the total cost could be approximately $139 million.
(PG&E-4)
18-49
PG&E’s allocation between the FERC- and CPUC-jurisdictional costs of the 1
project is based on actual costs incurred to date and cost estimates for the 2
remaining work, which will be almost all FERC-jurisdictional. 3
PG&E estimates that total CPUC-jurisdictional costs will be $10 million. 4
Based on that estimate, PG&E is requesting in this GRC that $6 million be 5
included in rate base to account for its eventual reimbursement of 6
60 percent of project costs to Caltrain. PG&E has included the revenue 7
requirement corresponding to the addition of that $6 million in rate base in 8
its overall requested revenue requirement. PG&E currently estimates that 9
construction at the East Grand substation will be completed in January 2022 10
and construction at the FMC substation will be completed in by May 2022, at 11
which point the auditor retained by the Energy Division will audit the project 12
costs in accordance with D.20-05-008.42 If the audit is completed while 13
Phase 1 of this GRC is still pending, PG&E will submit supplemental 14
testimony in this proceeding presenting the audit. 15
If the audit cannot be completed in time for PG&E to present the costs 16
for the Caltrain electrification project in Phase 1 of this GRC, PG&E requests 17
permission to seek those costs through a Tier 2 advice letter. PG&E 18
proposes to file any such advice letter within 30 days after the audit is 19
completed. A Tier 2 advice letter would allow the issue to be handled 20
expeditiously and would provide an opportunity for review by Commission 21
staff and protest by parties. If PG&E proceeds via advice letter, PG&E 22
would remove the revenue requirement associated with the $6.0 million 23
requested increase in its rate base from its 2023 GRC revenue requirement. 24
E. Cost Tables 25
The expense and capital forecasts for NB/WRO are summarized in the 26
following tables: 27
Table 18-23 lists the expense MWCs, showing 2016 through 2020 28
recorded expenses and 2021 through 2023 forecast expenses. 29
42 PG&E has discussed with the Commission the possibility of beginning the audit when
the work at the East Grand substation in complete.

(PG&E-4)
18-50
Table 18-24 lists the capital MWCs, showing 2016 through 2020 1
recorded expenditures and 2021 through 2026 forecast expenses, 2
including the AB 841-related PEV capital costs.3

18-51
(PG&E-4)TA
BLE
18-
23
EXPE
NSE
(T
HO
USA
ND
S O
F N
OM
INA
L D
OLL
AR
S)
Line
N
o.
MW
C
Des
crip
tion
Rec
orde
d 20
16
Rec
orde
d 20
17
Rec
orde
d 20
18
Rec
orde
d 20
19
Rec
orde
d 20
20
Fore
cast
20
21
Fore
cast
20
22
Fore
cast
20
23
WP
Ref
eren
ce
1 EV
M
anag
e Se
rvic
e In
quiri
es
$8,9
98
$9,8
35
$11,
074
$10,
240
$12,
986
$10,
879
$10,
894
$13,
878
WP
18-1
, lin
e 1
2 EW
E
TD W
RO
–
Mai
nten
ance
12
,607
4,
390
8,75
9 6,
107
15,5
21
8,10
6 8,
118
10,2
83
WP
18-1
, lin
e 2
3 To
tal
$2
1,60
5 $1
4,22
5 $1
9,83
3 $1
6,34
7 $2
8,50
7 $1
8,98
5 $1
9,01
3 $2
4,16
1
TAB
LE 1
8-24
C
API
TAL
(TH
OU
SAN
DS
OF
NO
MIN
AL
DO
LLA
RS)
Line
N
o.
MW
C
Des
crip
tion
Rec
orde
d 20
16
Rec
orde
d 20
17
Rec
orde
d 20
18
Rec
orde
d 20
19
Rec
orde
d 20
20
Fore
cast
20
21
Fore
cast
20
22
Fore
cast
20
23
Fore
cast
20
24
Fore
cast
20
25
Fore
cast
20
26
WP
Ref
eren
ce
1 10
E
Dis
t WR
O
Gen
eral
$9
9,69
4 $9
7,29
8 $1
21,0
47
$120
,864
$1
45,6
30
$155
,690
$1
45,0
48
$132
,769
$1
39,8
42
$150
,827
$1
76,3
41
WP
18-1
7, li
ne 1
2 16
E
Dis
t C
usto
mer
C
onne
cts
359,
943
362,
270
434,
560
461,
986
536,
190
511
,868
6
00,1
22
666
,795
7
14,6
25
767
,943
7
96,1
32
WP
18-1
7 lin
e 2
3 To
tal
$4
59,6
37
$459
,568
$5
55,6
07
$582
,850
$6
81,8
19
$667
,558
$7
45,1
70
$799
,564
$8
54,4
67
$918
,770
$9
72,4
73

(PG&E-4)
-i-
PACIFIC GAS AND ELECTRIC COMPANY 2023 GENERAL RATE CASE
Testimony ____X________ Workpapers ____________ SOQ ______________ Exhibit Number: PG&E-4 Chapter Number: 18 . Chapter Title: New Business And Work At The Request Of Others Witness Name: Josh Jones .
Page No. Line No. Item As Filed As Corrected Errata as of November 5, 2021
18-3 Lines 3-6 2021-2026 Forecast 2021 Forecast $688.3 2022 Forecast $748.5 2023 Forecast $799.3 2024 Forecast $843.1 2025 Forecast $896.4 2026 Forecast $929.1
2021 Forecast $667.6 2022 Forecast $745.2 2023 Forecast $799.6 2024 Forecast $854.5 2025 Forecast $918.8 2026 Forecast $972.5
18-3 Line 8 2023 vs 2020 $117.5 $117.7
18-4 Figure 18-2 Capital Expenditures 2021 Forecast $688,254 2022 Forecast $748,505 2023 Forecast $799,328 2024 Forecast $843,136 2025 Forecast $896,384 2026 Forecast $929,069
2021 Forecast $667,558 2022 Forecast $745,170 2023 Forecast $799,564 2024 Forecast $854,467 2025 Forecast $918,770 2026 Forecast $972,473
18-4 Table 18-2
Line 1 2021-2026 Forecast 2021 Forecast $532,564 2022 Forecast $603,457 2023 Forecast $666,559 2024 Forecast $703,294 2025 Forecast $745,557 2026 Forecast $752,728
2021 Forecast $511,868 2022 Forecast $600,122 2023 Forecast $666,795 2024 Forecast $714,625 2025 Forecast $767,943 2026 Forecast $796,132
18-4 Table 18-2
Line 3 2021-2026 Total Forecast
2021 Forecast $688,254 2022 Forecast $748,505 2023 Forecast $799,328 2024 Forecast $843,136 2025 Forecast $896,384 2026 Forecast $929,069
2021 Forecast $667,558 2022 Forecast $745,170 2023 Forecast $799,564 2024 Forecast $854,467 2025 Forecast $918,770 2026 Forecast $972,473
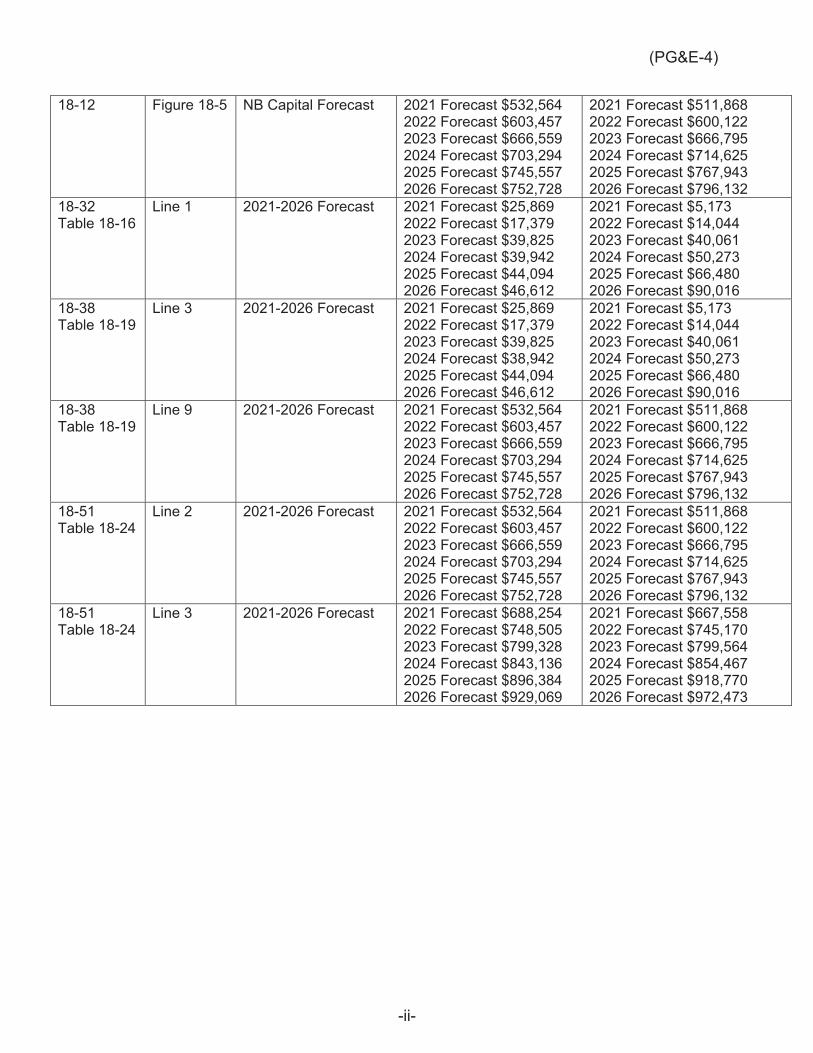
(PG&E-4)
-ii-
18-12 Figure 18-5 NB Capital Forecast
2021 Forecast $532,564 2022 Forecast $603,457 2023 Forecast $666,559 2024 Forecast $703,294 2025 Forecast $745,557 2026 Forecast $752,728
2021 Forecast $511,868 2022 Forecast $600,122 2023 Forecast $666,795 2024 Forecast $714,625 2025 Forecast $767,943 2026 Forecast $796,132
18-32 Table 18-16
Line 1 2021-2026 Forecast 2021 Forecast $25,869 2022 Forecast $17,379 2023 Forecast $39,825 2024 Forecast $39,942 2025 Forecast $44,094 2026 Forecast $46,612
2021 Forecast $5,173 2022 Forecast $14,044 2023 Forecast $40,061 2024 Forecast $50,273 2025 Forecast $66,480 2026 Forecast $90,016
18-38 Table 18-19
Line 3 2021-2026 Forecast 2021 Forecast $25,869 2022 Forecast $17,379 2023 Forecast $39,825 2024 Forecast $38,942 2025 Forecast $44,094 2026 Forecast $46,612
2021 Forecast $5,173 2022 Forecast $14,044 2023 Forecast $40,061 2024 Forecast $50,273 2025 Forecast $66,480 2026 Forecast $90,016
18-38 Table 18-19
Line 9 2021-2026 Forecast 2021 Forecast $532,564 2022 Forecast $603,457 2023 Forecast $666,559 2024 Forecast $703,294 2025 Forecast $745,557 2026 Forecast $752,728
2021 Forecast $511,868 2022 Forecast $600,122 2023 Forecast $666,795 2024 Forecast $714,625 2025 Forecast $767,943 2026 Forecast $796,132
18-51 Table 18-24
Line 2 2021-2026 Forecast 2021 Forecast $532,564 2022 Forecast $603,457 2023 Forecast $666,559 2024 Forecast $703,294 2025 Forecast $745,557 2026 Forecast $752,728
2021 Forecast $511,868 2022 Forecast $600,122 2023 Forecast $666,795 2024 Forecast $714,625 2025 Forecast $767,943 2026 Forecast $796,132
18-51 Table 18-24
Line 3 2021-2026 Forecast 2021 Forecast $688,254 2022 Forecast $748,505 2023 Forecast $799,328 2024 Forecast $843,136 2025 Forecast $896,384 2026 Forecast $929,069
2021 Forecast $667,558 2022 Forecast $745,170 2023 Forecast $799,564 2024 Forecast $854,467 2025 Forecast $918,770 2026 Forecast $972,473
(PG&E-4)
PACIFIC GAS AND ELECTRIC COMPANY
CHAPTER 19
RULE 20A
(PG&E-4)
19-i
PACIFIC GAS AND ELECTRIC COMPANY CHAPTER 19
RULE 20A
TABLE OF CONTENTS
A. Introduction ..................................................................................................... 19-1
1. Scope and Purpose ................................................................................. 19-1
2. Summary of Request ............................................................................... 19-1
3. Overview of Recorded and Forecast Costs .............................................. 19-2
4. Support for Request ................................................................................. 19-3
5. Organization of the Remainder of This Chapter ....................................... 19-3
B. Program and Risk Overview ........................................................................... 19-4
1. Program Description ................................................................................ 19-4
a. Program Overview ............................................................................. 19-4
b. Management Structure ...................................................................... 19-5
2. Risk Controls and Mitigations ................................................................... 19-5
C. Activities, Costs, and Forecast Drivers by MWC ............................................ 19-6
1. Rule 20A Expense (MWC IG) .................................................................. 19-6
2. Rule 20A Program Capital (MWC 30) ...................................................... 19-6
D. Estimating Method .......................................................................................... 19-7
E. Compliance with Prior Commission Decisions ............................................... 19-7
1. Compliance With Section 5.2 of the 2020 GRC Settlement Agreement (“Deferred Work Principles”) .................................................................... 19-7
2. Completion of 2017 Audit of the Rule 20A Program ................................ 19-7
3. Rule 20 OIR Phase 1 Final Decision ........................................................ 19-8
F. Rule 20A Balancing Account .......................................................................... 19-8
G. Work Credit Allocations .................................................................................. 19-9
H. Cost Tables .................................................................................................... 19-9
(PG&E-4)
19-1
PACIFIC GAS AND ELECTRIC COMPANY 1
CHAPTER 19 2
RULE 20A 3
A. Introduction 4
1. Scope and Purpose 5
The purpose of this chapter is to demonstrate that Pacific Gas and 6
Electric Company’s (PG&E) forecast of capital expenditures for PG&E’s 7
Electric Rule 20A Program is reasonable and should be approved. 8
2. Summary of Request 9
PG&E requests that the California Public Utilities Commission (CPUC or 10
Commission) adopt PG&E’s capital expenditure forecast for the Rule 20A 11
Program of $47.3 million in 2021, $40.0 million in 2022, $39.9 million in 12
2023, $41.0 million in 2024, $42.1 million in 2025, and $43.2 million in 2026. 13
PG&E’s 2023 forecast of $39.9 million is $1.6 million higher than its 2020 14
expenditures of $38.3 million.1 15
Consistent with the June 3, 2021 final decision on Phase 1 of 16
R.17-05-010, Order Instituting Rulemaking to Consider Revisions to Electric 17
Rule 20 and Related Matters (Rule 20 OIR), after 2022 PG&E will 18
discontinue the allocation of new work credits for Rule 20A projects.2 19
Finally, PG&E proposes to continue the Rule 20A one-way balancing 20
account ordered in the 2017 and 2020 General Rate Cases (GRC) through 21
the 2023 GRC period. This proposal is consistent with the final decision of 22
Phase 1 of the Rule 20 OIR, which requires PG&E to establish a balancing 23
account for all of its Rule 20 programs.3 24
Forecasts in this chapter are shown with escalation at the Major Work 25
Category (MWC) level and escalation is included in all expense and capital 26
totals. For more information on escalation, please refer to Chapter 2 of this 27
exhibit. 28
1 See Exhibit (PG&E-4), Workpaper (WP) 19-1, line 2. 2 D.21-06-013. 3 D.21-06-013. PG&E will update its 2023 GRC content for other Rule 20 programs as
needed to comply with this decision and any subsequent decisions.
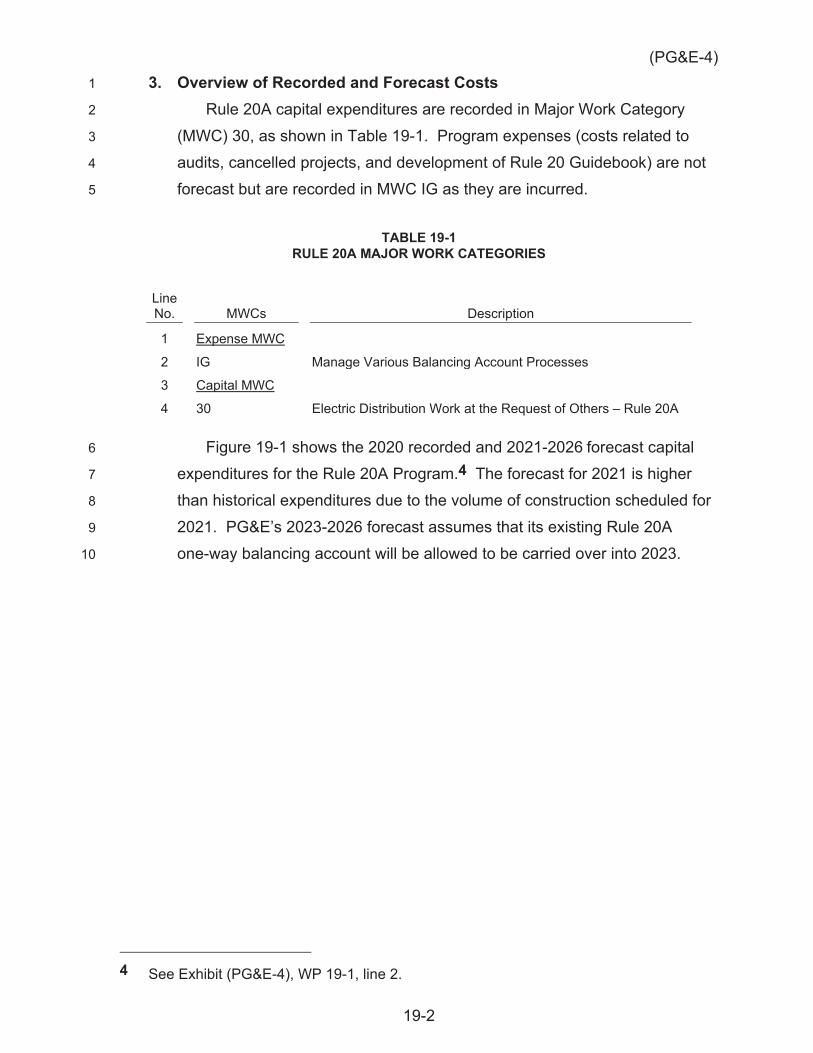
(PG&E-4)
19-2
3. Overview of Recorded and Forecast Costs 1
Rule 20A capital expenditures are recorded in Major Work Category 2
(MWC) 30, as shown in Table 19-1. Program expenses (costs related to 3
audits, cancelled projects, and development of Rule 20 Guidebook) are not 4
forecast but are recorded in MWC IG as they are incurred. 5
TABLE 19-1 RULE 20A MAJOR WORK CATEGORIES
Line No. MWCs Description
1 Expense MWC
2 IG Manage Various Balancing Account Processes
3 Capital MWC
4 30 Electric Distribution Work at the Request of Others – Rule 20A
Figure 19-1 shows the 2020 recorded and 2021-2026 forecast capital 6
expenditures for the Rule 20A Program.4 The forecast for 2021 is higher 7
than historical expenditures due to the volume of construction scheduled for 8
2021. PG&E’s 2023-2026 forecast assumes that its existing Rule 20A 9
one-way balancing account will be allowed to be carried over into 2023. 10
4 See Exhibit (PG&E-4), WP 19-1, line 2.

(PG&E-4)
19-3
FIGURE 19-1 CAPITAL RECORDED AND FORECAST BY MWC 2020-2026
(THOUSANDS OF NOMINAL DOLLARS)
4. Support for Request 1
Rule 20A undergrounding work is performed at the request of 2
governmental agencies. PG&E has received project requests that support 3
the forecast from the governmental agencies. 4
5. Organization of the Remainder of This Chapter 5
The remainder of this chapter is organized as follows: 6
Section B – Program and Risk Overview; 7
Section C – Activities, Costs, and Forecast Drivers by MWC; 8
Section D – Estimating Method; 9
Section E – Compliance With Prior Commission Decisions; 10
Section F – Rule 20A Balancing Account; 11
Section G – Work Credit Allocations; and 12
Section H – Cost Tables. 13
(PG&E-4)
19-4
B. Program and Risk Overview 1
1. Program Description 2
a. Program Overview 3
PG&E’s Rule 20A Program allows governmental agencies to 4
underground existing overhead electric facilities if their projects meet the 5
following specific criteria:5 6
1) The proposed undergrounding work will avoid or eliminate an 7
unusually heavy concentration of overhead electric facilities; 8
2) The street or road or Right-of-Way (ROW) is extensively used by the 9
general public and carries a heavy volume of pedestrian or vehicular 10
traffic; 11
3) The street or road or ROW adjoins or passes through a civic area or 12
public recreation area or an area of unusual scenic interest to the 13
general public; and 14
4) The street or road or ROW is considered an arterial street or major 15
collector as defined in the Governor’s Office of Planning and 16
Research General Plan Guidelines. 17
Rule 20A work credits for undergrounding have historically been 18
allocated to each governmental agency served by PG&E’s electric 19
distribution system according to an established formula.6 The 20
accumulated work credits do not represent actual funds in a financial 21
account. Once a governmental agency has accumulated enough work 22
credits and is ready to proceed with a specific project, the project is 23
added to PG&E’s Rule 20A project queue. 24
Representatives from any governmental agency seeking to pursue a 25
Rule 20A undergrounding project must meet with PG&E’s Rule 20A 26
Liaison to determine whether the project meets the Rule 20A criteria, 27
and whether enough work credits are available to complete the 28
proposed undergrounding project. Under Rule 20A.1, the governmental 29
agency must hold a public hearing and pass an ordinance or resolution 30
5 PG&E will modify these criteria as needed to comply with D.21-06-013. 6 As discussed in Section G, below, PG&E is discontinuing the allocation of new work
credits after 2022.
(PG&E-4)
19-5
to create an underground district. The ordinance addresses items such 1
as the underground district boundaries and whether a project is tied to 2
road widening improvements; it also outlines the project’s qualification 3
for funding under Rule 20A. Once the Rule 20A Liaison has verified that 4
a project qualifies and sufficient work credits are available, the 5
governmental agency and PG&E sign the General Conditions 6
Agreement, which sets forth the parties’ responsibilities, and the project 7
is put into the design queue. 8
On May 19, 2017, the CPUC opened the Rule 20 OIR to review and 9
revise the Rule 20 Program statewide. On June 3, 2021, the CPUC 10
approved D.21-06-013, the final decision on Phase 1 of the Rule 20 11
OIR. As further discussed in Section E.3, below, PG&E has 12
incorporated relevant requirements from that decision into its testimony 13
here. Phase 2 of the Rule 20 OIR remains open and may require 14
additional changes to Rule 20A. 15
b. Management Structure 16
PG&E manages the Rule 20A Program through the Electric 17
Distribution Operations line of business. The Rule 20A Program 18
organization consists of a manager, project managers, program liaisons 19
and analysts. The manager provides the program expertise and 20
oversight ensuring regulatory compliance. The project managers 21
execute the projects from the design phase to closing. The program 22
liaisons work directly with governmental agencies to qualify their 23
projects during the project initiation phase. The analysts support the 24
program with respect to financial items. Specific analyst work includes 25
city and county work credit balances and ledger oversight, reporting 26
project expenditures and forecasts, CPUC annual reporting and data 27
requests, and compliance reporting. 28
2. Risk Controls and Mitigations 29
Risk controls and mitigations are aligned to various MWCs and 30
Maintenance Activity Types in Electric Distribution. None of the work 31
presented in this chapter corresponds to a risk mitigation or risk control that 32
addresses a risk on Electric Operations Corporate Risk Register. More 33
(PG&E-4)
19-6
information about risk mitigations and controls is in PG&E’s Electric 1
Distribution Risk Management testimony (Exhibit (PG&E-4), Chapter 3). 2
C. Activities, Costs, and Forecast Drivers by MWC 3
1. Rule 20A Expense (MWC IG) 4
The Rule 20A Program uses MWC IG to record any expense items, 5
such as costs for required audits. In addition, incurred expenditures for 6
cancelled projects are converted to expense to be recorded in the Rule 20A 7
balancing account. The Rule 20 OIR Phase 1 Decision directs utilities to 8
develop a Rule 20 Guidebook allows costs associated with the Guidebook to 9
be expensed.7 As these costs vary from year to year, PG&E does not 10
forecast these potential costs in the GRC but does record amounts in the 11
Rule 20A balancing account.8 12
2. Rule 20A Program Capital (MWC 30) 13
PG&E’s recorded 2020 capital expenditures of $38.3 million were 14
$4.5 million more than the imputed amount authorized of $33.4 million 15
authorized for 2020 in PG&E’s 2020 GRC.9 PG&E is intentionally 16
expending more than authorized imputed amount to reduce the remaining 17
balance in the one-way Rule 20A balancing account. 18
PG&E’s 2023 GRC forecast was developed based on the 3-year 19
average (2018-2020) expenditures, adjusted to reflect variability in project 20
execution schedules. The forecast for 2021 is higher than historical 21
expenditures due to the volume of construction scheduled for 2021. With 22
escalation, and assuming some spending from the existing balance in the 23
Rule 20A balancing account, PG&E’s 2023 GRC forecast for Rule 20A is 24
$39.9 million for 2023, $41 million for 2024, $42.1 million for 2025, and 25
$43.2 million for 2026.10 26
7 D.21-06-013. 8 See Exhibit (PG&E-4), WP 19-12, line 2. 9 See PG&E’s 2020 Risk Spending Accountability Report for year 2020 (March 21, 2021),
p. 3-3. 10 See Exhibit (PG&E-4), WP 19-1, line 2.
(PG&E-4)
19-7
D. Estimating Method 1
As described above in Section B.1, PG&E is basing its 2023 forecast on 2
a three-year average (2018-2020) of Rule 20A recorded expenditures.11 3
Forecasts for 2021 and 2022 are based on known project work, adjusted to 4
reflect variability in project timelines. A similar adjustment slightly reduces 5
the 2023 forecast from the calculated three year average. 6
E. Compliance with Prior Commission Decisions 7
1. Compliance With Section 5.2 of the 2020 GRC Settlement Agreement 8
(“Deferred Work Principles”) 9
The 2020 GRC Settlement Agreement requires PG&E to include 10
testimony in this GRC on deferred work if the following criteria are met: 11
a) The work was requested and authorized based on representations that it 12
was needed to provide safe and reliable service (Check 1); 13
b) PG&E did not perform all of the authorized and funded work, as 14
measured by authorized (explicit or imputed) units of work (Check 2); 15
and 16
c) PG&E continues to represent that the curtailed work is necessary to 17
provide safe and reliable service (Check 3). 18
Work that was authorized in the 2020 GRC for MWCs in this chapter 19
was not represented as needed to provide safe and reliable service, 20
therefore Check 1 does not apply. Based on the results of this analysis, this 21
chapter does not include deferred work as defined by the 2020 GRC 22
Settlement Agreement.12 23
2. Completion of 2017 Audit of the Rule 20A Program 24
In the 2017 GRC Decision, the Commission ordered an audit of the Rule 25
20A Program “to ensure that PG&E has fully accounted for annual Rule 20A 26
budgeted amounts, and … that localities will receive the full benefit of these 27
funds.”13 The audit was completed in October 2019 and comments and 28
11 See Exhibit (PG&E-4), WP 19-8, “Planned Expenditures and Balancing Account
Carryover.” 12 See Exhibit (PG&E-4), WP 2-13. 13 D.17-05-013, p. 244, Conclusion of Law (COL) 7.
(PG&E-4)
19-8
reply comments pertaining to the audit report have been filed. The CPUC 1
entered the audit report into the record of the Rule 20 OIR proceeding. 2
3. Rule 20 OIR Phase 1 Final Decision 3
As discussed above, on June 3, 2021, the CPUC approved 4
D.21-06-013, the final decision of Phase 1 of the Rule 20 OIR. Among other 5
things, the decision requires PG&E and other utilities with Rule 20 programs 6
to: (1) establish balancing accounts for their Rule 20 programs, including 7
separate tracking of each type of Rule 20 program; and (2) discontinue the 8
issue of Rule A work credits. PG&E believes that its existing Rule 20A 9
balancing account complies with the decision with respect to Rule 20A.14 10
F. Rule 20A Balancing Account 11
The 2017 GRC Decision ordered PG&E to establish a one-way balancing 12
account for the Rule 20A Program.15 The decision further provided that any 13
over-collected balance in the account would remain available for future Rule 20A 14
projects and that the Commission would review the balance in the next GRC 15
proceeding.16 The 2020 GRC Decision continued the one-way balancing 16
account and again provided that any over-collected balance in the account 17
would remain available for future Rule 20A projects and that the Commission 18
would review the balance in the next GRC proceeding.17 D.21-06-013 supports 19
the continuation of the existing one-way balancing account. 20
PG&E proposes that the carry-over of any over-collected balances for use in 21
future projects be continued in the 2023 GRC. Based on 2020 recorded costs 22
and PG&E’s current forecast for 2021 and 2022, PG&E estimates that there will 23
be a $32.7 million balance in the Rule 20A balancing account at the end of 2022 24
that will be available to fund projects in the 2023 GRC period.18 PG&E’s 25
14 PG&E’s Rule 20B and 20C programs, which are part of PG&E’s New Business and
Work at the Request of Others forecast discussed in Chapter 18 of this exhibit, do not currently receive balancing account treatment. PG&E is investigating the best mechanism for complying the D.21-06-013 requirements for these programs.
15 D.17-05-013, p. 249, Ordering Paragraph (OP) 10. 16 D.17-05-013, p. 249, OP 10. 17 D.20-12-005, p. 396, COL 27. 18 See Exhibit (PG&E-4), WP 19-8, lines 6 and 11.
(PG&E-4)
19-9
forecast for the 2023-2026 period assumes that this estimated $32.7 million will 1
be available to fund work in addition to the amount forecast in this GRC. 2
G. Work Credit Allocations 3
As discussed above, PG&E historically allocated work credits to 4
communities served by its electric distribution system according to an 5
established formula. The 2017 and 2020 GRC decisions set the annual work 6
credit allocations at $41.3 million. 7
D.21-06-013 requires PG&E and other utilities to discontinue the issuance of 8
work credits after 2022. Therefore PG&E is not requesting approval of any work 9
allocation in this GRC. 10
H. Cost Tables 11
The recorded and forecast costs for the Rule 20A Program (MWCs IG 12
and 30) are shown below in Tables 19-2 and 19-3.13
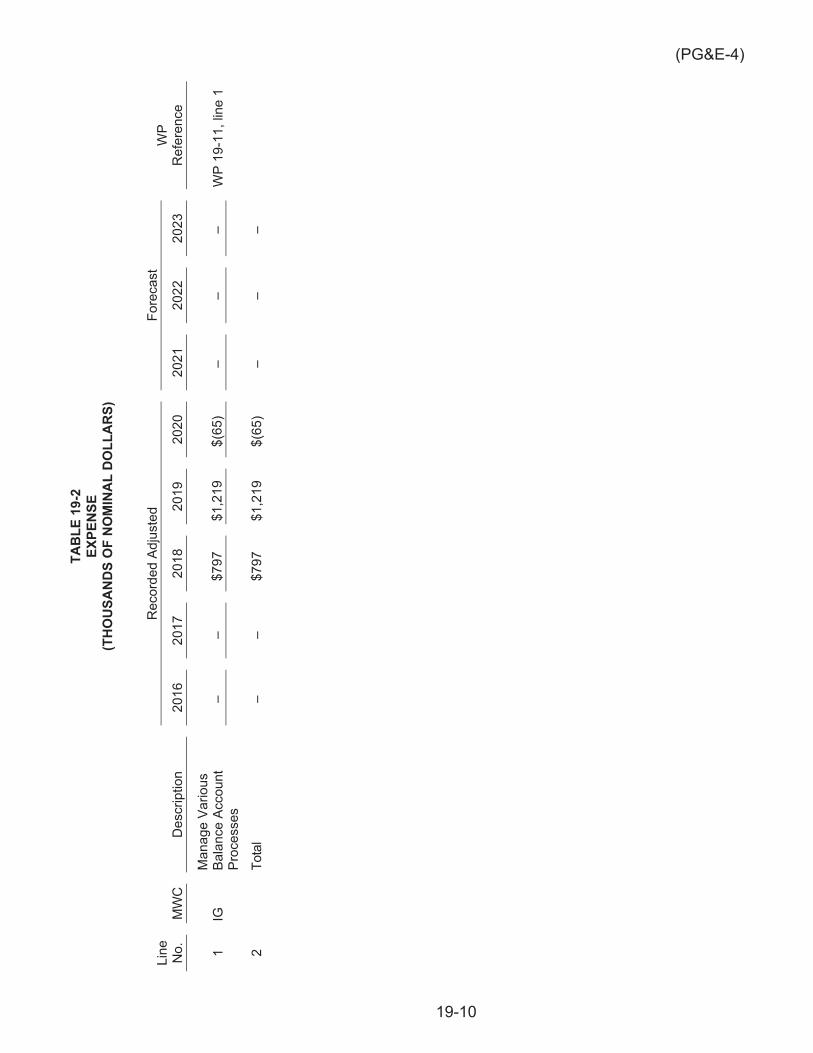
19-10
(PG&E-4)
TAB
LE 1
9-2
EXPE
NSE
(T
HO
USA
ND
S O
F N
OM
INA
L D
OLL
AR
S)
Line
N
o.
MW
C
Des
crip
tion
Rec
orde
d Ad
just
ed
Fore
cast
W
P R
efer
ence
20
16
2017
20
18
2019
20
20
2021
20
22
2023
1 IG
M
anag
e Va
rious
Ba
lanc
e Ac
coun
t Pr
oces
ses
– –
$797
$1
,219
$(
65)
– –
– W
P 19
-11,
line
1
2
Tota
l –
– $7
97
$1,2
19
$(65
) –
– –
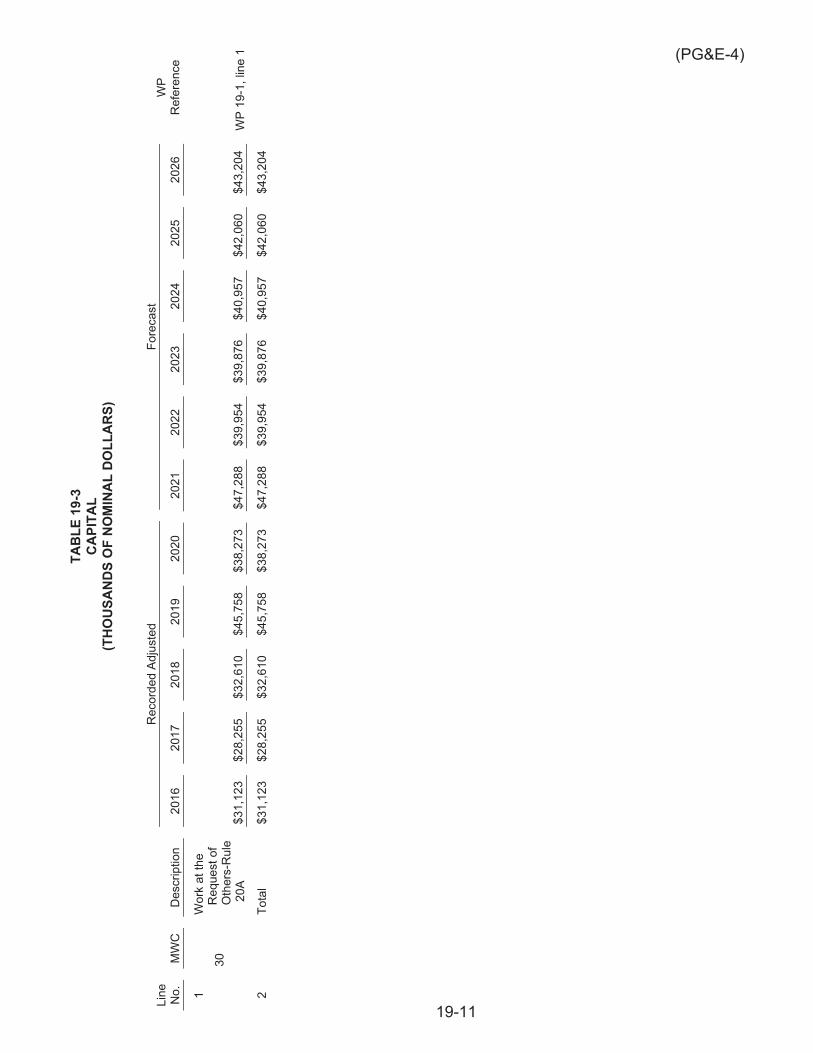
19-11
(PG&E-4)
TAB
LE 1
9-3
CA
PITA
L (T
HO
USA
ND
S O
F N
OM
INA
L D
OLL
AR
S)
Line
N
o.
MW
C
Des
crip
tion
Rec
orde
d Ad
just
ed
Fore
cast
W
P R
efer
ence
20
16
2017
20
18
2019
20
20
2021
20
22
2023
20
24
2025
20
26
1
30
Wor
k at
the
Req
uest
of
Oth
ers-
Rul
e 2
0A
$31,
123
$28,
255
$32,
610
$45,
758
$38,
273
$47,
288
$39,
954
$39,
876
$40,
957
$42,
060
$43,
204
WP
19-1
, lin
e 1
2
Tota
l $3
1,12
3 $2
8,25
5 $3
2,61
0 $4
5,75
8 $3
8,27
3 $4
7,28
8 $3
9,95
4 $3
9,87
6 $4
0,95
7 $4
2,06
0 $4
3,20
4

(PG&E-4)
PACIFIC GAS AND ELECTRIC COMPANY
CHAPTER 20
ELECTRIC DISTRIBUTION DATA MANAGEMENT AND
TECHNOLOGY
[INCLUDES NOVEMBER 5, 2021 ERRATA]
(PG&E-4)
20-i
PACIFIC GAS AND ELECTRIC COMPANY CHAPTER 20
ELECTRIC DISTRIBUTION DATA MANAGEMENT AND TECHNOLOGY
TABLE OF CONTENTS
A. Introduction ..................................................................................................... 20-1
1. Scope and Purpose ................................................................................. 20-1
2. Summary of Request ............................................................................... 20-2
3. Overview of Recorded and Forecast Costs .............................................. 20-3
a. Expense ............................................................................................. 20-3
b. Capital ............................................................................................... 20-4
4. Support for Request ................................................................................. 20-5
5. Organization of the Remainder of This Chapter ....................................... 20-6
B. Program and Risk Overview ........................................................................... 20-6
1. Program Description ................................................................................ 20-6
a. Program Overview ............................................................................. 20-6
b. Management Structure ...................................................................... 20-7
c. Key Metrics and Other Performance Measures ................................. 20-7
2. Risk Integration ........................................................................................ 20-7
C. Activities, Costs, and Forecast Drivers ........................................................... 20-8
1. Data Management (MWCs GE, 21) ......................................................... 20-8
a. Data Management and Analytics ....................................................... 20-8
b. GIS Asset Data Management .......................................................... 20-13
1) Base Mapping ........................................................................... 20-13
2) GIS Technical Enhancements ................................................... 20-16
3) GIS Asset Data Improvements .................................................. 20-20
2. Technology Portfolio Management (MWC JV, 2F) ................................. 20-23
a. Asset Management and Risk Analysis ............................................ 20-24
b. Field Work Management .................................................................. 20-27
(PG&E-4) PACIFIC GAS AND ELECTRIC COMPANY
CHAPTER 20 ELECTRIC DISTRIBUTION DATA MANAGEMENT AND TECHNOLOGY
TABLE OF CONTENTS
(CONTINUED)
20-ii
c. Billing and Rates .............................................................................. 20-30
d. Customer Service ............................................................................ 20-32
e. Safety, Governance, Regulatory, and Compliance .......................... 20-35
f. Non-Project Application Enhancements (NPAE) ............................. 20-37
D. Estimating Methods ...................................................................................... 20-39
E. Compliance with Section 5.2 of the 2020 GRC Settlement Agreement (“Deferred Work Principles”) ......................................................................... 20-39
F. Cost Tables .................................................................................................. 20-40
(PG&E-4)
20-1
PACIFIC GAS AND ELECTRIC COMPANY 1
CHAPTER 20 2
ELECTRIC DISTRIBUTION DATA MANAGEMENT AND 3
TECHNOLOGY 4
A. Introduction 5
1. Scope and Purpose 6
The purpose of this chapter is to demonstrate that Pacific Gas and 7
Electric Company’s (PG&E or the Company) expense and capital 8
expenditure forecasts for electric distribution data management and 9
technology investments are reasonable and should be adopted by the 10
California Public Utilities Commission (CPUC or Commission). 11
PG&E’s Electric Operations (EO) Data Management program covers 12
improvements to data management capabilities as well as management and 13
maturation of core data systems, platforms, and associated business 14
processes necessary to facilitate accurate, traceable, verifiable, complete, 15
and accessible distribution asset information in order to enable effective 16
data-driven decisions for asset risk management. 17
Also included in this chapter is EO’s portfolio of Information Technology 18
(IT)-related technology investments needed to improve capabilities related 19
to asset and work management, customer service, and billing and rates. 20
PG&E is including EO Data Management and Technology investments 21
in this chapter to align with PG&E’s current EO organizational structure. In 22
the 2020 GRC, PG&E forecasted similar types of activities in Exhibit 23
(PG&E-4), Chapters 15 (Technology) and 18 (Data Management), although 24
a portion of the Data Management organization is entirely new as of 2020. 25
Currently all of Data Management and Technology are managed within EO’s 26
Asset Knowledge Management (AKM) organization. 27
The forecast in the chapter does not include: (1) technology programs 28
that primarily support Distributed Energy Resources integration and meet 29
the definition of Grid Modernization Plan investments from 30
(PG&E-4)
20-2
Decision (D.) 18-03-023,1 (2) technology work supporting wildfire 1
mitigations,2 or (3) centralized, enterprise-wide investments in data 2
management tools or capabilities.3 3
2. Summary of Request 4
PG&E requests that the Commission adopt its 2023 expense forecast of 5
$26.0 million to support electric distribution-related data management and 6
technology activities, which is $14.4 million more than the 2020 recorded 7
amount of $11.7 million.4 The expense forecast supports the delivery of 8
technology projects and management of EO asset data, and includes the 9
following types of expenditures: 10
Development and implementation of PG&E’s Asset Data Management 11
Plan, data management standards, procedures, tools, analytic products, 12
and data quality improvement projects; 13
Geographic Information Systems (GIS) base mapping activities, asset 14
data improvements, and system technical enhancements; and 15
IT projects supporting Asset Management, Work Management, Billing 16
and Rates, Customer Service, and other capabilities. 17
Additionally, PG&E requests that the CPUC adopt its capital forecast for 18
Electric Distribution Data Management and Technology projects and 19
programs of $17.7 million for 2021, $23.6 million for 2022, $19.9 million for 20
2023, $19.0 million for 2024, $19.4 million for 2025, and $22.1 million for 21
2026. PG&E’s 2023 forecast is approximately $2.9 million lower than 2020 22
recorded capital expenditures of $22.8 million.5 The capital forecast 23
primarily supports the delivery of technology projects enabling Asset 24
1 These programs are discussed in Exhibit (PG&E-4), Chapter 21, Integrated Grid
Platform and Grid Modernization Plan. 2 These programs are discussed in Exhibit (PG&E-4), Chapter 4.4, Community Wildfire
Safety Program Project Management Office. 3 These programs are discussed in Exhibit (PG&E-7), Chapter 7, Enterprise Records and
Information Management and Enterprise Data Governance. 4 Exhibit (PG&E-4), Workpaper (WP) 20-1, line 3. 5 Exhibit (PG&E-4), WP 20-9, line 3.
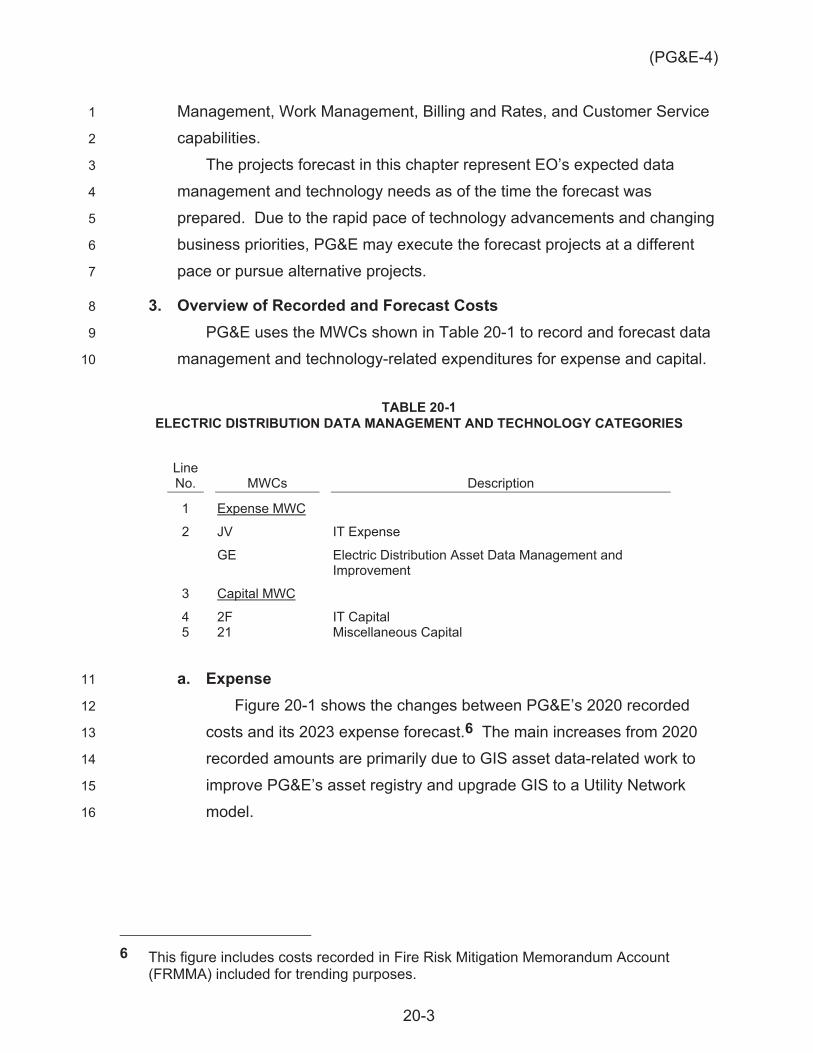
(PG&E-4)
20-3
Management, Work Management, Billing and Rates, and Customer Service 1
capabilities. 2
The projects forecast in this chapter represent EO’s expected data 3
management and technology needs as of the time the forecast was 4
prepared. Due to the rapid pace of technology advancements and changing 5
business priorities, PG&E may execute the forecast projects at a different 6
pace or pursue alternative projects. 7
3. Overview of Recorded and Forecast Costs 8
PG&E uses the MWCs shown in Table 20-1 to record and forecast data 9
management and technology-related expenditures for expense and capital. 10
TABLE 20-1 ELECTRIC DISTRIBUTION DATA MANAGEMENT AND TECHNOLOGY CATEGORIES
Line No. MWCs Description
1 Expense MWC
2 JV
GE
IT Expense
Electric Distribution Asset Data Management and Improvement
3 Capital MWC
4 2F IT Capital 5 21 Miscellaneous Capital
a. Expense 11
Figure 20-1 shows the changes between PG&E’s 2020 recorded 12
costs and its 2023 expense forecast.6 The main increases from 2020 13
recorded amounts are primarily due to GIS asset data-related work to 14
improve PG&E’s asset registry and upgrade GIS to a Utility Network 15
model. 16
6 This figure includes costs recorded in Fire Risk Mitigation Memorandum Account
(FRMMA) included for trending purposes.
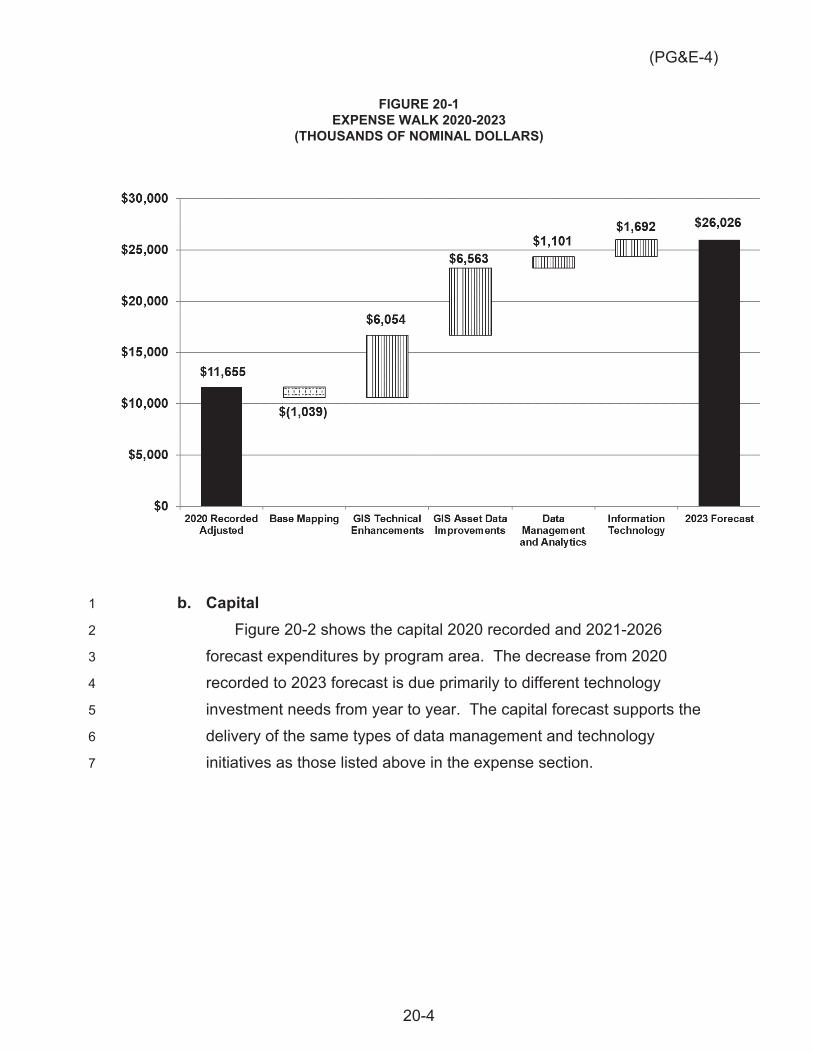
(PG&E-4)
20-4
FIGURE 20-1 EXPENSE WALK 2020-2023
(THOUSANDS OF NOMINAL DOLLARS)
b. Capital 1
Figure 20-2 shows the capital 2020 recorded and 2021-2026 2
forecast expenditures by program area. The decrease from 2020 3
recorded to 2023 forecast is due primarily to different technology 4
investment needs from year to year. The capital forecast supports the 5
delivery of the same types of data management and technology 6
initiatives as those listed above in the expense section. 7

(PG&E-4)
20-5
FIGURE 20-2 CAPITAL RECORDED AND FORECAST 2020-2026
(THOUSANDS OF NOMINAL DOLLARS)
4. Support for Request 1
PG&E’s expense and capital expenditures for Data Management and 2
Technology investments should be approved. To develop this forecast, 3
PG&E has taken the following steps: 4
Data Management 5
Assessed the maturity of PG&E’s current state data management 6
capabilities using established data management maturity models; 7
Identified a target state maturity for each component of data 8
management that aligns with PG&E’s commitment in the 2020 Wildfire 9
Mitigation Plan (WMP) to advance data management maturity to a level 10
of 2.5 (on a scale 0 to 4); 11
Identified core investment areas and estimated the level of maturity 12
needed to achieve its target state data management maturity; 13
Followed a collaborative, integrated planning approach with the 14
Enterprise data management and IT teams to promote alignment; 15
Collaborated with electric asset family owners and process owners to 16
identify critical asset data enhancements to support their business to 17
(PG&E-4)
20-6
effectively manage the inherit risk associated with electric utility 1
operations; and 2
Identified client needs and enhancements to operate an efficient GIS 3
system in both viewing and editing products leveraging industry best 4
practices to transition to a programmatic approach and Utility Network 5
model. 6
Technology 7
Identified key technology programs that support EO goals and 8
objectives; 9
Followed a collaborative and rigorous integrated planning and road 10
mapping process to identify and prioritize technology investments; and 11
Used a sound basis to develop the technology project portfolio scope 12
and approach, timing, and cost estimates, in addition to identifying both 13
quantitative and qualitative benefits. 14
5. Organization of the Remainder of This Chapter 15
The remainder of this chapter is organized as follows: 16
Section B – Program and Risk Overview 17
Section C – Activities, Costs, and Forecast Drivers 18
Section D – Estimating Methods 19
Section E – Compliance with Section 5.2 of the 2020 GRC Settlement 20
Agreement (“Deferred Work Principles”) 21
Section F – Cost Tables 22
B. Program and Risk Overview 23
1. Program Description 24
a. Program Overview 25
The work represented in this chapter in the areas of EO Data 26
Management and Technology investments is implemented by PG&E’s 27
Electric AKM organization. The mission of AKM is to support EO’s 28
ability to make data-driven decisions by improving the accessibility, 29
quality, and use of information, maturing analytical capabilities, and 30
deploying analytical and operational products and technologies. 31
(PG&E-4)
20-7
b. Management Structure 1
The AKM management structure includes strategic and 2
programmatic leadership of four EO programs: 3
DM&A – Includes implementation of EO’s information asset 4
management program (Publicly Available Specification 55 (PAS 5
55)/ISO 55001), Enterprise data management standards, and EO’s 6
Foundry data platform; 7
GIS Asset Data Management – Includes transmission and 8
distribution GIS system data maintenance and improvement, user 9
tools, and system performance; 10
Technology Portfolio Management – Aligns with the IT portfolio 11
including program strategy, IT work prioritization, and in-flight project 12
management office; and 13
Emerging Technology Program – Electric Program Investment 14
Charge and Wildfire Mitigation emerging tech programs including 15
portfolio management (e.g., strategy, governance, enablement), 16
technology benchmarking, regulatory engagement, and in-flight 17
project management office. Emerging Technology costs are 18
forecast in Chapter 21, Integrated Grid Platform and Grid 19
Modernization Plan. 20
c. Key Metrics and Other Performance Measures 21
The AKM organization is driving improvements in asset data to 22
enable capabilities and services for wildfire mitigation and safety and to 23
achieve external commitments such as PAS55 certification. Some key 24
metrics the organization uses to operate effectively include the record 25
duration index, measuring the cycle time it takes for As-Built information 26
to be entered into the system of record. In addition, the volume of active 27
map corrections is tracked to assess asset information risk which is 28
managed accordingly. 29
2. Risk Integration 30
Risk controls and mitigations are aligned to various MWCs and 31
Maintenance Activity Types in Electric Distribution. None of the MWCs 32
(PG&E-4)
20-8
presented in this chapter directly correspond to a risk mitigation or risk 1
control that address a risk on EO’s Corporate Risk Register. More 2
information about risk mitigations and controls is in PG&E’s Electric 3
Distribution Risk Management testimony (Exhibit (PG&E-4), Chapter 3). 4
C. Activities, Costs, and Forecast Drivers 5
1. Data Management (MWCs GE, 21) 6
MWCs GE7 and 21 track two EO data management workstreams: 7
(1) DM&A, and (2) GIS Asset Data Management. These workstreams, 8
described in greater detail below, include the maturation of capabilities and 9
management of core data quality and systems/platforms (e.g., GIS, SAP AG 10
Software (SAP), Foundry) to provide asset information that is accurate, 11
traceable, verifiable, and complete and to enable effective data-driven 12
decisions for asset and risk management. 13
PG&E’s 2023 expense forecast for these activities in MWC GE is 14
$21.5 million, which is $12.7 million more than its 2020 recorded costs of 15
$8.8 million.8 The primary drivers for this increase are activities associated 16
with the new DM&A organization as well as the NextGen GIS effort 17
described below. 18
PG&E’s capital forecast for these activities in MWC 21 is $0 in 2021, 19
$1.6 million in 2022, $2.0 million in 2023, $2.4 million in 2024, $2.9 million in 20
2025, and $3.6 million in 2026.9 There are no 2020 recorded costs in MWC 21
21 for Data Management. The primary driver for the forecast is the 22
development of the Foundry data platform. 23
a. Data Management and Analytics 24
PG&E is forecasting $5.2 million expense in 2023, and capital 25
expenditures forecasts of $0 in 2021, $1.0 million in 2022, $1.3 million in 26
7 In the 2020 GRC, MWC GE included forecasts for Electric Distribution Mapping and the
Field Asset Inventory (FAI) project. The work under MWC GE is expanding in the 2023 GRC to reflect PG&E’s heightened focus on asset data management activities beyond mapping.
8 Exhibit (PG&E-4), WP 20-1, line 1. 9 Exhibit (PG&E-4), WP 20-9, line 1.
(PG&E-4)
20-9
2023, $1.7 million in 2024, $2.1 million in 2025, and $2.7 million in 2026 1
to support EO DM&A activities. This is an increase of $1.1 million 2
expense and $1.3 million capital compared to 2020 recorded 3
expenditures.10 4
In 2020 PG&E established a data management organization at the 5
enterprise level, with a Director of Data Governance. The Enterprise 6
data management organization is responsible for developing enterprise 7
level data strategy, policies, standards, and objectives. In parallel, EO 8
developed a DM&A organization to guide electric data strategy, data 9
quality, and data management efforts, including implementation of 10
Enterprise Data Governance and Standards. The DM&A organization 11
establishes overall priorities, standards, and processes to manage data 12
critical to EO’s Asset Risk Management. Implementation of the electric 13
data strategy will be led by the DM&A organization in partnership with 14
the Enterprise data management team, IT business partners, and EO 15
business units. Centralization of the data management function helps 16
align data strategies across EO and the enterprise and improves 17
PG&E’s ability to make data-driven decisions around asset-related risk 18
management. 19
Activities that the DM&A organization plans to pursue during the 20
2021-2026 period include: 21
Implementation of Asset Data Asset Management Plan (AMP): This 22
is an umbrella initiative guiding the application of best practices for 23
asset management and data, including understanding and 24
managing the inventory of critical data assets, the condition of the 25
data including its quality and the risks associated with the data, and 26
designing/implementing programs, standards, and processes to 27
optimize the performance of data assets; 28
Implementation of Data Management Standards, Processes, and 29
Tools: The implementation of data management standards, 30
processes, and tools are intended to systematically detect and 31
10 Exhibit (PG&E-4), WP 20-7, line 5 and WP 20-18, line 3.
(PG&E-4)
20-10
remediate data quality issues. PG&E will improve data quality 1
through creation and implementation of data quality rules in its data 2
platform and key source systems. PG&E will also identify at-risk 3
data assets that require remediation and design and implement 4
solutions to improve data quality; and 5
Implementation of Data Platform: In order to effectively manage 6
assets and asset risk, PG&E must bring together physical, 7
operational, lifecycle, and environmental data elements from 8
existing disparate purpose-built data systems into a single 9
environment to better enable access to data in support of asset 10
planning, risk management, and operations, and embedded data 11
analytics for ad hoc analyses. To this end, a core element of 12
PG&E’s enterprise data management strategy is an enterprise data 13
platform – Palantir Foundry – that will allow PG&E to establish key 14
connections between disparate data sets. 15
Recorded and forecast amounts in MWC GE also include 16
$3.0 million recorded in 2020 and $1.8 million forecast in 2021 to 17
support data management activities related to wildfire mitigation, 18
recorded in the FRMMA, and included in the amounts in Table 20-2 19
below.11 This work is driven by PG&E’s AMP and addresses the 20
following AMP items: 21
AMP 6: Publish EO Asset Information Framework that defines the 22
critical physical, operational, lifecycle and environmental data 23
elements that are required for risk-informed, data driven 24
decision-making; and 25
AMP 12: Publish a data model for use in the development of EO 26
asset risk models. 27
PG&E does not have a forecast for this work for the 2022-2023 28
period. If additional work is needed 2021, PG&E will continue to record 29
costs in the FRMMA. 30
11 See Exhibit (PG&E-4), Chapter 2, Attachment A, Table 2A-3.
(PG&E-4)
20-11
Tables 20-2 and 20-3 below summarize PG&E’s forecasts for Data 1
Management and Analytics. 2
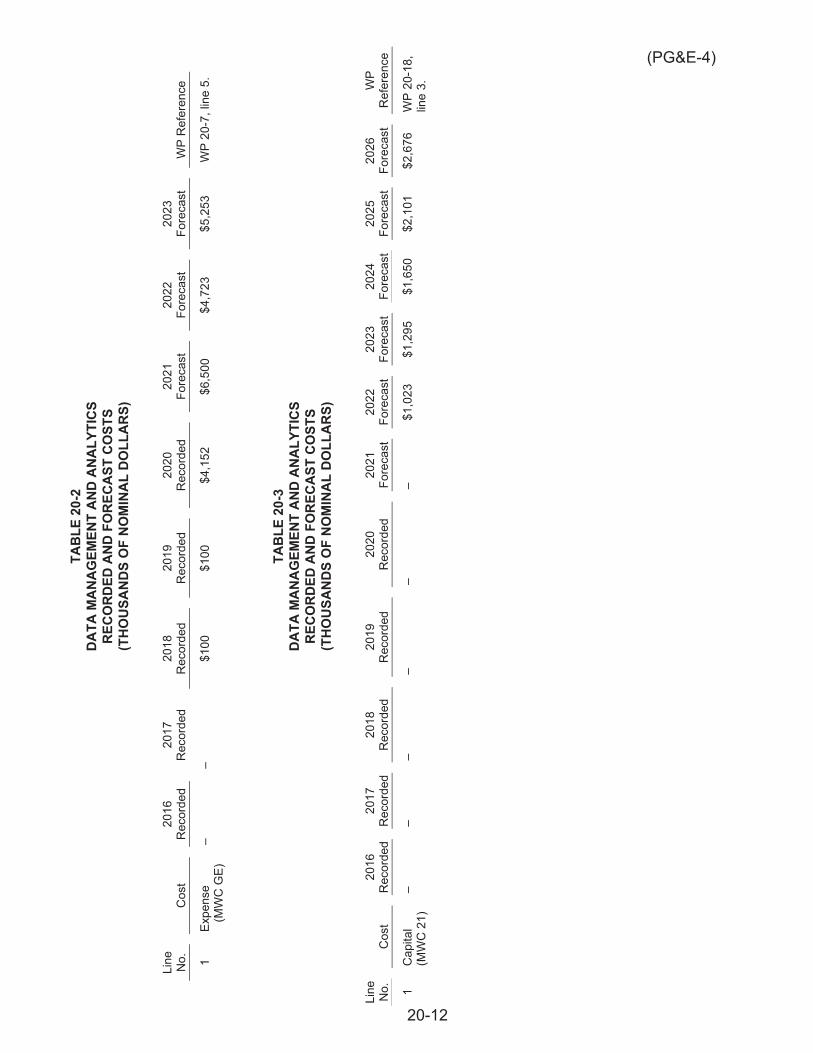
20-12
(PG&E-4) TA
BLE
20-
2 D
ATA
MA
NA
GEM
ENT
AND
AN
ALY
TIC
S R
ECO
RDED
AN
D F
OR
ECA
ST C
OST
S (T
HO
USA
ND
S O
F N
OM
INA
L D
OLL
AR
S)
Line
N
o.
Cos
t 20
16
Rec
orde
d 20
17
Rec
orde
d 20
18
Rec
orde
d 20
19
Rec
orde
d 20
20
Rec
orde
d 20
21
Fore
cast
20
22
Fore
cast
20
23
Fore
cast
W
P R
efer
ence
1 Ex
pens
e (M
WC
GE)
–
– $1
00
$100
$4
,152
$6
,500
$4
,723
$5
,253
W
P 20
-7, l
ine
5.
TAB
LE 2
0-3
DA
TA M
AN
AG
EMEN
T AN
D A
NA
LYTI
CS
REC
ORD
ED A
ND
FO
REC
AST
CO
STS
(TH
OU
SAN
DS
OF
NO
MIN
AL
DO
LLA
RS)
Line
N
o.
Cos
t 20
16
Rec
orde
d 20
17
Rec
orde
d 20
18
Rec
orde
d 20
19
Rec
orde
d 20
20
Rec
orde
d 20
21
Fore
cast
20
22
Fore
cast
20
23
Fore
cast
20
24
Fore
cast
20
25
Fore
cast
20
26
Fore
cast
W
P R
efer
ence
1 C
apita
l (M
WC
21)
–
– –
– –
– $1
,023
$1
,295
$1
,650
$2
,101
$2
,676
W
P 20
-18,
lin
e 3.
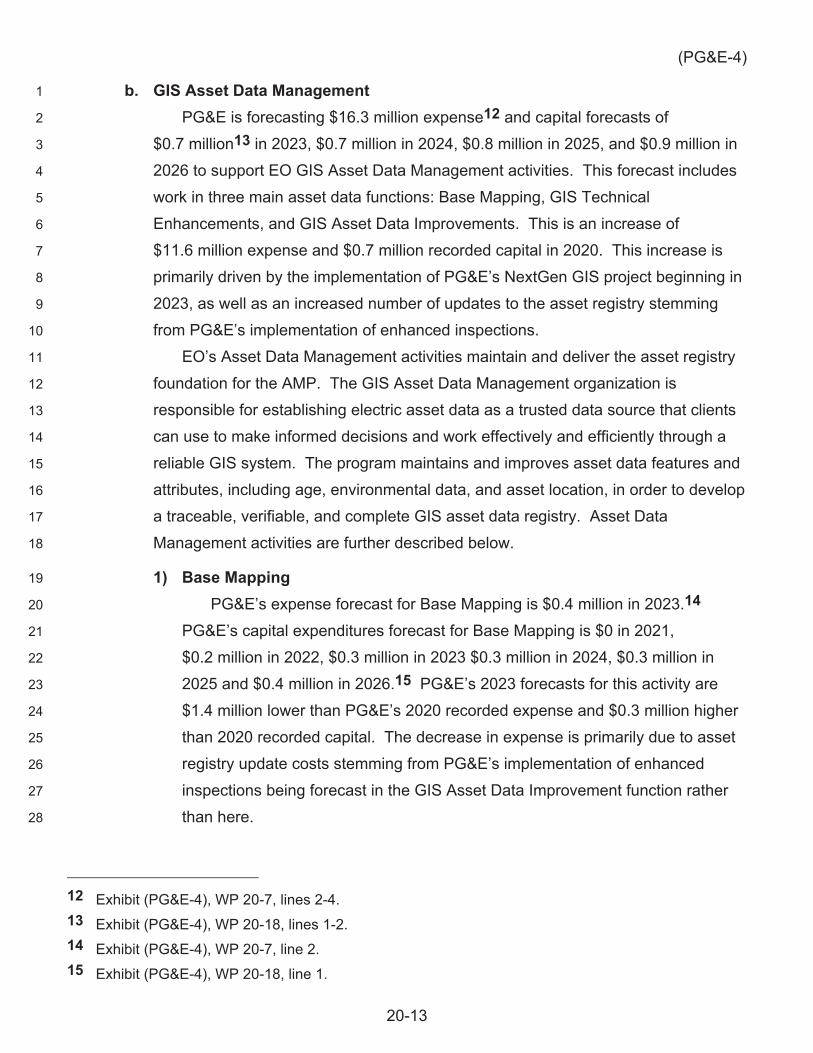
(PG&E-4)
20-13
b. GIS Asset Data Management 1
PG&E is forecasting $16.3 million expense12 and capital forecasts of 2
$0.7 million13 in 2023, $0.7 million in 2024, $0.8 million in 2025, and $0.9 million in 3
2026 to support EO GIS Asset Data Management activities. This forecast includes 4
work in three main asset data functions: Base Mapping, GIS Technical 5
Enhancements, and GIS Asset Data Improvements. This is an increase of 6
$11.6 million expense and $0.7 million recorded capital in 2020. This increase is 7
primarily driven by the implementation of PG&E’s NextGen GIS project beginning in 8
2023, as well as an increased number of updates to the asset registry stemming 9
from PG&E’s implementation of enhanced inspections. 10
EO’s Asset Data Management activities maintain and deliver the asset registry 11
foundation for the AMP. The GIS Asset Data Management organization is 12
responsible for establishing electric asset data as a trusted data source that clients 13
can use to make informed decisions and work effectively and efficiently through a 14
reliable GIS system. The program maintains and improves asset data features and 15
attributes, including age, environmental data, and asset location, in order to develop 16
a traceable, verifiable, and complete GIS asset data registry. Asset Data 17
Management activities are further described below. 18
1) Base Mapping 19
PG&E’s expense forecast for Base Mapping is $0.4 million in 2023.14 20
PG&E’s capital expenditures forecast for Base Mapping is $0 in 2021, 21
$0.2 million in 2022, $0.3 million in 2023 $0.3 million in 2024, $0.3 million in 22
2025 and $0.4 million in 2026.15 PG&E’s 2023 forecasts for this activity are 23
$1.4 million lower than PG&E’s 2020 recorded expense and $0.3 million higher 24
than 2020 recorded capital. The decrease in expense is primarily due to asset 25
registry update costs stemming from PG&E’s implementation of enhanced 26
inspections being forecast in the GIS Asset Data Improvement function rather 27
than here. 28
12 Exhibit (PG&E-4), WP 20-7, lines 2-4. 13 Exhibit (PG&E-4), WP 20-18, lines 1-2. 14 Exhibit (PG&E-4), WP 20-7, line 2. 15 Exhibit (PG&E-4), WP 20-18, line 1.

(PG&E-4)
20-14
Base mapping work is comprised of general mapping activities that 1
maintain electric distribution maps and asset-related records, providing timely 2
traceable, verifiable, complete, and accurate data and spatial information for 3
PG&E’s electric system. PG&E’s GIS Mappers are responsible for updating 4
targeted GIS information whenever facilities in the field are installed, replaced, 5
or retired. Mappers also correct GIS information on maps as needed based on 6
information received from field personnel. Base mapping also includes funding 7
for the Mapping Advancement Program (MAP), a comprehensive self-directed 8
training program that provides the knowledge and skills necessary to perform 9
the responsibilities of the Mapping Technician classification. 10
Tables 20-4 and 20-5 below summarize PG&E’s forecasts for Base 11
Mapping. 12
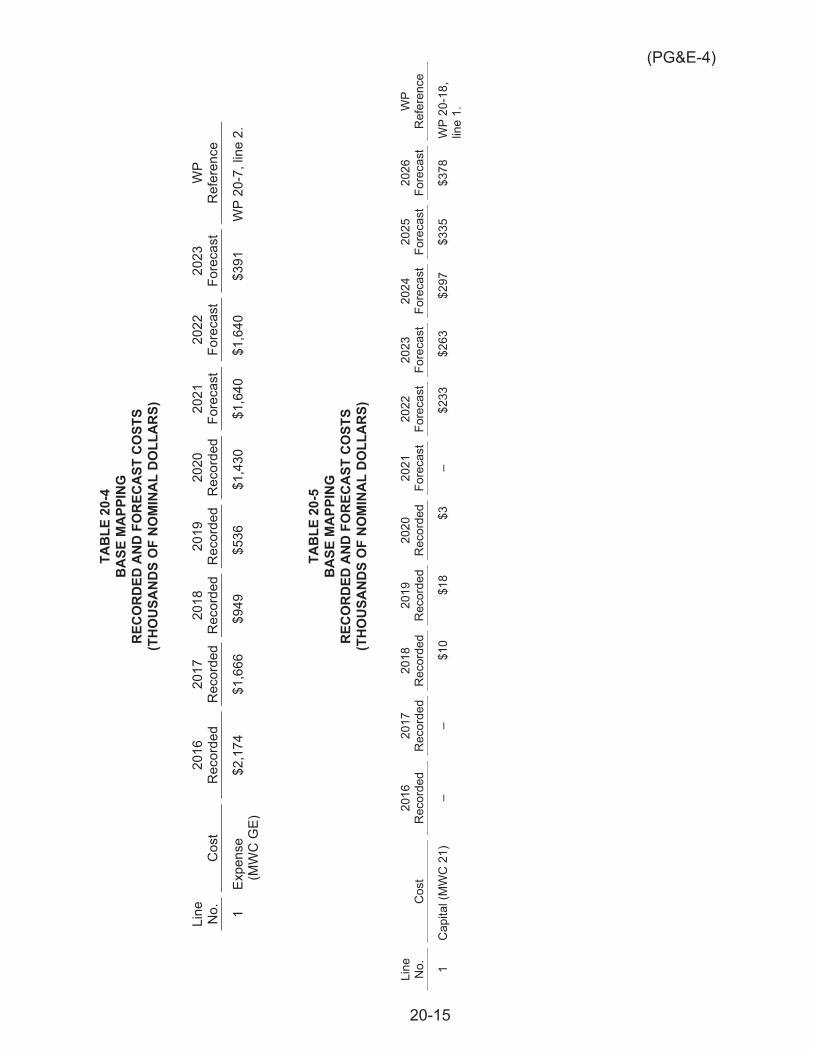
20-15
(PG&E-4)
TAB
LE 2
0-4
BA
SE M
APP
ING
R
ECO
RDED
AN
D F
OR
ECA
ST C
OST
S (T
HO
USA
ND
S O
F N
OM
INA
L D
OLL
AR
S)
Line
N
o.
Cos
t 20
16
Rec
orde
d 20
17
Rec
orde
d 20
18
Rec
orde
d 20
19
Rec
orde
d 20
20
Rec
orde
d 20
21
Fore
cast
20
22
Fore
cast
20
23
Fore
cast
W
P R
efer
ence
1 Ex
pens
e (M
WC
GE)
$2
,174
$1
,666
$9
49
$536
$1
,430
$1
,640
$1
,640
$3
91
WP
20-7
, lin
e 2.
TAB
LE 2
0-5
BA
SE M
APP
ING
R
ECO
RDED
AN
D F
OR
ECA
ST C
OST
S (T
HO
USA
ND
S O
F N
OM
INA
L D
OLL
AR
S)
Line
N
o.
Cos
t 20
16
Rec
orde
d 20
17
Rec
orde
d 20
18
Rec
orde
d 20
19
Rec
orde
d 20
20
Rec
orde
d 20
21
Fore
cast
20
22
Fore
cast
20
23
Fore
cast
20
24
Fore
cast
20
25
Fore
cast
20
26
Fore
cast
W
P R
efer
ence
1 C
apita
l (M
WC
21)
–
– $1
0 $1
8 $3
–
$233
$2
63
$297
$3
35
$378
W
P 20
-18,
lin
e 1.
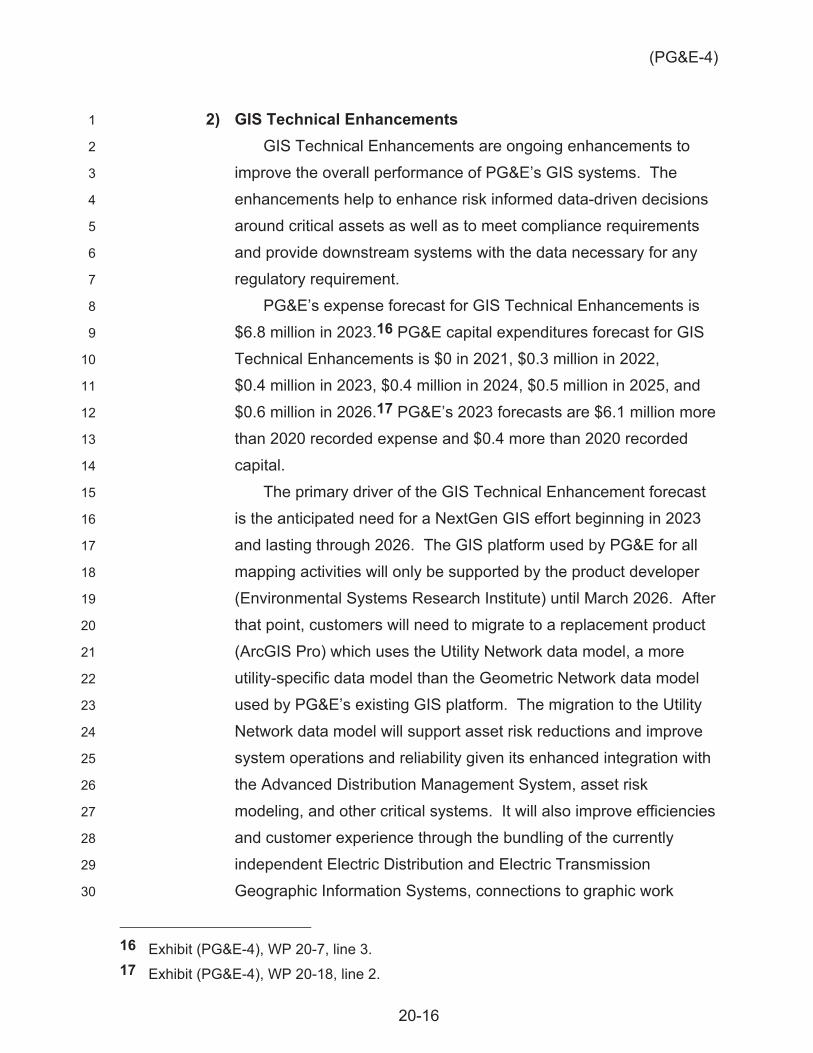
(PG&E-4)
20-16
2) GIS Technical Enhancements 1
GIS Technical Enhancements are ongoing enhancements to 2
improve the overall performance of PG&E’s GIS systems. The 3
enhancements help to enhance risk informed data-driven decisions 4
around critical assets as well as to meet compliance requirements 5
and provide downstream systems with the data necessary for any 6
regulatory requirement. 7
PG&E’s expense forecast for GIS Technical Enhancements is 8
$6.8 million in 2023.16 PG&E capital expenditures forecast for GIS 9
Technical Enhancements is $0 in 2021, $0.3 million in 2022, 10
$0.4 million in 2023, $0.4 million in 2024, $0.5 million in 2025, and 11
$0.6 million in 2026.17 PG&E’s 2023 forecasts are $6.1 million more 12
than 2020 recorded expense and $0.4 more than 2020 recorded 13
capital. 14
The primary driver of the GIS Technical Enhancement forecast 15
is the anticipated need for a NextGen GIS effort beginning in 2023 16
and lasting through 2026. The GIS platform used by PG&E for all 17
mapping activities will only be supported by the product developer 18
(Environmental Systems Research Institute) until March 2026. After 19
that point, customers will need to migrate to a replacement product 20
(ArcGIS Pro) which uses the Utility Network data model, a more 21
utility-specific data model than the Geometric Network data model 22
used by PG&E’s existing GIS platform. The migration to the Utility 23
Network data model will support asset risk reductions and improve 24
system operations and reliability given its enhanced integration with 25
the Advanced Distribution Management System, asset risk 26
modeling, and other critical systems. It will also improve efficiencies 27
and customer experience through the bundling of the currently 28
independent Electric Distribution and Electric Transmission 29
Geographic Information Systems, connections to graphic work 30
16 Exhibit (PG&E-4), WP 20-7, line 3. 17 Exhibit (PG&E-4), WP 20-18, line 2.
(PG&E-4)
20-17
designs, and As-Built information quality and expediency through 1
mobile solutions. 2
ArcGIS Pro will provide a comprehensive framework for 3
modeling utility systems. It is designed to model all the components 4
that make up the system and allows users to build real-world 5
behaviors into the features of the model. This model is simpler and 6
more scalable than the model currently used by PG&E and brings 7
native capabilities into ArcGIS that were once only offered by third 8
parties. 9
To complete the GIS re-platform, PG&E plans to: 10
Select a system integrator that knows the Utility Network data 11
model and has migration experience; 12
Perform data analysis and curation on existing GIS datasets to 13
prepare for data migration; 14
Enable a means for Geometric Network and Utility Network data 15
model-based systems to run in parallel while migrations 16
occur. Other alternatives include dual mapping efforts during 17
the migration period; 18
Migrate data, editing tools, and existing applications and 19
interfaces that are currently dependent on the Geometric 20
Network data model into the Utility Network data model; and 21
Provide change management to manage downstream impacts 22
of the change in data models. 23
PG&E is also forecasting additional GIS system enhancements 24
and analytics tools outside of the NextGen GIS effort in order to 25
improve GIS data quality and provide support to a variety of 26
business clients for risk management, system operations, and 27
customer experience improvements. These enhancements include: 28
Data Quality Dashboards: Dashboards provide the ability to 29
measure asset data quality in GIS against seven data quality 30
dimensions – completeness, conformity, consistency, 31
uniqueness, timeliness, synchronization, and accuracy. 32
Introducing ED-GIS data into Palantir Foundry data tools will 33
(PG&E-4)
20-18
enable building data dashboards and performing historical 1
analysis. 2
Graphic Work Design: Graphic Work Design (GWD) involves 3
software tools that enable automated creation of GIS data from 4
Computer-Aided Design tools where engineering relationships 5
between components and subcomponents exist. Lists of 6
components and subcomponents approved for PG&E’s use are 7
maintained in SAP and integrated by GWD engineering. 8
Integration with GIS provides accurate placement of existing 9
assets and eliminates re-drawing during the asset design 10
process. Original design and design changes through As-Builts 11
are also integrated, with GIS eliminating mapping from paper 12
drawings. 13
Asset Data Management & Improvement (ADM&I) Work Plans, 14
Schedules, and Metrics: This involves configuring ADM&I, work 15
plans, data extrapolations, new data designs, and data testing 16
from SAP to support a risk-based prioritization to manage GIS 17
ADM&I work schedules, as well as development and 18
maintenance of automated and centralized visualization tools 19
that measure critical work activities for effective and efficient 20
quality outcomes. 21
GIS Analytics Tools: GIS Analytics tools include the capital 22
costs needed to support the GIS team, including advanced 23
software, servers, and hardware, such as high-end laptops, 24
desktop CPUs etc. to deliver time-sensitive solutions for 25
Meteorology and PSPS teams during emergency operations. 26
GIS team initiatives provide support to a variety of business 27
clients for risk management, system operations, and customer 28
experience improvements. GIS team solutions deliver spatially 29
enabled views into PG&E’s asset datasets. 30
Tables 20-6 and 20-7 below summarize PG&E’s forecasts for 31
GIS Technical Enhancements. 32

(PG&E-4)
20-19
TAB
LE 2
0-6
GIS
TEC
HN
ICA
L EN
HA
NC
EMEN
TS
REC
ORD
ED A
ND
FO
REC
AST
CO
STS
(TH
OU
SAN
DS
OF
NO
MIN
AL
DO
LLA
RS)
Line
N
o.
Cos
t 20
16
Rec
orde
d 20
17
Rec
orde
d 20
18
Rec
orde
d 20
19
Rec
orde
d 20
20
Rec
orde
d 20
21
Fore
cast
20
22
Fore
cast
20
23
Fore
cast
W
P R
efer
ence
1 Ex
pens
e (M
WC
GE)
–
– –
$36
$711
$9
00
$900
$6
,765
W
P 20
-7, l
ine
3.
TAB
LE 2
0-7
GIS
TEC
HN
ICA
L EN
HA
NC
EMEN
TS
REC
ORD
ED A
ND
FO
REC
AST
CO
STS
(TH
OU
SAN
DS
OF
NO
MIN
AL
DO
LLA
RS)
Line
N
o.
Cos
t 20
16
Rec
orde
d 20
17
Rec
orde
d 20
18
Rec
orde
d 20
19
Rec
orde
d 20
20
Rec
orde
d 20
21
Fore
cast
20
22
Fore
cast
20
23
Fore
cast
20
24
Fore
cast
20
25
Fore
cast
20
26
Fore
cast
W
P R
efer
ence
1 C
apita
l (M
WC
21)
–
– –
– –
– $3
49
$395
$4
45
$502
$5
66
WP
20-1
8,
line
2.
(PG&E-4)
20-20
3) GIS Asset Data Improvements 1
PG&E is forecasting $9.1 million expense in 2023 to support EO 2
GIS Asset Data Improvement activities. This is an increase of 3
$6.5 million from 2020 recorded expense.18 This increase in 4
anticipated spend corresponds with the increased scope of PG&E’s 5
Enhanced Inspection Plan, as well as a switch from a circuit to a 6
structure asset base approach. This change is expected to result in 7
the need for additional updates to the asset registry in the areas 8
described below. 9
GIS Asset Data Improvements support the accuracy and 10
completeness of asset information, maps, and records in the 11
integrated Electric Distribution GIS. These improvements are 12
necessary to maintain the accuracy of PG&E’s asset data, including 13
date of installation, manufacturer, and model number. This asset 14
information is vital to identifying which assets need to be replaced 15
and when. In the event of a repair, accurate asset data helps crews 16
know what equipment to take to the job site. 17
PG&E previously forecast work with a similar objective to the 18
GIS Asset Data Improvement program in the 2020 GRC under the 19
name Field Asset Inventory (FAI). FAI was a project intended to 20
deliver a complete field inventory of the electric distribution 21
overhead system and manually correct asset data discrepancies 22
between PG&E’s actual assets in the field and asset records in the 23
SAP and ED-GIS databases. Ultimately the FAI project was 24
deferred due to contractor concerns and budgeting constraints. 25
PG&E is now attempting to achieve the goals of the FAI project 26
in a different way, by conflating electric distribution overhead 27
support structures to their correct geographic location leveraging 28
remote sensing and GPS technology as opposed to a manual FAI. 29
This work is ongoing and will continue through the GRC period. In 30
addition, the increased scope of PG&E’s Enhanced Inspection Plan 31
18 Exhibit (PG&E-4), WP 20-7, line 4.
(PG&E-4)
20-21
has driven a need for four additional asset data improvement efforts 1
which PG&E is forecasting in this GRC. Each effort will add to 2
available asset information and correct discrepancies between 3
actual assets in the field and PG&E’s asset registry. The first effort 4
will update GIS records and databases from a system-wide 5
streetlight inventory while ensuring that the systems of record 6
remain in sync. The second effort will consist of an inventory of 7
underground electric distribution facilities in the Bay Area region to 8
improve GIS asset data associated with those facilities. The third 9
effort is to address an increase in Request for Work (RW) map 10
corrections. Tracking and completion of RW map corrections is 11
critical to having a complete, accurate, traceable, and verifiable 12
asset register. Corrections need to be validated in the SAP 13
database to ensure complete alignment between GIS and SAP, 14
since SAP information is used for maintenance plans including 15
system inspections. The last project is to develop, implement, and 16
maintain critical features and attributes in GIS for quantitative risk 17
management decisions. As asset risk models mature, the need for 18
a more detailed understanding of asset characteristics at an 19
electrical component level will increase driving the need for a more 20
comprehensive asset data collections and upkeep. 21
Table 20-8 below summarizes PG&E’s forecast for GIS Asset 22
Data Improvements. 23
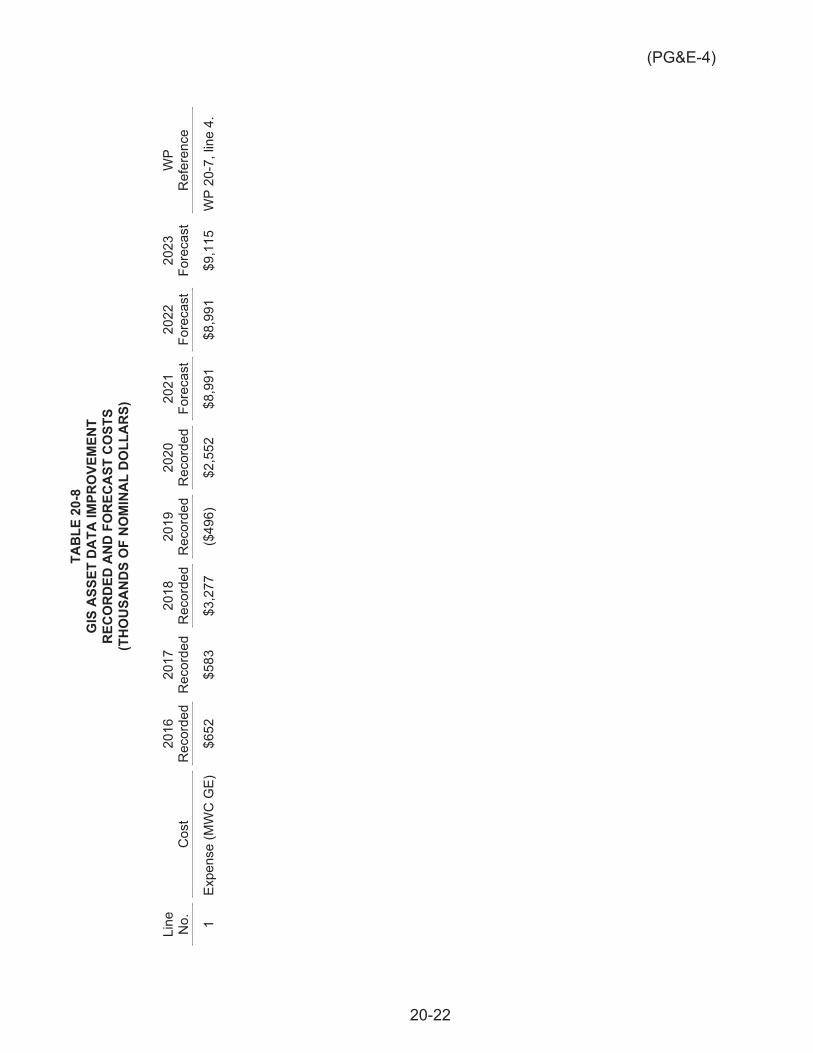
(PG&E-4)
20-22
TAB
LE 2
0-8
GIS
ASS
ET D
ATA
IMPR
OVE
MEN
T R
ECO
RDED
AN
D F
OR
ECA
ST C
OST
S (T
HO
USA
ND
S O
F N
OM
INA
L D
OLL
AR
S)
Line
N
o.
Cos
t 20
16
Rec
orde
d 20
17
Rec
orde
d 20
18
Rec
orde
d 20
19
Rec
orde
d 20
20
Rec
orde
d 20
21
Fore
cast
20
22
Fore
cast
20
23
Fore
cast
W
P R
efer
ence
1 Ex
pens
e (M
WC
GE)
$6
52
$583
$3
,277
($
496)
$2
,552
$8
,991
$8
,991
$9
,115
W
P 20
-7, l
ine
4.
(PG&E-4)
20-23
2. Technology Portfolio Management (MWC JV, 2F) 1
PG&E’s IT organization has begun to adopt an IT industry framework for 2
delivering technology investments using Agile and Lean principles. Within this 3
framework, called the Scaled Agile Framework, technology investments are 4
planned, organized, and managed through logical constructs called Value 5
Streams. A Value Stream, in essence, represents an ongoing program of 6
technology investments that support aspects of Company operations where 7
technology solutions are of long-term strategic importance. Within a Value 8
Stream, PG&E will continually plan, prioritize, and sequence specific 9
investments based on the value they provide to the associated aspect of 10
Company operations at a given time. Not only does this help ensure 11
consistent investment in critical business and technology capabilities, it also 12
enables specialized, cross-functional delivery teams to adapt more nimbly to 13
emergent customer and business needs, changes in priority or value 14
propositions, and innovation in the technology environment. 15
For more information about PG&E’s IT Value Stream approach, see 16
Exhibit (PG&E-7), Chapter 8, Section C.3. 17
PG&E’s 2023 expense forecast for MWC JV is $4.5 million, which is 18
$1.7 million more than the 2020 recorded costs of $2.8 million.19 PG&E’s 19
capital expenditure forecast for MWC 2F is $18.0 million in 2023, 20
$16.6 million in 2024, $16.5 million in 2025, and $18.5 million in 2026. The 21
2023 capital forecast is $4.8 million less than its 2020 recorded costs of 22
$22.8 million.20 MWCs JV and 2F comprise a substantial number of 23
individual IT projects in any given year with some projects reaching 24
completion, some in-flight, and additional projects launching. The drivers for 25
the overall change between the 2020 recorded costs and the 2023 forecast 26
costs are best discussed in terms of the changes occurring in individual 27
Value Streams, and are presented in Sections 2.a–2.e below. 28
19 Exhibit (PG&E-4), WP 20-1, line 2. 20 Exhibit (PG&E-4), WP 20-17, line 12.
(PG&E-4)
20-24
a. Asset Management and Risk Analysis 1
PG&E is forecasting $0.4 million expense and capital forecasts of 2
$2.8 million in 2023, $3.7 million in 2024, $3.0 million in 2025, and 3
$3.3 million in 2026 to support Asset Management and Risk Analysis 4
technology investments. This is a decrease of $1.1 million expense and 5
$4.7 million capital from 2020 recorded.21 This decrease is primarily 6
driven by completion of the Meter Set Technology Upgrade and 7
ED-GIS-related projects, partially offset by the new technology 8
investments described below. 9
Asset Management and Risk Analysis technology investments are 10
focused on improving the understanding and management of electric 11
asset conditions and risks. The work is centered on the development of 12
high-quality asset data systems that process and integrate key data in 13
real or near-real time to provide asset lifecycle stakeholders with 14
seamless access to accurate, trustworthy, up-to-date data. The Asset 15
Management and Risk Analysis technology investment forecast in this 16
chapter supports development of the following capabilities:22 17
1) Asset data integrity is supported by ensuring that all EO asset 18
classes are managed through a common asset management 19
platform. Work supported by the forecast in this chapter includes 20
establishing additional asset classes in PG&E’s SAP asset 21
management system. An example is the creation of an asset 22
registry for streetlights; 23
2) Developing holistic asset management risk models that will support 24
analysis of risk from multiple risk conditions, including the risk of 25
wildfire ignition and storm damage. A central driver of this work has 26
been to develop electric predictive asset maintenance models based 27
21 Exhibit (PG&E-4), WP 20-8, line 2 and WP 20-17, line 2. 22 In addition to the Asset Management and Risk Analysis activities forecast in this
chapter, the Value Stream includes IT technology investments that support EO’s Wildfire risk mitigation activities. The forecast for wildfire risk-related investments is described in Chapter 4 of this exhibit.
(PG&E-4)
20-25
on a real-time understanding of operating conditions, asset health, 1
and risk; and 2
3) Streamlining the sharing of key asset data. An example is the 3
sharing of pole loading data with other utilities and key third parties 4
through a central database which helps support grid safety by 5
preventing the incorrect physical loading of poles used jointly. 6
Tables 20-9 and 20-10 summarize PG&E’s Asset Management and 7
Risk Analysis technology forecast. 8
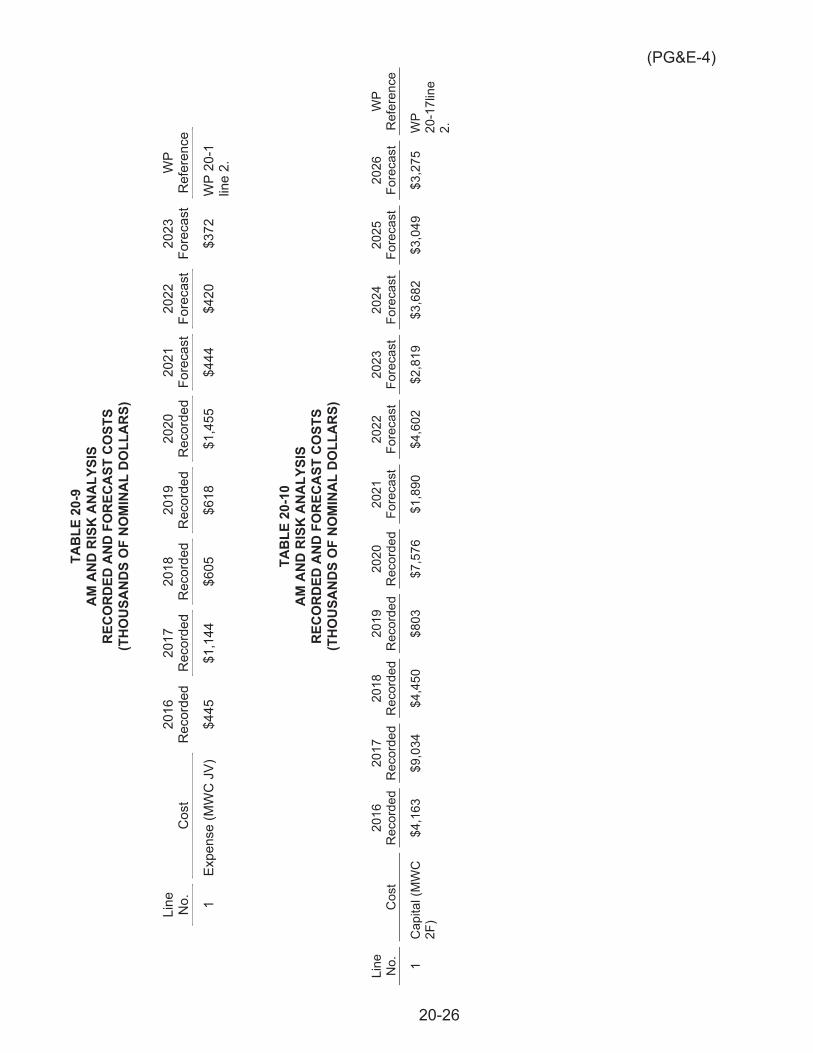
20-26
(PG&E-4) TA
BLE
20-
9 A
M A
ND
RIS
K A
NA
LYSI
S R
ECO
RDED
AN
D F
OR
ECA
ST C
OST
S (T
HO
USA
ND
S O
F N
OM
INA
L D
OLL
AR
S)
Line
N
o.
Cos
t 20
16
Rec
orde
d 20
17
Rec
orde
d 20
18
Rec
orde
d 20
19
Rec
orde
d 20
20
Rec
orde
d 20
21
Fore
cast
20
22
Fore
cast
20
23
Fore
cast
W
P R
efer
ence
1 Ex
pens
e (M
WC
JV)
$4
45
$1,1
44
$605
$6
18
$1,4
55
$444
$4
20
$372
W
P 20
-1
line
2.
TAB
LE 2
0-10
A
M A
ND
RIS
K A
NA
LYSI
S R
ECO
RDED
AN
D F
OR
ECA
ST C
OST
S (T
HO
USA
ND
S O
F N
OM
INA
L D
OLL
AR
S)
Line
N
o.
Cos
t 20
16
Rec
orde
d 20
17
Rec
orde
d 20
18
Rec
orde
d 20
19
Rec
orde
d 20
20
Rec
orde
d 20
21
Fore
cast
20
22
Fore
cast
20
23
Fore
cast
20
24
Fore
cast
20
25
Fore
cast
20
26
Fore
cast
W
P R
efer
ence
1 C
apita
l (M
WC
2F
) $4
,163
$9
,034
$4
,450
$8
03
$7,5
76
$1,8
90
$4,6
02
$2,8
19
$3,6
82
$3,0
49
$3,2
75
WP
20-1
7lin
e 2.
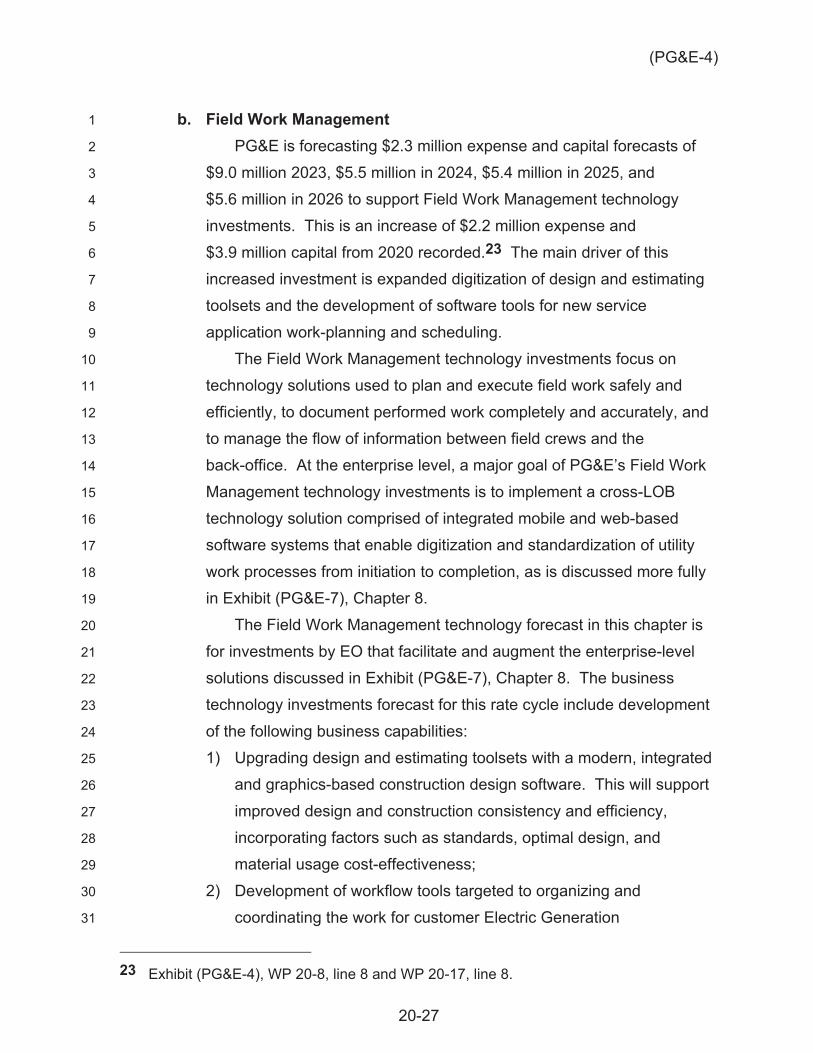
(PG&E-4)
20-27
b. Field Work Management 1
PG&E is forecasting $2.3 million expense and capital forecasts of 2
$9.0 million 2023, $5.5 million in 2024, $5.4 million in 2025, and 3
$5.6 million in 2026 to support Field Work Management technology 4
investments. This is an increase of $2.2 million expense and 5
$3.9 million capital from 2020 recorded.23 The main driver of this 6
increased investment is expanded digitization of design and estimating 7
toolsets and the development of software tools for new service 8
application work-planning and scheduling. 9
The Field Work Management technology investments focus on 10
technology solutions used to plan and execute field work safely and 11
efficiently, to document performed work completely and accurately, and 12
to manage the flow of information between field crews and the 13
back-office. At the enterprise level, a major goal of PG&E’s Field Work 14
Management technology investments is to implement a cross-LOB 15
technology solution comprised of integrated mobile and web-based 16
software systems that enable digitization and standardization of utility 17
work processes from initiation to completion, as is discussed more fully 18
in Exhibit (PG&E-7), Chapter 8. 19
The Field Work Management technology forecast in this chapter is 20
for investments by EO that facilitate and augment the enterprise-level 21
solutions discussed in Exhibit (PG&E-7), Chapter 8. The business 22
technology investments forecast for this rate cycle include development 23
of the following business capabilities: 24
1) Upgrading design and estimating toolsets with a modern, integrated 25
and graphics-based construction design software. This will support 26
improved design and construction consistency and efficiency, 27
incorporating factors such as standards, optimal design, and 28
material usage cost-effectiveness; 29
2) Development of workflow tools targeted to organizing and 30
coordinating the work for customer Electric Generation 31
23 Exhibit (PG&E-4), WP 20-8, line 8 and WP 20-17, line 8.
(PG&E-4)
20-28
Interconnection (EGI) applications. The need for such tools 1
continues to grow as the number of clean energy grid 2
interconnection applications continues to grow, and the engineering 3
coordination needed to facilitate that these interconnections satisfy 4
grid design stability requirements also increases; and 5
3) Development of additional tools to enhance work management 6
capabilities, including automation of substation recordkeeping to 7
promote consistent asset health information is captured in the same 8
tool from installation to decommission. PG&E is also continuing to 9
develop digital tools to enable better tracking and coordination of 10
shared assets such as poles jointly used with other vendors (AT&T, 11
Comcast, and other utilities). These investments enhance grid 12
safety, for example by reducing the risks of pole overloading, which 13
can result in unanticipated pole failures. 14
Tables 20-11 and 20-12 summarize PG&E’s Field Work 15
Management technology forecast.16
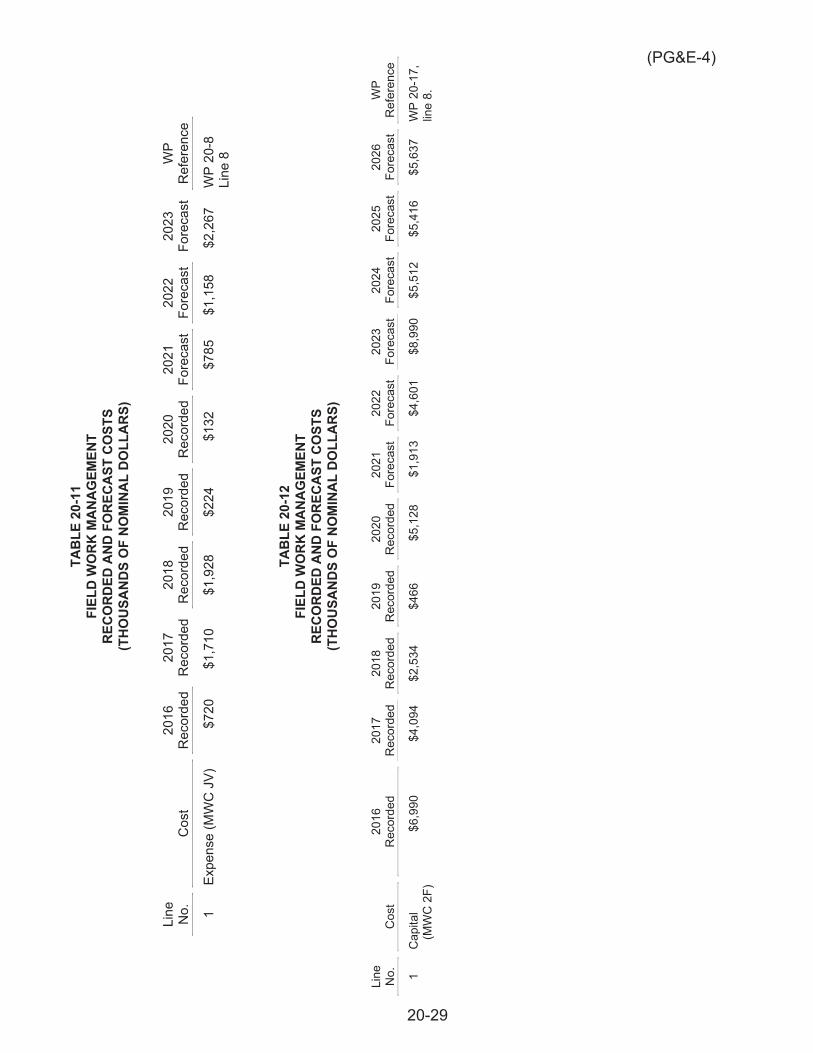
(PG&E-4)
20-29
TAB
LE 2
0-11
FI
ELD
WO
RK
MA
NA
GEM
ENT
REC
ORD
ED A
ND
FO
REC
AST
CO
STS
(TH
OU
SAN
DS
OF
NO
MIN
AL
DO
LLA
RS)
Line
N
o.
Cos
t 20
16
Rec
orde
d 20
17
Rec
orde
d 20
18
Rec
orde
d 20
19
Rec
orde
d 20
20
Rec
orde
d 20
21
Fore
cast
20
22
Fore
cast
20
23
Fore
cast
W
P R
efer
ence
1 Ex
pens
e (M
WC
JV)
$7
20
$1,7
10
$1,9
28
$224
$1
32
$785
$1
,158
$2
,267
W
P 20
-8
Line
8
TAB
LE 2
0-12
FI
ELD
WO
RK
MA
NA
GEM
ENT
REC
ORD
ED A
ND
FO
REC
AST
CO
STS
(TH
OU
SAN
DS
OF
NO
MIN
AL
DO
LLA
RS)
Line
N
o.
Cos
t 20
16
Rec
orde
d 20
17
Rec
orde
d 20
18
Rec
orde
d 20
19
Rec
orde
d 20
20
Rec
orde
d 20
21
Fore
cast
20
22
Fore
cast
20
23
Fore
cast
20
24
Fore
cast
20
25
Fore
cast
20
26
Fore
cast
W
P R
efer
ence
1 C
apita
l (M
WC
2F)
$6
,990
$4
,094
$2
,534
$4
66
$5,1
28
$1,9
13
$4,6
01
$8,9
90
$5,5
12
$5,4
16
$5,6
37
WP
20-1
7,
line
8.
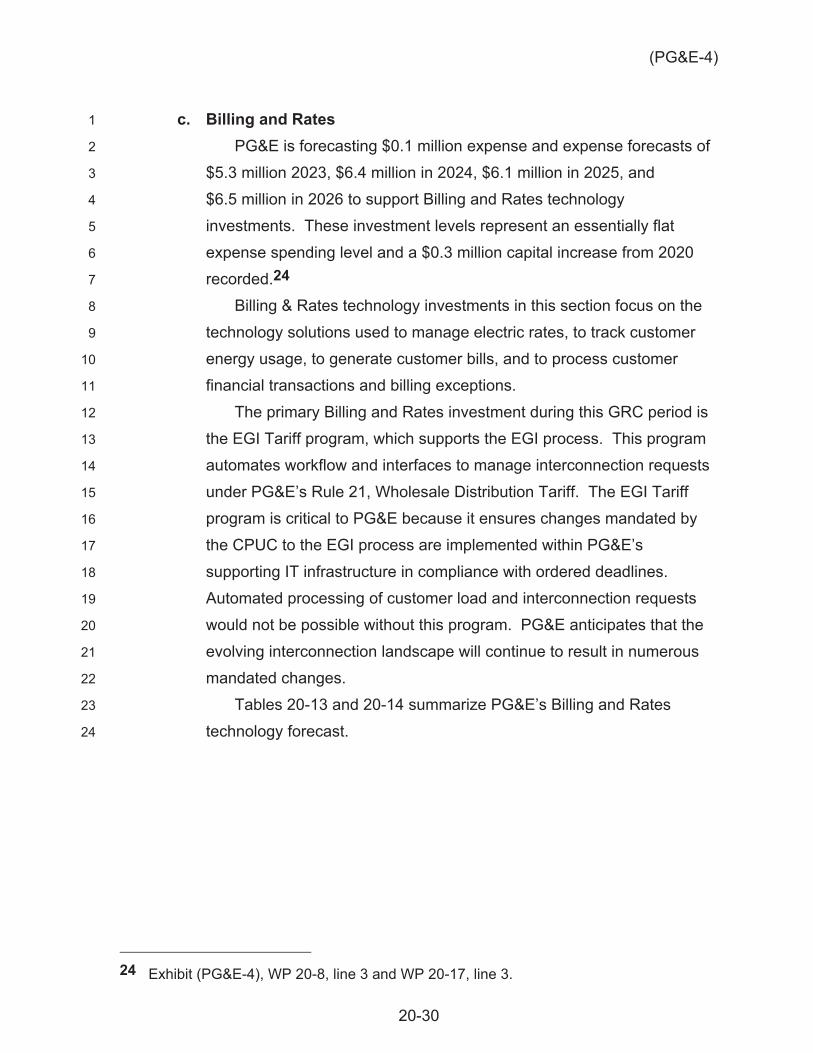
(PG&E-4)
20-30
c. Billing and Rates 1
PG&E is forecasting $0.1 million expense and expense forecasts of 2
$5.3 million 2023, $6.4 million in 2024, $6.1 million in 2025, and 3
$6.5 million in 2026 to support Billing and Rates technology 4
investments. These investment levels represent an essentially flat 5
expense spending level and a $0.3 million capital increase from 2020 6
recorded.24 7
Billing & Rates technology investments in this section focus on the 8
technology solutions used to manage electric rates, to track customer 9
energy usage, to generate customer bills, and to process customer 10
financial transactions and billing exceptions. 11
The primary Billing and Rates investment during this GRC period is 12
the EGI Tariff program, which supports the EGI process. This program 13
automates workflow and interfaces to manage interconnection requests 14
under PG&E’s Rule 21, Wholesale Distribution Tariff. The EGI Tariff 15
program is critical to PG&E because it ensures changes mandated by 16
the CPUC to the EGI process are implemented within PG&E’s 17
supporting IT infrastructure in compliance with ordered deadlines. 18
Automated processing of customer load and interconnection requests 19
would not be possible without this program. PG&E anticipates that the 20
evolving interconnection landscape will continue to result in numerous 21
mandated changes. 22
Tables 20-13 and 20-14 summarize PG&E’s Billing and Rates 23
technology forecast. 24
24 Exhibit (PG&E-4), WP 20-8, line 3 and WP 20-17, line 3.
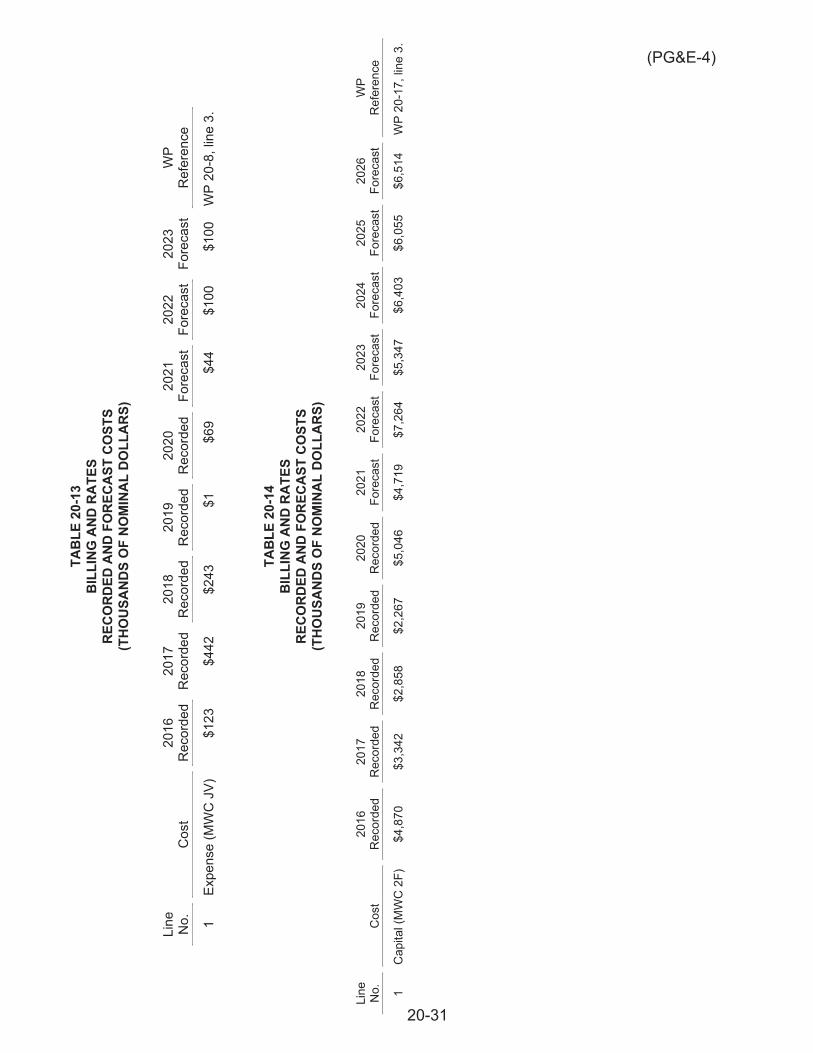
(PG&E-4)
20-31
TAB
LE 2
0-13
B
ILLI
NG
AN
D R
ATE
S R
ECO
RDED
AN
D F
OR
ECA
ST C
OST
S (T
HO
USA
ND
S O
F N
OM
INA
L D
OLL
AR
S)
Line
N
o.
Cos
t 20
16
Rec
orde
d 20
17
Rec
orde
d 20
18
Rec
orde
d 20
19
Rec
orde
d 20
20
Rec
orde
d 20
21
Fore
cast
20
22
Fore
cast
20
23
Fore
cast
W
P R
efer
ence
1 Ex
pens
e (M
WC
JV)
$1
23
$442
$2
43
$1
$69
$44
$100
$1
00
WP
20-8
, lin
e 3.
TAB
LE 2
0-14
B
ILLI
NG
AN
D R
ATE
S R
ECO
RDED
AN
D F
OR
ECA
ST C
OST
S (T
HO
USA
ND
S O
F N
OM
INA
L D
OLL
AR
S)
Line
N
o.
Cos
t 20
16
Rec
orde
d 20
17
Rec
orde
d 20
18
Rec
orde
d 20
19
Rec
orde
d 20
20
Rec
orde
d 20
21
Fore
cast
20
22
Fore
cast
20
23
Fore
cast
20
24
Fore
cast
20
25
Fore
cast
20
26
Fore
cast
W
P R
efer
ence
1 C
apita
l (M
WC
2F)
$4
,870
$3
,342
$2
,858
$2
,267
$5
,046
$4
,719
$7
,264
$5
,347
$6
,403
$6
,055
$6
,514
W
P 20
-17,
line
3.
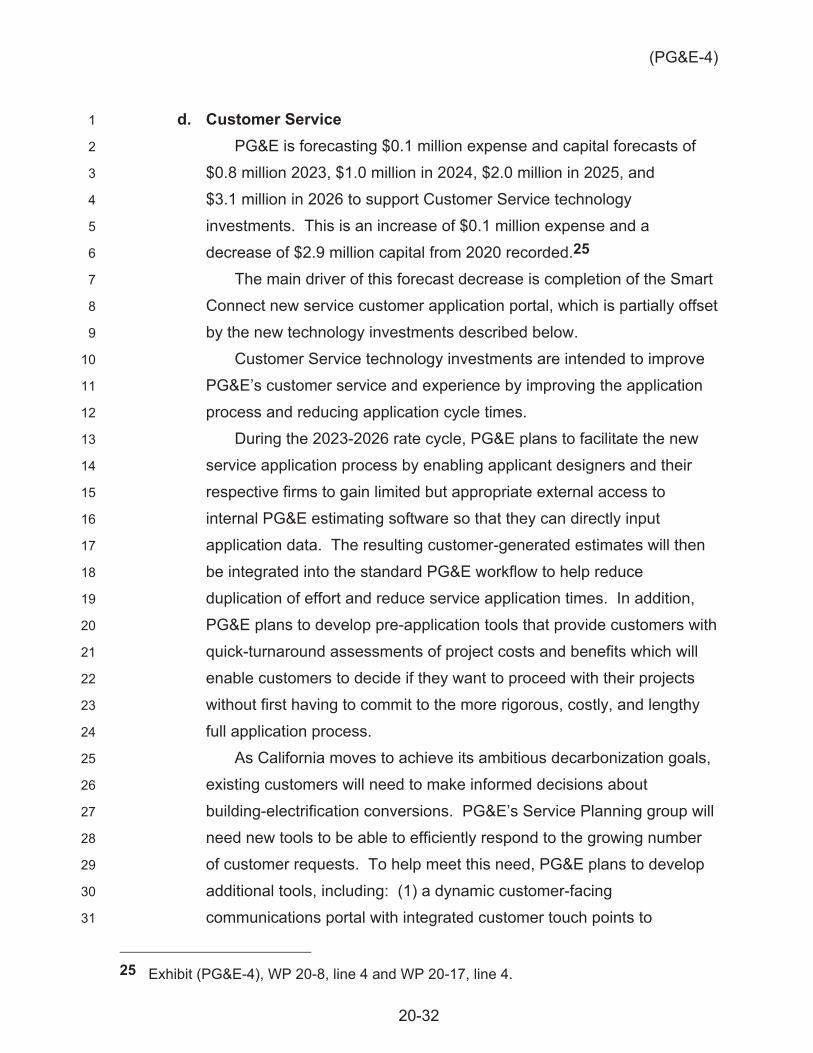
(PG&E-4)
20-32
d. Customer Service 1
PG&E is forecasting $0.1 million expense and capital forecasts of 2
$0.8 million 2023, $1.0 million in 2024, $2.0 million in 2025, and 3
$3.1 million in 2026 to support Customer Service technology 4
investments. This is an increase of $0.1 million expense and a 5
decrease of $2.9 million capital from 2020 recorded.25 6
The main driver of this forecast decrease is completion of the Smart 7
Connect new service customer application portal, which is partially offset 8
by the new technology investments described below. 9
Customer Service technology investments are intended to improve 10
PG&E’s customer service and experience by improving the application 11
process and reducing application cycle times. 12
During the 2023-2026 rate cycle, PG&E plans to facilitate the new 13
service application process by enabling applicant designers and their 14
respective firms to gain limited but appropriate external access to 15
internal PG&E estimating software so that they can directly input 16
application data. The resulting customer-generated estimates will then 17
be integrated into the standard PG&E workflow to help reduce 18
duplication of effort and reduce service application times. In addition, 19
PG&E plans to develop pre-application tools that provide customers with 20
quick-turnaround assessments of project costs and benefits which will 21
enable customers to decide if they want to proceed with their projects 22
without first having to commit to the more rigorous, costly, and lengthy 23
full application process. 24
As California moves to achieve its ambitious decarbonization goals, 25
existing customers will need to make informed decisions about 26
building-electrification conversions. PG&E’s Service Planning group will 27
need new tools to be able to efficiently respond to the growing number 28
of customer requests. To help meet this need, PG&E plans to develop 29
additional tools, including: (1) a dynamic customer-facing 30
communications portal with integrated customer touch points to 31
25 Exhibit (PG&E-4), WP 20-8, line 4 and WP 20-17, line 4.

(PG&E-4)
20-33
streamline and simplify service applications; and (2) a single 1
Compliance and Risk Management portal that provides an integrated 2
and complete customer view tailored to multiple stakeholders. 3
Table 20-15 and 20-16 summarize PG&E’s Customer Service 4
technology forecast. 5
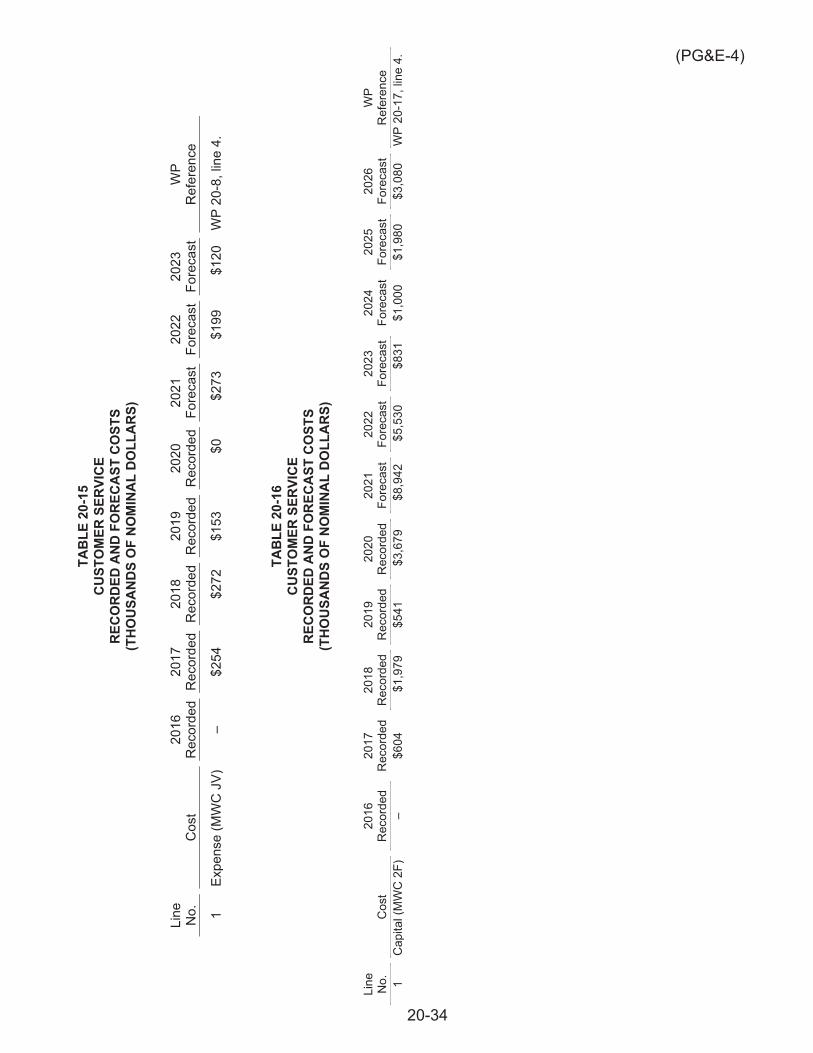
20-34
(PG&E-4) TA
BLE
20-
15
CU
STO
MER
SER
VIC
E R
ECO
RDED
AN
D F
OR
ECA
ST C
OST
S (T
HO
USA
ND
S O
F N
OM
INA
L D
OLL
AR
S)
Line
N
o.
Cos
t 20
16
Rec
orde
d 20
17
Rec
orde
d 20
18
Rec
orde
d 20
19
Rec
orde
d 20
20
Rec
orde
d 20
21
Fore
cast
20
22
Fore
cast
20
23
Fore
cast
W
P R
efer
ence
1 Ex
pens
e (M
WC
JV)
–
$254
$2
72
$153
$0
$2
73
$199
$1
20
WP
20-8
, lin
e 4.
TAB
LE 2
0-16
C
UST
OM
ER S
ERVI
CE
REC
ORD
ED A
ND
FO
REC
AST
CO
STS
(TH
OU
SAN
DS
OF
NO
MIN
AL
DO
LLA
RS)
Line
N
o.
Cos
t 20
16
Rec
orde
d 20
17
Rec
orde
d 20
18
Rec
orde
d 20
19
Rec
orde
d 20
20
Rec
orde
d 20
21
Fore
cast
20
22
Fore
cast
20
23
Fore
cast
20
24
Fore
cast
20
25
Fore
cast
20
26
Fore
cast
W
P R
efer
ence
1
Cap
ital (
MW
C 2
F)
– $6
04
$1,9
79
$541
$3
,679
$8
,942
$5
,530
$8
31
$1,0
00
$1,9
80
$3,0
80
WP
20-1
7, li
ne 4
.
(PG&E-4)
20-35
e. Safety, Governance, Regulatory, and Compliance 1
PG&E is forecasting $0.9 million expense to support EO Safety, 2
Governance, Regulatory, and Compliance technology investments. 3
PG&E did not record any spending in this Value Stream in 2020. The 4
spending increase in 2023 relative to 2020 is associated with 5
maintaining the EO Mobile and Offline Document Viewer, which 6
provides EO field personnel with access to PG&E’s Technical 7
Information Library while they are offline and using mobile devices. 8
Safety, Governance, Regulatory, and Compliance technology 9
investments focus on the technology solutions used: to manage 10
workforce health and safety; to manage public safety and environmental 11
impacts; to manage Company records, compliance, and corrective 12
action programs; to support regulatory and legal proceedings; and to 13
manage relationships with external stakeholders. 14
Table 20-17 summarizes PG&E’s Safety, Governance, Regulatory, 15
and Compliance technology forecast.16
20-36
(PG&E-4) TA
BLE
20-
17
SAFE
TY, G
OVE
RN
AN
CE,
REG
ULA
TOR
Y, A
ND
CO
MPL
IAN
CE
REC
OR
DED
AN
D F
OR
ECA
ST C
OST
S (T
HO
USA
ND
S O
F N
OM
INA
L D
OLL
AR
S)
Line
N
o.
Cos
t 20
16
Rec
orde
d 20
17
Rec
orde
d 20
18
Rec
orde
d 20
19
Rec
orde
d 20
20
Rec
orde
d 20
21
Fore
cast
20
22
Fore
cast
20
23
Fore
cast
W
P R
efer
ence
1 Ex
pens
e (M
WC
JV)
–
$441
$6
54
$36
– $1
,084
$7
56
$941
W
P 20
-8, l
ine
10.

(PG&E-4)
20-37
f. Non-Project Application Enhancements (NPAE) 1
PG&E is forecasting $0.7 million expense in 2023 to support 2
investments in NPAEs. This is an increase of $0.1 million expense and 3
$0.6 million capital from 2020 recorded.26 4
NPAEs modify or improve the way existing applications function. 5
This work supports system configuration changes to enable technology 6
that continues to support related business processes and aligns 7
business capabilities with business needs. 8
Table 20-18 summarizes PG&E’s NPAE technology forecast.9
26 Exhibit (PG&E-4), WP 20-8, line 9 and WP 20-17, line 9.
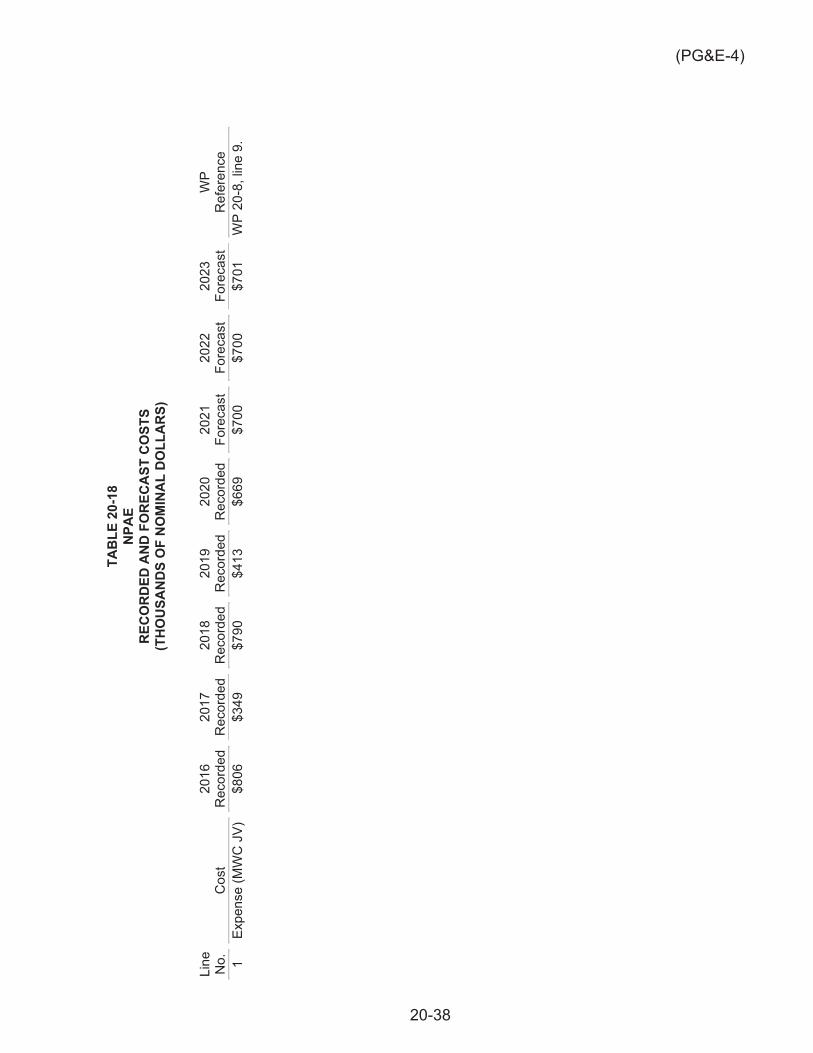
(PG&E-4)
20-38
TAB
LE 2
0-18
N
PAE
REC
ORD
ED A
ND
FO
REC
AST
CO
STS
(TH
OU
SAN
DS
OF
NO
MIN
AL
DO
LLA
RS)
Line
N
o.
Cos
t 20
16
Rec
orde
d 20
17
Rec
orde
d 20
18
Rec
orde
d 20
19
Rec
orde
d 20
20
Rec
orde
d 20
21
Fore
cast
20
22
Fore
cast
20
23
Fore
cast
W
P R
efer
ence
1
Expe
nse
(MW
C J
V)
$806
$3
49
$790
$4
13
$669
$7
00
$700
$7
01
WP
20-8
, lin
e 9.
(PG&E-4)
20-39
D. Estimating Methods 1
The estimating methodology used to develop the GRC forecast for this 2
chapter was dependent on the type of work being performed. For all IT-related 3
projects and programs, PG&E utilized the IT Project Estimating Tool. PG&E 4
discusses its standard estimating methods for technology project investments in 5
Exhibit (PG&E-7), Chapter 8. Historical spend patterns, subject matter 6
expertise, and standard cost factors serve as primary inputs to the IT estimating 7
tools used in this chapter to calculate labor and non-labor costs and document 8
associated assumptions. Forecasts are sequenced to fit within high-level annual 9
planning targets set by IT and Company leadership to align with strategic 10
priorities. 11
PG&E developed the DM&A program forecast by first establishing target 12
milestones in data management principles within the timeframe of the GRC, 13
based on the Gartner Data Governance Maturity Model and the Data 14
Management Framework discussed in the 2021 WMP.27 Once target 15
milestones were established, PG&E used internal and external subject matter 16
expertise in order to estimate costs to reach and sustain those milestones. This 17
process was iterated to optimize capability development within the timing and 18
budget constraints of the GRC. 19
Project forecasts in the areas of Base Mapping, GIS Technical 20
Enhancements, and GIS Asset Data Improvements were developed using 21
subject matter expertise around anticipated units and unit costs of various types 22
of asset registry corrections, as well as program budget expectations resulting 23
from PG&E’s internal investment planning process. Refer to Project Summary 24
workpapers supporting this chapter for more information on the specific 25
estimating methods used for each program. 26
E. Compliance with Section 5.2 of the 2020 GRC Settlement Agreement 27
(“Deferred Work Principles”) 28
The 2020 GRC Settlement Agreement requires PG&E to include testimony 29
in this GRC on deferred work if the following criteria are met: 30
27 PG&E’s 2021 WMP Report, R.18-10-007 (February 5, 2021), Section 7.3.7.
(PG&E-4)
20-40
1) The work was requested and authorized based on representations that it 1
was needed to provide safe and reliable service (Check 1); 2
2) PG&E did not perform all the authorized and funded work, as measured by 3
authorized (explicit or imputed) units of work (Check 2); and 4
3) PG&E continues to represent that the curtailed work is necessary to provide 5
safe and reliable service (Check 3). 6
Work that was authorized in the 2020 GRC for the MWCs in this chapter 7
was not represented as needed to provide safe and reliable service, therefore 8
Check 1 does not apply. Based on the results of this analysis, this chapter does 9
not include deferred work as defined by the 2020 GRC Settlement Agreement.28 10
F. Cost Tables 11
The expense and capital forecasts for Data Management and 12
Technology-related activities are summarized in the following tables: 13
Table 20-19 lists expense MWCs showing 2016 through 2020 recorded 14
adjusted expenses and 2021 through 2023 forecast expenses; and 15
Table 20-20 lists capital MWCs showing 2016 through 2020 recorded capital 16
adjusted expenditures and 2021 through 2026 forecast expenditures. 17
18
28 Exhibit (PG&E-4), WP 2-15.
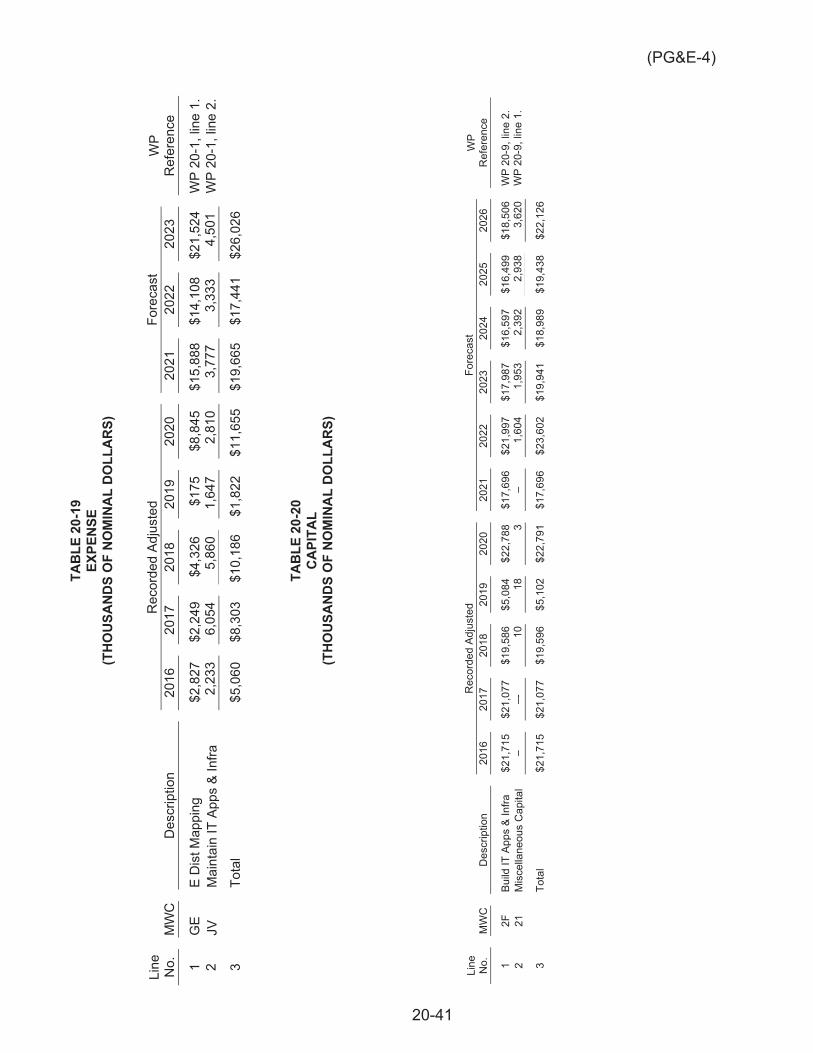
(PG&E-4)
20-41
TAB
LE 2
0-19
EX
PEN
SE
(TH
OU
SAN
DS
OF
NO
MIN
AL
DO
LLA
RS)
Line
N
o.
MW
C
Des
crip
tion
Rec
orde
d Ad
just
ed
Fore
cast
W
P R
efer
ence
20
16
2017
20
18
2019
20
20
2021
20
22
2023
1 G
E E
Dis
t Map
ping
$2
,827
$2
,249
$4
,326
$1
75
$8,8
45
$15,
888
$14,
108
$21,
524
WP
20-1
, lin
e 1.
2
JV
Mai
ntai
n IT
App
s &
Infra
2,
233
6,05
4 5,
860
1,64
7 2,
810
3,77
7 3,
333
4,50
1 W
P 20
-1, l
ine
2.
3
Tota
l $5
,060
$8
,303
$1
0,18
6 $1
,822
$1
1,65
5 $1
9,66
5 $1
7,44
1 $2
6,02
6
TAB
LE 2
0-20
C
API
TAL
(TH
OU
SAN
DS
OF
NO
MIN
AL
DO
LLA
RS)
Line
N
o.
MW
C
Des
crip
tion
Rec
orde
d Ad
just
ed
Fore
cast
W
P R
efer
ence
20
16
2017
20
18
2019
20
20
2021
20
22
2023
20
24
2025
20
26
1 2F
Bu
ild IT
App
s &
Infra
$2
1,71
5 $2
1,07
7 $1
9,58
6 $5
,084
$2
2,78
8 $1
7,69
6 $2
1,99
7 $1
7,98
7 $1
6,59
7 $1
6,49
9 $1
8,50
6 W
P 20
-9, l
ine
2.
2 21
M
isce
llane
ous
Cap
ital
– –-
10
18
3
– 1,
604
1,95
3 2,
392
2,93
8 3,
620
WP
20-9
, lin
e 1.
3
Tota
l $2
1,71
5 $2
1,07
7 $1
9,59
6 $5
,102
$2
2,79
1 $1
7,69
6 $2
3,60
2 $1
9,94
1 $1
8,98
9 $1
9,43
8 $2
2,12
6

(PG&E-4)
PACIFIC GAS AND ELECTRIC COMPANY
CHAPTER 21
INTEGRATED GRID PLATFORM AND
GRID MODERNIZATION PLAN
[INCLUDES NOVEMBER 5, 2021 ERRATA]
(PG&E-4)
21-i
PACIFIC GAS AND ELECTRIC COMPANY CHAPTER 21
INTEGRATED GRID PLATFORM AND GRID MODERNIZATION PLAN
TABLE OF CONTENTS
A. Introduction ..................................................................................................... 21-1
1. Scope and Purpose ................................................................................. 21-1
2. Summary of Request ............................................................................... 21-3
3. Overview of Recorded and Forecast Costs .............................................. 21-4
a. Expense ............................................................................................. 21-5
b. Capital ............................................................................................... 21-7
c. Cost Allocation ................................................................................... 21-8
4. Support for Request ................................................................................. 21-9
5. Organization of the Remainder of This Chapter ..................................... 21-10
B. Program and Risk Overview ......................................................................... 21-10
1. Program Description .............................................................................. 21-10
a. Program Overview ........................................................................... 21-10
b. Management Structure .................................................................... 21-11
2. Risk Integration ...................................................................................... 21-12
C. Activities, Costs and Forecast Drivers by MWC ........................................... 21-12
1. Distribution Planning Programs .............................................................. 21-12
a. Distribution Engineering Planning Tools .......................................... 21-12
b. Distribution Deferral Non-Procurement Costs .................................. 21-15
c. Community Microgrid Enablement Program .................................... 21-17
2. Distribution Operations Programs .......................................................... 21-19
a. Advanced Distribution Management System ................................... 21-19
b. Distributed Energy Resource Management System ........................ 21-22
3. IGP IT Infrastructure ............................................................................... 21-25
(PG&E-4) PACIFIC GAS AND ELECTRIC COMPANY
CHAPTER 21 INTEGRATED GRID PLATFORM AND
GRID MODERNIZATION PLAN
TABLE OF CONTENTS (CONTINUED)
21-ii
4. Electric Emerging Technology Program ................................................. 21-27
5. Elkhorn Battery Energy Storage System ................................................ 21-29
D. Estimating Methods ...................................................................................... 21-31
E. Compliance with Prior Commission Decisions ............................................. 21-32
1. Compliance with Section 5.2 of the GRC Settlement Agreement .......... 21-32
2. Other Compliance Items ........................................................................ 21-33
F. Balancing and Memorandum Accounts ........................................................ 21-33
G. Cost Tables .................................................................................................. 21-34
(PG&E-4)
21-1
PACIFIC GAS AND ELECTRIC COMPANY 1
CHAPTER 21 2
INTEGRATED GRID PLATFORM AND 3
GRID MODERNIZATION PLAN 4
A. Introduction 5
1. Scope and Purpose 6
The purpose of this chapter is to demonstrate that Pacific Gas and 7
Electric Company’s (PG&E or the Company) expense and capital 8
expenditure forecasts for electric distribution projects related to Grid 9
Modernization are reasonable and should be adopted by the California 10
Public Utilities Commission (CPUC or Commission). 11
To support PG&E’s objective of providing secure, reliable, and resilient 12
electricity that enables continued gains for clean energy technology and 13
California’s economy in a way that gives our customers value, flexibility, and 14
choice in how they use energy, PG&E needs to continue to improve its 15
existing infrastructure and invest in new technologies. PG&E’s critical 16
systems like Supervisory Control and Data Acquisition (SCADA) and its 17
communication network must be improved in order to manage the growing 18
number of devices on a more dynamic grid. At the same time, climate 19
change and cybersecurity issues present new threats to the electric grid to 20
which utilities throughout California, and the entire United States, must 21
adapt. 22
In addition, the growth of Distributed Energy Resources (DER), such as 23
distributed rooftop solar, behind-the-meter (BTM) energy storage, and 24
electric vehicles, is creating a foundational paradigm shift in the electric grid 25
as some consumers of electricity also become generators of electricity who 26
both benefit from the grid and deliver benefits to it. Through the 27
Commission-led Distribution Resources Plan (DRP) proceeding, PG&E 28
continues to evaluate opportunities for enabling cost-effective DERs to be a 29
part of reliable planning, operations, and investment processes. 30
Specifically, as directed by the Commission’s decision (Decision 31
(D.) 18-02-004), PG&E submits annual Grid Needs Assessment (GNA) and 32
Distribution Deferral Opportunity (DDOR) reports. These reports provide 33
(PG&E-4)
21-2
transparency into the assumptions and results of PG&E’s distribution 1
planning process that yield a candidate deferral shortlist, proposed Grid 2
Modernization investments, and proactive hosting capacity upgrades 3
proposed to accommodate forecast DER growth. PG&E filed its most recent 4
GNA1 and DDOR2 reports on August 17, 2020. 5
The Commission’s March 2018 Grid Modernization Decision 6
(D.18-03-023) requires all investor-owned utilities (IOU) to submit a “Grid 7
Modernization Plan” in their General Rate Case (GRC) filings that provides a 8
10-year Grid Modernization vision and information for each proposed grid 9
modernization program as described in Appendix A of the decision. This 10
decision defined Grid Modernization expenditures as those having “any 11
relationship with DER integration.”3 This chapter presents PG&E’s forecast 12
for electric distribution investments related primarily to Grid Modernization; 13
additional Grid Modernization-related investments are located in other 14
chapters within Exhibit (PG&E-4). In compliance with the Commission’s 15
requirements, and consistent with PG&E’s approach in the 2020 GRC, 16
tables demonstrating the location and cost of all the Grid Modernization 17
investments in PG&E’s 2023 GRC filing are included as workpapers.4 18
The project portfolio presented in this chapter is a program of 19
investments that will facilitate both DER enablement and safe and reliable 20
operation of the electric grid. The goal of these projects is to modernize 21
PG&E’s grid with improved situational awareness, operational efficiency, 22
cybersecurity, and DER integration capabilities to meet today’s challenges 23
while also positioning the grid to meet the demands of a dynamic energy 24
future. PG&E uses the term “Integrated Grid Platform” (IGP) throughout the 25
chapter to refer to the closely linked Advanced Distribution Management 26
System (ADMS), Distributed Energy Resource Management System 27
1 PG&E’s 2020 Grid Needs Assessment (Aug. 17, 2020), at
<https://pgera.azurewebsites.net/Regulation/ValidateDocAccess?docID=619783> (as of June 15, 2021).
2 PG&E’s 2020 Distribution Deferral Opportunity Report (Aug. 17, 2020), at <https://pgera.azurewebsites.net/Regulation/ValidateDocAccess?docID=619785> (as of June 15, 2021).
3 D.18-03-023, p. 8. 4 See Exhibit (PG&E-4) WP 21-14 and WP 21-16.

(PG&E-4)
21-3
(DERMS), and IGP Information Technology (IT) Infrastructure projects, 1
which together will constitute an efficient and modern operational platform 2
capable of responding to emergent challenges posed by DERs and 3
cybersecurity threats. Other proposed investments in this chapter, including 4
Distribution Engineering Planning Tools, the Community Microgrid 5
Enablement Program (CMEP), the Electric Emerging Technology Program, 6
and the Elkhorn Battery Energy Storage System5 are Grid 7
Modernization-related, but not considered part of “IGP” because they are not 8
related to real-time distribution grid operations. 9
To provide the context for the Grid Modernization requests in this 10
chapter, PG&E’s 10-year Grid Modernization vision and strategy is included 11
in Attachment A to this chapter. While its fundamentals are unlikely to 12
change, PG&E’s vision will evolve in parallel with the direction of California’s 13
energy policy as PG&E continues to work with customers, regulators, and 14
technology providers to build a safe, reliable, and resilient grid. As required 15
by the Commission, PG&E conducted a workshop on its Grid Modernization 16
Plan on April 26, 2021; this chapter reflects PG&E’s presentation at that 17
workshop and considers the input provided by stakeholders at the 18
workshop. 19
2. Summary of Request 20
PG&E requests that the Commission adopt its 2023 expense forecast 21
of $49.1 million to support PG&E’s Grid Modernization Plan, including 22
ADMS, DERMS, CMEP, Distribution Engineering Planning Tools, 23
Distribution Deferral Non-Procurement Costs, IGP IT Infrastructure, and the 24
Electric Emerging Technology Program. PG&E’s 2023 expense forecast is 25
$23.9 million more than its 2020 recorded costs of $25.2 million.6 26
Additionally, PG&E requests that the Commission adopt its capital 27
expenditure forecast of $104.4 million in 2021, $147.9 million in 2022, 28
$131.7 million in 2023, $89.0 million in 2024, $42.2 million in 2025, and 29
$43.4 million in 2026 to support foundational investments in PG&E’s IGP 30
5 The Elkhorn Battery Energy Storage System is also known as the Moss Landing Battery
Energy Storage System. 6 See Exhibit (PG&E-4), WP 21-1, line 6.
(PG&E-4)
21-4
and Grid Modernization plan. PG&E’s 2023 capital forecast is $26.0 million 1
less than its 2020 recorded costs of $157.6 million.7 2
Note that this summary of PG&E’s request does not include the expense 3
or capital forecasts for the Elkhorn Battery Energy Storage System in the 4
years 2021-2023 because they are market sensitive. PG&E will describe 5
the work in this chapter, but the full project forecast is being provided in a 6
confidential appendix.8 7
Forecasts in this chapter are shown with escalation at the Major Work 8
Category (MWC) level and escalation is included in all expense and capital 9
totals. For more information on escalation, please refer to Chapter 2 of this 10
exhibit. 11
3. Overview of Recorded and Forecast Costs 12
PG&E uses the MWCs shown in Table 21-1 to record Grid 13
Modernization-related expenditures for capital and expense. 14
7 See Exhibit (PG&E-4), WP 21-6, line 9. 8 See Exhibit (PG&E-4), Appendix A.

(PG&E-4)
21-5
TABLE 21-1 GRID MODERNIZATION MWCs
Line No. MWCs Description
1 Expense MWCs
2 HG Tracks Distribution Operation Technology-related expenses, including Ch. 21 forecast for ADMS and DERMS.
3 JV Tracks IT-related expenses, including Ch. 21 forecast for IGP IT Infrastructure and non-DRP-related Distribution Engineering Planning Tools.
4 AT Tracks expenses associated with Research and Development (R&D) activities, including Ch. 21 recorded costs for the Electric Program Investment Charge (EPIC) Program and forecast for the Electric Emerging Technology Program.
5 AB Tracks miscellaneous expenses, including Ch. 21 forecast for the Elkhorn Battery Energy Storage System, CMEP beginning in 2023, and DRP-related Distribution Engineering Planning Tools.
6 IG Tracks expenses associated with miscellaneous balancing or memorandum accounts, including Ch. 21 forecast for CMEP through 2022 and DRP Non-Procurement Costs.
7 Capital MWCs
8 63 Tracks Distribution Operation Technology capital investments, including Ch. 21 forecast for ADMS and DERMS.
9 2F Tracks IT capital investments, including Ch. 21 forecast for IGP IT Infrastructure and non-DRP-related Distribution Engineering Planning Tools.
10 21 Tracks miscellaneous capital investments, including Ch. 21 forecast for DRP-related Distribution Engineering Planning Tools.
11 3M Tracks capital investments associated with miscellaneous balancing or memorandum accounts, including Ch. 21 recorded costs related to the Smart Grid Pilot Project.
12 3R Tracks energy storage capital investments, including Ch. 21 forecast for the Elkhorn Battery Energy Storage System.
13 82 Tracks capital investments associated with Transmission interconnection, including Gen-Tie work for the Elkhorn Battery Energy Storage System.
a. Expense 1
Figure 21-1 shows the walk from 2020 recorded expenses to the 2
2023 expense forecast. This figure includes costs that are subject to 3
recovery on a recorded basis through accounts including the Distributed 4
Energy Resources Distribution Deferral Account (DERDDA), Avoided 5
Costs Calculator Update Memorandum Account (ACCUMA), Distribution 6
Resources Plan Tools Memorandum Account (DRPTMA), New System 7
Generation Balancing Account (NSGBA), and the Microgrids 8
Memorandum Account (MGMA). These amounts are included for 9
(PG&E-4)
21-6
trending purposes because the activity will become GRC funded 1
beginning in 2023. 2
PG&E’s 2023 forecast of $49.1 million is $23.9 million higher than its 3
2020 recorded expenses of $25.2 million.9 Reasons for the increase 4
between 2020 and 2023 include: an increase in ADMS activity 5
associated with the initiation of activities associated with Outage 6
Management System (OMS) replacement and Advanced Application 7
implementation, an increase in CMEP program activity, and an increase 8
in non-procurement costs for DRP distribution deferral projects. There 9
is an additional increase due to the beginning of operations and 10
maintenance (O&M) on the Elkhorn Battery Energy Storage System 11
which is not shown here but which is described in confidential 12
Appendix A.10 13
9 See Exhibit (PG&E-4), WP 21-1, line 6. 10 See Exhibit (PG&E-4), Appendix A.
(PG&E-4)
21-7
FIGURE 21-1 EXPENSE WALK 2020-2023
(THOUSANDS OF NOMINAL DOLLARS)
b. Capital 1
Figure 21-2 shows 2020 recorded capital expenditures and the 2
capital forecast for 2021-2026.11 This figure includes costs that are 3
subject to recovery on a recorded basis through accounts including the 4
DRPTMA and the NSGBA; these amounts are included for trending 5
purposes because the activity will become GRC funded beginning in 6
2023. 7
PG&E’s 2023 forecast of $131.7 million is $26.0 million lower than 8
the 2020 recorded costs of $157.6 million.12 The primary reasons for 9
the decrease are the conclusion of construction on the Elkhorn Battery 10
Energy Storage System and a reduction in spending on IT 11
11 Some values vary from the values listed in the Results of Operations (RO) Model due to
errata. These amounts do not align to the RO Model provided to the Public Advocates Office at the time of filing. The RO will be updated to incorporate these errata with the Joint Comparison Exhibit submittal.
12 See Exhibit (PG&E-4) WP 21-6, line 9.
(PG&E-4)
21-8
Infrastructure, which outweighed increases in ADMS Program spending 1
related to the initiation of activities associated with OMS replacement 2
and Advanced Application implementation. 3
FIGURE 21-2 CAPITAL RECORDED AND FORECAST 2020-2026
(THOUSANDS OF NOMINAL DOLLARS)
c. Cost Allocation 4
Consistent with the allocation of electric distribution-related capital 5
and expense costs generally for recovery in electric distribution rates 6
under GRC decisions and decisions in the DRP and Integrated 7
Distributed Energy Resources (IDER) proceedings, the costs of Grid 8
Modernization and DRP/IDER-related distribution deferral and 9
administrative costs should be allocated for recovery in electric 10
distribution rates in this GRC.13 These costs should be allocated to 11
electric distribution rates because bundled and non-bundled customers 12
will share equally in all Grid Modernization program benefits, including 13
benefits related to cybersecurity, reliability, safety, energy savings, 14
13 An exception is the cost associated with the Elkhorn Battery Energy Storage System,
described in Section C.5, which is recovered via the NGSBA.
(PG&E-4)
21-9
improved management of DER-related grid issues, and enablement of 1
DER-provided grid services. Moreover, the real-time data produced by 2
PG&E’s Grid Modernization investments do not advantage PG&E in 3
identifying DER siting opportunities14 or within any future distribution 4
market construct wherein DER dispatch is governed by 5
ownership-agnostic optimization algorithms. 6
4. Support for Request 7
PG&E’s expense and capital forecasts in this chapter are reasonable 8
because they are required to reduce cybersecurity risk and address 9
challenges stemming from an increasing number of DERs on the grid. 10
Specifically, the benefits enabled by this chapter’s forecast include: 11
Reduced cybersecurity risk from replacement of the antiquated 12
Real-Time Supervisory Control and Data Acquisition (RT-SCADA) 13
system; 14
Improved management of DER-related grid issues through awareness 15
of masked load and thermal, voltage, and protection issues; 16
Dispatch of DER to mitigate real-time and forecasted grid constraints; 17
Reliability improvements from ADMS fault location and automated 18
switching capabilities; 19
Operational efficiency improvements through automation of manual 20
tasks in ADMS; 21
Reduced lifecycle technology cost through consolidation of disparate 22
grid management applications into an ADMS; 23
Upgraded IT infrastructure to more reliably transmit larger volumes of 24
data; 25
Planning tools that will enable PG&E to fully analyze grid impacts of 26
DER; 27
Engineering and design support for community microgrids; and 28
Continuation of PG&E’s electric technology R&D work. 29
14 PG&E publicly shares the Locational Net Benefits Analysis (LNBA), Integration Capacity
Analysis (ICA), GNA, and DDOR data that are useful in identifying DER siting opportunities.

(PG&E-4)
21-10
PG&E’s Grid Modernization forecast builds on past investments and 1
R&D and takes a cost-conscious, conservative approach to create a 2
foundation for modern grid operations. 3
5. Organization of the Remainder of This Chapter 4
The remainder of the chapter is organized as follows: 5
Section B – Program and Risk Overview; 6
Section C – Activities, Costs, and Forecast Drivers by MWC; 7
Section D – Estimating Methods; 8
Section E – Compliance with Prior Commission Decisions; 9
Section F – Balancing and Memorandum Accounts; 10
Section H – Cost Tables; 11
Attachment A – PG&E’s Grid Modernization Plan – 10 Year Vision; 12
Attachment A1 – Grid Modernization Plan – Upgrades Initiated or 13
Completed to Date; 14
Attachment A2 – DER-Related Research, Development, and 15
Demonstration Projects; and 16
Attachment A3 – Community Microgrid Enablement Program Evaluation. 17
B. Program and Risk Overview 18
1. Program Description 19
a. Program Overview 20
This chapter presents a diverse portfolio of projects that help PG&E 21
respond to the challenges and opportunities presented by the growing 22
adoption of DER on the grid. When fully implemented, these projects 23
will prepare PG&E to respond to DER-driven challenges on three key 24
time scales: 25
Real-Time/Operational – The IGP, including ADMS, DERMS, and IT 26
Infrastructure, will provide PG&E with the grid management tools 27
and communications infrastructure needed to promote awareness 28
of, and effective responses to, DER-related issues occurring in 29
real-time. DERMS will enable PG&E to proactively dispatch DER in 30
response to grid issues, effectively harnessing the ability of DER to 31
serve as a positive force on the distribution grid, rather than as a 32
source of issues that need to be managed. 33

(PG&E-4)
21-11
Medium-Term/Planning – The Distribution Planning Tool 1
enhancement work in this chapter will provide PG&E with the 2
analytical capabilities needed to plan grid infrastructure upgrades or 3
deferrals amid the heightened complexity driven by the time-of-day 4
and seasonal variability of DER. Additionally, the CMEP will bring 5
PG&E engineering expertise to bear to help plan the development of 6
microgrids. 7
Long-Term/R&D – The Emerging Electric Technology Program will 8
assist DER integration capability in the longer term through field 9
demonstration of emerging technologies, a vital first step to scaling 10
any new technology within core Company operations. 11
Although the projects presented in this chapter are largely driven by 12
the need to accommodate DER, they provide many additional benefits. 13
These benefits include improved cybersecurity and reliability 14
performance, increased operational efficiency, integration of mission 15
critical operational tools, reduced technical debt, improved safety, more 16
targeted and efficient Public Safety Power Shutoffs (PSPS), and 17
non-DER-related R&D in areas such as safety, reliability, resiliency, and 18
affordability. 19
b. Management Structure 20
The Grid Modernization projects in this chapter will be managed by 21
various teams across PG&E: 22
ADMS and DERMS are cross-functional programs centrally 23
managed by the witness—the Director of the IGP Program, under 24
Transmission Operations—and implemented in conjunction with 25
Distribution Asset Management, Distribution Operations, Distribution 26
Engineering, and various IT organizations; 27
The Infrastructure and Operations team within PG&E’s IT 28
organization manages deployment of IT Infrastructure improvements 29
discussed in this chapter; 30
Distribution Engineering Planning Tools projects are managed by 31
PG&E’s Asset Planning and Integrated Grid Planning teams; 32
CMEP will be managed by the Microgrid Policy & Pricing Strategy 33
team within PG&E’s Energy Strategy and Innovation Group; 34
(PG&E-4)
21-12
The Electric Emerging Technology Program is managed by the 1
Emerging Technology Strategy and Programs team within PG&E’s 2
Asset Knowledge Management organization, the same team that 3
currently manages PG&E’s EPIC Program; and 4
The Elkhorn Battery Energy Storage System is managed by the 5
Major Projects and Programs team within Electric Operations (EO). 6
2. Risk Integration 7
Risk controls and mitigations are aligned to various MWCs and MATs in 8
Electric Distribution. None of the MWCs presented in this chapter 9
correspond to a risk mitigation or risk control that address a risk on Electric 10
Operation’s Corporate Risk Register. More information about risk 11
mitigations and controls is in PG&E’s Electric Distribution Risk Management 12
testimony (Exhibit (PG&E-4), Chapter 3). 13
C. Activities, Costs and Forecast Drivers by MWC 14
1. Distribution Planning Programs 15
a. Distribution Engineering Planning Tools 16
Distribution planning is becoming increasingly complex as new 17
sources of data need to be integrated to support accurate system 18
modeling. Advanced planning tools are the foundation for well-planned 19
grid infrastructure improvements because they will allow PG&E to 20
evaluate a wider variety of scenarios and conditions created by an 21
increasingly dynamic and distributed electric grid. The advanced 22
capabilities required include the ability to forecast load under a variety of 23
scenarios and the ability to perform time series analysis of the 24
distribution system (i.e., conditions at many different times of day or 25
year, or in varying weather conditions) to forecast long-term and 26
near-term planning deficiencies and constraints. 27
PG&E’s Distribution Engineering Planning Tools forecast is split 28
between tool development work driven by DRP compliance, which is 29
tracked in MWCs 21 and AB, and tool enhancements driven by business 30
needs unrelated to the DRP, which are tracked in MWCs 2F and JV. 31
(PG&E-4)
21-13
Planning Tool Development Driven by DRP Compliance 1
Multiple tracks within the DRP15 have required the creation and use 2
of new tools including Integration Capacity Analysis (ICA),16 Locational 3
Net Benefit Analysis (LNBA),17 and the DRP Data Portal.18 The DRP 4
also required the ongoing analysis and publication of distribution data 5
via the GNA and DDOR annual reports.19 The scale of the data and 6
analysis requires specific and customized tools to process and promote 7
data quality and accuracy. 8
These requirements from the DRP require PG&E to make upgrades 9
to existing planning tools, including CYME, a tool used by PG&E 10
engineers to model power flows on the distribution grid, study scenarios, 11
and plan grid reconfigurations or upgrades, and LoadSEER, the 12
Company’s core load forecasting tool. The new functionalities delivered 13
by this project will include: 14
Scenario Planning – Studying distribution system impacts across 15
various forecast and planning scenarios. 16
Load Forecasting Enhancements – Forecasting load more 17
granularly, at the line section level, and performing short-term load 18
forecasts for DER dispatch. 19
Tools Integration – Eliminating manual processes by automating the 20
integration of various distribution planning tools. 21
Report Process Management – Automating the process and 22
creation of Distribution Investment Deferral Framework (DIDF) 23
reports. 24
Non-DRP-Related Distribution Planning Tool Enhancements 25
This project proposes several enhancements to the CYME 26
application and study process driven by business needs unrelated to the 27
DRP. The forecast in MWCs 2F and JV through 2022 covers the 28
15 Order Instituting Rulemaking (OIR), R.14-08-013 (Aug. 20, 2014). 16 D.17-09-026. 17 D.17-09-026. 18 D.18-02-004. 19 D.18-02-004.
(PG&E-4)
21-14
“Distribution Engineering Planning Tools” project described in the 2020 1
GRC. The 2023-2026 forecast for these MWCs covers the following 2
new projects: 3
CYME Substation Modeling & Analysis – This project will model the 4
distribution substation within CYME, including, but not limited to, 5
substation transmission protective devices at the interface between 6
transmission and distribution, transformer banks, substation buses, 7
and distribution breakers. Adding new substation components into 8
the CYME model will allow for additional analyses to be performed 9
within the CYME application. The current process requires 10
engineers to do some of the substation-level analyses outside of 11
CYME, either in separate protection analysis tools, spreadsheets, or 12
on paper. Further incorporating the substation model into 13
distribution planning software allows engineers to further study 14
within CYME bank and feeder level upgrades, bank and feeder loss 15
studies, substation elements of the distribution protection studies, 16
and bank and feeder capability ratings. 17
Distribution Time-Series Analysis Phase 2 – This project will build 18
upon the successful implementation of the CYME Time-Series Load 19
Flow Analysis project and further automate the distribution planning 20
process. This project will extend the existing time-series analysis to 21
assist with Voltage Regulator and Capacitor optimization and Risk 22
Prioritization. Additionally, this project will investigate the use of the 23
Advanced Project Manager, results from the time-series analysis, 24
and the technoeconomic analysis module to generate standardized 25
and templated project authorization documentation. 26
Distribution Planning Automation – The Distribution Planning 27
Automation project will develop a manage-by-exception analysis 28
process within CYME for capacity planning study deficiencies. 29
Circuit analyses will be initiated and reviewed at the dashboard 30
level, allowing engineers to focus their review on circuits with 31
forecasted deficiencies. Distribution planning tools will also be 32
further integrated with two-way information flow. 33
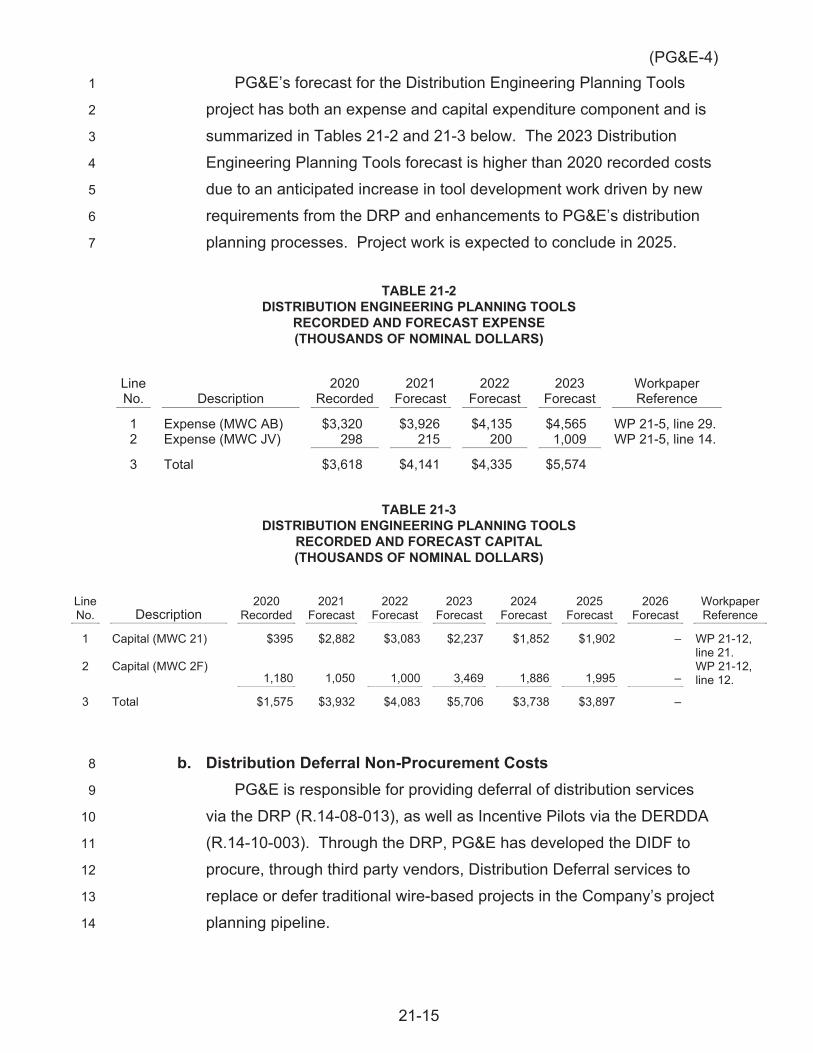
(PG&E-4)
21-15
PG&E’s forecast for the Distribution Engineering Planning Tools 1
project has both an expense and capital expenditure component and is 2
summarized in Tables 21-2 and 21-3 below. The 2023 Distribution 3
Engineering Planning Tools forecast is higher than 2020 recorded costs 4
due to an anticipated increase in tool development work driven by new 5
requirements from the DRP and enhancements to PG&E’s distribution 6
planning processes. Project work is expected to conclude in 2025. 7
TABLE 21-2 DISTRIBUTION ENGINEERING PLANNING TOOLS
RECORDED AND FORECAST EXPENSE (THOUSANDS OF NOMINAL DOLLARS)
Line No. Description
2020 Recorded
2021 Forecast
2022 Forecast
2023 Forecast
Workpaper Reference
1 Expense (MWC AB) $3,320 $3,926 $4,135 $4,565 WP 21-5, line 29. 2 Expense (MWC JV) 298 215 200 1,009 WP 21-5, line 14.
3 Total $3,618 $4,141 $4,335 $5,574
TABLE 21-3 DISTRIBUTION ENGINEERING PLANNING TOOLS
RECORDED AND FORECAST CAPITAL (THOUSANDS OF NOMINAL DOLLARS)
Line No. Description
2020 Recorded
2021 Forecast
2022 Forecast
2023 Forecast
2024 Forecast
2025 Forecast
2026 Forecast
Workpaper Reference
1 Capital (MWC 21) $395 $2,882 $3,083 $2,237 $1,852 $1,902 – WP 21-12, line 21.
2 Capital (MWC 2F) 1,180 1,050 1,000 3,469 1,886 1,995 –
WP 21-12, line 12.
3 Total $1,575 $3,932 $4,083 $5,706 $3,738 $3,897 –
b. Distribution Deferral Non-Procurement Costs 8
PG&E is responsible for providing deferral of distribution services 9
via the DRP (R.14-08-013), as well as Incentive Pilots via the DERDDA 10
(R.14-10-003). Through the DRP, PG&E has developed the DIDF to 11
procure, through third party vendors, Distribution Deferral services to 12
replace or defer traditional wire-based projects in the Company’s project 13
planning pipeline. 14
(PG&E-4)
21-16
To comply with these requirements, PG&E administers the DIDF to 1
select the best candidates for potential deferral of distribution services. 2
The culmination of this process is procurement of distribution deferral 3
services via a Request for Offers (RFO) from third parties. Per 4
Commission direction (D.16-12-036 and D.18-02-004), the direct 5
procurement and administrative costs associated with these contracts 6
may be recovered in the GRC as recorded in the DERDDA, but no such 7
costs are included in this GRC because no actual procurement costs 8
have yet been incurred. The forecast for this GRC period therefore only 9
includes the non-procurement administrative costs associated with 10
these contracts, which were also directed to be recovered in the GRC 11
per D.16-12-036 and D.18-02-004. 12
PG&E has followed the specific CPUC compliance requirements of 13
the DRP (R.14-08-013) and the DERDDA (formerly the Integrated 14
Distributed Energy Resources Account (IDERA)) to track 15
non-procurement costs. These non-procurement costs encompass both 16
the DERDDA incentive pilots, as well as the DRP DIDF DER Projects. 17
The forecast also includes payments made by PG&E to contractors 18
for updates to the Avoided Cost Calculator. Commission decision 19
D.16-06-007 directed PG&E to track these costs in the ACCUMA and 20
recover these costs in the GRC. 21
In summary, the non-procurement costs covered by this forecast 22
include but are not limited to: 23
The solicitation process (including RFOs); 24
Development and administration of contracts; 25
Ongoing testing and validation of deployed DERs; 26
Ongoing project and contract management costs; 27
Contingency planning costs, developed in conjunction with PG&E’s 28
Distribution Planning group, to enable continued operation of the 29
grid; and 30
Costs associated with updates to the Avoided Cost Calculator. 31
The forecast for Distribution Deferral Non-Procurement costs only 32
has an expense component, and is summarized in Table 21-4, below. 33
The 2023 forecast is higher than 2020 recorded costs due to an 34
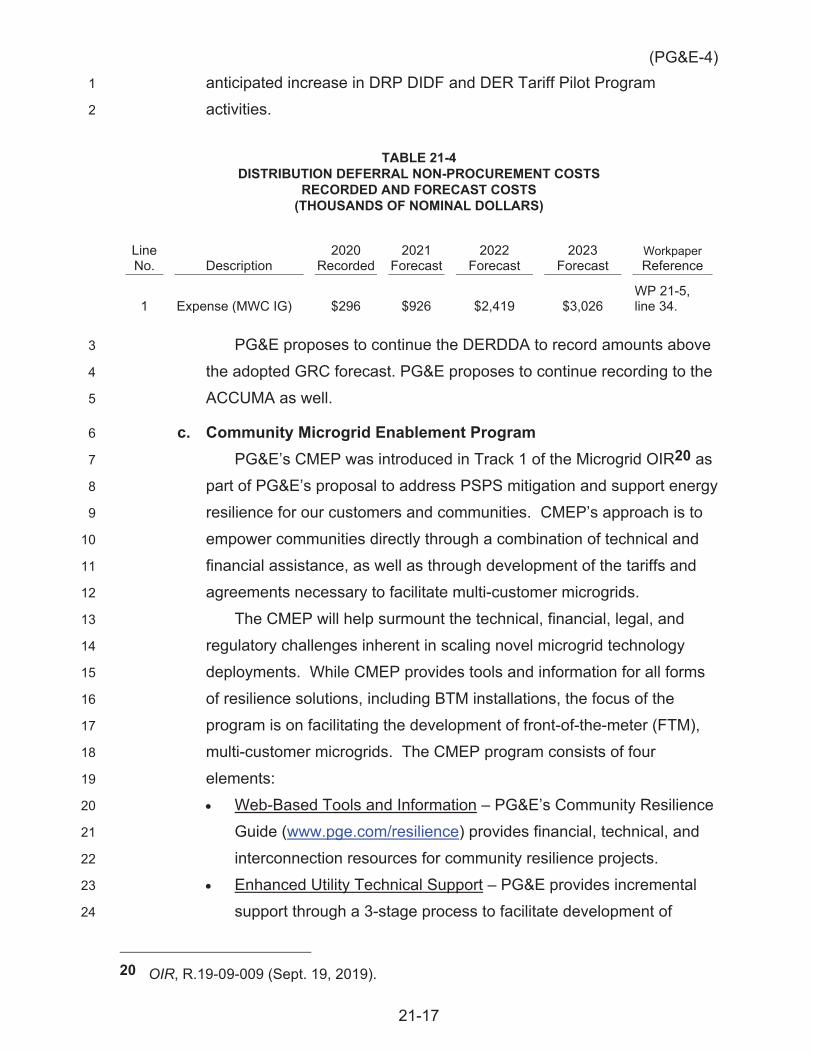
(PG&E-4)
21-17
anticipated increase in DRP DIDF and DER Tariff Pilot Program 1
activities. 2
TABLE 21-4 DISTRIBUTION DEFERRAL NON-PROCUREMENT COSTS
RECORDED AND FORECAST COSTS (THOUSANDS OF NOMINAL DOLLARS)
Line No. Description
2020 Recorded
2021 Forecast
2022 Forecast
2023 Forecast
Workpaper Reference
1 Expense (MWC IG) $296 $926 $2,419 $3,026 WP 21-5, line 34.
PG&E proposes to continue the DERDDA to record amounts above 3
the adopted GRC forecast. PG&E proposes to continue recording to the 4
ACCUMA as well. 5
c. Community Microgrid Enablement Program 6
PG&E’s CMEP was introduced in Track 1 of the Microgrid OIR20 as 7
part of PG&E’s proposal to address PSPS mitigation and support energy 8
resilience for our customers and communities. CMEP’s approach is to 9
empower communities directly through a combination of technical and 10
financial assistance, as well as through development of the tariffs and 11
agreements necessary to facilitate multi-customer microgrids. 12
The CMEP will help surmount the technical, financial, legal, and 13
regulatory challenges inherent in scaling novel microgrid technology 14
deployments. While CMEP provides tools and information for all forms 15
of resilience solutions, including BTM installations, the focus of the 16
program is on facilitating the development of front-of-the-meter (FTM), 17
multi-customer microgrids. The CMEP program consists of four 18
elements: 19
Web-Based Tools and Information – PG&E’s Community Resilience 20
Guide (www.pge.com/resilience) provides financial, technical, and 21
interconnection resources for community resilience projects. 22
Enhanced Utility Technical Support – PG&E provides incremental 23
support through a 3-stage process to facilitate development of 24
20 OIR, R.19-09-009 (Sept. 19, 2019).
(PG&E-4)
21-18
multi-customer microgrids from initial concept exploration, through 1
solution assessment, to solution execution. 2
Community Microgrid Enablement Tariff – PG&E submitted a pro 3
forma tariff in Advice Letter 5918-E to govern the eligibility, 4
development, and island and transitional operation of community 5
microgrids. 6
Cost Offsets – PG&E will offset the cost of equipment necessary to 7
enable the safe islanding of a community microgrid, up to $3 million 8
per project. 9
In D.20-06-017, the CPUC approved PG&E’s CMEP request of 10
$6.75 million in capital for 2020, $27 million in capital for 2021, 11
$27 million in capital for 2022, and $3 million in expense for each year 12
2020-2022; the CPUC also authorized PG&E to record CMEP costs in a 13
new MGMA.21 14
In this GRC application, PG&E seeks authorization for the costs 15
associated with maintaining the Web-based Tools and Information and 16
Enhanced Utility Technical Support components of CMEP beyond 2022 17
because it believes that these functions will remain critical to support the 18
growth of multi-customer microgrids. In fact, with the CPUC’s adoption 19
of a new Microgrid Incentive Program (MIP) in Track 2 of the Microgrid 20
OIR,22 which may be approved in its full form in 2022, PG&E anticipates 21
a significant MIP-driven increase in community demand for microgrid 22
development and technical support. As a result, PG&E’s 2023 CMEP 23
expense forecast is higher than its 2020 recorded costs and 2021 and 24
2022 forecast. 25
PG&E does not seek additional capital beyond the funding already 26
authorized in D.20-06-017 for the Cost Offsets portion of CMEP. In 27
accordance with D.20-06-017, Ordering Paragraph 16, PG&E intends to 28
recover costs for CMEP capital and expense through 2022 via a 29
reasonableness review application after such costs have been recorded 30
in the MGMA. 31
21 R.19-09-009, Exhibit (PG&E-1), Ch. 5, p. 5-7, Table 6-1, and p. 5-8, fn. 9. 22 D.21-01-018, Section 3.4, starting at p. 55.
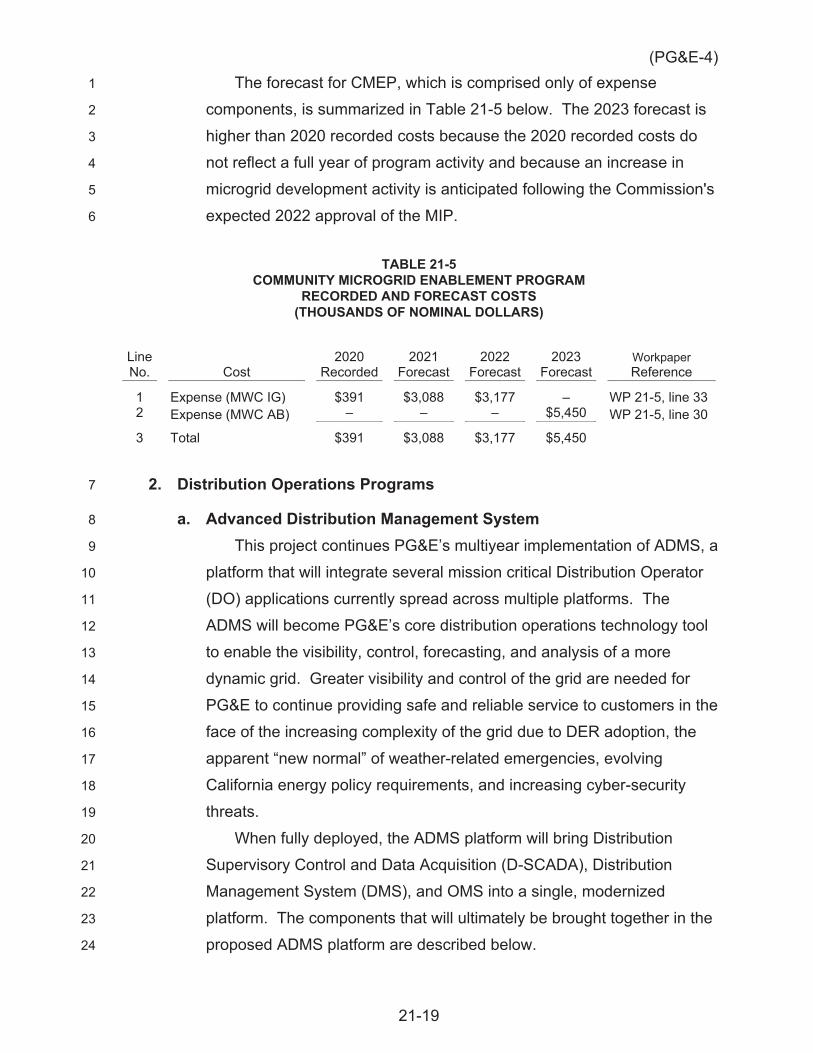
(PG&E-4)
21-19
The forecast for CMEP, which is comprised only of expense 1
components, is summarized in Table 21-5 below. The 2023 forecast is 2
higher than 2020 recorded costs because the 2020 recorded costs do 3
not reflect a full year of program activity and because an increase in 4
microgrid development activity is anticipated following the Commission's 5
expected 2022 approval of the MIP. 6
TABLE 21-5 COMMUNITY MICROGRID ENABLEMENT PROGRAM
RECORDED AND FORECAST COSTS (THOUSANDS OF NOMINAL DOLLARS)
Line No. Cost
2020 Recorded
2021 Forecast
2022 Forecast
2023 Forecast
Workpaper Reference
1 Expense (MWC IG) $391 $3,088 $3,177 – WP 21-5, line 33 2 Expense (MWC AB) – – – $5,450 WP 21-5, line 30
3 Total $391 $3,088 $3,177 $5,450
2. Distribution Operations Programs 7
a. Advanced Distribution Management System 8
This project continues PG&E’s multiyear implementation of ADMS, a 9
platform that will integrate several mission critical Distribution Operator 10
(DO) applications currently spread across multiple platforms. The 11
ADMS will become PG&E’s core distribution operations technology tool 12
to enable the visibility, control, forecasting, and analysis of a more 13
dynamic grid. Greater visibility and control of the grid are needed for 14
PG&E to continue providing safe and reliable service to customers in the 15
face of the increasing complexity of the grid due to DER adoption, the 16
apparent “new normal” of weather-related emergencies, evolving 17
California energy policy requirements, and increasing cyber-security 18
threats. 19
When fully deployed, the ADMS platform will bring Distribution 20
Supervisory Control and Data Acquisition (D-SCADA), Distribution 21
Management System (DMS), and OMS into a single, modernized 22
platform. The components that will ultimately be brought together in the 23
proposed ADMS platform are described below. 24
(PG&E-4)
21-20
D-SCADA – PG&E’s D-SCADA system gathers, processes, and 1
displays systemwide operating data to DOs at control centers. 2
Operators use the system to remotely control and/or operate 3
devices on the distribution network. The D-SCADA system consists 4
of distributed IT network system and server hardware and a growing 5
number of SCADA-enabled field devices which send and receive 6
real-time data over the network. 7
Distribution Management System – DMS is a system that utilities 8
use to maintain an “As-Operated” model of the electric distribution 9
grid and to run advanced applications that analyze and control the 10
grid. Examples of these advanced applications include Fault 11
Location, Isolation, and Service Restoration, Volt/Var Optimization, 12
Restoration Switching Analysis, and Switch Planning and Execution. 13
Outage Management System – OMS is a network model-based 14
system used to identify electrical outage locations and assist in the 15
restoration of power. This system also provides utility customers 16
with updated outage information and is the source for reliability 17
reporting. The accuracy of OMS’s identification of outages is 18
dependent on its network model reflecting the actual as-switched 19
state of the distribution system at any given time. 20
The three primary justifications for the ADMS project highlighted in 21
the 2020 GRC remain in force today: 22
PG&E’s D-SCADA Application Needs to be Replaced. PG&E’s 23
existing D-SCADA application is outdated. RT-SCADA, the current 24
application managing data exchange between field devices, 25
processors/servers, and displays in the Distribution Control Center 26
(DCC), does not have the functionality and cybersecurity features to 27
address future grid conditions, including an increased number of 28
field devices and increased DER penetration. RT-SCADA cannot 29
reliably be integrated with other distribution control applications, 30
cannot support the data volume and advanced applications required 31
for future grid conditions, and is not equipped with best in class 32
cybersecurity defenses. RT-SCADA will be replaced as part of the 33
implementation of ADMS. 34

(PG&E-4)
21-21
Integrating PG&E’s Core Distribution Grid Operational Technologies 1
Will Be Beneficial. Today, DOs use multiple applications 2
concurrently, sometimes manually transferring information between 3
these systems. While this has worked in the past, it is a source of 4
human error, creates duplicative work, and limits PG&E’s ability to 5
use technology to automate processes and drive efficiencies. 6
Implementing an ADMS platform with a common data source for the 7
“As-Operated” grid state and real-time SCADA states will avoid 8
these issues, allowing DOs to perform higher value activities. 9
PG&E’s Distribution Grid Operational Technology Needs to 10
Accommodate Future DER Growth and Evolving California Energy 11
Policy Requirements. PG&E’s existing operating technology is not 12
well-suited to operate the grid as DER penetration increases. 13
PG&E’s D-SCADA and DMS systems were not designed with the 14
grid operating conditions created by high volume and penetration of 15
DERs in mind, nor were they designed to efficiently integrate with 16
other systems envisioned to enable to DERs to provide distribution 17
services, such as DERMS and/or Demand Response Management 18
System (DRMS).23 19
To consolidate all integral ADMS Program work into a single 20
location, in this GRC PG&E has merged two workstreams that were 21
previously forecasted outside of ADMS into the broader ADMS program 22
forecast. These include: 23
ADMS Asset Data – This workstream’s goal is to execute on data 24
enhancement initiatives, including enhancements to Phase ID data, 25
that will directly facilitate the build of the ADMS network model or 26
improve the quality of ADMS power flow solutions. In the 2020 27
GRC, this workstream was forecasted as the “Distribution GIS Asset 28
Data Improvement” project.24 29
23 DRMS is the IT system that processes enrollments, registration to the California
Independent System Operator (CAISO), management of aggregated resources, dispatch events of PG&E’s Demand Response events, and retail settlements.
24 A. 18-12-009, HE-17: Exhibit (PG&E-4), Ch. 19, p. 19-19, line 6 to p. 19-28, line 8.
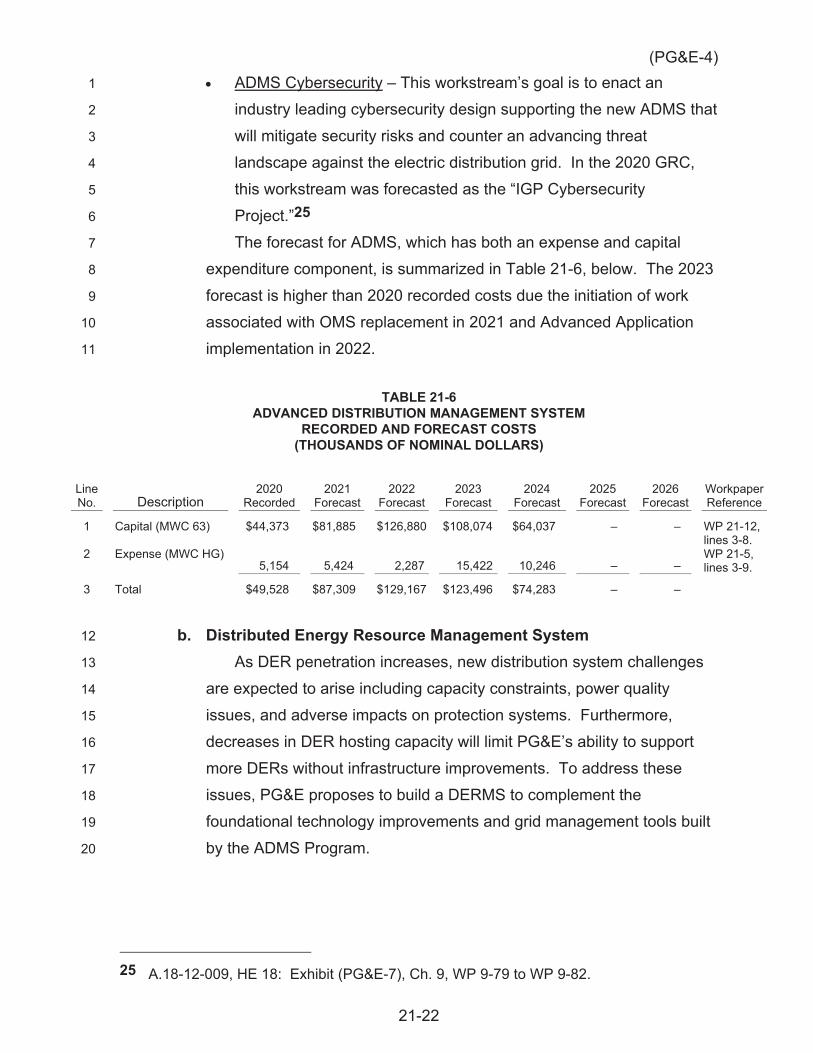
(PG&E-4)
21-22
ADMS Cybersecurity – This workstream’s goal is to enact an 1
industry leading cybersecurity design supporting the new ADMS that 2
will mitigate security risks and counter an advancing threat 3
landscape against the electric distribution grid. In the 2020 GRC, 4
this workstream was forecasted as the “IGP Cybersecurity 5
Project.”25 6
The forecast for ADMS, which has both an expense and capital 7
expenditure component, is summarized in Table 21-6, below. The 2023 8
forecast is higher than 2020 recorded costs due the initiation of work 9
associated with OMS replacement in 2021 and Advanced Application 10
implementation in 2022. 11
TABLE 21-6 ADVANCED DISTRIBUTION MANAGEMENT SYSTEM
RECORDED AND FORECAST COSTS (THOUSANDS OF NOMINAL DOLLARS)
Line No. Description
2020 Recorded
2021 Forecast
2022 Forecast
2023 Forecast
2024 Forecast
2025 Forecast
2026 Forecast
Workpaper Reference
1 Capital (MWC 63) $44,373 $81,885 $126,880 $108,074 $64,037 – – WP 21-12, lines 3-8.
2 Expense (MWC HG) 5,154 5,424 2,287 15,422 10,246 – –
WP 21-5, lines 3-9.
3 Total $49,528 $87,309 $129,167 $123,496 $74,283 – –
b. Distributed Energy Resource Management System 12
As DER penetration increases, new distribution system challenges 13
are expected to arise including capacity constraints, power quality 14
issues, and adverse impacts on protection systems. Furthermore, 15
decreases in DER hosting capacity will limit PG&E’s ability to support 16
more DERs without infrastructure improvements. To address these 17
issues, PG&E proposes to build a DERMS to complement the 18
foundational technology improvements and grid management tools built 19
by the ADMS Program. 20
25 A.18-12-009, HE 18: Exhibit (PG&E-7), Ch. 9, WP 9-79 to WP 9-82.
(PG&E-4)
21-23
Informed by PG&E’s experience implementing DERMS pilots via 1
EPIC projects 2.0226 and 3.03,27 this project will address near-term 2
challenges while also providing flexibility for an evolving future. 3
Specifically, PG&E proposes to build a DERMS that will deliver the 4
following capabilities: 5
Monitoring, Dispatch, and Program Management of DER Systems – 6
DERMS will be a secure platform that enables the monitoring and 7
dispatch of both FTM, BTM, and aggregated DER assets with rules 8
based on program types. DERMS will provide new visibility into 9
DER status, flexibility, availability, and program-level insights, while 10
enabling visibility and control over the large population of smaller 11
DERs without SCADA telemetry. 12
Full Integration with ADMS – DERMS will seamlessly integrate with 13
the ADMS, building on the integrated network model and grid 14
modeling capabilities provided by the core ADMS product. 15
DER Interconnection and Market Participation Facilitation – DERMS 16
will enable more dynamic hosting capacity by managing constraints 17
on DERs including a limited generation profile,28 and other 18
constraints under abnormal conditions. DERMS will also help 19
manage DER impacts at the Transmission and Distribution interface 20
including coordination of wholesale market participants on the 21
distribution system. 22
26 PG&E, EPIC 2.02 – Distributed Energy Resource Management System (Jan. 18, 2019),
at <https://www.pge.com/pge_global/common/pdfs/about-pge/environment/what-we-are-doing/electric-program-investment-charge/PGE-EPIC-2.02.pdf> (accessed May 23, 2021).
27 PG&E’s Application For Approval of Its 2018- 2020 Electric Program Investment Charge Investment Plan, A.17-04-028 (Apr. 28, 2017), at <https://www.pge.com/pge_global/common/pdfs/about-pge/environment/what-we-are-doing/electric-program-investment-charge/EPIC-3-Application-PGE.pdf> (accessed May 23, 2021).
28 A limited generation profile is described in Issue 9 of D.20-09-035 (see Section 4.3.3). It provides the capability to limit a customer’s generation based on a profile that changes temporally. Decision link, at <https://docs.cpuc.ca.gov/PublishedDocs/Published/G000/M347/K953/347953769.PDF> (accessed June 7, 2021).
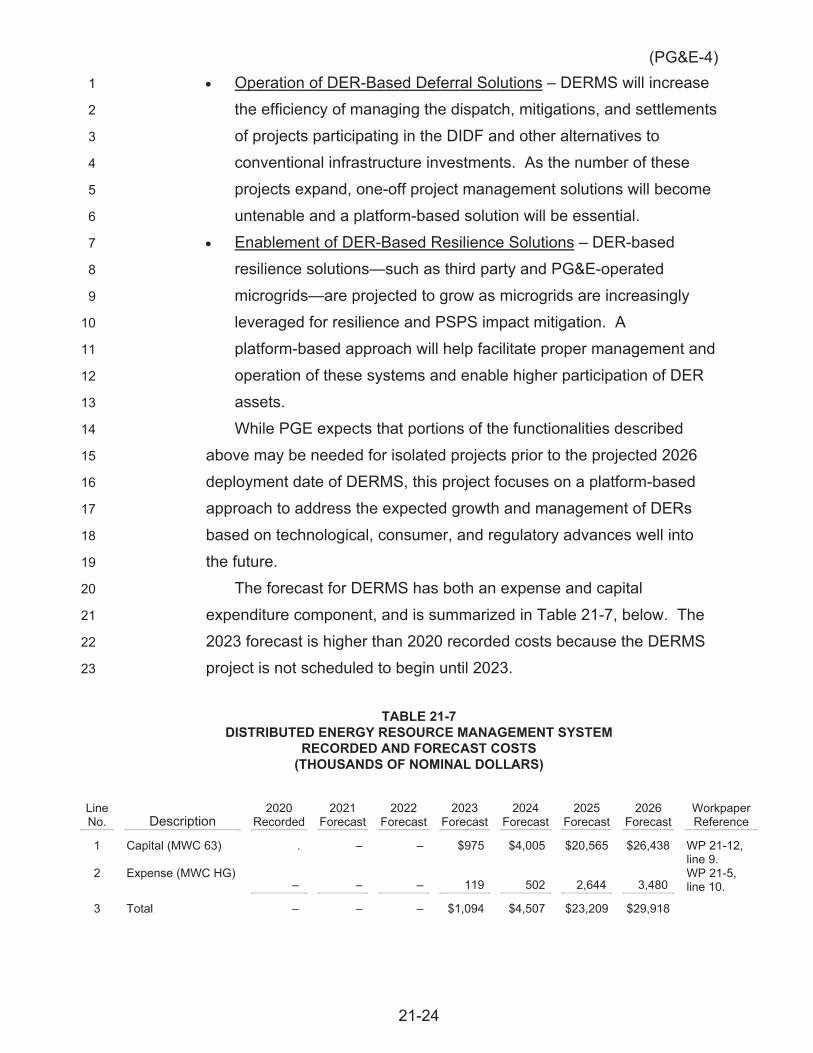
(PG&E-4)
21-24
Operation of DER-Based Deferral Solutions – DERMS will increase 1
the efficiency of managing the dispatch, mitigations, and settlements 2
of projects participating in the DIDF and other alternatives to 3
conventional infrastructure investments. As the number of these 4
projects expand, one-off project management solutions will become 5
untenable and a platform-based solution will be essential. 6
Enablement of DER-Based Resilience Solutions – DER-based 7
resilience solutions—such as third party and PG&E-operated 8
microgrids—are projected to grow as microgrids are increasingly 9
leveraged for resilience and PSPS impact mitigation. A 10
platform-based approach will help facilitate proper management and 11
operation of these systems and enable higher participation of DER 12
assets. 13
While PGE expects that portions of the functionalities described 14
above may be needed for isolated projects prior to the projected 2026 15
deployment date of DERMS, this project focuses on a platform-based 16
approach to address the expected growth and management of DERs 17
based on technological, consumer, and regulatory advances well into 18
the future. 19
The forecast for DERMS has both an expense and capital 20
expenditure component, and is summarized in Table 21-7, below. The 21
2023 forecast is higher than 2020 recorded costs because the DERMS 22
project is not scheduled to begin until 2023. 23
TABLE 21-7 DISTRIBUTED ENERGY RESOURCE MANAGEMENT SYSTEM
RECORDED AND FORECAST COSTS (THOUSANDS OF NOMINAL DOLLARS)
Line No. Description
2020 Recorded
2021 Forecast
2022 Forecast
2023 Forecast
2024 Forecast
2025 Forecast
2026 Forecast
Workpaper Reference
1 Capital (MWC 63) . – – $975 $4,005 $20,565 $26,438 WP 21-12, line 9.
2 Expense (MWC HG) – – – 119 502 2,644 3,480
WP 21-5, line 10.
3 Total – – – $1,094 $4,507 $23,209 $29,918
(PG&E-4)
21-25
3. IGP IT Infrastructure 1
Deploying the new planning and operational technologies described in 2
this chapter will substantially increase the volume of data traffic necessary to 3
operate the electric system. It will also increase demand for low latency 4
data transmission, which is necessary for real-time visibility and control of 5
the grid. To satisfy these needs, PG&E requires modern, secure 6
communications and computing infrastructure with adequate capacity, 7
coverage, scalability, and resiliency. To this end, PG&E plans to continue 8
several foundational investments to modernize and expand its IT 9
infrastructure.29 10
These investments primarily involve PG&E’s multi-purpose 11
telecommunications network, which connects the people, information, 12
devices, and autonomous systems essential to Company operations. Parts 13
of that network currently rely on outdated technologies that were not 14
designed to support the volume of traffic or quantity of devices now being 15
deployed in the field. As the network has aged, many of its individual 16
components are also at increasing risk of failure, which can lead to a loss of 17
real-time visibility. The investments described below will enable PG&E to 18
maintain adequate network reliability, meet increasing demand, and 19
securely connect users and devices at locations across PG&E’s service 20
territory. In addition, investments in computing infrastructure will help 21
ensure that the systems that receive and process data across the network 22
can efficiently scale to meet future growth. PG&E uses a combination of 23
Company-owned network assets, telephone company leases, and carrier 24
technologies (e.g., cellular, satellite) to provide the capacity and resiliency 25
that PG&E’s operating technologies require. 26
These investments in IT infrastructure, which have applications and 27
benefits beyond support for IGP, span several workstreams: 28
Field Area Network (FAN) – This workstream will continue ongoing 29
deployment of a multi-purpose wireless communications network that 30
provides connectivity to PG&E’s data network for field devices—31
29 In the 2020 GRC, the forecast for this work was presented in HE-66: Exhibit (PG&E-7),
Ch. 8, “Information Technology.” For the 2023 GRC, recorded and forecast costs have been centralized in this chapter.
(PG&E-4)
21-26
including automation devices, sensors, and mobile devices used by field 1
personnel—within a several-mile radius of a target field location (such 2
as a substation or service center). The FAN is a scalable and resilient 3
mesh network designed with the capability to meet both current needs 4
and emerging use cases for network connectivity in the field. 5
SCADA Network Reliability Improvements – This workstream will 6
continue ongoing work to modernize the architecture of PG&E’s legacy 7
SCADA communications networks, which are approaching 30 years old, 8
and address associated IT asset failure risks. The work will include the 9
removal or replacement of obsolete and high-failure-rate equipment, 10
unreliable leased wireline circuits, and alternating current-powered 11
network components without battery back-ups, as well as deployment of 12
secondary communication paths to critical sites and devices to improve 13
resiliency and eliminate single points of failure in the SCADA 14
communications network. 15
Substation Converged Compute Platform – This workstream will 16
continue ongoing work to pilot and deploy at select substations a 17
modern, “cloud-like” infrastructure platform that will consolidate and 18
standardize existing, physically separate equipment and supporting 19
software into a smaller, shared physical footprint that can efficiently 20
scale to support future automation and DER demand. This “converged” 21
infrastructure will leverage a modern design similar to the private cloud 22
infrastructure used in PG&E data centers, but it must be adapted to the 23
unique operating environment of an electric substation. 24
Data Center and Control Center Infrastructure Preparation – This 25
workstream will continue ongoing work to support deployment of the 26
ADMS platform at PG&E’s three DCCs and its integration with systems 27
in PG&E data centers by enhancing communications networks at the 28
DCCs, adding capacity to key fiber optic circuits, and deploying alternate 29
communication paths to improve network resiliency and reduce the 30
potential impact of asset failures. This workstream is currently 31
forecasted to conclude in 2021. 32
The forecast for IGP IT Infrastructure, which has both an expense and 33
capital expenditure component, is summarized in Tables 21-8 and 21-9, 34
(PG&E-4)
21-27
below.30 The 2023 forecast is lower than 2020 recorded costs because a 1
decrease in program activity associated with FAN, SCADA Network 2
Reliability Improvement, and Data Center and Control Center Infrastructure 3
is expected to outweigh increases in the Substation Converge Compute 4
Platform program activity. 5
TABLE 21-8 IGP IT INFRASTRUCTURE
RECORDED AND FORECAST EXPENSE (THOUSANDS OF NOMINAL DOLLARS)
Line No. Description
2020 Recorded
2021 Forecast
2022 Forecast
2023 Forecast
Workpaper Reference
1 Expense (MWC JV) $739 $1,130 $2,300 $2,300 WP 21-5, lines 15-18.
TABLE 21-9 IGP IT INFRASTRUCTURE
RECORDED AND FORECAST CAPITAL (THOUSANDS OF NOMINAL DOLLARS)
Line No. Description
2020 Recorded
2021 Forecast
2022 Forecast
2023 Forecast
2024 Forecast
2025 Forecast
2026 Forecast
Workpaper Reference
1 Capital (MWC 2F) $23,993 $18,490 $16,900 $16,900 $17,200 $17,700 $17,000 WP 21-12, lines 14-17.
4. Electric Emerging Technology Program 6
The Electric Emerging Technology Program will identify, develop, and 7
demonstrate emerging but unproven technologies to provide benefits to 8
PG&E’s electric customers and advance California energy policy objectives. 9
This program will allow PG&E to continue its invaluable work in the 10
Technology Demonstration and Deployment area of the EPIC Program in 11
the event that PG&E is not authorized in the EPIC successor program 12
rulemaking (Rulemaking (R.) 19-10-005) to continue as an EPIC 13
administrator beyond the current EPIC 3 cycle. Current EPIC work will end 14
by 2022, and PG&E’s role in demonstrating emerging technologies will 15
30 Certain costs presented in Tables 21-8 and 21-9 are associated with the Information
Technology Asset Failure (ITAF) risk event, mitigation M005 – Multi-Faceted Mitigations described in Exhibit (PG&E-7), Ch. 8, Section B.2.
(PG&E-4)
21-28
remain critical going forward, particularly in support of PG&E and the state’s 1
high-priority wildfire risk mitigation and clean energy goals. If the IOUs are 2
authorized in R.19-10-005 to continue administering their respective EPIC 3
Programs, PG&E will withdraw this program from consideration in the 2023 4
GRC. 5
The program has three primary components: 6
Emerging Technology Projects – Through these projects, PG&E will 7
develop and demonstrate pre-commercial technologies or strategies at a 8
scale sufficiently large and in conditions sufficiently reflective of 9
anticipated actual operating environments to enable appraisal of their 10
operational and performance characteristics and financial risks. 11
Candidate projects and initiatives will be evaluated based on their 12
expected furtherance of safety, reliability, resiliency, customer 13
affordability, and renewable energy integration. 14
External Innovation Partnerships – This area will cover a range of 15
external partnerships and initiatives, including external innovation 16
challenges, industry technology and vendor landscaping, participation in 17
emerging technology consortia, and targeted partnerships with 18
academia and national labs. Maintaining these types of targeted 19
partnerships and initiatives will be critical to not only keeping PG&E 20
appraised of technology trends and promising opportunities, but also 21
enabling PG&E to influence other resources and sources of funding 22
towards addressing the needs of California and PG&E’s customers. 23
Emerging Technology Program Administration – This area will create a 24
central Program Management Office (PMO) to administer the portfolio of 25
emerging technology projects and external innovation partnerships. 26
This PMO would be similar in structure to the centralized governance 27
and enabling services in place for the current EPIC Program. The 28
current EPIC Program caps administrative expenses at 10 percent of 29
overall program spend, and PG&E would similarly cap the expenditures 30
for this Electric Emerging Technology Program. 31
The forecast for the Electric Emerging Technology Program is expense 32
only, and is summarized in Table 21-10, below. The 2023 forecast is higher 33
(PG&E-4)
21-29
than 2020 recorded costs due to the initiation of the External Innovation 1
Partnerships workstream beginning in 2023. 2
TABLE 21-10 ELECTRIC EMERGING TECHNOLOGY PROGRAM
RECORDED AND FORECAST COSTS (THOUSANDS OF NOMINAL DOLLARS)
Line No. Description
2020 Recorded
2021 Forecast
2022 Forecast
2023 Forecast
Workpaper Reference
1 Expense (MWC AT) $14,609 $16,158 $16,653 $17,174 WP 21-5, line 26.
5. Elkhorn Battery Energy Storage System 3
PG&E received approval by the CPUC’s Resolution (Res.) E-4949 to 4
design, permit, construct, and maintain the Elkhorn Battery Energy Storage 5
System (Elkhorn BESS), a lithium-ion battery installation that will deliver 6
182.5 megawatts of power at the point of interconnection at the 7
Moss Landing Substation in Monterey County. The project is forecasted to 8
be released to operations in July 2021 with an early 2022 forecasted project 9
completion date. The Elkhorn BESS will be owned and operated by PG&E. 10
The Elkhorn BESS project is being developed via an engineering, 11
procurement, and construction contract with Tesla, Inc.; the project is 12
managed by EO. The project includes the installation of 256 Tesla 13
Megapack battery units on 33 concrete slabs. Each unit houses batteries 14
and associated equipment in a steel cabinet. Transformers and switchgears 15
connect energy stored in the batteries with the 115 kilovolt transmission 16
system. It will have the capacity to store and dispatch up to 17
730 megawatt-hours of energy to the electrical grid at a maximum rate of 18
182.5 megawatts for up to four hours during periods of high demand. 19
Without adding new fossil fuel resources to the grid, Elkhorn BESS will 20
enhance reliability by addressing capacity deficiencies resulting from local 21
load growth. The system will also participate in the CAISO markets, 22
providing energy and ancillary services, such as serving as an operating 23
reserve that can quickly be dispatched to facilitate sufficient capacity to the 24
CAISO-controlled grid. These services will help the state integrate 25
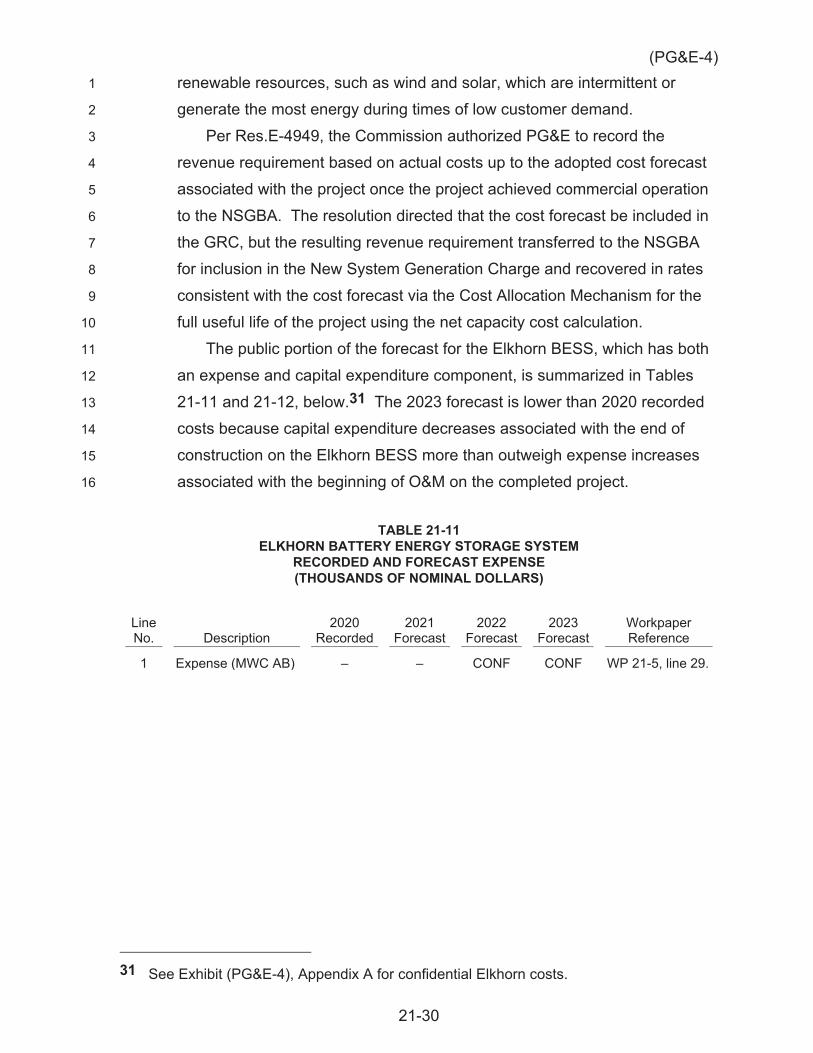
(PG&E-4)
21-30
renewable resources, such as wind and solar, which are intermittent or 1
generate the most energy during times of low customer demand. 2
Per Res.E-4949, the Commission authorized PG&E to record the 3
revenue requirement based on actual costs up to the adopted cost forecast 4
associated with the project once the project achieved commercial operation 5
to the NSGBA. The resolution directed that the cost forecast be included in 6
the GRC, but the resulting revenue requirement transferred to the NSGBA 7
for inclusion in the New System Generation Charge and recovered in rates 8
consistent with the cost forecast via the Cost Allocation Mechanism for the 9
full useful life of the project using the net capacity cost calculation. 10
The public portion of the forecast for the Elkhorn BESS, which has both 11
an expense and capital expenditure component, is summarized in Tables 12
21-11 and 21-12, below.31 The 2023 forecast is lower than 2020 recorded 13
costs because capital expenditure decreases associated with the end of 14
construction on the Elkhorn BESS more than outweigh expense increases 15
associated with the beginning of O&M on the completed project. 16
TABLE 21-11 ELKHORN BATTERY ENERGY STORAGE SYSTEM
RECORDED AND FORECAST EXPENSE (THOUSANDS OF NOMINAL DOLLARS)
Line No. Description
2020 Recorded
2021 Forecast
2022 Forecast
2023 Forecast
Workpaper Reference
1 Expense (MWC AB) – – CONF CONF WP 21-5, line 29.
31 See Exhibit (PG&E-4), Appendix A for confidential Elkhorn costs.
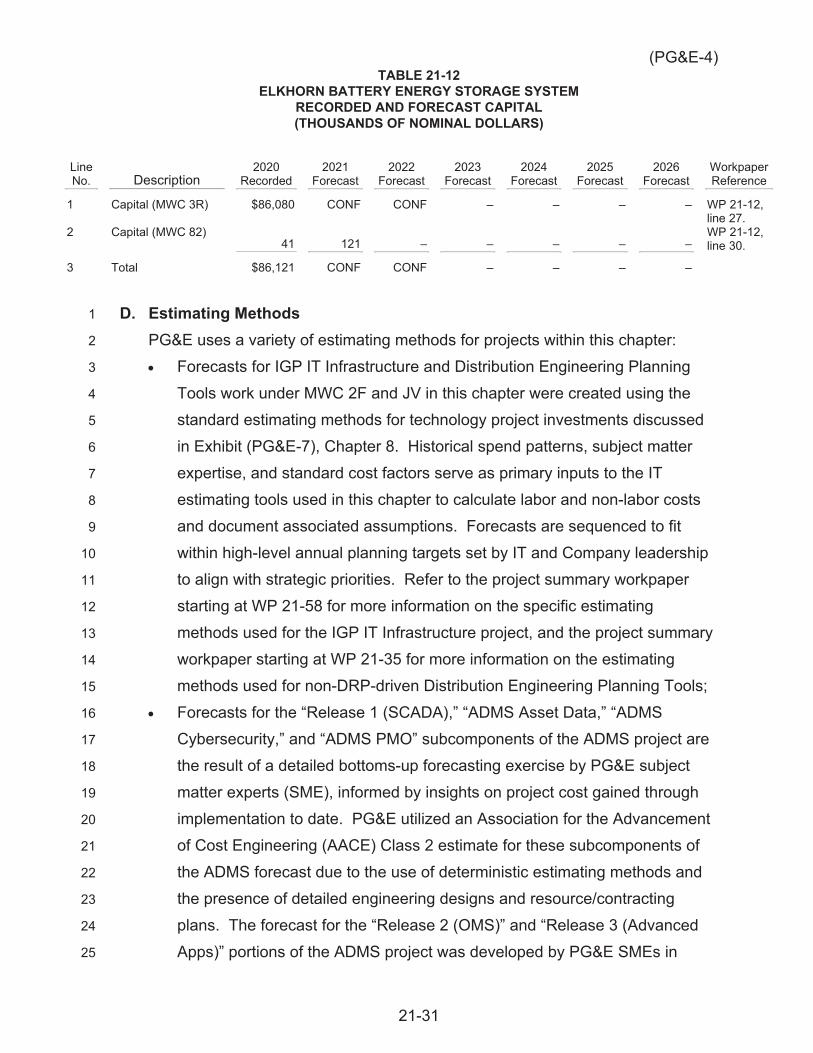
(PG&E-4)
21-31
TABLE 21-12 ELKHORN BATTERY ENERGY STORAGE SYSTEM
RECORDED AND FORECAST CAPITAL (THOUSANDS OF NOMINAL DOLLARS)
Line No. Description
2020 Recorded
2021 Forecast
2022 Forecast
2023 Forecast
2024 Forecast
2025 Forecast
2026 Forecast
Workpaper Reference
1 Capital (MWC 3R) $86,080 CONF CONF – – – – WP 21-12, line 27.
2 Capital (MWC 82) 41 121 – – – – –
WP 21-12, line 30.
3 Total $86,121 CONF CONF – – – –
D. Estimating Methods 1
PG&E uses a variety of estimating methods for projects within this chapter: 2
Forecasts for IGP IT Infrastructure and Distribution Engineering Planning 3
Tools work under MWC 2F and JV in this chapter were created using the 4
standard estimating methods for technology project investments discussed 5
in Exhibit (PG&E-7), Chapter 8. Historical spend patterns, subject matter 6
expertise, and standard cost factors serve as primary inputs to the IT 7
estimating tools used in this chapter to calculate labor and non-labor costs 8
and document associated assumptions. Forecasts are sequenced to fit 9
within high-level annual planning targets set by IT and Company leadership 10
to align with strategic priorities. Refer to the project summary workpaper 11
starting at WP 21-58 for more information on the specific estimating 12
methods used for the IGP IT Infrastructure project, and the project summary 13
workpaper starting at WP 21-35 for more information on the estimating 14
methods used for non-DRP-driven Distribution Engineering Planning Tools; 15
Forecasts for the “Release 1 (SCADA),” “ADMS Asset Data,” “ADMS 16
Cybersecurity,” and “ADMS PMO” subcomponents of the ADMS project are 17
the result of a detailed bottoms-up forecasting exercise by PG&E subject 18
matter experts (SME), informed by insights on project cost gained through 19
implementation to date. PG&E utilized an Association for the Advancement 20
of Cost Engineering (AACE) Class 2 estimate for these subcomponents of 21
the ADMS forecast due to the use of deterministic estimating methods and 22
the presence of detailed engineering designs and resource/contracting 23
plans. The forecast for the “Release 2 (OMS)” and “Release 3 (Advanced 24
Apps)” portions of the ADMS project was developed by PG&E SMEs in 25
(PG&E-4)
21-32
consultation with a third-party Systems Integrator with extensive experience 1
implementing ADMS projects in North America. PG&E utilized an AACE 2
Class 3 estimate for these subcomponents of the ADMS forecast due to the 3
presence of a detailed scope of work and estimation method that was more 4
deterministic than probabilistic; 5
The DERMS program forecast was created by SMEs at PG&E in 6
consultation with a third-party Systems Integrator using the assumptions 7
outlined in WP 21-13. PG&E used an AACE Class 5 estimate because the 8
project is in the early concept and planning phases; 9
The CMEP program forecast for 2021 and 2022 was authorized in 10
D.20-06-017 (p. 85). The 2023 forecast is the product of PG&E SME 11
judgement of resources required to support an anticipated increase in 12
microgrid project development activity; 13
The DRP-related Distribution Engineering Planning Tools forecast was 14
created by PG&E SMEs using a combination of vendor quotations and 15
PG&E internal labor costs; 16
The Distribution Deferral Non-Procurement Cost forecast was the product of 17
PG&E SME judgement regarding the labor required to successfully 18
complete the work; 19
The Electric Emerging Technology Program forecast was created using 20
PG&E’s current annual expenditures on the EPIC Program as a benchmark; 21
and 22
The Elkhorn Battery Energy Storage System forecast was authorized in 23
Res.E-4949. 24
E. Compliance with Prior Commission Decisions 25
1. Compliance with Section 5.2 of the GRC Settlement Agreement 26
Section 5.2 of the 2020 GRC Settlement Agreement required PG&E to 27
make an additional showing in its 2023 GRC testimony for deferred work 28
that was previously requested and authorized based on representations that 29
the work was needed to provide safe and reliable service. PG&E reviewed 30
the Grid Modernization chapter of its 2020 GRC32 and determined that no 31
32 A.18-12-009, HE-17: Exhibit (PG&E-4), Ch. 19.
(PG&E-4)
21-33
work met the criteria for deferred work as described in the Settlement 1
Agreement. 2
2. Other Compliance Items 3
D.18-03-023 outlined several content requirements for IOU Grid 4
Modernization GRC filings. PG&E identifies the location within its filing 5
where these content requirements are satisfied in WP Table 21-16. 6
Furthermore, D.18-03-023 requires IOUs to provide tables 7
demonstrating the location and cost of all Grid Modernization 8
investments within the filing if they are not located within a single 9
chapter. PG&E provides this information in WP Tables 21-14 and WP 10
21-15; 11
D.20-06-017 (p. 85) required PG&E’s 2023 GRC to include a CMEP 12
program evaluation that will enable the Commission to determine the 13
efficacy of the program and whether funding should continue beyond 14
2022. This program evaluation is located in Attachment A3 to this 15
chapter; and 16
D.20-12-005 (p. 308) required PG&E’s 2023 GRC to include support for 17
its proposed allocation of Grid Modernization costs. This discussion is 18
included in Section A.3.c of this Testimony chapter. 19
F. Balancing and Memorandum Accounts 20
Portions of the forecast in this chapter are associated with the balancing or 21
memorandum accounts listed below. 22
Distributed Energy Resources Distribution Deferral Account (DERDDA) – 23
This balancing account tracks non-procurement costs associated with DER 24
contracts for distribution deferral, which are discussed in Section C.1.b. 25
PG&E proposes to modify the DERDDA preliminary statement to include 26
only incremental costs above the amounts ultimately adopted by the 27
Commission; 28
Avoided Costs Calculator Update Memorandum Account (ACCUMA) – This 29
memorandum account tracks costs associated with updates to the Avoided 30
Costs Calculator, which are discussed in Section C.1.b. A discussion of the 31
reasonableness of the recorded costs in this account is located in the project 32
(PG&E-4)
21-34
summary for Distribution Deferral Non-Procurement Costs, which starts at 1
WP 21-43. PG&E proposes to continue recording to the ACCUMA; 2
Distribution Resources Plan Tools Memorandum Account (DRPTMA) – This 3
memorandum account tracks Distribution Engineering Planning Tool costs 4
driven by DRP Compliance, which are discussed in Section C.1.a. 5
A discussion of the reasonableness of recorded costs in this account is 6
located in the project summary for Distribution Engineering Planning Tools, 7
which starts at WP 21-35. PG&E proposes to continue to record amounts 8
incremental to the GRC in the DRPTMA; 9
New System Generation Balancing Account (NSGBA) – This balancing 10
account is used to record costs for the Elkhorn Battery Energy Storage 11
System, which is discussed in Section C.5; and 12
Microgrids Memorandum Account (MGMA) – This memorandum account is 13
used to record cost for CMEP, which is discussed in Section C.1.c. 14
For further information about balancing or memorandum accounts, refer to 15
Exhibit (PG&E-12), Chapter 7. 16
G. Cost Tables 17
The expense and capital forecasts for IGP and Grid Modernization 18
(excluding the Elkhorn Battery Energy Storage System forecast in years 19
2021-2023, which is presented in a confidential appendix)33 are summarized in 20
the following tables: 21
Table 21-13 lists the expense MWCs, showing 2016 through 2020 recorded 22
expenses and 2021 through 2023 forecast expenses; and 23
Table 21-14 lists the capital MWCs, showing 2016 through 2020 recorded 24
expenditures and 2021-2026 forecast expenditure.25
33 See Exhibit (PG&E-4), Appendix A.

(PG&E-4)
21-35
TAB
LE 2
1-13
EX
PEN
SE
(TH
OU
SAN
DS
OF
NO
MIN
AL
DO
LLA
RS)
Line
N
o.
MW
C
Des
crip
tion
Rec
orde
d Ad
just
ed
Fore
cast
W
orkp
aper
R
efer
ence
20
16
2017
20
18
2019
20
20
2021
20
22
2023
1 AB
M
isc
Expe
nse
– –
$484
$2
,003
$3
,320
$3
,926
$4
,135
$1
0,01
5 W
P 21
-1, l
ine
1.
2 AT
R
&D
$20,
423
$18,
907
14,6
51
8,00
4 14
,609
16
,158
16
,653
17
,174
W
P 21
-1, l
ine
2.
3 H
G
Elec
Tra
ns O
ps E
ngr &
Tec
h –
453
3,37
4 3,
010
5,15
4 5,
424
2,28
7 15
,541
W
P 21
-1, l
ine
3.
4 IG
M
anag
e Va
r Bal
Acc
t Pr
oces
ses
– 71
14
9 23
6 68
6 4,
013
5,59
6 3,
026
WP
21-1
, lin
e 4.
5 JV
M
aint
ain
IT A
pps
& In
fra
1,40
4 52
4 1,
429
1,34
5 2,
500
3,30
9 W
P 21
-1, l
ine
5.
6
Tota
l $2
0,42
3 $1
9,43
1 $2
0,06
2 $1
3,77
8 $2
5,19
8 $3
0,86
7 $3
1,17
1 $4
9,06
5
TAB
LE 2
1-14
C
API
TAL
(TH
OU
SAN
DS
OF
NO
MIN
AL
DO
LLA
RS)
Line
N
o.
MW
C
Des
crip
tion
Rec
orde
d Ad
just
ed
Fore
cast
W
orkp
aper
R
efer
ence
20
16
2017
20
18
2019
20
20
2021
20
22
2023
20
24
2025
20
26
1 21
M
isc.
Cap
ital
– –
$1,1
14
$2,1
16
$395
$2
,882
$3
,083
$2
,237
$1
,852
$1
,902
WP
21-1
2, lin
e 22
. 2
2F
IT C
apita
l –
– 12
,077
16
,759
26
,724
19
,540
17
,900
20
,369
19
,086
19
,695
17
,000
W
P 21
-12,
line
19.
3 3M
In
stal
l/Rep
l Var
Bal
Ac
ct
$10,
151
$(5)
–
– –
– –
– –
– –
WP
21-1
2, lin
e 25
.
4 3R
En
ergy
Sto
rage
C
apita
l –
–
15,4
60
86,0
80
CO
NF
CO
NF
– –
– –
WP
21-1
2, lin
e 28
.
5 63
El
ectri
c D
istri
butio
n O
pera
tions
Te
chno
logy
– –
5,04
8 12
,209
44
,373
81
,885
12
6,88
0 10
9,04
9 68
,042
20
,565
26
,438
W
P 21
-12,
line
10.
6 82
TO
-EG
I/WR
O/S
I –
– 11
67
41
12
1 –
– –
– –
WP
21-1
2, lin
e 31
.
7
Tota
l $1
0,15
1 $(
5)
$18,
250
$46,
610
$157
,613
$1
04,4
28
$147
,863
$1
31,6
55
$88,
981
$42,
163
$43,
438
(PG&E-4)
PACIFIC GAS AND ELECTRIC COMPANY
CHAPTER 21
ATTACHMENT A
GRID MODERNIZATION PLAN – 10 YEAR VISION
(PG&E-4)
21-AtchA-i
PACIFIC GAS AND ELECTRIC COMPANY CHAPTER 21
ATTACHMENT A GRID MODERNIZATION PLAN – 10 YEAR VISION
TABLE OF CONTENTS
A. Introduction ..................................................................................................... 21-1
B. Context for PG&E’s Vision .............................................................................. 21-2
C. Summary: PG&E’s 10-Year Vision for Grid Modernization ............................ 21-3
D. Key Themes ................................................................................................... 21-7
1. Decarbonizing Electric Supply ................................................................. 21-7
2. DER Adoption for PSPS Resiliency ......................................................... 21-8
3. Adoption of Multi-Customer Microgrids Supplied by DERs for Resiliency and Local Control .................................................................... 21-8
4. Load Growth from Electrification .............................................................. 21-9
5. DERs to Mitigate Wildfire Risk ............................................................... 21-10
6. Designing a System with Resiliency to Acute Climate Events ............... 21-10
7. Load Management and DER Enablement .............................................. 21-11
8. Public Policy-Driven Growth in Behind-the-Meter Solar and Storage .... 21-13
9. New Momentum for Clean Fuels for Resiliency ..................................... 21-13
10. Population Migration in PG&E’s Service Territory .................................. 21-14
11. DER-Specific Integration Challenges ..................................................... 21-14
a. New Grid Usage Patterns Create Unpredictable Power Flows ........ 21-15
b. “Masked” Loads ............................................................................... 21-16
E. 10-Year Vision: Grid Infrastructure .............................................................. 21-17
1. Grid Hardening That Enables DERs ...................................................... 21-17
2. Multi-Customer Microgrids ..................................................................... 21-18
3. Load Growth .......................................................................................... 21-19
4. Non-Wires Alternatives .......................................................................... 21-19
F. 10-Year Vision: System Monitoring and Management................................. 21-20
(PG&E-4) PACIFIC GAS AND ELECTRIC COMPANY
CHAPTER 21 ATTACHMENT A
GRID MODERNIZATION PLAN – 10 YEAR VISION
TABLE OF CONTENTS (CONTINUED)
21-AtchA-ii
1. Advanced Distribution Management System ......................................... 21-21
2. Asset Sensors ........................................................................................ 21-21
3. Distribution Planning Tools/Advanced Load Forecasting ....................... 21-21
4. Distribution and Substation Automation ................................................. 21-22
G. 10-Year Vision: DER Grid Services ............................................................. 21-22
1. Distributed Energy Resource Management System .............................. 21-22
2. Frequency/Voltage Regulation ............................................................... 21-23
3. Smart Inverters ...................................................................................... 21-24
4. Advanced Load Management ................................................................ 21-24
5. Vehicle-to-Grid (V2G) ............................................................................. 21-24
H. 10-Year Vision: Distribution Markets ........................................................... 21-25
I. Conclusion .................................................................................................... 21-26
(PG&E-4)
21-AtchA-1
PACIFIC GAS AND ELECTRIC COMPANY 1
CHAPTER 21 2
ATTACHMENT A 3
GRID MODERNIZATION PLAN – 10 YEAR VISION 4
A. Introduction 5
Pacific Gas and Electric Company’s (PG&E or the Company) 2023 General 6
Rate Case (GRC) is required to include PG&E’s 10-Year Vision for Grid 7
Modernization.1 In Decision (D.) 18-03-023, for the Order Instituting Rulemaking 8
(OIR) Regarding Policies, Procedures and Rules for Development of Distribution 9
Resources Plan (DRP) pursuant to Public Utilities Code Section 769, the 10
California Public Utilities Commission (CPUC or Commission) established a 11
working definition of grid modernization centered on the cost-effective integration 12
of Distributed Energy Resources (DER) into the distribution system, consistent 13
with the goal of yielding net ratepayer benefits.2 In addition, D.18-03-023 14
recognized that there are grid modernization-related investments that are 15
unrelated to DER integration but still necessary to improve safety and reliability 16
of the grid.3 17
PG&E first filed a 10-Year Vision for Grid Modernization in 2018 as part of 18
its 2020 GRC application (2020 GRC 10-Year Vision).4 Technological, climate, 19
policy, and market forces have evolved significantly since that filing and PG&E’s 20
framework for defining its vision has evolved to reflect the new landscape. The 21
context of PG&E’s 2020 GRC 10-Year Vision, and the evolution of PG&E’s 22
vision since then, are described in Section B. 23
PG&E’s updated 10-year vision for Grid Modernization for 2023 GRC is 24
summarized in Section C. The key themes driving PG&E’s current grid 25
modernization vision are described in Section D. Sections E through H discuss 26
the specific elements of the vision as they relate to the four components of the 27
Integrated Grid Platform (IGP) organizing framework presented in PG&E’s 2020 28
1 D.18-03-023, pp. 34-35, Ordering Paragraph (OP) 4. 2 D.18.03-023, p. 33, OP 1. 3 D.18.03-023, p. 5. 4 A.18-12-009, HE-17: Exhibit (PG&E-4), Ch. 19, Attachment A.
(PG&E-4)
21-AtchA-2
GRC 10-Year Vision: grid infrastructure, system monitoring and management, 1
DER grid services, and distribution markets. 2
B. Context for PG&E’s Vision 3
The 2020 GRC 10-Year Vision focused primarily on grid modernization 4
associated with integrating DERs on PG&E’s system. Specifically, that 5
document addressed: 6
… PG&E’s grid modernization vision to improve and enhance the safe and 7 reliable planning and operations of the distribution grid for DERs already 8 interconnected to the distribution grid, as well as for forecast DERs given 9 current growth trends.5 10
The 2020 GRC 10-Year Vision was organized around the concept of the 11
IGP pyramid, which describes four layers of grid capabilities of increasing 12
sophistication: (1) grid infrastructure, (2) system monitoring and management, 13
(3) DER grid services, and (4) distribution markets. The primary focus of the 14
IGP work described in the 2020 GRC 10-Year Vision was on the second and 15
third layers: building the foundational system monitoring and management 16
capabilities to enable DER grid services. 17
The 2020 GRC 10-Year Vision emphasized California’s “changing energy 18
landscape”—including decarbonization policies, rapidly advancing technology 19
effectiveness, and increased customer engagement and choice.6 The 20
document also highlighted the increasing complexity of operating the grid due to 21
the integration of DERs, changing usage patterns, and climate change.7 These 22
challenges have continued to evolve, in many cases at an accelerated pace, and 23
new challenges have emerged. These challenges—including the dramatic 24
escalation of wildfire ignition risk due to California’s climate, aggressive state 25
decarbonization policies, and increased adoption of electric vehicles—have 26
expanded the landscape and use cases for grid modernization. PG&E’s grid 27
modernization vision must be updated to incorporate the physical infrastructure 28
and technical capabilities necessary to manage the current landscape. 29
5 A.18-12-009, HE-17: Exhibit (PG&E-4), p. 19-AtchA-1, lines 17-20. 6 A.18-12-009, HE-17: Exhibit (PG&E-4), p. 19-AtchA-5, line 10 to p. 19-AtchA-7, line 10. 7 A.18-12-009, HE-17: Exhibit (PG&E-4), p. 19-AtchA-5, line 10 to p. 19-Atch-12, line 20.
(PG&E-4)
21-AtchA-3
C. Summary: PG&E’s 10-Year Vision for Grid Modernization 1
PG&E has observed meaningful shifts in the public policy, market, 2
economic, and technological trends that were articulated in its 2020 GRC 3
10-Year Vision. These changes have led PG&E to identify a set of key themes 4
which PG&E anticipates will impact its grid in the coming decade; these themes 5
are multi-faceted and update the 2020 GRC 10-Year Vision’s primary focus on 6
customer adoption of DERs. For example, the rapid emergence of tangible 7
effects of climate change in the form of wildfire risk and extreme heat events—8
as well as the potential growth in other, currently-less-prevalent climatic forces—9
have placed an increased focus on the core electric service principles of 10
reliability and resiliency as they relate to the integration of DERs. 11
In addition to grid reliability and resiliency, California’s policymakers 12
continue to adopt and refine ambitious climate targets which require 13
cost-effective decarbonization of all sectors of the state’s economy, including 14
electric generation, transportation, and buildings. End users of electricity are 15
highly engaged in their energy services, and PG&E’s customers have potential 16
alternatives they can explore to their traditional energy choices: electric 17
vehicles, behind-the-meter solar and storage, participation in new wholesale 18
markets via DER aggregators, as well as the ability to develop multi-customer 19
microgrids for resiliency. 20
However, while the specific use cases on the grid continue to evolve, 21
PG&E’s vision for how the electric grid itself will evolve in the coming decade 22
remains consistent and well aligned with the vision articulated in the 2020 GRC 23
10-Year Vision. While the specific use cases on the grid continue to evolve, 24
PG&E envisions a 10-year period which is a continuation of the vision described 25
in its 2020 GRC—bolstering and reinforcing its grid infrastructure; deploying 26
sophisticated system monitoring and management capabilities; and developing 27
capabilities to plan, monitor, and control DERs to provide grid services—which 28
maps to the first three layers of the IGP pyramid. 29
DER technology penetration and effectiveness continue to increase across 30
the service territory. These DERs are increasingly able to provide cost-effective 31
services to customers, transmission and distribution (T&D) grid services, and 32
services to the wholesale energy market which can help meet the various 33
climate challenges and state policy goals of today and the future. In order to 34
(PG&E-4)
21-AtchA-4
access this potential, PG&E will need to continue to implement cost-effective 1
investments in grid infrastructure, communication infrastructure, cybersecurity, 2
and software platforms to ensure that the management and control of such 3
technologies can provide affordable, safe, and reliable services to the grid. 4
As noted in the 2020 Grid Modernization Vision, to manage the broad suite 5
of forces impacting the grid, PG&E will need to develop a nimble and dynamic 6
electric grid that can provide granular visibility and control of supply and demand 7
throughout the system. PG&E will need to reinforce its physical infrastructure to 8
accommodate evolving environmental conditions affecting DER integration. 9
Additionally, new load from electric vehicle (EV) charging and building 10
electrification DERs will necessitate new T&D capacity and load control 11
functionality. The continued rise of DERs in response to declining technology 12
costs and policy and resiliency drivers will necessitate a new operational 13
paradigm of increased visibility, control, and automation. PG&E will continue to 14
develop this operational toolkit over the coming decade as its investments in 15
situational awareness and control will enable a suite of new advanced tools and 16
sophisticated digital functionality. Supply will continue to evolve within PG&E’s 17
system and PG&E anticipates that a significant portion of electricity supply may 18
move increasingly “downstream” (i.e., located at the substation or distribution 19
levels, rather than the transmission level). PG&E does not anticipate making 20
substantial investments in advanced distribution markets (e.g., a peer-to-peer 21
marketplace) in the next 10 years except pursuant to specific DER commercial 22
market developments, which may cause increased customer demand for such 23
peer-to-peer services. 24
To achieve this vision, PG&E will need to develop and deploy a suite of 25
infrastructure improvements and new capabilities that are responsive to 26
developments in DER markets, products, and services. This suite can be 27
organized into three time scales: near-term, medium-term, and long-term. 28
Near-term: A need to implement these infrastructure improvements and 29
new capabilities exists today. Work has already begun or will begin soon, 30
including forecasts in the 2023 GRC. Examples of near-term applications 31
include: 32
(PG&E-4)
21-AtchA-5
The hardening of electric T&D assets to mitigate risk of wildfire ignition from 1
PG&E equipment failure;8 2
Installation of foundational communications infrastructure to enable more 3
advanced infrastructure and new capabilities; 4
Advanced distribution planning tools which enable scenario planning and 5
time series analyses of distribution system conditions to forecast distribution 6
planning needs; 7
Tools for customers and grid planners to identify optimal locations for siting 8
DERs; 9
Situational awareness enabled by the Advanced Distribution Management 10
System (ADMS); and 11
Monitoring and control of DERs enabled by the Distributed Energy Resource 12
Management System (DERMS). 13
Medium-term: These infrastructure improvements and capabilities are 14
likely to be required within the coming decade if DER markets and services 15
continue to develop at their current pace. PG&E is taking preparatory steps to 16
build the foundation for future deployment. Examples of medium-term 17
applications include: 18
Electric T&D capacity upgrades (including conductors, transformers, etc.) to 19
accommodate load growth resulting from new EV charging and building 20
electrification loads; 21
Mass proliferation of line sensors to understand the real-time (RT) status of 22
T&D lines (e.g., phasor measurement units); 23
Rapid scaling of asset sensors, including nodes measuring asset health 24
(e.g., asset operating temperatures); 25
Deployment of smart switches within PG&E’s system to enable the 26
operation of multi-customer microgrids and to ensure reliability during 27
climate events; 28
Strategic placement of smart inverters and other voltage and frequency 29
regulation technologies at the distribution grid edge (“synthetic inertia”); 30
8 For further details of PG&E’s system hardening to mitigate Wildfire risk, see Exhibit
(PG&E-4), Ch. 4.
(PG&E-4)
21-AtchA-6
Automation of equipment to enable passive operation of distribution system 1
(i.e., operators not actively operating system in RT); 2
Sophisticated models to forecast distribution load conditions on sub-annual 3
increments and/or at a hyper-localized level; 4
Secure communications connections to thousands of additional endpoints 5
for monitoring and control of customer-sited DERs and controllable loads; 6
Proliferation of communications and controls to manage sections of the 7
distribution system that can island as a microgrid during larger grid outages; 8
and 9
Volt-Var Optimization. 10
Long-term: As of today, PG&E does not anticipate these infrastructure 11
improvements and new capabilities warranting investment in the next decade. 12
However, these trends will be monitored by PG&E as evolving conditions could 13
quickly justify accelerated deployment (i.e., migrating from long-term to the 14
near- or medium-term categories). Examples of long-term applications include: 15
Distribution level market optimization and settlement technology. 16
Given the addition and acceleration of trends since PG&E drafted its 2020 17
GRC 10-Year Vision, PG&E has developed an updated framework for 18
organizing and responding to the impacts of various climate, policy, market, and 19
technological forces on the grid consistent with the foundational framework in 20
the 2020 GRC and the overall priorities of its 2023 GRC. This framework allows 21
PG&E to identify key themes which emerge as a result of the intersection of 22
these forces. These key themes are described in greater detail in Section D 23
below. The implications of these key themes for the electric grid and PG&E’s 24
vision for how the grid should evolve to manage these key themes are described 25
in Sections E through H of this document, organized according to the four layers 26
of the IGP pyramid. 27
Lastly, PG&E notes that discussion of spending requirements to support its 28
10-Year Grid Modernization Vision beyond the current GRC cycle must be 29
qualitative in nature due to the impracticality of developing detailed cost 30
estimates for work that is not yet scoped and not scheduled to begin for more 31
than five years. 32
(PG&E-4)
21-AtchA-7
D. Key Themes 1
PG&E’s electric grid is facing an evolving set of key themes driven by 2
changes in technology, climate, policy, and the market. 3
Technological Drivers include adoption of behind-the-meter Photovoltaic 4
and storage (either separately, or in tandem), EV, front-of-the-meter storage, 5
building electrification, and controllable loads. 6
Climate Drivers include wildfire risk and mitigations (e.g., Public Safety 7
Power Shutoff (PSPS)), extreme heat, drought, extreme storms, climate 8
migration, and sea level rise. 9
Policy Drivers include state policies on renewable generation and carbon 10
neutrality (e.g., SB 100), electric vehicles, Community Choice Aggregation, 11
building codes and standards, the net energy metering (NEM) program, 12
evolutions in rate design, and housing policy that will affect population density 13
and migration. 14
Market Forces include the incentives provided for load management which 15
dictate how customers will interact with the grid, and therefore the needed grid 16
architecture (e.g., directly participate in the California Independent System 17
Operator (CAISO) market and export onto the distribution system or remain one 18
way passive customers that choose to use DERs for retail rate minimization). 19
The confluence of these forces has produced a set of key themes that have 20
informed PG&E’s vision for grid modernization. 21
1. Decarbonizing Electric Supply 22
California is a global leader in decarbonization policy. In order to meet 23
the state’s aggressive policy goals, including but not limited to former 24
Governor Jerry Brown’s Executive Order mandating carbon neutrality in 25
California by 2045, PG&E must be at the forefront of decarbonization 26
efforts.9 Carbon neutrality is likely to require significant investments in clean 27
generation. In the event these resources come from out of state (e.g., wind 28
from the Mountain West region), new interstate transmission capacity may 29
be required. 30
9 Governor’s Executive Order No. B-55-18 (Sept. 10, 2018).
(PG&E-4)
21-AtchA-8
2. DER Adoption for PSPS Resiliency 1
As a result of the increased frequency of PSPS events, many of PG&E’s 2
customers have pursued self-generation as a means for ensuring reliability. 3
The installation of behind-the-meter distributed generation technologies like 4
solar, fuel cells, and diesel or natural gas-fired generators allow customers 5
to generate and—when paired with battery storage—store electric energy 6
independent of the conventional distribution grid during PSPS events or 7
other grid disruptions. 8
PG&E has observed a significant increase in distributed generation 9
interconnections in recent years. Additionally, PG&E has observed an 10
increase in customers pairing behind-the-meter solar applications with 11
battery storage. While multiple factors contributed to this adoption, PG&E 12
believes that customers’ desire for PSPS resiliency meaningfully contributed 13
to these increases. This theme will drive DER growth, necessitating new 14
infrastructure and capabilities in the electric distribution system. 15
3. Adoption of Multi-Customer Microgrids Supplied by DERs for 16
Resiliency and Local Control 17
In recent years, PG&E has observed a growing interest in 18
multi-customer microgrids in its service territory. Customers have begun to 19
explore multi-customer microgrids as a form of energy resiliency in response 20
to the uncertainty surrounding the potential long-term impacts of climate 21
change, extreme weather, and PG&E’s PSPS program. In other cases, 22
customer groups have sought to deploy multi-customer microgrids to secure 23
more independent and localized control over their electricity. PG&E expects 24
that this trend will continue in the coming decade, necessitating new grid 25
infrastructure to accommodate the growth of microgrids. 26
For example, PG&E has developed the Community Microgrid 27
Enablement Program to help facilitate multi-customer microgrid adoption for 28
resiliency concerns. While the community may own the generation 29
resources in these microgrids, PG&E acts as the distribution system 30
operator and is responsible for providing safe and reliable electricity to its 31
customers during both grid-connected and islanded modes. This 32
arrangement requires enhanced visibility and RT switching operations, 33
enabling rapid isolation and reconnection of grid segments. 34
(PG&E-4)
21-AtchA-9
4. Load Growth from Electrification 1
One of the key foundational principles of California’s decarbonization 2
strategy is the electrification of loads previously served by fossil fuels 3
(i.e., replacing these high-emitting fuels with clean electricity). Two sectors 4
are the primary focus of California’s electrification efforts: transportation and 5
buildings. 6
Transportation is the sector of California’s economy with the most 7
greenhouse gas (GHG) emissions. Tailpipe emissions make up 41 percent 8
of California’s GHG emissions, climbing to over 50 percent when fuel 9
extraction and refining are considered. In order to transition the state’s 10
transportation sector towards EVs to begin offsetting these transportation 11
emissions, California has adopted a suite of policies aimed at promoting the 12
adoption of EVs (e.g., Zero Emission Vehicle Standard, Clean Vehicle 13
Rebate Program, Advanced Clean Trucks). Most recently, in 2020, 14
Governor Newsom called for 100 percent of in-state sales of new passenger 15
cars and trucks to be zero-emission by 2035 and for medium and 16
heavy-duty trucks operating in the state to be zero-emission by 2045.10 The 17
rapid adoption of EVs necessary to meet this target is likely to drive 18
increased electric demand, both in the form of peak load (megawatt (MW)) 19
and total energy delivered (megawatt-hour (MWh)). 20
Momentum behind the electrification of buildings has also grown 21
significantly since PG&E filed its 2020 GRC application. Since 2019, a 22
number of cities and communities have passed local codes and standards 23
which promote the electrification of building energy consumption, including 24
space and water heating, cooking, and other end uses. PG&E became the 25
first dual-fuel utility in the United States to issue public support for all-electric 26
new construction, with a public statement backing Berkeley City Council’s 27
ordinance prohibiting natural gas infrastructure in new buildings. Following 28
Berkeley’s measure, approximately 50 additional jurisdictions across 29
PG&E’s service territory have already passed or are actively considering 30
local policies to require or give preference to all-electric or partially-electric 31
new construction. 32
10 Governor’s Executive Order No. N-79-20 (Sept. 23, 2020).
(PG&E-4)
21-AtchA-10
The adoption of all-electric buildings will also drive increased electric 1
load (MW) and energy use (MWh). The scale of these impacts, as well as 2
the impacts of EV adoption, is still being studied. 3
5. DERs to Mitigate Wildfire Risk 4
A source of wildfire ignition risk related to PG&E’s system is the failure 5
of overhead electric distribution and transmission equipment. While 6
underground distribution systems tend to predominate in dense urban areas 7
and newer suburbs, overhead systems have been preferred in other 8
locations because they are far less costly to construct and maintain. 9
However, overhead wires have a much higher risk of environmental 10
interaction than underground wires. Animals and vegetation can interact 11
with distribution equipment and lead to detrimental effects, such as outages 12
and wildfire ignition risk during certain weather conditions. 13
Given the increasing wildfire risk in PG&E’s service territory and the 14
relationship between overhead asset failure and wildfire ignition, PG&E 15
anticipates increased interest in leveraging DERs in lieu of conventional 16
electric delivery investments. DERs like aggregated behind-the-meter 17
generation and front-of-the-meter storage will become more attractive in 18
California’s market due to their ability to significantly decrease ignition risk. 19
One example of this trend is PG&E’s Remote Grid initiative, which seeks to 20
serve customers in remote High Fire Threat District areas via standalone 21
power systems, rather than conventional distribution service. 22
6. Designing a System with Resiliency to Acute Climate Events 23
On August 14th and 15th, 2020, the CAISO was forced to implement 24
rolling blackouts in response to extreme heat conditions. For several days 25
after that, CAISO issued warnings that demand was projected to exceed 26
supply in light of the continued heat wave. Fortunately, California utilities, 27
with the cooperation of large facilities and state buildings, were collectively 28
able to manage demand to ensure blackouts were not necessary through 29
the remainder of the heat event. Following these events, CAISO, CPUC, 30
and the California Energy Commission (CEC) issued a Final Root Cause 31
Analysis, which determined that extreme weather conditions, existing 32

(PG&E-4)
21-AtchA-11
resource adequacy and planning processes, and market practices were the 1
three primary drivers of the blackout events.11 2
The state’s needs for increased electricity supply for reliability will 3
certainly result in the procurement of additional supply-side and 4
demand-side DERs to meet demand during extreme weather events. The 5
report signaled that the agencies would continue to explore how to enable 6
new resources beyond large-scale in-state generation, including batteries, 7
imports from neighboring states, and demand response (DR) and many 8
others. As a result, it is not yet clear what form this procurement will take 9
over the course of the next decade. This produces uncertainty for PG&E’s 10
electric grid, as new capacity or other reliability technology may be required 11
to ensure deliverability of new supply resources to customers. 12
Beyond supply-related issues, the physical operation of the grid has 13
been impacted by the effect of increased heat on the grid’s physical assets. 14
As the climate becomes increasingly harsh, weatherization practices must 15
be implemented to improve asset resiliency to climate change. Predicted 16
future weather conditions must be considered for all new and existing 17
electric delivery assets. 18
7. Load Management and DER Enablement 19
PG&E defines load management as all of the policy tools available to 20
shape customer demand.12 California currently has three primary pathways 21
for enabling DER participation in markets. 22
The first pathway is through customer incentive or tariffed programs 23
which incentivize the adoption of behind-the-meter DERs on a 24
single-customer basis (e.g., SGIP or NEM). This is the most common 25
approach today, and these programs are unlikely to require significant 26
overhauls of the status quo grid architecture. 27
The second pathway is real-time pricing (RTP). There are multiple 28
forums in which RTP is currently being considered by California energy 29
11 See CEC, et al., Final Root Cause Analysis (Jan. 13, 2021), at
<http://www.caiso.com/Documents/Final-Root-Cause-Analysis-Mid-August-2020-Extreme-Heat-Wave.pdf> (as of June 7, 2021).
12 Examples include, but are not limited to, signals and technology deployment through incentives (e.g., SGIP) or standards (e.g., Title 24).
(PG&E-4)
21-AtchA-12
stakeholders (e.g., CEC’s Load Management OIR which is currently 1
proposing that utilities offer all customer classes an opt-in hourly or 2
sub-hourly real time rate by Q1 2023).13 While RTP would necessitate 3
upgrades in utility communications and billing systems, as currently 4
proposed, PG&E does not foresee significant modifications to the status quo 5
grid architecture. PG&E recently proposed real time rate pilots for 6
Commercial Electric Vehicles (proposed in Application (A.) 20-10-011), 7
Commercial and Industrial customers (proposed in A.19-11-019), and rate 8
design research for Residential and Agricultural customers (proposed in 9
A.19-11-019). 10
The third pathway is direct market participation. CAISO has two 11
agreements that allow DERs to aggregate and directly participate in the 12
wholesale market. The first model, the Demand Response Provider (DRP) 13
Agreement, allows aggregated DERs to provide energy and ancillary 14
services to CAISO’s wholesale market in the form of load reduction using 15
either CAISO’s Proxy Demand Response model or CAISO’s Reliability 16
Demand Response Resource model. California has relied on DR as a 17
critical tool in the electric grid toolkit since the 1970s. DR is now a CAISO 18
market integrated product that allows grid operators to manage system 19
demand via customers shifting their electricity consumption patterns, 20
typically in response to incentives or other pricing signals. This poses little 21
change to grid architecture as a load drop product. 22
The second agreement is the Distributed Energy Resource Provider 23
Agreement (DERA) which was approved by the Federal Energy Regulatory 24
Commission (FERC) in 2016, largely aligns with FERC Order 2222 25
(proposed in 2020), and allows aggregated DERs to provide services to the 26
CAISO market in the form of either export or load reduction. This 27
agreement poses challenges for grid architecture when the resources 28
export, necessitating tools for visibility and control with two-way power flow. 29
While PG&E does not currently have any customers using the DERA 30
13 CEC, 2020 Load Management Rulemaking Docket #19-OIR-01, at:
<https://www.energy.ca.gov/proceedings/energy-commission-proceedings/2020-load-management-rulemaking> (as of June 7, 2021).
(PG&E-4)
21-AtchA-13
agreement in its service territory; if the model is used it could pose 1
challenges to current grid architecture. 2
8. Public Policy-Driven Growth in Behind-the-Meter Solar and Storage 3
California adopted NEM in 1995 to facilitate customer self-generation of 4
renewable energy. The state subsequently approved a series of changes to 5
the program that increased and ultimately eliminated the cap on 6
installations. Today, California utility customers have installed 9.1 gigawatts 7
(GW) of behind-the-meter renewable capacity—in most cases rooftop 8
solar—with 4.7 GW of that capacity located in PG&E’s territory.14 9
Under the California NEM program, customers that install 10
behind-the-meter renewable generation can offset their energy consumption 11
at or near the full retail rate and are credited for any energy that their system 12
exports to the grid. The credit for any exports up to the customer’s annual 13
usage is at the full retail rate for pre-2017 installations and near the full retail 14
rate for installations 2017 and later. Any energy generated above a 15
customer’s annual usage is paid at the wholesale energy rate. As part of 16
the “NEM 2.0” proceeding, all new solar customers who installed solar in 17
2017 or later were required to adopt time-of-use (TOU) rates.15 18
In 2020, the CPUC opened its “NEM 3.0” process to reconsider the 19
NEM program and redesign the mechanism such that it appropriately 20
promotes behind-the-meter generation, while simultaneously shielding 21
non-participating customers from burdensome cost shifts. Notably, NEM 3.0 22
is expected to explicitly consider the role of battery storage in the NEM tariff. 23
While the outcome of the NEM 3.0 proceeding is not yet clear, the design of 24
the new NEM program will impact the adoption of behind-the-meter solar 25
and battery storage in PG&E’s service territory. The CPUC committed to 26
issuing a decision in the NEM 3.0 proceeding by end of 2021. 27
9. New Momentum for Clean Fuels for Resiliency 28
A more nascent trend in PG&E’s service territory is the potential for 29
leveraging clean fuels to maintain resiliency during PSPS events and other 30
climatic events. Leveraging hydrogen or renewable natural gas for single or 31
14 DG Products and Analysis, Distributed Generation Regular Reporting. 15 D.16-01-044, Section 2.14.1.3, starting at p. 91.
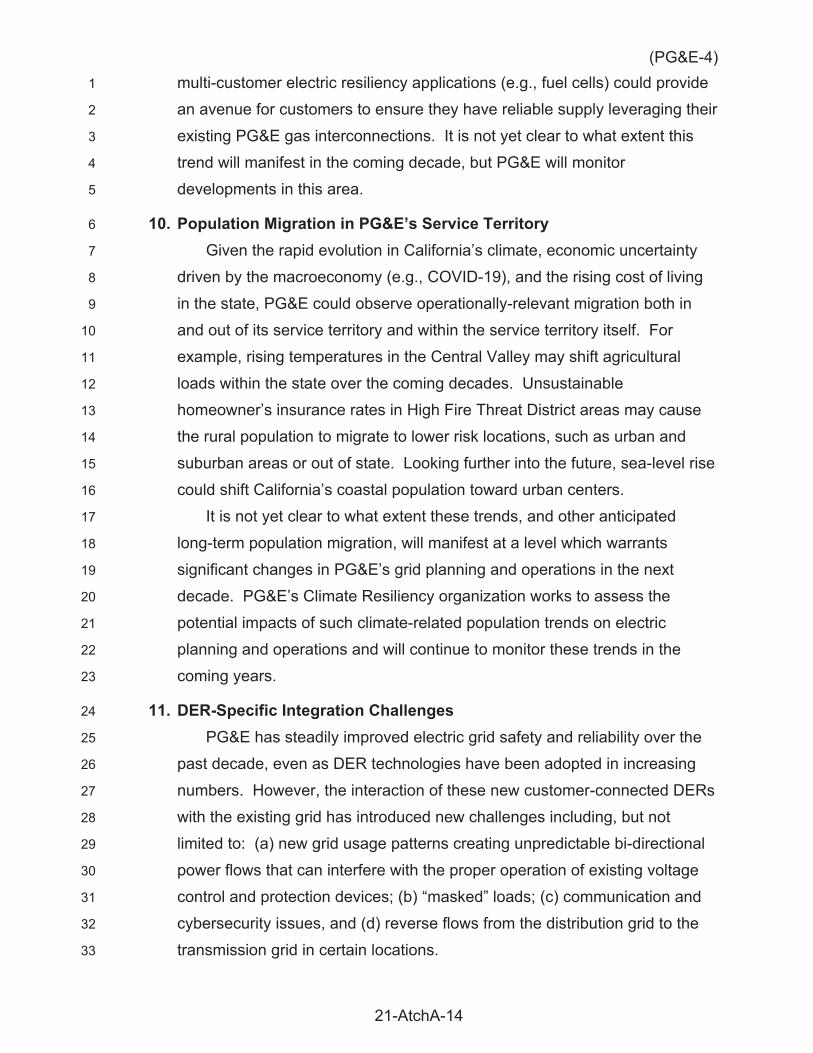
(PG&E-4)
21-AtchA-14
multi-customer electric resiliency applications (e.g., fuel cells) could provide 1
an avenue for customers to ensure they have reliable supply leveraging their 2
existing PG&E gas interconnections. It is not yet clear to what extent this 3
trend will manifest in the coming decade, but PG&E will monitor 4
developments in this area. 5
10. Population Migration in PG&E’s Service Territory 6
Given the rapid evolution in California’s climate, economic uncertainty 7
driven by the macroeconomy (e.g., COVID-19), and the rising cost of living 8
in the state, PG&E could observe operationally-relevant migration both in 9
and out of its service territory and within the service territory itself. For 10
example, rising temperatures in the Central Valley may shift agricultural 11
loads within the state over the coming decades. Unsustainable 12
homeowner’s insurance rates in High Fire Threat District areas may cause 13
the rural population to migrate to lower risk locations, such as urban and 14
suburban areas or out of state. Looking further into the future, sea-level rise 15
could shift California’s coastal population toward urban centers. 16
It is not yet clear to what extent these trends, and other anticipated 17
long-term population migration, will manifest at a level which warrants 18
significant changes in PG&E’s grid planning and operations in the next 19
decade. PG&E’s Climate Resiliency organization works to assess the 20
potential impacts of such climate-related population trends on electric 21
planning and operations and will continue to monitor these trends in the 22
coming years. 23
11. DER-Specific Integration Challenges 24
PG&E has steadily improved electric grid safety and reliability over the 25
past decade, even as DER technologies have been adopted in increasing 26
numbers. However, the interaction of these new customer-connected DERs 27
with the existing grid has introduced new challenges including, but not 28
limited to: (a) new grid usage patterns creating unpredictable bi-directional 29
power flows that can interfere with the proper operation of existing voltage 30
control and protection devices; (b) “masked” loads; (c) communication and 31
cybersecurity issues, and (d) reverse flows from the distribution grid to the 32
transmission grid in certain locations. 33
(PG&E-4)
21-AtchA-15
a. New Grid Usage Patterns Create Unpredictable Power Flows 1
In the past, electric distribution operators relied on a daily or 2
seasonal cycle of energy usage as a basis for grid control decisions; 3
today, however, new electric grid usage patterns have created 4
unpredictable bi-directional power flow, adding complexity and 5
increasing risk in managing the safe and reliable operation of the 6
distribution system. As part of PG&E’s Electric Program Investment 7
Charge (EPIC) 2.02 Demonstration Project, PG&E monitored “real-time” 8
power flows on a specific distribution feeder where a 4 MW advanced 9
energy storage unit participating in the CAISO’s frequency regulation 10
market was interconnected onto PG&E’s distribution grid. The following 11
figure, derived from this project, illustrates the dramatic difference in the 12
feeder’s loading profile; the graph on the left depicts a 24-hour 13
distribution feeder loading profile “before” interconnection of the 14
advanced energy storage unit, while the graph on the right depicts a 15
more volatile and unpredictable loading profile (for the same distribution 16
feeder) due to the interconnection of this advanced energy storage unit 17
that is participating in the CAISO frequency regulation market. 18
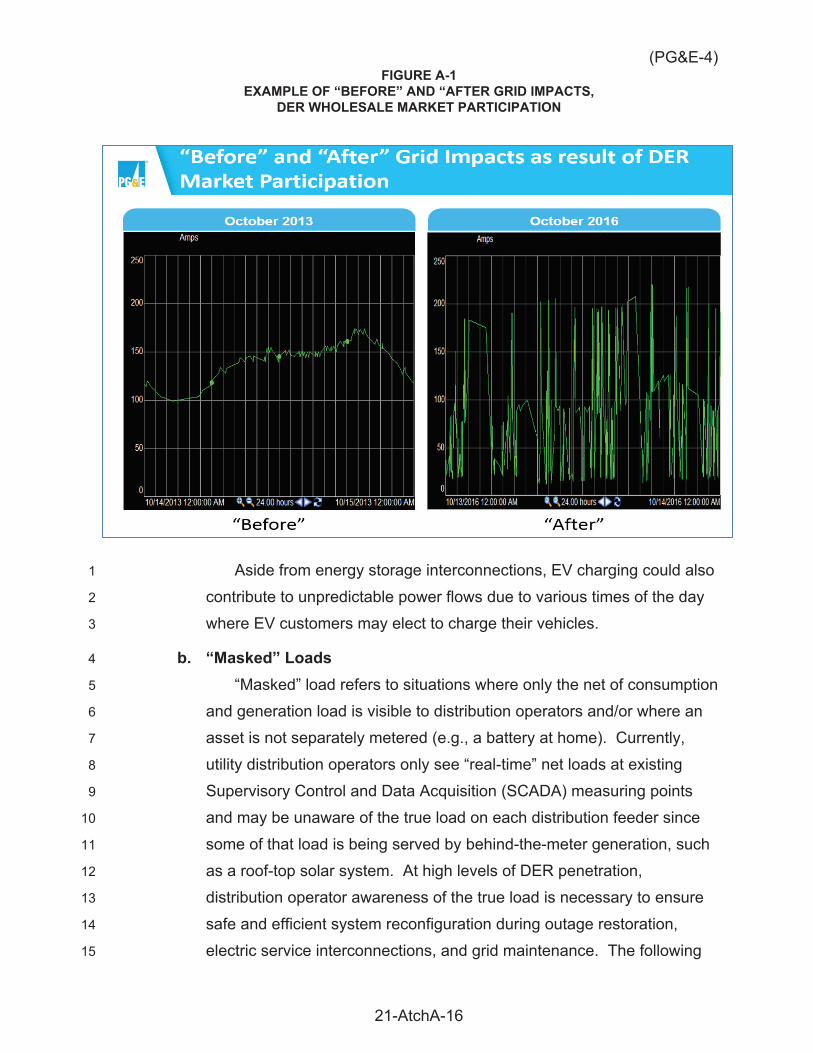
(PG&E-4)
21-AtchA-16
FIGURE A-1 EXAMPLE OF “BEFORE” AND “AFTER GRID IMPACTS,
DER WHOLESALE MARKET PARTICIPATION
Aside from energy storage interconnections, EV charging could also 1
contribute to unpredictable power flows due to various times of the day 2
where EV customers may elect to charge their vehicles. 3
b. “Masked” Loads 4
“Masked” load refers to situations where only the net of consumption 5
and generation load is visible to distribution operators and/or where an 6
asset is not separately metered (e.g., a battery at home). Currently, 7
utility distribution operators only see “real-time” net loads at existing 8
Supervisory Control and Data Acquisition (SCADA) measuring points 9
and may be unaware of the true load on each distribution feeder since 10
some of that load is being served by behind-the-meter generation, such 11
as a roof-top solar system. At high levels of DER penetration, 12
distribution operator awareness of the true load is necessary to ensure 13
safe and efficient system reconfiguration during outage restoration, 14
electric service interconnections, and grid maintenance. The following 15
(PG&E-4)
21-AtchA-17
figure illustrates the difference between distribution operators’ current 1
“net” load view and a potential future “true” load view. 2
FIGURE A-2 “NET” VS “TRUE” LOAD
E. 10-Year Vision: Grid Infrastructure3
PG&E anticipates the most significant grid modernization changes in the 4
next decade will involve the design and implementation of more resilient and 5
flexible grid infrastructure to meet the evolving needs of California’s climate and 6
political energy landscape. 7
1. Grid Hardening That Enables DERs 8
PG&E has one of the most diverse service territories in the utility 9
industry, covering 70,000 square miles in Northern California and including 10
most climate zones found in the United States. PG&E’s grid traverses 11
agricultural growing regions, coastal areas, urban hubs, mountains, forests, 12
and deserts. 13
Overhead construction of physical assets has long been preferred in 14
PG&E’s service territory because underground assets are more difficult to 15
access, and thus more costly to construct and maintain. However, as 16
(PG&E-4)
21-AtchA-18
California’s climate has rapidly changed, overhead assets are increasingly 1
at risk of both succumbing to and creating hazardous conditions. Although 2
equally applicable to customers served traditionally and customers served 3
by DERs integrated on the grid, wildfire threat has substantially increased in 4
California and prompted PG&E to harden vulnerable infrastructure to avoid 5
fire ignition and asset damage. Detailed descriptions of system hardening 6
activities associated with wildfire threat can be found in Chapter 4.3 of this 7
exhibit. 8
Climatological pressures aside from wildfires also threaten the California 9
landscape. Due to factors such as sea level rise, coastal erosion, 10
intensifying storm surge, and increasingly frequent and extreme high heat 11
events, PG&E is identifying high-risk physical assets in its service territory 12
via a comprehensive Climate Vulnerability Assessment (CVA).16 PG&E’s 13
CVA will provide the foundation for a comprehensive, risk-informed set of 14
adaptation measures that will likely include weatherization efforts that 15
benefit all customers, including those supplied by DERs that are integrated 16
onto the grid. PG&E will explore weatherization protections for these assets, 17
such as constructing levees around substations to protect against 18
increasingly severe weather. There may be additional emerging forms of 19
risk that PG&E’s assets, operations, and service may experience due to 20
climate change. The likelihood and scope of cascading events (such as 21
simultaneous events of flooding and extreme storms), or systemic and 22
chronic risks (such as sea level rise) are difficult to quantify given lack of 23
historical data or longer time horizons. In some cases, stand-alone climate 24
adaptation projects may be necessary to manage systemic risk. Future 25
climate conditions must be considered when building all new physical 26
assets. 27
2. Multi-Customer Microgrids 28
Wildfire risk and wildfire-related PSPS events have prompted California 29
to seek new methods to ensure resiliency. One of these methods is the use 30
of multi-customer microgrids including those supplied by DERs, allowing 31
16 See D.19-10-054 and 20-08-046 for details, links are available, at:
<https://www.cpuc.ca.gov/climatechangeadaptation/> (as of June 7, 2021).
(PG&E-4)
21-AtchA-19
customers to “island” from the centralized grid during hazardous weather 1
conditions and outages. As described in Section D.3, PG&E is 2
implementing programs aimed at accelerating microgrid adoption. 3
Infrastructure like microgrid controllers, resilient communications and 4
switching devices will need to be installed to successfully operate 5
multi-customer microgrids. Additionally, PG&E’s broader system will require 6
enhanced telemetry via its ADMS platform and SCADA upgrades to ensure 7
microgrid operations do not impact overall reliability. 8
3. Load Growth 9
As described in Section D.4, environmental concerns have prompted 10
California to enact decarbonization-focused mandates, including aggressive 11
transportation and building electrification goals that rely, to a certain extent, 12
on the enablement of DERs. PG&E supports cost-effective all-electric new 13
construction and increased transportation electrification. However, to 14
ensure safe and reliable service, the electric grid infrastructure needs 15
enhancements to support electrification. Capacity upgrades of existing 16
infrastructure will be needed to support growing demand, and new, 17
greenfield T&D buildout may be required. DERs have a potential role to 18
play in deferring some of these anticipated capacity projects. 19
4. Non-Wires Alternatives 20
The CPUC has required the Investor-Owned Utilities to implement the 21
Distribution Investment Deferral Framework (DIDF), which promotes the 22
development of non-wires alternatives to distribution capacity projects.17 23
PG&E has created an annual process that provides opportunities for DERs 24
to defer traditional wires investments. The DIDF program is described 25
further in Chapter 17, which describes PG&E’s Capacity investments, and 26
Chapter 21, which summarizes PG&E’s grid modernization investments. 27
PG&E has published information about PG&E’s distribution grid on its 28
publicly available Distribution Resources Plan (DRP) Data Portal,18 29
17 D.18-02-004, p. 52. 18 PG&E’s Distribution Resources Plan (DRP) Data Portal site, available at:
<https://www.pge.com/en_US/for-our-business-partners/distribution-resource-planning/distribution-resource-planning-data-portal.page> (as of June 7, 2021).

(PG&E-4)
21-AtchA-20
including opportunities for Non-Wires Alternatives and interconnection 1
hosting capacity for DERs (i.e., Integration Capacity Analysis (ICA)). 2
Additionally, programs like PG&E’s Remote Grid Initiative represent a 3
nascent trend of considering standalone power systems fueled by DERs in 4
lieu of conventional electric distribution service. The expansion of programs 5
like Remote Grid over the coming decade will necessitate new capability 6
developments (e.g., deploying and servicing on-site DERs) and 7
infrastructure (e.g., advanced metering infrastructure). 8
Key priorities for grid infrastructure include: 9
Near-Term 10
Provide opportunities for DERs as Non-Wire Alternatives to defer 11
traditional wires investments; 12
Publication of ICA and DIDF results externally on the DRP Data Portal; 13
Community Wildfire Safety Plan; 14
Multi-customer microgrid infrastructure; 15
Standalone power systems (e.g., Remote Grid Initiative); and 16
Small to moderate-sized capacity projects to accommodate 17
electrification load growth. 18
Medium-Term 19
Continuation of near-term programs, as necessary; and 20
Significant capacity increases to accommodate load growth from EV 21
charging. 22
Long-Term 23
Continuation of near- and medium-term programs, as necessary; 24
Grid hardening for other climate forces (e.g., reinforcing or relocating 25
coastal substations and electric T&D assets due to sea level rise); 26
High-Voltage Direct Current transmission; and 27
Proactive investments in EV charging infrastructure or capacity to 28
enable future EV growth. 29
F. 10-Year Vision: System Monitoring and Management 30
PG&E anticipates that it will continue to make significant investments over 31
the next 10 years to create a new suite of sophisticated grid capabilities that will 32
enhance operators’ ability to monitor and control the electric grid. 33
(PG&E-4)
21-AtchA-21
1. Advanced Distribution Management System 1
ADMS is an operational platform which allows distribution operators a 2
single view of the distribution system’s RT operations. ADMS replaces 3
legacy control center software used to operate the electric distribution 4
system with an integrated technology platform, enabling step-level 5
improvements in PG&E’s ability to monitor, manage, and control its network. 6
ADMS aggregates RT data from all telemetered field devices with the 7
distribution management system and operational management system. The 8
platform provides an enabling foundation upon which new capabilities can 9
be developed and applied to a distribution system. Examples of these 10
capabilities include: RT state estimation; more advanced fault location, 11
isolation, and service restoration (FLISR); voltage management 12
(e.g., Volt/Volt-Ampere Reactive (Volt/VAR) optimization); and dynamic 13
switching (e.g., topology controls). 14
ADMS is the cornerstone of the second layer of PG&E’s IGP pyramid, 15
focused on system monitoring and management. PG&E’s 2020 GRC Grid 16
Modernization request included funding for the development and 17
deployment of an ADMS. In its 2023 GRC, PG&E is requesting funding to 18
finalize its ADMS deployment. 19
2. Asset Sensors 20
In order to aggregate telemetry data from throughout its electric T&D 21
systems, PG&E will need to implement asset sensors throughout its grid on 22
assets like substation equipment and transformers, as well as on T&D lines 23
themselves. Data flow from these sensors is supported by PG&E’s 24
communication infrastructure, and the data is available to grid operators via 25
the ADMS platform for DER and non-DER planning, monitoring, and 26
communications. 27
3. Distribution Planning Tools/Advanced Load Forecasting 28
As described in Section C of Chapter 21, advanced distribution planning 29
tools allow for more sophisticated analyses of system conditions. These 30
tools enable scenario analysis, or the forecasting of system load under a 31
variety of differing parameters, as well as analysis along multiple time series 32
(e.g., intra-day, intra-year). Additionally, such tools can enable applications 33
(PG&E-4)
21-AtchA-22
related to the optimal siting of DERs. PG&E’s core load forecasting tool, 1
Load SEER, and PG&E’s distribution power flow software, CYME, are 2
anticipated to deliver this functionality in the coming years. 3
4. Distribution and Substation Automation 4
The automation of technology and equipment to enable passive 5
operation of the grid may improve the reliability and cost of electric grid 6
operations in some cases. PG&E has focused to date on automation 7
applications relating to substation SCADA equipment, as well as FLISR 8
technology projects—first initiated in PG&E’s Cornerstone investment 9
program. As discussed above, the foundation for many of these automation 10
applications will be unlocked once PG&E’s ADMS system has been fully 11
deployed. 12
Key priorities for system monitoring and management include: 13
Near-Term 14
Finalizing ADMS deployment; 15
Installation of enabling communications infrastructure; and 16
Advanced load forecasting tools. 17
Medium-Term 18
Continuation of near-term programs, as necessary; and 19
Continued large-scale deployment of RT sensors for asset health and 20
system conditions. 21
Long-Term 22
Continuation of near- and medium-term programs, as necessary; and 23
Further automation of distribution system operations. 24
G. 10-Year Vision: DER Grid Services 25
As DER growth may indicate, PG&E plans to build out a new suite of 26
capabilities for monitoring and controlling DERs over the next 10 years because 27
it anticipates significant activity will occur in the DER grid services space during 28
that time. 29
1. Distributed Energy Resource Management System 30
As DER growth requires and other system priorities allow, PG&E will 31
deploy a DERMS in the coming decade, beginning with its forecast in the 32
2023 GRC. DERMS is a foundational platform that will allow PG&E grid 33
(PG&E-4)
21-AtchA-23
operators to monitor and control DERs, unlocking the ability to leverage 1
DERs as a resource for electric system planning and operations. 2
Ultimately, a DERMS system will enable PG&E to manage DERs and 3
controllable loads (such as EV charging, air conditioners, and electric heat 4
pumps) to support flexible grid operations. In some cases, the control of 5
resources and loads through a DERMS system might enable the utility to 6
supply growing loads stemming from vehicle and building electrification 7
while moderating funding required for capacity investment. 8
2. Frequency/Voltage Regulation 9
Frequency regulation refers to the deployment of technology to mitigate 10
short-term fluctuations in system operational frequency, driven by 11
discrepancies between system supply and load. Similarly, voltage 12
regulation technologies offer a similar mitigation functionality to ensure 13
system voltage remains within established safety and reliability standards. 14
Both frequency and voltage regulation are significant considerations given 15
the rapid proliferation of DERs and other inverter-based devices within 16
PG&E’s service territory. With so many new inverter-based nodes, many of 17
which can both import from and export to the grid, it has become much more 18
difficult to ensure stable frequency and voltage conditions within the system. 19
In each case, a number of technologies can be applied to provide the 20
ancillary services. Historically, sources of generation with the ability to be 21
quickly dispatched have been targeted for frequency regulation; DR has also 22
been used for a similar purpose. In recent years, front-of-the-meter storage 23
applications have tested and evaluated additional value for project 24
economics by monetizing storage facilities’ abilities to provide frequency 25
regulation. Conventional voltage regulation equipment like load tap 26
changing transformers and capacitor banks has also been supplemented 27
with more advanced Volt/VAR controls, including power electronics-based 28
devices. 29
Given the expected growth in DERs like behind-the-meter solar paired 30
with storage, PG&E’s system will require further buildout of frequency and 31
voltage regulation capabilities in the coming decade. 32
(PG&E-4)
21-AtchA-24
3. Smart Inverters 1
PG&E’s EPIC Project 2.03A, Test Smart Inverter Enhanced 2
Capabilities – Photovoltaics (PV), tested and examined the application of 3
smart inverters for local voltage control in regions of high DER penetration. 4
Along with basic autonomous functionality to enable better grid integration of 5
DERs, smart inverters can provide dispatch capabilities to support grid 6
support services such as voltage regulation or capacity. These services 7
increase communication between DERs and the grid, enabling smarter and 8
more targeted use of resources. Since 2017, all new inverter-based DERs 9
installed in California are required to have smart inverters and 10
communication capabilities to integrate with utilities’ DERMS. 11
4. Advanced Load Management 12
PG&E’s DERMS platform will provide the base functionality to enable 13
more sophisticated protocols for leveraging flexible and controllable load 14
technologies (e.g., smart thermostats, electric heat pump water heaters) to 15
provide grid services as customers and distribution planners need them. 16
These technologies can help in providing conventional DR (i.e., peak load 17
management during summer peak load periods), as well as more dynamic 18
applications (e.g., local ancillary services). 19
5. Vehicle-to-Grid (V2G) 20
While the trend has not yet materialized on a significant scale, the 21
potential of EVs to serve as dispatchable grid assets which can leverage the 22
mobility and flexibility of EVs to provide services to the grid is being tested, 23
evaluated, and piloted. Such applications would require new load projection 24
capabilities to identify ideal locations for EV dispatch, as well as upgrades to 25
allow for EVs to discharge significant load back into the electric grid. PG&E 26
does not anticipate V2G applications to emerge on a large scale in the 27
coming decade, but the Company will continue to test, evaluate, and monitor 28
the technology’s progress in the next few years. 29
Key priorities for DER grid services include: 30
Near-Term 31
Enterprise DERMS installation; and 32
(PG&E-4)
21-AtchA-25
Supporting the proliferation of smart inverters in PG&E’s service 1
territory. 2
Medium-Term 3
Continuation of near-term programs, as necessary; and 4
Deployment of more sophisticated load management schemes and 5
integration into utility programs and DERMS. 6
Long-Term 7
Continuation of near- and medium-term programs, as necessary; and 8
Potential implementation of V2G functionality beyond localized pilots. 9
H. 10-Year Vision: Distribution Markets 10
PG&E anticipates minimal activity with respect to the design and 11
implementation of advanced distribution markets within the next 10 years. 12
Implementation of advanced distribution markets would require several 13
foundational elements, including a market platform and mechanisms for 14
performing and settling transactions. As referenced in PG&E’s 2020 GRC 15
10-Year Vision, PG&E anticipates that that these required elements would 16
necessitate new infrastructure and capabilities that would need to be tested, 17
evaluated, and piloted for effectiveness, feasibility, and net benefits before 18
deployment. As a result, PG&E does not plan to prioritize significant 19
investments in these areas in the coming decade. If momentum for such a 20
marketplace materializes, PG&E will continue its commitment to work with 21
technology providers and regulators to find cost-effective and viable solutions. 22
Key priorities for distribution markets include: 23
Near-Term 24
Not applicable. 25
Medium-Term 26
Ad hoc pilots to test and prove effectiveness of distribution market 27
technologies. 28
Long-Term 29
Continuation of medium-term programs, as necessary; and 30
Potential design and implementation of distribution market platform. 31
(PG&E-4)
21-AtchA-26
I. Conclusion 1
PG&E’s electric delivery system is facing a confluence of changing 2
technological, political, and climatic trends. In order to ensure safe, reliable, 3
clean, and affordable service in light of this shifting landscape, PG&E foresees a 4
number of new grid modernization programs that must be implemented in the 5
coming years – from the near-term view of this GRC cycle to items that may fall 6
outside of the next decade but will one day impact the grid. A near-term focus 7
on bolstering grid infrastructure and system monitoring and management 8
functionality will ensure that the business is prepared with the physical and 9
digital toolkit needed to manage changing grid conditions. With the deployment 10
of a DERMS platform, PG&E will continue its efforts to enable DERs to 11
participate in the planning and operation of the electric T&D systems. Finally, 12
while an advanced distribution market is not forecast to emerge in the next ten 13
years, PG&E will monitor the necessary indicators to ensure the business is 14
prepared to meet that challenge, if or when it materializes. 15

(PG&E-4)
PACIFIC GAS AND ELECTRIC COMPANY
CHAPTER 21
ATTACHMENT A1
GRID MODERNIZATION PLAN – UPGRADES INITIATED OR
COMPLETED TO DATE

(PG&E-4)
21-AtchA1-1
PACIFIC GAS AND ELECTRIC COMPANY 1
CHAPTER 21 2
ATTACHMENT A1 3
GRID MODERNIZATION PLAN – UPGRADES INITIATED OR 4
COMPLETED TO DATE 5
Distribution Planning Tools 6
CYME 7
This software for distribution power flow and fault study modeling was 8
implemented in 2011 to replace the in-house developed C-EDSA. The CYME 9
gateway pulls information from Pacific Gas and Electric Company’s (PG&E or the 10
Company) Geographic Information System (GIS) system to create circuit models 11
from circuit breaker to service transformer in an Oracle database. 12
LoadSEER 13
This software was implemented in 2012 and is used for PG&E’s geospatial load 14
forecasting which brings our system level forecast down to the feeder level with a 15
top-down bottom-up allocation. This tool helps PG&E estimate and forecast load 16
shapes where Supervisory Control and Data Acquisition (SCADA) data is not 17
available. 18
Integration Capacity Analysis (ICA) 19
This cloud-based software enables automated computation of a system-wide 20
ICA, that is the load and generation hosting capacity for different nodes of PG&E 21
distribution grid. The platform enables PG&E to execute manage-by-exception 22
workflows to ensure completeness of model data and resolve CYME power flow 23
issues in a methodical, collaborative, and consistently repeatable process. The 24
results are published on a monthly cadence on PG&E’s Distributed Resource 25
Planning Data Portal, to comply with Distribution Resource Plan (DRP) (Rulemaking 26
(R.) 14-08-013) proceeding. The public data will be utilized as a part of Rule 21 27
(R.17-07-007) screenings for new interconnection applications. 28
Distribution Investment Deferral Framework (DIDF) 29
PG&E is responsible for providing opportunities to DERs to defer distribution 30
services via the DRP (R.14-08-013), as well as Incentive Pilots via the Distributed 31
Energy Resources Distribution Deferral Account (R.14-10-003). Through the DRP, 32
PG&E has developed the DIDF to procure distribution deferral services to replace or 33
(PG&E-4)
21-AtchA1-2
defer traditional wire-based projects in the Company’s project planning pipeline. 1
PG&E also publishes annually its Grid Needs Assessment and Distribution Deferral 2
Opportunity Report. To date, PG&E has solicited for over 60 megawatts of DERs at 3
14 different candidate deferral opportunity locations. 4
DRP Data Access Portal 5
In 2020, PG&E announced a refresh of its data access portal for its DRP. This 6
portal provides access to maps and other resources for the optimal siting of DERs 7
for third-party contractors and developers. The map provides access to PG&E’s ICA 8
and DIDF results. 9
Distributed Generation Interconnection Process 10
Consistent investments and interconnection process improvements have 11
reduced interconnection times. Automated application processing (the Net Energy 12
Metering (NEM) Web Portal), launched in early 2015, expedites evaluating Rule 21 13
applications within PG&E’s service territory. These improvements lead to industry 14
leading interconnection times, and in 2014, Standard NEM projects experienced a 15
median interconnection timeframe averaging only three business days after 16
completing their interconnection application. 17
Distribution Operations Tools 18
Advanced Distribution Management System (ADMS) 19
PG&E began implementation of its ADMS system with the 2020 General Rate 20
Case (GRC) cycle. ADMS is a platform that aggregates various components of 21
operations (e.g., Distribution Supervisory Control and Data Acquisition (D-SCADA), 22
Outage Management System (OMS)) into a single operational platform. Release 1 23
(R1) of ADMS began in May 2019 and is expected to go-live in July 2022 for 24
five divisions. R1 replaced SCADA and rules-based fault location isolation and 25
service restoration (FLISR), deployed a new network model, and automates key 26
processes for fire mitigation. Further ADMS implementation will continue in the 27
coming years. 28
OMS 29
Along with D-SCADA, PG&E’s OMS is the central platform used by 30
Distribution Operators to manage planned outages, and quickly identify, locate, and 31
isolate unplanned outages. This platform also interfaces crew scheduling and 32

(PG&E-4)
21-AtchA1-3
resourcing to restore outages as quickly as possible, as well as with customer 1
notification systems. 2
Integrated SCADA and Distribution Management System (DMS) 3
The initial DMS software deployed in 2015 to support the control center 4
consolidation provided basic capabilities, including an electronic mapping system to 5
eliminate the use of paper wall maps and push pins to track electric distribution 6
system operations. SCADA and DMS are not currently integrated, requiring 7
operators to manually transfer data between systems and view different computer 8
screens to see activity throughout the system. In this GRC cycle, PG&E proposes to 9
integrate D-SCADA with DMS and OMS to form ADMS. This integration will result in 10
seamless and transparent user interfaces for improving operator safety, reliability, 11
and efficiency. The new ADMS, along with upgrades to communication 12
infrastructure, will enable PG&E to communicate with and control the large number 13
of forecasted DERs to maintain/enhance stable grid operation in the future. 14
Distribution Control Center Consolidation 15
PG&E consolidated its 13 Distribution Control Centers down to three 16
state-of-the-art facilities over a multi-year project that has transformed how it 17
monitors and operates its electric grid. Benefits include enhanced reliability, quicker 18
response to outages and emergencies such as natural disasters, and increased 19
capabilities to continue adding clean, renewable power sources such as solar and 20
wind. The new control centers have been equipped with systems that support 21
today's Smart Grid technology but will also support future upgrades as well. New 22
technology incorporates advanced electronic mapping of PG&E's electric distribution 23
grid and SmartMeter™ data to help operators pinpoint the exact location of an 24
outage, which will expedite restoration efforts. 25
Grid Connectivity Model 26
GIS 27
The Electric Distribution GIS project enhanced and converted PG&E’s 28
distribution system asset data into an integrated GIS/ SAP AG Software system that 29
provides analytical and visualization tools to enhance Electric Distribution asset 30
management and operations. The project formed the foundation of the digital 31
network model utilized within DMS, OMS, and ADMS, and also provided the 32
technology tools to update and validate asset data and enable mobile applications 33

(PG&E-4)
21-AtchA1-4
for field personnel to collect inspections, testing, and maintenance data at the 1
worksite. 2
Sensors and Controllers 3
D-SCADA 4
PG&E’s D-SCADA system gathers, processes, and displays electric system 5
status, enables remote control of equipment, and provides operational data to 6
operators at control centers and other PG&E employees. The D-SCADA system 7
consists of a software application with visualization tools in the distribution control 8
centers, and field devices which send and receive data and control signals. PG&E 9
began installing SCADA-equipped sensors on its distribution and transmission lines 10
in 1986 and SCADA is now enabled within nearly 100 percent of substations and 11
over 11,500 field devices. 12
SmartMeters 13
PG&E has installed over 5 million electric SmartMeters throughout its service 14
area, beginning in 2011. SmartMeters transformed a system that once relied on 15
meter readers that collect data once a month to a system that digitally collects 16
energy usage information every hour. SmartMeters have enabled 5.5 million 17
customers to have access to their hourly energy usage information made available 18
via PG&E’s My Energy website. Data from SmartMeters and is also now 19
integrated into Distribution Operations systems to identify outages and provide 20
system telemetry. 21
Smart Inverters 22
In California, the Electric Rule 21 Generating Facility Interconnections Tariff 23
governs the requirements for interconnecting generation facilities on the 24
Distribution System. Rule 21 Section Hh has required customers to install over 25
200,000 certified smart inverters for Distribution interconnections in PG&E’s territory 26
starting in late 2017, with additional functionality added in subsequent years. Smart 27
inverter functionality includes autonomous protective functions, power quality 28
support, ride-through capabilities, and most recently, monitoring and control via 29
communications capabilities. Smart inverters help mitigate the adverse effects of 30
ever-increasing levels of distributed generation on PG&E’s system, as well as 31
provide a path for remote configuration of these assets as the grid and DER 32
programs continue to evolve. 33

(PG&E-4)
21-AtchA1-5
Fault Location Isolation and System Restoration (FLISR) 1
FLISR systems reduce the impact of outages by quickly opening and closing 2
automated switches to reduce what may have been a one- to two-hour outage to 3
less than five minutes. Over 975 circuits on the distribution system are supported by 4
FLISR, which was first funded in the Cornerstone Decision (Decision 5
(D.) 10-06-048). 6
Line Sensors and Fault Indicators 7
PG&E has installed overhead fault indicators and line sensors to improve 8
reliability by more quickly identifying fault locations through visible targets or through 9
remote detection in the case of line sensors. By more quickly identifying locations of 10
circuit trouble, PG&E can more rapidly isolate failed equipment and restore service 11
after unplanned outages. PG&E has installed over 180 line sensors and over 12
36,000 fault indicators in its service territory to date. 13
Relay Replacement 14
PG&E is actively replacing older mechanical relays with new solid-state relays 15
that have integrated protection, automation, and control functionality. This 16
integrated replacement approach allows for more cost-effective installation and 17
testing, and standardizes design, which leads to better operability compared to 18
separately installed systems. PG&E’s System Protection Department manages a 19
relay replacement list, and prioritizes replacements based on age and other 20
technical evaluation factors including but not limited to criticality of the station, 21
number of customers that could be affected, and type of customers. PG&E 22
proposes to replace protective relays on an average of 30 substation transformers 23
annually through 2026. 24
Communications Infrastructure 25
PG&E’s communication backhaul network supports a wide variety of sensors, 26
controls, end devices, and employee electronics. The network is comprised of: 27
(1) a Wide Area Network (WAN) that ties PG&E’s data centers to the rest of PG&E’s 28
locations, users, business partners, and customers; (2) a Transport Network—29
comprised of fiber optic cables, microwave transmitters, leased lines from third-party 30
carriers that provides connectivity between sites across the WAN; and (3) a private 31
Field Area Network (FAN) carries information to and from devices in the field and 32
connect them to WAN or the SCADA system. FAN technology provides the 33
(PG&E-4)
21-AtchA1-6
performance to handle the real time data transmission requirements of emergent 1
grid control and automation technologies. 2
Battery Storage Projects 3
PG&E has utilized Battery Energy Storage Systems since 2012. The Vaca-4
Dixon 2 megawatt (MW)/14 MW Alameda Naval Air Station (NAS) Battery project at 5
the Vaca-Dixon Substation became operational in August 2012 and commenced 6
California Independent System Operator (CAISO) Market operations in August 2014. 7
It is 100 percent dedicated to CAISO wholesale market participation. The Yerba 8
Buena 4 MW/28 megawatt-hour (MWh) NAS Battery project at a Customer 9
Research and Development Facility in San Jose became operational in May 2013. It 10
is used for daily peak shaving and has the ability for half energy reserved for 11
islanding/backup for the adjacent customer facility. The Browns Valley 12
500 kilowatt/2 MWh li-ion Battery project at Browns Valley Substation became 13
operational in January 2017 and is used for seasonal peak shaving and deferral of 14
distribution bank replacement. The Elkhorn 182.5 MW/4 hr storage system at Moss 15
Landing Substation and the Llagas 20 MW/80 MWh projects are approved and 16
under construction. 17
Microgrid Deployments 18
PG&E has collaborated with the Redwood Coast Energy Authority, Schatz 19
Energy Research Center at Humboldt State University, Humboldt County, and 20
Schweitzer Engineering Laboratories, among others in development of the Redwood 21
Coast Airport Microgrid. This front-of-the-meter, multi-customer microgrid featuring 22
solar power generation paired with battery energy storage is under construction and 23
on schedule for full operation in Q4 2021. The microgrid will provide renewable 24
energy for 18 customer meters, including the Arcata-Eureka Airport and a U.S. 25
Coast Guard Air Station, and will be capable of disconnecting from the broader grid 26
(island mode) and operating as an independent, PG&E-operated grid segment 27
during a planned or unplanned power outage. 28
(PG&E-4)
PACIFIC GAS AND ELECTRIC COMPANY
CHAPTER 21
ATTACHMENT A2
DER-RELATED RESEARCH, DEVELOPMENT AND
DEMONSTRATION (RD&D) PROJECTS
(PG&E-4)
21-AtchA2-1
PACIFIC GAS AND ELECTRIC COMPANY 1
CHAPTER 21 2
ATTACHMENT A2 3
DER-RELATED RESEARCH, DEVELOPMENT AND 4
DEMONSTRATION (RD&D) PROJECTS 5
The following describes Pacific Gas and Electric Company’s (PG&E) 6
RD&D-related project achievements and their influence on the five key areas of the 7
proposed Grid Modernization Program portfolio: (1) Distribution Operations 8
Platforms including the Advanced Distribution Management System (ADMS) and 9
Distributed Energy Resource Management System (DERMS); (2) Distribution 10
Engineering Planning Tools; (3) Battery System Deployment; (4) Microgrid 11
Deployment; and (5) Communication Infrastructure. 12
13
RD&D Projects Supporting the ADMS and DERMS Platforms 14
Electric Program Investment Charge (EPIC) 2.02 Demonstration DERMS: 15
Distribution Management Systems (DER) may provide benefits to the grid if there is 16
sufficient visibility and control of the resources. EPIC Project 2.02 demonstrated a 17
scaled down ADMS and a DERMS platform to monitor and coordinate the control of 18
various types of distributed energy resources, including Distributed Generation and 19
energy storage to manage system constraints and provide distribution grid services. 20
This demonstration’s learnings are incorporated into PG&E’s proposed 21
ADMS/DERMS solution in the Integrated Grid Platform, addressing how capabilities 22
fit together and what capabilities PG&E will need to manage an increasingly complex 23
distribution grid while enabling new value streams from DERs. This includes 24
operational capabilities and application implementation (ADMS and DERMS), 25
foundational model/system improvements to enable these applications (Geographic 26
Information System (GIS) and other data improvement), monitoring and 27
communications to provide necessary DER visibility, and standardizing and securing 28
integration with DERs. 29
EPIC 2.03A Test Smart Inverter Enhanced Capabilities: This project 30
assessed how to leverage customer-sited Smart Inverters for grid benefits by 31
remotely controlling them (via vendor portals or third-party aggregator platforms) for 32
voltage/frequency regulation and mitigation of reverse power flow adverse effects. 33
(PG&E-4)
21-AtchA2-2
This project ultimately informs distribution planning, interconnection enhancements, 1
ADMS requirements, customer program(s) related to smart inverters, as well as 2
policies and contractual agreements for customers to allow PG&E to use/control 3
their smart inverters in the service of power quality. 4
EPIC 2.14 Phase ID: To improve distribution network models, this project 5
demonstrated a variety of pre-commercial analytics and hardware options to 6
automatically map three-phase electrical power information, including meter to 7
transformer mapping, which will be scaled up through improved GIS data and 8
leveraged by PG&E’s proposed ADMS solution. 9
EPIC 2.07 Meter Loading Data: To advance switching-related decision making 10
for grid operators, this project created an advanced algorithm using SmartMeter™ 11
data to more accurately estimate circuit-level meter load and demonstrate how to 12
aggregate real-time loading data up through the distribution model. This 13
functionality demonstrated in this project will inform ADMS design requirements. 14
EPIC 3.03 DERMS and ADMS Advanced Functionality: To develop a low-15
cost solution for DER telemetry & control, this project is developing a DERMS 16
head-end system and associated interfaces and demonstrating this system on: 17
(1) an operational remote grid and (2) the Blue Lake Rancheria microgrid in 18
Humboldt County. This project will inform operating strategies and produce 19
capabilities to significantly increase the flexibility of the grid and provide fundamental 20
capabilities to reduce overall wildfire risk exposure and increase resilience for 21
customers. The project will also reduce the cost of telemetry associated with large 22
scale DERs interconnected to PG&E’s grid. 23
24
RD&D Projects Supporting Distribution Engineering Planning Tools 25
EPIC 2.22 Demand Reduction for Targeted Analytics: To automate the 26
approach for identifying least-cost, best-fit DER portfolio recommendations, this 27
project used grid, SmartMeter, customer demographic, DER load impact, and other 28
data sources to proactively identify non-wires alternative opportunities, recommend 29
an optimized portfolio of DER technologies, and provide specific customer and 30
technology recommendations by location based on grid need. The project 31
investigated whether PG&E can achieve a sufficient amount of demand reduction, 32
give visibility into the customer-side resources, and improve the reliability of 33
customer-side resources at the local level to delay the need for local capacity 34

(PG&E-4)
21-AtchA2-3
expansion expenditures. This project was completed in 2018 and is being scaled up 1
to support PG&E’s advancing distribution planning processes through optimized 2
location-specific targeting to leverage cost-effective, non-wires alternatives based on 3
grid need. 4
EPIC Project 2.23 Integrate Demand-Side Approaches into Utility Planning: 5
This project successfully developed and demonstrated the integration of a broader 6
range of customer-side technologies and DER approaches into the utility planning 7
process. The project served as a necessary and enabling precursor to the fulfillment 8
of Assembly Bill 327/Section 769, which requires transparent, consistent, and more 9
accurate methods to cost-effectively integrate DERs into the distribution planning 10
process. This project delivered new load shape profiles, and an enhanced load 11
forecasting tool and overall analytical process that allows PG&E to more accurately 12
and consistently integrate DER impact to the distribution system load profile. With 13
these enhancements, PG&E can evaluate if DER growth could defer or even in 14
some instances eliminate the need for future network upgrades. Leveraging 15
SmartMeter data, PG&E created more accurate and granular load shapes that 16
allowed distribution planners to more precisely capture DER impact on the load 17
growth forecast.1 18
Ultimately, EPIC Project 2.23 helps ensure that DER forecasts are incorporated 19
in PG&E’s planning process and EPIC Project 2.22 will help identify areas where 20
additional DERs could provide grid value. 21
22
RD&D Projects Supporting Battery System Deployment 23
EPIC 1.01 Energy Storage End Uses and EPIC 1.02 Demonstrate Use of 24
Distributed Energy Storage for Transmission and Distribution Cost Reduction: 25
EPIC Project 1.01 utilized PG&E’s Vaca Dixon and Yerba Buena Sodium Sulfur 26
Battery Energy Storage Systems to automatically participate in California 27
Independent System Operator’s (CAISO) Non-Generator Resource market to gain 28
real-world experience and performance data for operating batteries as market 29
resources. The project developed and deployed an automated communications and 30
control solution platform to enable these and future resources to respond 31
1 EPIC 2.23 Final Report: https://www.pge.com/pge_global/common/pdfs/about-
pge/environment/what-we-are-doing/electric-program-investment-charge/PGE-EPIC-Project-2.23.pdf.
(PG&E-4)
21-AtchA2-4
automatically to CAISO market awards.2 EPIC Project 1.02 was designed as a 1
complement to PG&E’s EPIC Project 1.01; EPIC Project 1.01 focused on the 2
potential energy market values for energy storage, while EPIC Project 1.02 focused 3
on the non-market, distribution functionality of energy storage assets. Specifically, 4
EPIC Project 1.02 deployed a 500 kilowatt/2 megawatt-hour energy storage system 5
at the Browns Valley substation and integrated the energy storage system control 6
into PG&E’s Supervisory Control and Data Acquisition system to deliver autonomous 7
distribution peak shaving functionality. The project learnings have informed PG&E’s 8
and other utilities’ procurement of future energy storage resources, both utility-9
owned and utility-contracted, through compliance with the Investor-Owned Utility 10
energy procurement targets as set forth in Decision 10-03-040 and beyond.3 11
EPIC 2.19 Enable Distributed Demand-Side Strategies and Technologies: 12
This project demonstrated the potential to use customer-sited energy storage 13
technologies to reduce peak loading and absorb DER generation. For 14
behind-the-meter energy storage assets to be reliably used for distribution or grid 15
services, PG&E will need to have additional hardware and software systems 16
(e.g., two-way communication systems, operational protocols and priorities, a 17
DERMS platform, sensors and controls, etc.) to provide accurate visibility into asset 18
performance and availability, and assurances that the behind-the-meter energy 19
storage assets will consistently and reliably respond to dispatch signals. These 20
gaps identified will be incorporated into PG&E's proposed ADMS platform.4 21
22
RD&D Projects Supporting Microgrid Deployment 23
EPIC 3.11 – Location Targeted DERs: This project is configuring the 24
Arcata-Eureka airport’s local microgrid controller to integrate with PG&E’s 25
distribution network and enable Distribution Control Center visibility and control of 26
2 EPIC 1.01 Final Report: https://www.pge.com/pge_global/common/pdfs/about-
pge/environment/what-we-are-doing/electric-program-investment-charge/PGE-EPIC-Project-1.01.pdf.
3 EPIC 1.02 Final Report: https://www.pge.com/pge_global/common/pdfs/about-pge/environment/what-we-are-doing/electric-program-investment-charge/PGE-EPIC-Project-1.02.pdf.
4 EPIC 2.19 Final Report: https://www.pge.com/pge_global/common/pdfs/about-pge/environment/what-we-are-doing/electric-program-investment-charge/PGE-EPIC-Project-2.19.pdf.
(PG&E-4)
21-AtchA2-5
the microgrid. The project is developing scalable and replicable approaches to 1
planning, designing, deploying, and operating multi-customer microgrids. At an 2
additional site with existing high penetration of advanced DERs, this project will also 3
develop and demonstrate capabilities to enable intelligent coordination between 4
customer DERs and the main utility grid under normal operation and to provide real-5
time resiliency support when operated as a microgrid or Public Safety Power Shutoff 6
island including utility temporary generation. The results of this project will inform 7
operating strategies and produce capabilities to significantly increase the flexibility of 8
the grid and provide fundamental capabilities to advance system resiliency. 9
10
RD&D Projects Supporting Communications Infrastructure 11
EPIC 2.26 Customer and Distribution Automation Open Architecture 12
Devices: This project evaluated how to allow customers and vendors to connect 13
and communicate with their DER devices and applications over the Advanced 14
Metering Infrastructure (AMI) network by testing open system architecture with 15
defined methodology, protocols, and standards using the Internet Protocol version 6 16
(IPv6) AMI network. The project provided physical and application interfaces to 17
permit customer and third-party devices to connect to PG&E’s AMI network(s) and 18
conduced testing to certify customer and third-party open architecture devices and 19
applications are AMI compatible, highly secured, interoperable, and meet all PG&E 20
requirements. 21
(PG&E-4)
PACIFIC GAS AND ELECTRIC COMPANY
CHAPTER 21
ATTACHMENT A3
COMMUNITY MICROGRID ENABLEMENT PROGRAM
EVALUATION

(PG&E-4)
21-AtchA3-i
PACIFIC GAS AND ELECTRIC COMPANY CHAPTER 21
COMMUNITY MICROGRID ENABLEMENT PROGRAM EVALUATION
TABLE OF CONTENTS
A. Background .................................................................................................... 21-1
B. Project Size Cap ............................................................................................. 21-2
C. Eligibility Criteria ............................................................................................. 21-2
D. Application Process ........................................................................................ 21-3
E. Cost Offset Reservation Trigger ..................................................................... 21-4
F. Outreach Plan Feedback ................................................................................ 21-5
G. Summary ........................................................................................................ 21-5
(PG&E-4)
21-AtchA3-1
PACIFIC GAS AND ELECTRIC COMPANY 1
CHAPTER 21 2
COMMUNITY MICROGRID ENABLEMENT PROGRAM EVALUATION 3
A. Background 4
The California Public Utilities Commission (CPUC or Commission) approved 5
the Community Microgrid Enablement Program (CMEP) framework in Decision 6
(D.) 20-06-017. In that Decision, the Commission directed Pacific Gas and 7
Electric Company (PG&E) to file an Implementation Plan advice letter. That 8
Implementation Plan advice letter1 was approved by the CPUC, with 9
modifications, on March 18, 2021 in Resolution (Res.) E-5127. 10
D.20-06-017 directed that PG&E include a program evaluation of CMEP in 11
its 2023 General Rate Case (GRC). As stated in that Decision, “The GRC 12
evaluation shall enable the Commission to evaluate the efficacy of the program 13
and determine whether the program should continue beyond 2022.”2 As directed 14
in that Decision and in Res.E-5127, PG&E provides below an evaluation of 15
CMEP’s project size cap, eligibility criteria, application process, cost offset 16
reservation trigger, and feedback on its outreach plan to disadvantaged and 17
vulnerable communities. 18
Since the program was only fully approved in March 2021, PG&E has had 19
limited time and experience with the program. However, PG&E is still able to 20
provide an initial program evaluation based on its work thus far with communities 21
under the program. PG&E will also share the lessons learned through the 22
CMEP thus far as part of the Microgrid Incentive Program (MIP)3 development 23
process in order to help inform the development of that program. Indeed, the 24
1 PG&E Advice Letter 5918-E. 2 D.20-06-017 p. 85. 3 As part the Microgrid and Resiliency Strategies Track 2 Decision (D.21-01-018), the
Commission adopted the MIP as an expansion of the original CMEP concept, applicable to all three large IOUs in California. The IOUs are preparing to conduct stakeholder outreach regarding the MIP design and are required under the Track 2 Decision to file a detailed implementation letter within 120 days of the stakeholder outreach advice letter receiving approval.
(PG&E-4)
21-AtchA3-2
CPUC in D.21-01-018 authorized PG&E to propose changes to the CMEP that 1
may be necessary to integrate the program more fully with the MIP.4 2
B. Project Size Cap 3
The Community Microgrid Enablement Tariff (CMET), which PG&E 4
submitted to the Commission as part of its CMEP implementation advice letter, 5
allows Project Resources sized in aggregate up to 20 megawatt (MW). PG&E 6
chose this project cap size in order to correspond generally with requirements to 7
interconnect at the distribution level of PG&E’s system. Facilities larger than 20 8
MW would typically need to be connected to a substation bus or transmission 9
line, which is a more complex and expensive undertaking outside the target 10
scope and funding for the CMEP. 11
Several parties to the Microgrids and Resiliency proceeding5 have 12
requested that PG&E clarify whether this project size cap refers to nameplate 13
capacity or export capacity, and some have requested that it refer to export 14
capacity or that the cap be raised. Some customers have made a similar 15
request. PG&E clarifies that nameplate capacity, as described in the CMEP 16
implementation advice letter,6 was the intent. However, PG&E will further 17
consider this issue of the 20 MW size cap, and should a different determination 18
be reached either in the development of the MIP or independently of the MIP, 19
PG&E may propose changes to the CMEP to address it. 20
C. Eligibility Criteria 21
PG&E designed the CMEP in order to support those communities and 22
customers most in need of resilience. As such, the program’s eligibility criteria 23
for access to the CMET and cost offsets includes a requirement that at least one 24
customer served by the microgrid be located either in a Tier 2/3 High Fire Threat 25
District, or in an area that has been impacted by a Public Safety Power Shutoff 26
(PSPS) event, or in an area prone to outages, defined for this purpose as the top 27
1 percent Worst Performing Circuits excluding Major Event Days, from PG&E’s 28
Annual Electric Reliability Report, in either of the last two years. The program 29
4 D.21-01-018, p.62. 5 Rulemaking19-09-009. 6 Advice Letter 5918-E, p.12.
(PG&E-4)
21-AtchA3-3
also requires the project to serve at least one critical facility and one additional 1
customer within the electrical boundary of the microgrid. 2
It is important to note that the tools and resources available through the 3
Community Resilience website, as well as Stage 1 of CMEP’s Enhanced 4
Technical Support (“Project Vetting”) are open to communities seeking energy 5
resilience solutions of any kind. The locational eligibility criteria noted above do 6
not apply to this initial concept exploration stage. As such, all communities in 7
PG&E’s service area are eligible for some form of CMEP support. 8
PG&E notes that the Joint Community Choice Aggregators (CCAs) in their 9
Protest of AL 5918-E argued that the exclusion from CMEP of areas in which 10
there is no reasonably anticipated potential future PSPS events due to other 11
PSPS mitigation activities is too vague and will be challenging to implement. 12
While PG&E stands by the assertion it made in its reply that criteria such as this 13
are highly dynamic and not feasibly reduced to static map layers for all of 14
PG&E’s service area, this is an area that may warrant further scrutiny. 15
Finally, PG&E notes that it has encountered communities and customers 16
which wish to use the CMET in order to operate a multi-customer microgrid, 17
even if those community microgrid projects would be deemed ineligible for the 18
CMEP cost offsets. While PG&E believes it is generally prudent to focus limited 19
customer dollars on those communities with the greatest resilience need, it 20
acknowledges that eligibility for the tariff itself, separate from the cost offsets, 21
warrants further evaluation. In particular, PG&E intends to seek collaborative 22
solutions, based upon the CMET, for these community microgrid projects that 23
would allow them to move forward while pending the Commission’s broader 24
consideration of a multi-property microgrid tariff in Track 4 of the Microgrid and 25
Resiliency Strategies OIR. 26
D. Application Process 27
As described in PG&E’s CMEP Resilience Planning Guide, PG&E has 28
developed a 3-stage, 11-step process to support community resilience project 29
development, from initial concept exploration, through solution assessment, to 30
solution execution. Step 5 in that process is the CMEP Application. The 31
Application step is timed in such a way that the community and its 32
technical/engineering partner(s) will have had detailed technical exchanges with 33
PG&E regarding the protocols and requirements necessary to operate a 34
(PG&E-4)
21-AtchA3-4
community microgrid on PG&E’s distribution system, and the specific constraints 1
and requirements of the proposed project. The applicant will have the 2
information necessary to submit a high-quality interconnection application as 3
well as CMEP Application. 4
The CMEP Application simply synthesizes the information developed in the 5
previous stages. The objective of the Application is to provide PG&E the 6
required information to assess the proposed project for CMEP eligibility and 7
review documentation required to perform the Microgrid Islanding Study (MIS) 8
pursuant to the CMEP. 9
At this time, PG&E believes the CMEP Application process is well-placed in 10
the progression of development of a community microgrid. The applicant is 11
supported through every step of the process before and after the Application, 12
and the Application itself merely synthesizes project design information garnered 13
through earlier stages in the process. 14
PG&E notes that some refinement may be necessary to the required 30-day 15
timing for review of the Interconnection Study and agreement to proceed with a 16
MIS. In those cases when multiple interconnection applications have been 17
submitted for the same microgrid, the Community Microgrid Aggregator may be 18
unable to make an informed decision about the wisdom of proceeding with a 19
MIS until it has all of the relevant studies completed with their associated cost 20
and timeline information. PG&E will further evaluate this issue in development 21
of the MIP. 22
E. Cost Offset Reservation Trigger 23
The trigger for confirming and reserving cost offsets in the CMEP process is 24
completion of the MIS, and execution of the Project Special Facilities 25
Agreement. Reserving cost offsets at this point in the process provides a level 26
of assurance that the applicant has an operationally safe microgrid design that 27
can integrate within PG&E’s distribution system. Further, the Project Special 28
Facilities Agreement will provide detailed cost estimates for the CMEP-eligible 29
distribution upgrades necessary to enable the safe islanding of the microgrid; 30
that is, those upgrades which will be paid for by CMEP cost offsets. 31
At this time, PG&E sees no need to alter the timing of the trigger for 32
reservation of cost offsets, or to suggest an alternate trigger. PG&E suggests 33
the cost offset reservation trigger remain as it is currently and continue to 34
(PG&E-4)
21-AtchA3-5
evaluate the placement along with other criteria as the program gains further 1
experience. 2
F. Outreach Plan Feedback 3
On May 3, 2021, in conformance with Ordering Paragraph 4 of Res.E-5127, 4
PG&E provided its CMEP Outreach Plan for Disadvantaged and Vulnerable 5
Communities to the Energy Division’s Central Files and made the plan publicly 6
available on PG&E’s CMEP website. As described in that plan, PG&E will begin 7
with preparation and initial outreach in Quarter 2 2021, focused on preparing 8
messaging, identifying potential partner agencies and organizations, and 9
identifying complementary sources of resilience funding, where possible. 10
PG&E has had limited time to execute this plan and receive feedback on it. 11
With that said, PG&E has already begun conversations with some 12
community-based organizations, CCAs, and rural and tribal communities, to 13
learn more about their local needs and desires in regard to energy resilience, 14
and the challenges they are facing. These continuing conversations will inform 15
PG&E’s outreach to facilitate awareness among disadvantaged and vulnerable 16
communities of the CMEP as well as of other potential resilience funding 17
sources and opportunities. The feedback at this time to PG&E’s initial 18
conversations as part of this outreach plan have been positive. 19
G. Summary 20
In summary, while the CMEP was only fully approved in March 2021, PG&E 21
is able to provide an initial program evaluation based on its engagement with 22
customers and communities thus far under the program. PG&E will share its 23
lessons learned through the CMEP as part of the MIP development process in 24
order to help inform the development of that program. Finally, PG&E may 25
propose changes to the CMEP to more fully integrate it with the MIP, as 26
authorized in D.21-01-018,7 or separately through the submission of a separate 27
advice letter.8 28
7 D.21-01-018, p.62. 8 Advice Letter 5918-E, p. 15, fn. 23 (approved by Resolution E-5127).
(PG&E-4)
PACIFIC GAS AND ELECTRIC COMPANY
CHAPTER 22
ELECTRIC DISTRIBUTION SUPPORT ACTIVITIES
(PG&E-4)
22-i
PACIFIC GAS AND ELECTRIC COMPANY CHAPTER 22
ELECTRIC DISTRIBUTION SUPPORT ACTIVITIES
TABLE OF CONTENTS
A. Introduction ..................................................................................................... 22-1
1. Scope and Purpose ................................................................................. 22-1
2. Summary of Request ............................................................................... 22-1
3. Overview of Recorded and Forecast Costs .............................................. 22-2
a. Expense ............................................................................................. 22-2
b. Capital ............................................................................................... 22-3
4. Support for Request ................................................................................. 22-4
5. Organization of the Remainder of This Chapter ....................................... 22-5
B. Program and Risk Overview ........................................................................... 22-5
1. Program Description ................................................................................ 22-5
a. Program Overview ............................................................................. 22-5
b. Management Structure ...................................................................... 22-5
2. Risk Integration ........................................................................................ 22-6
C. Activities, Costs, and Forecast Drivers by MWC ............................................ 22-7
1. Expense MWCs ....................................................................................... 22-7
a. Miscellaneous Expense (MWC AB) ................................................... 22-7
1) Distribution Support ..................................................................... 22-7
2) Applied Technology Services ...................................................... 22-7
3) Additional Asset Data Capture (DOVHD-M005) .......................... 22-8
4) Improved Distribution Risk Model (DOVHD-M009) ..................... 22-8
5) Federal Land Authorization ......................................................... 22-9
6) Interdepartmental Energy Usage ................................................ 22-9
7) Regulatory Compliance and QA Group ....................................... 22-9
8) Public Awareness Outreach ...................................................... 22-11

(PG&E-4) PACIFIC GAS AND ELECTRIC COMPANY
CHAPTER 22 ELECTRIC DISTRIBUTION SUPPORT ACTIVITIES
TABLE OF CONTENTS
(CONTINUED)
22-ii
9) Affordability ............................................................................... 22-11
10) MWC AB Forecast Summary .................................................... 22-12
b. Streetlight Support (MWC IS) .......................................................... 22-12
c. Operational Management (MWC OM) and Operational Support (MWC OS) ....................................................................................... 22-13
2. Capital MWCs ........................................................................................ 22-15
a. Tools and Equipment (MWC 05) ..................................................... 22-15
1) General Tools ............................................................................ 22-15
2) ATS Tools ................................................................................. 22-16
3) MWC 05 Forecast Summary ..................................................... 22-16
b. Miscellaneous Capital (MWC 21) .................................................... 22-18
1) ATS Lab Safety and Reliability Upgrades ................................. 22-18
2) Affordability ............................................................................... 22-18
3) MWC 21 Forecast Summary ..................................................... 22-18
D. Estimating Method ........................................................................................ 22-20
E. Compliance with Section 5.2 of the 2020 GRC Settlement Agreement (“Deferred Work Principles”) ......................................................................... 22-20
F. Cost Tables .................................................................................................. 22-20

(PG&E-4)
22-1
PACIFIC GAS AND ELECTRIC COMPANY 1
CHAPTER 22 2
ELECTRIC DISTRIBUTION SUPPORT ACTIVITIES 3
A. Introduction 4
1. Scope and Purpose 5
The purpose of this chapter is to demonstrate that Pacific Gas and 6
Electric Company’s (PG&E or the Company) expense and capital 7
expenditure forecasts for electric distribution support activities are 8
reasonable and should be approved. 9
This chapter includes forecasts for four expense Major Work Categories 10
(MWC) – MWC AB (Miscellaneous Expense), MWC IS (Streetlight Support), 11
MWC OM (Operational Management), and MWC OS (Operational Support) 12
– and two capital MWCs – 05 (Tools and Equipment), and 13
21 (Miscellaneous Capital).1 14
2. Summary of Request 15
PG&E requests that the Commission adopt its 2023 expense forecast of 16
$131.6 million for Electric Distribution Support Activities, which is 17
$32.4 million higher than 2020 recorded expense costs of $99.2 million.2 18
PG&E further requests that the Commission adopt its capital forecast of 19
$(18.3) million for 2021, $10.7 million for 2022, $8.4 million for 2023, 20
$8.6 million for 2024, $8.8 million for 2025, and $9.0 million for 2026 for 21
capital expenditures for electric distribution support activities.3 PG&E’s 22
2023 capital forecast for electric distribution support is $0.4 million higher 23
than its 2020 recorded expenditures of $8.0 million. 24
1 In the 2020 General Rate Case (GRC), the Electric Distribution Support Activities
chapter also included a forecast for MWC GE (Electric Distribution Mapping). For the 2023 GRC, the MWC GE forecast can be found in Exhibit (PG&E-4), Ch. 20, Electric Distribution Data Management and Technology. This movement aligns with Electric Operations’ (EO) organizational structure.
2 Exhibit (PG&E-4), WP 22-1, line 5. 3 Exhibit (PG&E-4), WP 22-15, line 3.

(PG&E-4)
22-2
Forecasts in this chapter are shown with escalation at the MWC level 1
and escalation is included in all expense and capital totals. For more 2
information on escalation, please refer to Chapter 2 of this exhibit. 3
3. Overview of Recorded and Forecast Costs 4
PG&E uses the MWCs shown in Table 22-1 to record Distribution 5
Support Activities expenditures for capital and expense. Work in this 6
chapter is not further subdivided into Maintenance Activity Type (MAT) 7
codes. 8
TABLE 22-1 DISTRIBUTION SUPPORT ACTIVITIES MWC
Line No. MWCs Description
1 Expense MWCs
2 AB Miscellaneous Expense
3 IS Streetlight Support
4 OM Operational Management
5 OS Operational Support
6 Capital MWCs
7 05 Tools and Equipment
8 21 Miscellaneous Capital
a. Expense 9
Figure 22-1 shows the changes between PG&E’s 2020 recorded 10
costs and its 2023 expense forecast. The main increases from 2020 11
recorded amounts are in MWCs AB and OS. These increases are 12
mainly driven by headcount to support the Regulatory Compliance & 13
Quality Assurance (QA) group in MWC AB, and increased headcount in 14
MWCs OM and OS to support a larger portfolio of Electric Distribution 15
work. 16
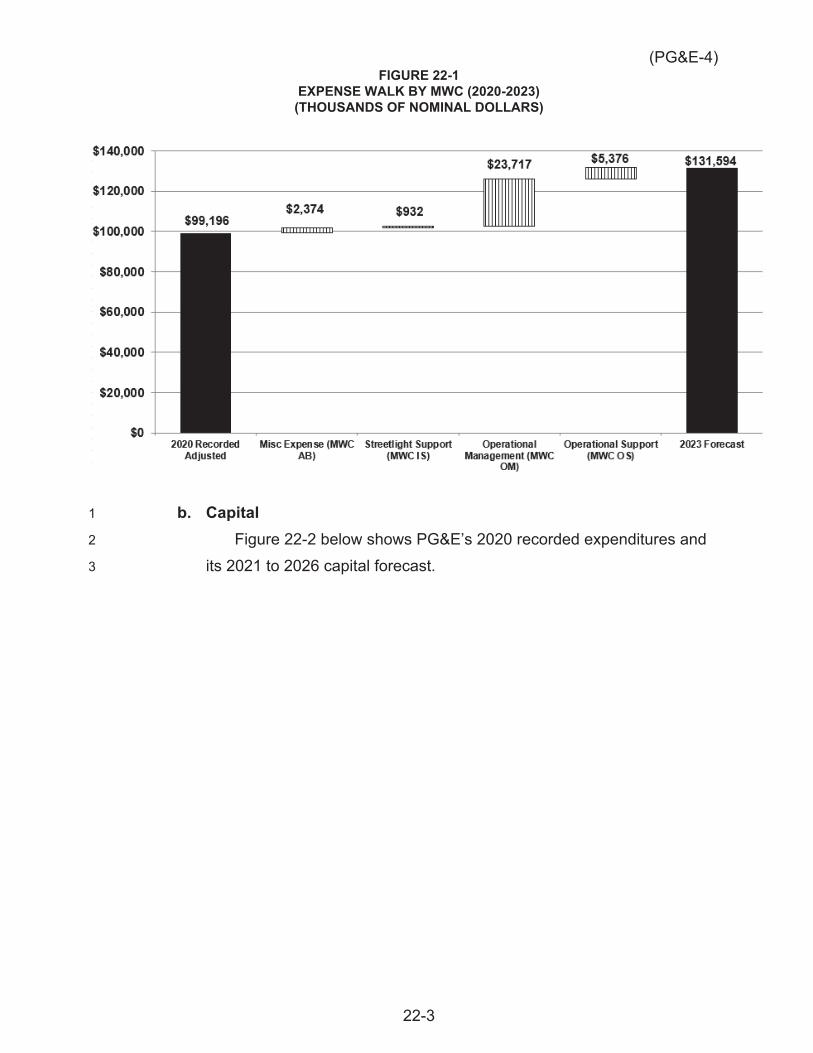
(PG&E-4)
22-3
FIGURE 22-1 EXPENSE WALK BY MWC (2020-2023) (THOUSANDS OF NOMINAL DOLLARS)
b. Capital 1
Figure 22-2 below shows PG&E’s 2020 recorded expenditures and 2
its 2021 to 2026 capital forecast. 3
(PG&E-4)
22-4
FIGURE 22-2 CAPITAL RECORDED AND FORECAST BY MWC 2020-2026(a)
(THOUSANDS OF NOMINAL DOLLARS)
_______________
(a) The 2021 forecast of $(18.3) million is comprised of a positive forecast of $5.2 million in MWC 05 and a negative amount of $23.5 million in MWC 21.
The increase in MWC 05 between 2020 and 2023 is mainly driven 1
by Capital Tools for Substation, Major Projects & Programs, and 2
Distribution Line Technicians. The expenditures in MWC 21 are directly 3
related to costs of upgrades to PG&E’s Applied Technology Services 4
(ATS) Lab. The negative number shown in 2021 represents cross-MWC 5
affordability savings discussed in Section C.2.b.2 of this chapter. 6
4. Support for Request 7
PG&E’s Electric Distribution Support forecast includes the following 8
activities that are necessary for the overall operation, development, and 9
maintenance of the electric distribution system: 10
Costs to support the execution of the electric distribution work plans and 11
provide important public safety services such as the public safety 12
outreach program; and 13
Operational support and management costs to provide necessary 14
structure and coordination for the execution of all electric distribution 15
activities from outage restoration efforts to long term infrastructure 16
improvements. 17
(PG&E-4)
22-5
5. Organization of the Remainder of This Chapter 1
The remainder of this chapter is organized as follows: 2
Section B – Program and Risk Overview; 3
Section C – Activities, Costs, and Forecast Drivers by MWC; 4
Section D – Estimating Method; 5
Section E – Compliance with Section 5.2 of the 2020 GRC Settlement 6
Agreement (“Deferred Work Principles”); and 7
Section F – Cost Tables. 8
B. Program and Risk Overview 9
1. Program Description 10
a. Program Overview 11
Distribution Support Activities enable the safe and efficient 12
execution of distribution work across EO programs. MWCs AB and 21 13
cover expense and capital expenditure forecasts, respectively, for 14
programs not easily captured by other MWCs. This includes activities 15
such as service contracts with third parties, asset data and risk model 16
improvements, PG&E’s internal energy use, costs related to PG&E’s 17
ATS workstream, and regulatory and QA efforts. MWC IS covers 18
expenses related to streetlight audit activity. MWC OM reflects the 19
costs of direct supervision of field execution resources. MWC OS 20
reflects the costs of organizations that support the enablement and 21
execution of field work (e.g., work planning, clerical, scheduling). MWC 22
05 covers the purchase of tools to provide employees the equipment 23
needed to effectively complete electric distribution work. 24
b. Management Structure 25
Many of the miscellaneous support activities discussed in this 26
chapter are woven throughout the EO organization. For example, 27
MWCs AB and 21 do not have a separate management structure 28
associated with them but are instead monitored and controlled by the 29
Electric Business Operations Department. Similarly, forecasts for 30
MWCs OM and OS represent support and management staffing for 31
various departments throughout EO. 32
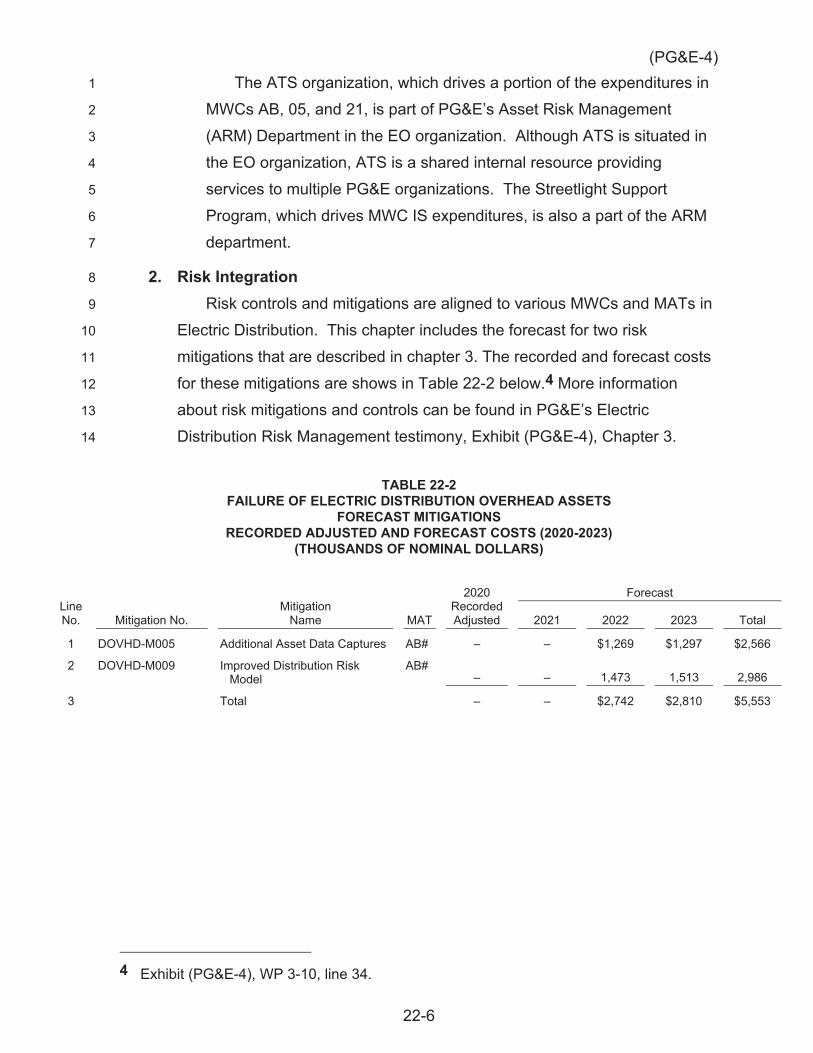
(PG&E-4)
22-6
The ATS organization, which drives a portion of the expenditures in 1
MWCs AB, 05, and 21, is part of PG&E’s Asset Risk Management 2
(ARM) Department in the EO organization. Although ATS is situated in3
the EO organization, ATS is a shared internal resource providing 4
services to multiple PG&E organizations. The Streetlight Support 5
Program, which drives MWC IS expenditures, is also a part of the ARM 6
department.7
2. Risk Integration8
Risk controls and mitigations are aligned to various MWCs and MATs in 9
Electric Distribution. This chapter includes the forecast for two risk 10
mitigations that are described in chapter 3. The recorded and forecast costs 11
for these mitigations are shows in Table 22-2 below.4 More information 12
about risk mitigations and controls can be found in PG&E’s Electric 13
Distribution Risk Management testimony, Exhibit (PG&E-4), Chapter 3.14
TABLE 22-2FAILURE OF ELECTRIC DISTRIBUTION OVERHEAD ASSETS
FORECAST MITIGATIONSRECORDED ADJUSTED AND FORECAST COSTS (2020-2023)
(THOUSANDS OF NOMINAL DOLLARS)
Line No. Mitigation No.
MitigationName MAT
2020 Recorded Adjusted
Forecast
2021 2022 2023 Total
1 DOVHD-M005 Additional Asset Data Captures AB# – – $1,269 $1,297 $2,566
2 DOVHD-M009 Improved Distribution Risk Model
AB#– – 1,473 1,513 2,986
3 Total – – $2,742 $2,810 $5,553
4 Exhibit (PG&E-4), WP 3-10, line 34.
(PG&E-4)
22-7
C. Activities, Costs, and Forecast Drivers by MWC 1
1. Expense MWCs 2
a. Miscellaneous Expense (MWC AB) 3
PG&E’s 2023 forecast for Miscellaneous Expenses in MWC AB is 4
$49.5 million.5 The components of this forecast are described below.6 5
1) Distribution Support 6
Distribution Support encompasses general support of the 7
electric distribution system and several smaller programs such as 8
Electric Asset Excellence, as well as miscellaneous expenses such 9
as consulting, industry association dues, and easement costs. 10
PG&E’s forecast is $19.3 million for 2023, which is $7.8 million 11
lower than 2020 recorded expenditures of $27.1 million.7 The 12
primary driver for this variance is due to a reduction in 13
contract/consulting costs. 14
2) Applied Technology Services 15
ATS provides miscellaneous support to departments within 16
Electric Distribution Operations to ensure compliance with 17
5 See Exhibit (PG&E-4) WP 22-11, line 10. 6 In the 2020 GRC, PG&E forecast two activities in MWC AB in the Electric Distribution
Support Activities chapter that are no longer included in this chapter for the 2023 GRC period. The first activity was the CWSP PMO; the recorded costs and 2023 GRC forecast for the CWSP PMO are now discussed along with other wildfire risk mitigations in Exhibit (PG&E-4), Ch. 4. The second activity was for Paid Time Off (PTO), Indirect Labor, and Material Burden Overheads (OH) that PG&E no longer allocates to balancing account or Catastrophic Event Memorandum Account orders due to a change in PG&E’s cost model. In the 2020 GRC, PG&E forecast these costs in MWC AB because there was no historical precedent for how much the methodology change would impact specific expense MWCs, but noted that in future GRCs it would allocate the expense portion of these OH costs to the specific expense MWCs in the Electric Distribution exhibit where they are ultimately incurred. A.18-12-009, HE-17: Exhibit (PG&E-4), p. 18-18, lines 9-29. As a result, there will be no 2020-2022 recorded costs for these OHs in MWC AB, and there is no 2023 forecast for these OHs in MWC AB in the 2023 GRC.
7 See Exhibit (PG&E-4) WP 22-11, line 1.
(PG&E-4)
22-8
regulations and the safe and reliable operations of our assets.8 1
Examples of these services include: 2
Dielectric Truck Testing; 3
Instrument Calibration and Repair; 4
Failure Analysis and Incident Investigation; and 5
Electric Magnetic Fields (EMF) Program9 6
PG&E’s 2023 forecast for ATS Electric Distribution Support 7
activities is $3.4 million, which is $1.0 million lower than 2020 8
recorded expenses of $4.4 million.10 9
3) Additional Asset Data Capture (DOVHD-M005) 10
This risk mitigation addresses the Failure of Electric Distribution 11
OH Assets risk.11 This program is discussed in greater detail in 12
Exhibit (PG&E-4), Chapter 3. 13
PG&E’s 2023 forecast for Additional Asset Data Capture is 14
$1.3 million. This is a new program, so PG&E had no recorded 15
expenses in 2020.12 16
4) Improved Distribution Risk Model (DOVHD-M009) 17
This risk mitigation addresses the Failure of Electric Distribution 18
OH Assets risk. This program is discussed in greater detail in 19
Exhibit (PG&E-4), Chapter 3. 20
8 ATS also provides support services to other PG&E lines of business (e.g., Gas, Hydro
Generation, Customer Care, and Transmission). The forecast discussed in this chapter is for the portion of ATS Support Expenses performed for Electric Distribution.
9 The EMF program was discussed as a separate line item in the 2020 GRC but has been consolidated with other ATS support activities here because of the relatively small size of the forecast. For a further discussion of the EMF program, see A.18-12-009, HE-17: Exhibit (PG&E-4), p. 18-15, line 23 to p. 18-16, line 9.
10 See (PG&E-4) WP 22-11, line 2. 11 See PG&E’s 2020 RAMP Report, A.20-06-012 (June 30, 2020), p. 11-24, lines 3-16. 12 See Exhibit (PG&E-4) WP 22-11, line 3, and WP 3-10, line 27 (DOVHD mitigations,
expense).
(PG&E-4)
22-9
PG&E’s 2023 forecast for the Improved Distribution Risk Model 1
is $1.5 million.13 PG&E did not track costs separately for this work 2
in 2020 but will do so going forward. 3
5) Federal Land Authorization 4
In 2019, PG&E executed a 30-year Master Special Use Permit 5
and Master Operations and Maintenance Plan (MSUP) with the 6
Pacific West Region of the United States Forest Services (USFS), 7
Region 5. The MSUP renewed approximately 140 expired land 8
authorizations and consolidated the remaining land authorizations 9
into two permits/easement. The MSUP also formalizes how PG&E 10
should interact with the USFS on routine operations and 11
maintenance activities. As a condition of the MSUP, PG&E is 12
obligated to perform some road improvements and cultural and 13
biological compliance activities. PG&E’s 2023 expense forecast for 14
these activities stemming from the MSUP is $3.5 million14, which is 15
$1.3 million lower than 2020 recorded expenses of $4.8 million.15 16
6) Interdepartmental Energy Usage 17
Interdepartmental energy usage is the cost associated with 18
natural gas or electricity that is used at PG&E electric distribution 19
facilities (essentially metered natural gas or electricity that is used 20
by and billed to the business). 21
The forecast is $2.9 million for 2023, which is $0.2 million higher 22
than 2020 recorded expenses of $2.7 million16. 23
7) Regulatory Compliance and QA Group 24
MWC AB includes a forecast for the Electric Distribution line of 25
business’ share of costs related to headcount for the Regulatory 26
13 See Exhibit (PG&E-4) WP 22-11, line 4, and WP 3-10, line 28 (DOVHD mitigations,
expense). 14 See Exhibit (PG&E-4) WP 22-11, line 5. 15 PG&E anticipates that there may also be some capital expenditures associated with
work stemming from the MSUP. PG&E has not included a capital forecast for this work in the 2023 GRC. If the work becomes necessary, PG&E will reprioritize other work to accomplish it.
16 See Exhibit (PG&E-4) WP 22-11, line 6.
(PG&E-4)
22-10
Compliance and QA Group.17 This group was created in 2019 and 1
combines and significantly expands several functions related to EO 2
regulatory compliance and QA. These functions include: 3
Electric Incident Investigation Team: This team performs 4
investigations of CPUC-reportable electric incidents and 5
wildfire ignitions related to PG&E facilities, submits 20-day 6
reports, and provides follow-up data to the Commission. 7
Corrective Action Program (CAP): The CAP Team 8
receives, ranks, organizes, and tracks corrective actions 9
from receipt through closure. The CAP Team also performs 10
cause evaluations for electric issues, serious injuries and 11
fatalities, and other safety matters. Its scope has recently 12
been expanded to include evaluations of other activities that 13
PG&E considers non-complaint or potentially non-compliant. 14
Electric Data Response Unit (EDRU): The EDRU, which 15
was separately forecast in the 2020 GRC, coordinates 16
responses to data requests to the EO business unit. 17
Compliance Group: This group supports CPUC and Wildfire 18
Safety Division regulatory audits, provides compliance 19
guidance, and responds to Notices of Violation from 20
regulators. 21
Quality Team: This team performs quality management 22
services including quality verification, QA, and other audits. 23
PG&E’s 2023 forecast for the Electric Distribution portion of the 24
costs for the Regulatory Compliance and QA group is $17.1 million, 25
which is $9.4 million higher than 2020 recorded expenses of 26
$7.7 million.18 The reason for the increase is additional headcount 27
17 The Regulatory Compliance and QA Group performs work for both the Electric
Distribution and Electric Transmission lines of business. Costs are allocated based on how resources support the various workstreams across Electric Operations. In addition, PG&E considers some costs from this group to be wholly related to Wildfire risk mitigation and, beginning in Q2 2021, the Regulatory Compliance and QA Group will be directly charging to FRMMA/WMPMA orders for activities that qualify as incremental and directly related to wildfire mitigation.
18 See Exhibit (PG&E-4) WP 22-11, line 7.
(PG&E-4)
22-11
to address the increase in data requests from regulators, intervenors 1
and observers, increased self-reports of non-conformance or 2
potential non-conformance, a maturing incident investigation 3
process, a significantly strengthened quality management program, 4
enhancements to the compliance management program, and 5
increased compliance governance. 6
8) Public Awareness Outreach 7
PG&E’s 2020 RAMP Report19 included an estimate of costs 8
associated with public outreach and messaging to control and 9
mitigate the Failure of Electric Distribution OH Assets risk. This 10
includes funding for the additional bill insert details and public safety 11
messages described in PG&E’s 2020 RAMP report. The forecast 12
for public outreach, including the additional outreach for the Failure 13
of Electric Distribution OH Assets risk, is $0.6 million for 2023, which 14
is $0.2 million higher than 2020 recorded expenditures of 15
$0.4 million.20 16
9) Affordability 17
In 2021 and 2022, PG&E is forecasting cross-MWC affordability 18
initiative savings related to expense programs in MWC AB. PG&E 19
is forecasting $44.2 million of such savings in 2021 and 20
$38.9 million in 2022.21 These cost savings amounts are in 21
addition to the savings embedded in the expense forecasts in other 22
chapters in this exhibit, and will be realized in MWCs other than 23
AB.22 24
19 PG&E’s 2020 RAMP Report, A.20-06-012 (June 30, 2020). 20 See Exhibit (PG&E-4) WP 22-11, line 8. 21 See Exhibit (PG&E-4) WP 22-11, line 9. 22 As explained in Exhibit (PG&E-2) Ch. 3, PG&E prepared its 2023 GRC forecast, starting
first with the Plan of Reorganization forecast for the work included in the 2023 GRC and then adding updates to address company-wide work needs and priorities, risk mitigations, and cost-savings initiatives. Through the process of prioritizing the Electric Distribution portfolio and in accordance with the 2023 GRC forecast guidelines outlined in Exhibit (PG&E-2) Ch. 3, this forecast prioritizes funding for the most critical work and incorporates a cost-savings initiative which is identified as a reduction to the forecast. EO’s work portfolio planning and prioritization process is discussed further in Exhibit (PG&E-4) Ch. 2.
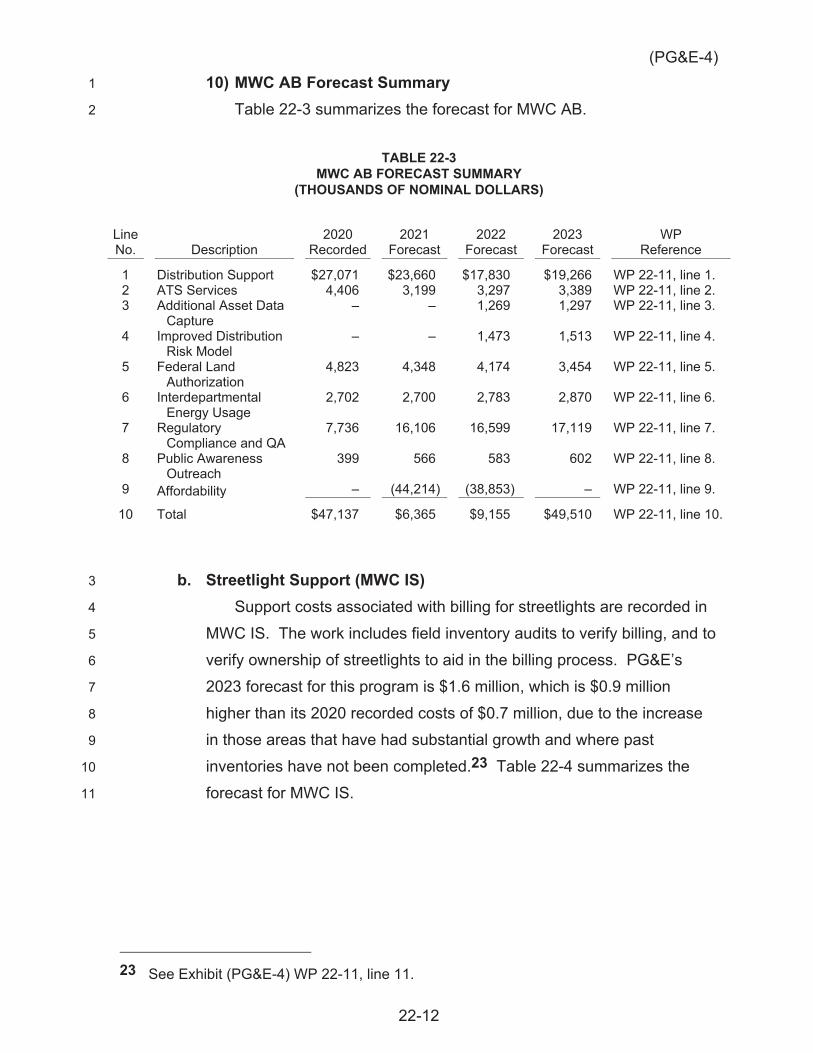
(PG&E-4)
22-12
10) MWC AB Forecast Summary 1
Table 22-3 summarizes the forecast for MWC AB. 2
TABLE 22-3 MWC AB FORECAST SUMMARY
(THOUSANDS OF NOMINAL DOLLARS)
Line No. Description
2020 Recorded
2021 Forecast
2022 Forecast
2023 Forecast
WP Reference
1 Distribution Support $27,071 $23,660 $17,830 $19,266 WP 22-11, line 1. 2 ATS Services 4,406 3,199 3,297 3,389 WP 22-11, line 2. 3 Additional Asset Data
Capture – – 1,269 1,297 WP 22-11, line 3.
4 Improved Distribution Risk Model
– – 1,473 1,513 WP 22-11, line 4.
5 Federal Land Authorization
4,823 4,348 4,174 3,454 WP 22-11, line 5.
6 Interdepartmental Energy Usage
2,702 2,700 2,783 2,870 WP 22-11, line 6.
7 Regulatory Compliance and QA
7,736 16,106 16,599 17,119 WP 22-11, line 7.
8 Public Awareness Outreach
399 566 583 602 WP 22-11, line 8.
9 Affordability – (44,214) (38,853) – WP 22-11, line 9.
10 Total $47,137 $6,365 $9,155 $49,510 WP 22-11, line 10.
b. Streetlight Support (MWC IS) 3
Support costs associated with billing for streetlights are recorded in 4
MWC IS. The work includes field inventory audits to verify billing, and to 5
verify ownership of streetlights to aid in the billing process. PG&E’s 6
2023 forecast for this program is $1.6 million, which is $0.9 million 7
higher than its 2020 recorded costs of $0.7 million, due to the increase 8
in those areas that have had substantial growth and where past 9
inventories have not been completed.23 Table 22-4 summarizes the 10
forecast for MWC IS. 11
23 See Exhibit (PG&E-4) WP 22-11, line 11.
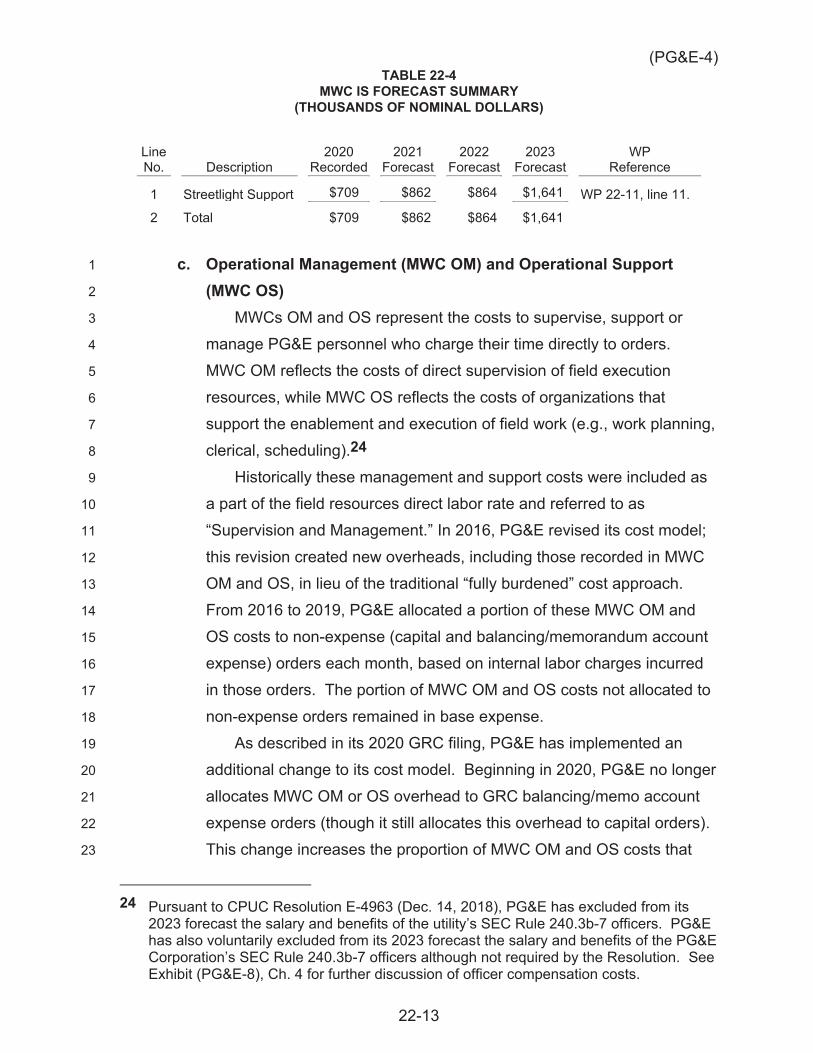
(PG&E-4)
22-13
TABLE 22-4 MWC IS FORECAST SUMMARY
(THOUSANDS OF NOMINAL DOLLARS)
Line No. Description
2020 Recorded
2021 Forecast
2022 Forecast
2023 Forecast
WP Reference
1 Streetlight Support $709 $862 $864 $1,641 WP 22-11, line 11.
2 Total $709 $862 $864 $1,641
c. Operational Management (MWC OM) and Operational Support 1
(MWC OS) 2
MWCs OM and OS represent the costs to supervise, support or 3
manage PG&E personnel who charge their time directly to orders. 4
MWC OM reflects the costs of direct supervision of field execution 5
resources, while MWC OS reflects the costs of organizations that 6
support the enablement and execution of field work (e.g., work planning, 7
clerical, scheduling).24 8
Historically these management and support costs were included as 9
a part of the field resources direct labor rate and referred to as 10
“Supervision and Management.” In 2016, PG&E revised its cost model; 11
this revision created new overheads, including those recorded in MWC 12
OM and OS, in lieu of the traditional “fully burdened” cost approach. 13
From 2016 to 2019, PG&E allocated a portion of these MWC OM and 14
OS costs to non-expense (capital and balancing/memorandum account 15
expense) orders each month, based on internal labor charges incurred 16
in those orders. The portion of MWC OM and OS costs not allocated to 17
non-expense orders remained in base expense. 18
As described in its 2020 GRC filing, PG&E has implemented an 19
additional change to its cost model. Beginning in 2020, PG&E no longer 20
allocates MWC OM or OS overhead to GRC balancing/memo account 21
expense orders (though it still allocates this overhead to capital orders). 22
This change increases the proportion of MWC OM and OS costs that 23
24 Pursuant to CPUC Resolution E-4963 (Dec. 14, 2018), PG&E has excluded from its
2023 forecast the salary and benefits of the utility’s SEC Rule 240.3b-7 officers. PG&E has also voluntarily excluded from its 2023 forecast the salary and benefits of the PG&E Corporation’s SEC Rule 240.3b-7 officers although not required by the Resolution. See Exhibit (PG&E-8), Ch. 4 for further discussion of officer compensation costs.
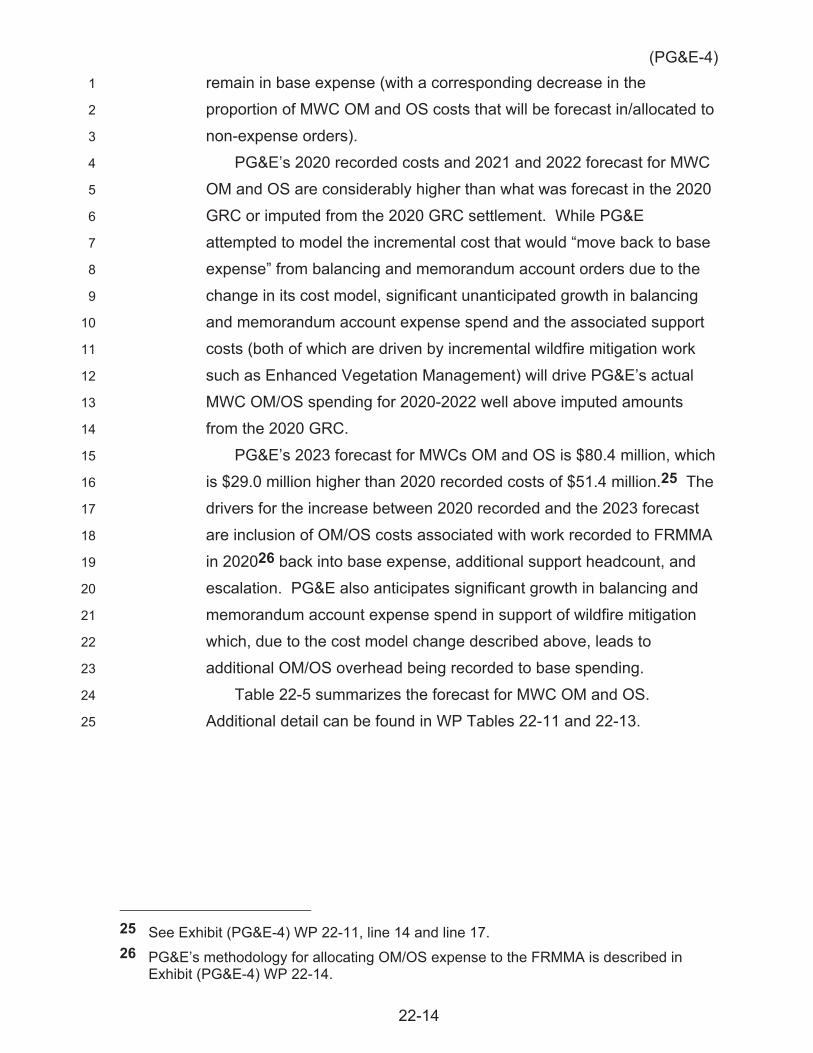
(PG&E-4)
22-14
remain in base expense (with a corresponding decrease in the 1
proportion of MWC OM and OS costs that will be forecast in/allocated to 2
non-expense orders). 3
PG&E’s 2020 recorded costs and 2021 and 2022 forecast for MWC 4
OM and OS are considerably higher than what was forecast in the 2020 5
GRC or imputed from the 2020 GRC settlement. While PG&E 6
attempted to model the incremental cost that would “move back to base 7
expense” from balancing and memorandum account orders due to the 8
change in its cost model, significant unanticipated growth in balancing 9
and memorandum account expense spend and the associated support 10
costs (both of which are driven by incremental wildfire mitigation work 11
such as Enhanced Vegetation Management) will drive PG&E’s actual 12
MWC OM/OS spending for 2020-2022 well above imputed amounts 13
from the 2020 GRC. 14
PG&E’s 2023 forecast for MWCs OM and OS is $80.4 million, which 15
is $29.0 million higher than 2020 recorded costs of $51.4 million.25 The 16
drivers for the increase between 2020 recorded and the 2023 forecast 17
are inclusion of OM/OS costs associated with work recorded to FRMMA 18
in 202026 back into base expense, additional support headcount, and 19
escalation. PG&E also anticipates significant growth in balancing and 20
memorandum account expense spend in support of wildfire mitigation 21
which, due to the cost model change described above, leads to 22
additional OM/OS overhead being recorded to base spending. 23
Table 22-5 summarizes the forecast for MWC OM and OS. 24
Additional detail can be found in WP Tables 22-11 and 22-13. 25
25 See Exhibit (PG&E-4) WP 22-11, line 14 and line 17. 26 PG&E’s methodology for allocating OM/OS expense to the FRMMA is described in
Exhibit (PG&E-4) WP 22-14.
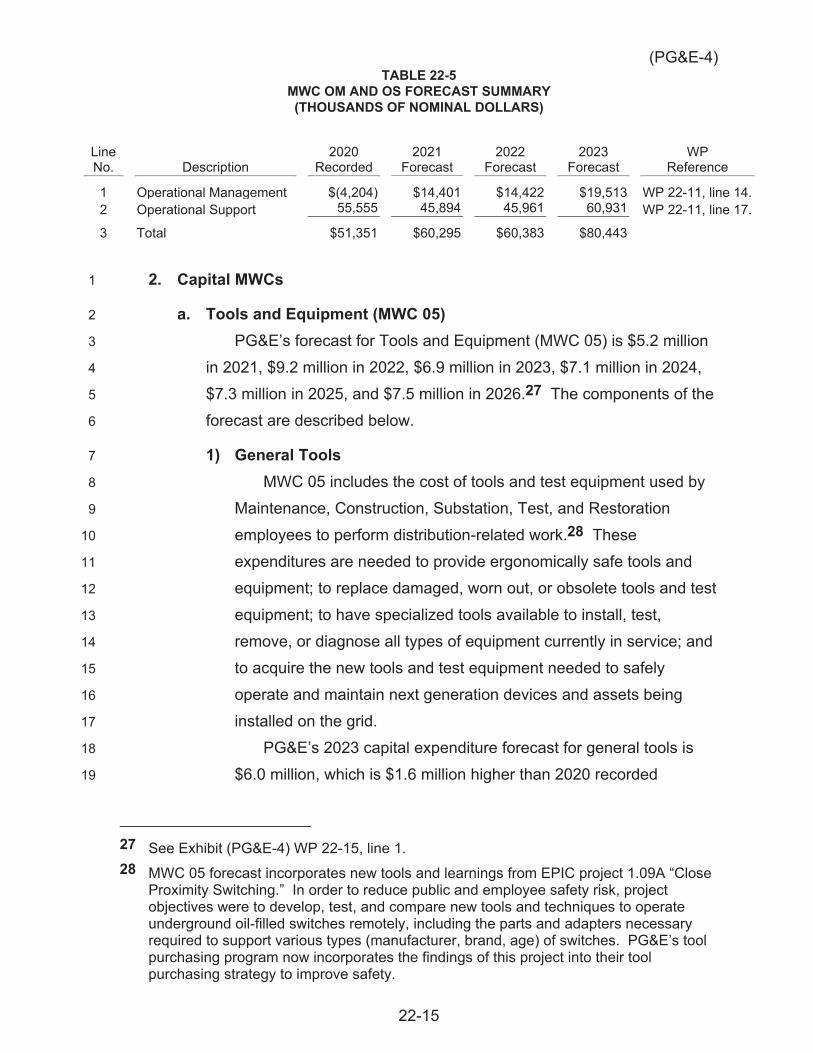
(PG&E-4)
22-15
TABLE 22-5 MWC OM AND OS FORECAST SUMMARY (THOUSANDS OF NOMINAL DOLLARS)
Line No. Description
2020 Recorded
2021 Forecast
2022 Forecast
2023 Forecast
WP Reference
1 Operational Management $(4,204) $14,401 $14,422 $19,513 WP 22-11, line 14. 2 Operational Support 55,555 45,894 45,961 60,931 WP 22-11, line 17.
3 Total $51,351 $60,295 $60,383 $80,443
2. Capital MWCs 1
a. Tools and Equipment (MWC 05) 2
PG&E’s forecast for Tools and Equipment (MWC 05) is $5.2 million 3
in 2021, $9.2 million in 2022, $6.9 million in 2023, $7.1 million in 2024, 4
$7.3 million in 2025, and $7.5 million in 2026.27 The components of the 5
forecast are described below. 6
1) General Tools 7
MWC 05 includes the cost of tools and test equipment used by 8
Maintenance, Construction, Substation, Test, and Restoration 9
employees to perform distribution-related work.28 These 10
expenditures are needed to provide ergonomically safe tools and 11
equipment; to replace damaged, worn out, or obsolete tools and test 12
equipment; to have specialized tools available to install, test, 13
remove, or diagnose all types of equipment currently in service; and 14
to acquire the new tools and test equipment needed to safely 15
operate and maintain next generation devices and assets being 16
installed on the grid. 17
PG&E’s 2023 capital expenditure forecast for general tools is 18
$6.0 million, which is $1.6 million higher than 2020 recorded 19
27 See Exhibit (PG&E-4) WP 22-15, line 1. 28 MWC 05 forecast incorporates new tools and learnings from EPIC project 1.09A “Close
Proximity Switching.” In order to reduce public and employee safety risk, project objectives were to develop, test, and compare new tools and techniques to operate underground oil-filled switches remotely, including the parts and adapters necessary required to support various types (manufacturer, brand, age) of switches. PG&E’s tool purchasing program now incorporates the findings of this project into their tool purchasing strategy to improve safety.
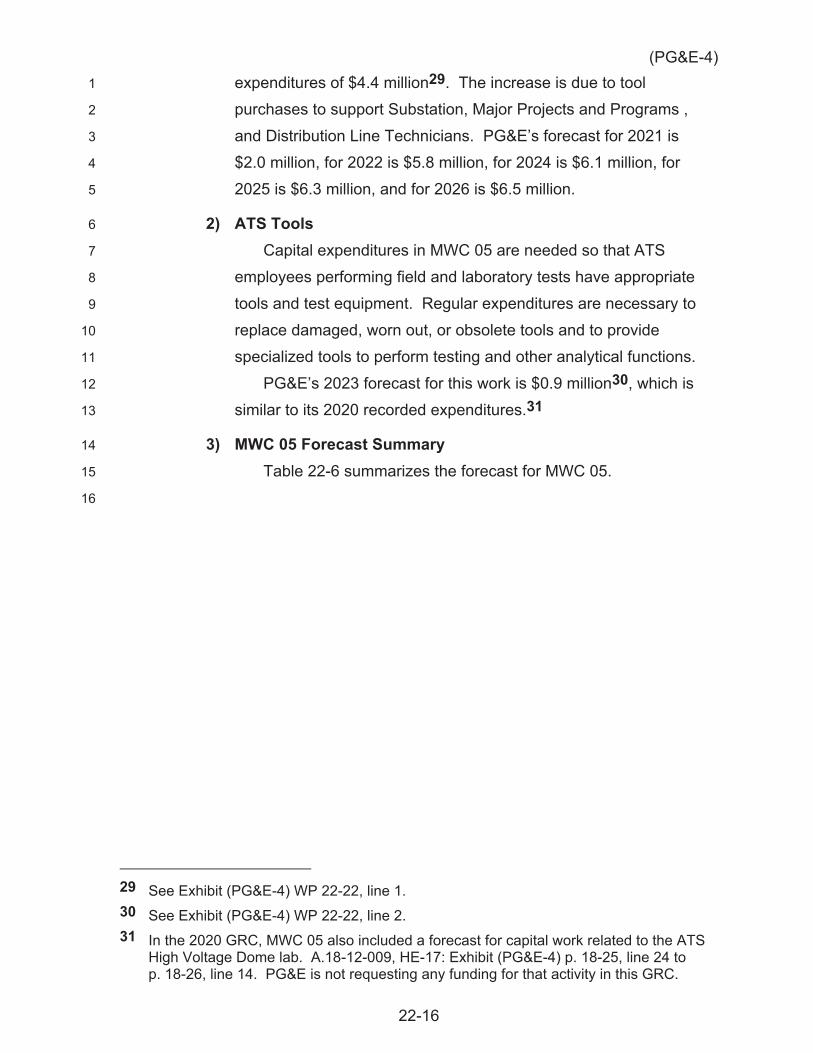
(PG&E-4)
22-16
expenditures of $4.4 million29. The increase is due to tool 1
purchases to support Substation, Major Projects and Programs , 2
and Distribution Line Technicians. PG&E’s forecast for 2021 is 3
$2.0 million, for 2022 is $5.8 million, for 2024 is $6.1 million, for 4
2025 is $6.3 million, and for 2026 is $6.5 million. 5
2) ATS Tools 6
Capital expenditures in MWC 05 are needed so that ATS 7
employees performing field and laboratory tests have appropriate 8
tools and test equipment. Regular expenditures are necessary to 9
replace damaged, worn out, or obsolete tools and to provide 10
specialized tools to perform testing and other analytical functions. 11
PG&E’s 2023 forecast for this work is $0.9 million30, which is 12
similar to its 2020 recorded expenditures.31 13
3) MWC 05 Forecast Summary 14
Table 22-6 summarizes the forecast for MWC 05. 15
16
29 See Exhibit (PG&E-4) WP 22-22, line 1. 30 See Exhibit (PG&E-4) WP 22-22, line 2. 31 In the 2020 GRC, MWC 05 also included a forecast for capital work related to the ATS
High Voltage Dome lab. A.18-12-009, HE-17: Exhibit (PG&E-4) p. 18-25, line 24 to p. 18-26, line 14. PG&E is not requesting any funding for that activity in this GRC.
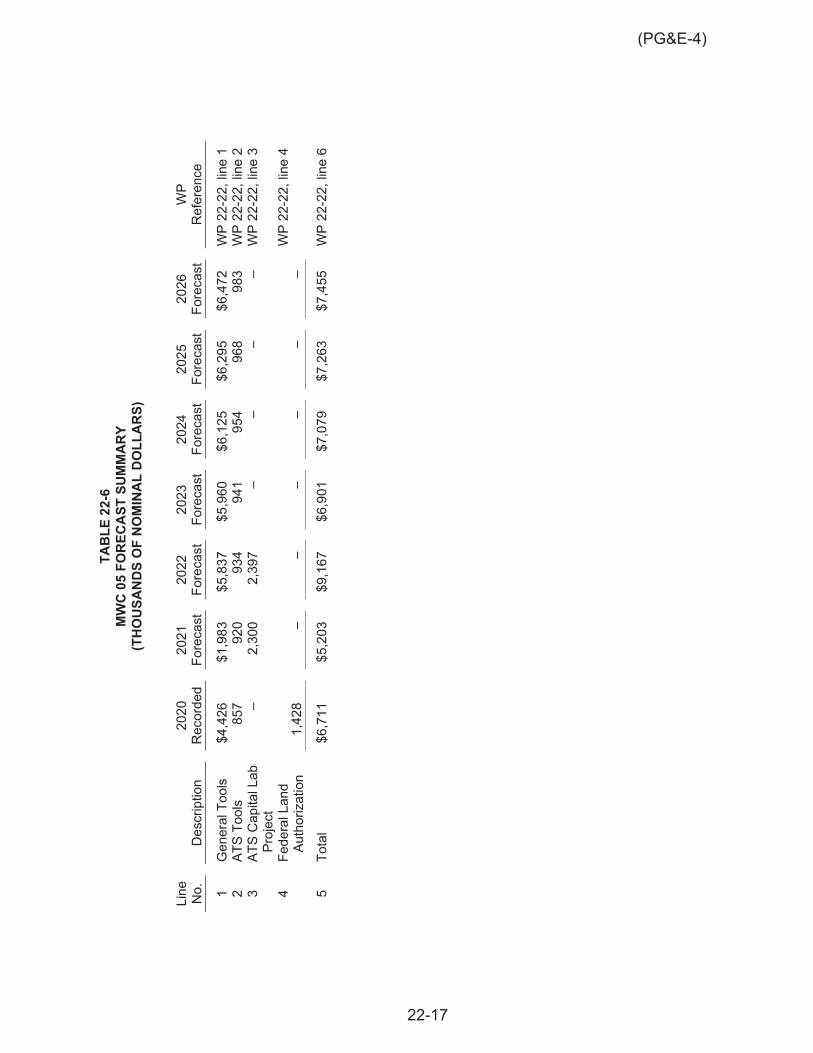
(PG&E-4)
22-17
TAB
LE 2
2-6
MW
C 0
5 FO
REC
AST
SUM
MA
RY
(T
HO
USA
ND
S O
F N
OM
INA
L D
OLL
AR
S)
Line
N
o.
Des
crip
tion
2020
R
ecor
ded
2021
Fo
reca
st
2022
Fo
reca
st
2023
Fo
reca
st
2024
Fo
reca
st
2025
Fo
reca
st
2026
Fo
reca
st
WP
Ref
eren
ce
1 G
ener
al T
ools
$4
,426
$1
,983
$5
,837
$5
,960
$6
,125
$6
,295
$6
,472
W
P 22
-22,
line
1
2 AT
S To
ols
857
920
934
941
954
968
983
WP
22-2
2, li
ne 2
3
ATS
Cap
ital L
ab
Proj
ect
– 2,
300
2,39
7 –
– –
– W
P 22
-22,
line
3
4 Fe
dera
l Lan
d Au
thor
izat
ion
1,42
8 –
– –
– –
– W
P 22
-22,
line
4
5 To
tal
$6,7
11
$5,2
03
$9,1
67
$6,9
01
$7,0
79
$7,2
63
$7,4
55
WP
22-2
2, li
ne 6
(PG&E-4)
22-18
b. Miscellaneous Capital (MWC 21) 1
PG&E’s forecast for Miscellaneous Capital (MWC 21) is 2
$(23.5) million in 2021, $1.5 million in 2022, $1.5 million in 2023, 3
$1.5 million in 2024, $1.5 million in 2025, and $1.5 million in 2026.32 4
The components of the forecast are described below.33 5
1) ATS Lab Safety and Reliability Upgrades 6
In order to stay up-to-date on evolving technologies and testing 7
techniques, PG&E needs to make ongoing facility and operating 8
equipment upgrades at the ATS testing laboratories located at the 9
San Ramon Technology Center. ATS has 10 technical work units 10
providing a variety of testing services. Testing takes place in more 11
than a dozen distinct laboratories that require safety and reliability 12
upgrades. Lab upgrades in the 2023-2026 timeframe will be 13
prioritized based on the most pressing needs of the company which 14
are expected to include increased failure analysis testing, new 15
technology testing related to Wildfire risk mitigation, and asset 16
evaluations. 17
2) Affordability 18
As discussed above, similar to expense, PG&E is forecasting 19
cross-MWC, capital program-related affordability initiative savings in 20
MWC 21. PG&E is forecasting $25.0 million of such savings in 21
2021.34 22
3) MWC 21 Forecast Summary 23
Table 22-7 summarizes the forecast for MWC 21. 24
32 See Exhibit (PG&E-4) WP 22-15, line 2. 33 In the 2020 GRC, PG&E forecast some costs associated with PTO, Indirect Labor and
Material Burden OH in MWC 21 in the Electric Distribution Support Activities chapter. As with the expense portion of these costs described in footnote 7, above, these OH costs are no longer included in this chapter for the 2023 GRC period because they will be allocated to the specific expense MWCs in the Electric Distribution exhibit where they are ultimately incurred. A.18-12-009, HE-17: Exhibit (PG&E-4), p. 18-27, line 13 to page 18-28, line 13.
34 See Exhibit (PG&E-4) WP 22-22, line 9.

22-19
(PG&E-4)
TAB
LE 2
2-7
MW
C 2
1 FO
REC
AST
SU
MM
AR
Y
(TH
OU
SAN
DS
OF
NO
MIN
AL
DO
LLA
RS)
Line
N
o.
Des
crip
tion
2020
R
ecor
ded
2021
Fo
reca
st
2022
Fo
reca
st
2023
Fo
reca
st
2024
Fo
reca
st
2025
Fo
reca
st
2026
Fo
reca
st
WP
Ref
eren
ce
1 AT
S La
b Sa
fety
and
Rel
iabi
lity
Upg
rade
s $1
,195
$1
,458
$1
,496
$1
,493
$1
,496
$1
,499
$1
,502
W
P 22
-22,
line
7.
2 Ex
tern
al C
ontra
ct E
stim
atin
g H
oldi
ng
81
– –
– –
– –
WP
22-2
2, li
ne 8
.
3 Af
ford
abilit
y –
(25,
000)
–
– –
– –
WP
22-2
2, li
ne 9
.
4 To
tal
$1,2
76
$(23
,542
) $1
,496
$1
,493
$1
,496
$1
,499
$1
,502
W
P 22
-22,
line
10.
(PG&E-4)
22-20
D. Estimating Method 1
The workpapers accompanying this chapter provide specific details on cost 2
estimation for each of the categories of work included. 3
E. Compliance with Section 5.2 of the 2020 GRC Settlement Agreement 4
(“Deferred Work Principles”) 5
The 2020 GRC Settlement Agreement requires PG&E to include testimony 6
in this GRC on deferred work if the following criteria are met: 7
(a) The work was requested and authorized based on representations that it 8
was needed to provide safe and reliable service (Check 1); 9
(b) PG&E did not perform all of the authorized and funded work, as measured 10
by authorized (explicit or imputed) units of work (Check 2); and 11
(c) PG&E continues to represent that the curtailed work is necessary to provide 12
safe and reliable service (Check 3). 13
Some of the work that was authorized in the 2020 GRC in this chapter is 14
safety-related, however there was no work that met the criteria for deferred work 15
as described in the Settlement Agreement. This analysis is presented in the 16
workpapers supporting Chapter 2 of this Exhibit.35 17
F. Cost Tables 18
The expense and capital forecasts for Electric Distribution Support Activities 19
are summarized in the following tables: 20
Table 22-8 lists the expense MWCs, showing 2016 through 2020 recorded 21
expenses and 2021 through 2023 forecast expenses; and 22
Table 22-9 lists the capital MWCs, showing 2016 through 2020 recorded 23
expenditures and 2021 through 2026 forecast expenditures. 24
35 See Exhibit (PG&E-4), Table WP 2-13, WP 2-15, line 1 through WP 2-16, line 16.

22-21
(PG&E-4)
TAB
LE 2
2-8
EXPE
NSE
(T
HO
USA
ND
S O
F N
OM
INA
L D
OLL
AR
S)
Line
N
o.
MW
C
Des
crip
tion
Rec
orde
d Ad
just
ed
Fore
cast
W
P R
efer
ence
20
16
2017
20
18
2019
20
20
2021
20
22
2023
1 AB
M
isc.
Exp
ense
$2
0,00
0 $1
3,42
9 $1
9,11
8 $1
6,15
1 $4
7,13
7 $6
,365
$9
,155
$4
9,51
0 W
P 22
-1, l
ine
1
2 IS
St
reet
light
Su
ppor
t –
1,05
6 85
3 16
5 70
9 86
2 86
4 1,
641
WP
22-1
, lin
e 2
3 O
M
Ope
ratio
nal
Man
agem
ent
17,0
68
18,4
08
5,27
4 12
,407
(4
,204
) 14
,401
14
,422
19
,513
W
P 22
-1, l
ine
3
4 O
S O
pera
tiona
l Su
ppor
t 11
,695
(2
12)
20,3
45
7,57
1 55
,555
45
,894
45
,961
60
,931
W
P 22
-1, l
ine
4
5
Tota
l $4
8,76
3 $3
2,68
1 $4
5,59
1 $3
6,29
4 $9
9,19
6 $6
7,52
2 $7
0,40
1 $1
31,5
94
TAB
LE 2
2-9
CA
PITA
L (T
HO
USA
ND
S O
F N
OM
INA
L D
OLL
AR
S)
Line
N
o.
MW
C
Des
crip
tion
Rec
orde
d Ad
just
ed
Fore
cast
2016
20
17
2018
20
19
2020
20
21
2022
20
23
2024
20
25
2026
W
P R
efer
ence
1 05
To
ols
and
Equi
pmen
t $9
,335
$5
,778
$7
,209
$7
,532
$6
,711
$5
,203
$9
,167
$6
,901
$7
,079
$7
,263
$7
,455
W
P 22
-15,
line
1
2 21
M
isc.
Cap
ital
– –
– –
1,27
6 (2
3,54
2)
1,49
6 1,
493
1,49
6 1,
499
1,50
2 W
P 22
-15,
line
2
3
Tota
l $9
,335
$5
,778
$7
,209
$7
,532
$7
,987
$(
18,3
40)
$10,
663
$8,3
94
$8,5
75
$8,7
62
$8,9
56
(PG&E-4)
PACIFIC GAS AND ELECTRIC COMPANY
CHAPTER 23
COMMUNITY REBUILD PROGRAM
[INCLUDES NOVEMBER 5, 2021 ERRATA]
(PG&E-4)
23-i
PACIFIC GAS AND ELECTRIC COMPANY CHAPTER 23
COMMUNITY REBUILD PROGRAM
TABLE OF CONTENTS
A. Introduction ..................................................................................................... 23-1
1. Scope and Purpose ................................................................................. 23-1
2. Summary of Request ............................................................................... 23-2
3. Overview of Recorded and Forecast Costs .............................................. 23-3
a. Expense ............................................................................................. 23-4
b. Capital ............................................................................................... 23-6
4. Support for Request ................................................................................. 23-9
5. Organization of the Remainder of This Chapter ....................................... 23-9
B. Program and Risk Overview ........................................................................... 23-9
1. Program Description ................................................................................ 23-9
a. Program Overview ............................................................................. 23-9
b. Management Structure .................................................................... 23-10
2. Risk Integration ...................................................................................... 23-11
a. RAMP Risk – Wildfire ...................................................................... 23-12
1) Risk Overview ........................................................................... 23-12
2) GRC Risk Mitigations and Controls ........................................... 23-12
3) Changes to Mitigations .............................................................. 23-13
4) Cost Tables ............................................................................... 23-13
C. Activities, Costs, and Forecast Drivers by Workstream ................................ 23-15
1. Expense Workstreams ........................................................................... 23-15
a. W1 – Temporary Services for Pedestal Program (MAT IFF) ........... 23-16
b. W2 – Construction Site Clearing (MAT IFF) .................................... 23-16
c. W3 and W4 – Community Rebuild PMO (MATs IFF and LXA) ........ 23-16
d. Expense Worksteam Summary ....................................................... 23-17
(PG&E-4) PACIFIC GAS AND ELECTRIC COMPANY
CHAPTER 23 COMMUNITY REBUILD PROGRAM
TABLE OF CONTENTS
(CONTINUED)
23-ii
2. Capital Workstreams .............................................................................. 23-17
a. W5 – Electric Underground Main-Line Construction (MAT 95F, WLDFR-M014) ................................................................................ 23-17
b. W6 – Electric Underground Main-Line Construction Hardening Program (MAT 08W) ....................................................................... 23-18
c. W7 – Aldyl-A Gas Underground Construction (MAT 14D) ............... 23-18
d. W8 – Electric Overhead Main-Line Construction (MAT 95F) ........... 23-19
e. W9 – Electric Services (MAT 95F) ................................................... 23-19
f. W10 – Gas Services (MAT 3QA) ..................................................... 23-20
g. W11 – Service Meters (MAT 03M) .................................................. 23-20
h. W12 and W13 – Electric and Gas Mobile Home Parks (MATs 95F and 3QA) ......................................................................................... 23-20
i. W14 – Remote Grids ....................................................................... 23-20
j. Capital Workstream Summary ......................................................... 23-21
D. Estimating Methods ...................................................................................... 23-23
1. Expense ................................................................................................. 23-23
2. Capital .................................................................................................... 23-23
E. Compliance With Prior Commission Decisions ............................................. 23-25
1. Compliance With Section 5.2 of the 2020 GRC Settlement Agreement (“Deferred Work Principles”) .................................................................. 23-25
2. Compliance With Other Commission Decisions ..................................... 23-25
F. Cost Tables .................................................................................................. 23-26

(PG&E-4)
23-1
PACIFIC GAS AND ELECTRIC COMPANY 1
CHAPTER 23 2
COMMUNITY REBUILD PROGRAM 3
A. Introduction 4
1. Scope and Purpose 5
The purpose of this chapter is to demonstrate that Pacific Gas and 6
Electric Company’s (PG&E or the Company) expense and capital forecasts 7
for the Community Rebuild Program are reasonable and should be 8
approved. This chapter describes forecasts expenditures for the Community 9
Rebuild project for Electric Operations (EO), Gas Operations and Customer 10
Care.1 In 2019, PG&E initiated the Community Rebuild Program to rebuild 11
PG&E’s distribution electric and gas system infrastructure following the 2018 12
Camp Fire, which devastated the Town of Paradise and surrounding areas 13
in Butte County. The fire destroyed over 18,000 structures, including 14
13,400 premises and virtually the entirety of electrical and gas infrastructure 15
that served the town and surrounding areas. PG&E is committed to our 16
customers on completing the rebuild in a safe and sustainable manner. 17
The scope of this request excludes costs for emergency response 18
activities PG&E incurred immediately following the Camp Fire, and covers 19
the next phase of work to rebuild the distribution assets to meet the 20
long-term needs of the community and provide power to the red-tagged 21
customers as they rebuild their homes. 22
Costs for 2018 – 2022 are subject to recovery on a recorded basis 23
through the Catastrophic Event Memorandum Account (CEMA); these 24
amounts are included for trending purposes because the activity will become 25
GRC funded beginning in 2023. PG&E will exclude costs disallowed by the 26
Wildfire Order Instituting Rulemaking disallowances in accordance with 27
D.20-05-019 when it files for recovery of these costs. Recorded and 28
1 Costs for EO are included in the forecast summary for Electric shown in Chapter 2 of
this exhibit. Costs for Gas Operations and Customer Care are included in the forecast for those exhibits; however, this chapter provides justification to support all program costs. Electric Operations and Gas Operations refer to distribution assets only (not transmission).
(PG&E-4)
23-2
forecast capital and expense costs shown in this chapter are gross of the OII 1
costs. Recorded plant balances have been adjusted for the disallowances.2 2
2. Summary of Request 3
This chapter forecasts expense and capital expenditures for activities in 4
the Community Rebuild Program across the three lines of business (LOB) 5
noted above: Electric Operations, Gas Operations, and Customer Care.3 6
PG&E requests that the California Public Utilities Commission (CPUC or 7
Commission) adopt PG&E’s 2023 total Company expense forecast of 8
$16.7 million for Community Rebuild Program.4 The 2023 expense forecast 9
is $17.9 million less than 2020 recorded adjusted expenses of $34.6 million. 10
PG&E further requests that the Commission adopt the following total 11
Company capital expenditure forecasts for the Community Rebuild Program: 12
$187.3 million for 2021; $240.8 million for 2022; $246.4 million for 2023; 13
$222.9 million for 2024; $161.6 million for 2025; and, $27.0 million for 14
2026.5 The 2023 capital forecast is $88.4 million more than 2020 recorded 15
adjusted capital expenditures of $158.0 million. 16
While the total request reflects multiple LOBs at PG&E, the costs for 17
Major Work Categories (MWC) 95 and IF for the Community Rebuild are 18
only funded out of this chapter, and are included the total request listed 19
above. The expense forecast for Exhibit (PG&E-4), Chapter 23 is 20
$13.8 million for 2023.6 The capital forecast for Exhibit (PG&E-4), 21
Chapter 23 is $87.5 million for 2021; $133.2 million for 2022, $142.5 million 22
for 2023, $129.6 million for 2024, $97.4 million for 2025, and $16.9 million 23
for 2026.7 24
2 See Exhibit (PG&E-10), Chapter 10, Section D.1. 3 The Community Rebuild program is funded in Exhibit (PG&E-4), Chapters 4.3 and 23;
Exhibit (PG&E-3), Chapters 4 and 13; and Exhibit (PG&E-6), Chapter 7. 4 Exhibit (PG&E-4), WP 23-13, line 37. Forecast amount includes EO, Gas Operations,
and Customer Care. 5 Exhibit (PG&E-4), WP 23-13, line 38. Forecast amount includes EO, Gas Operations
and Customer Care. 6 Exhibit (PG&E-4), WP 23-1, line 1. 7 Exhibit (PG&E-4), WP 23-6, line 2.
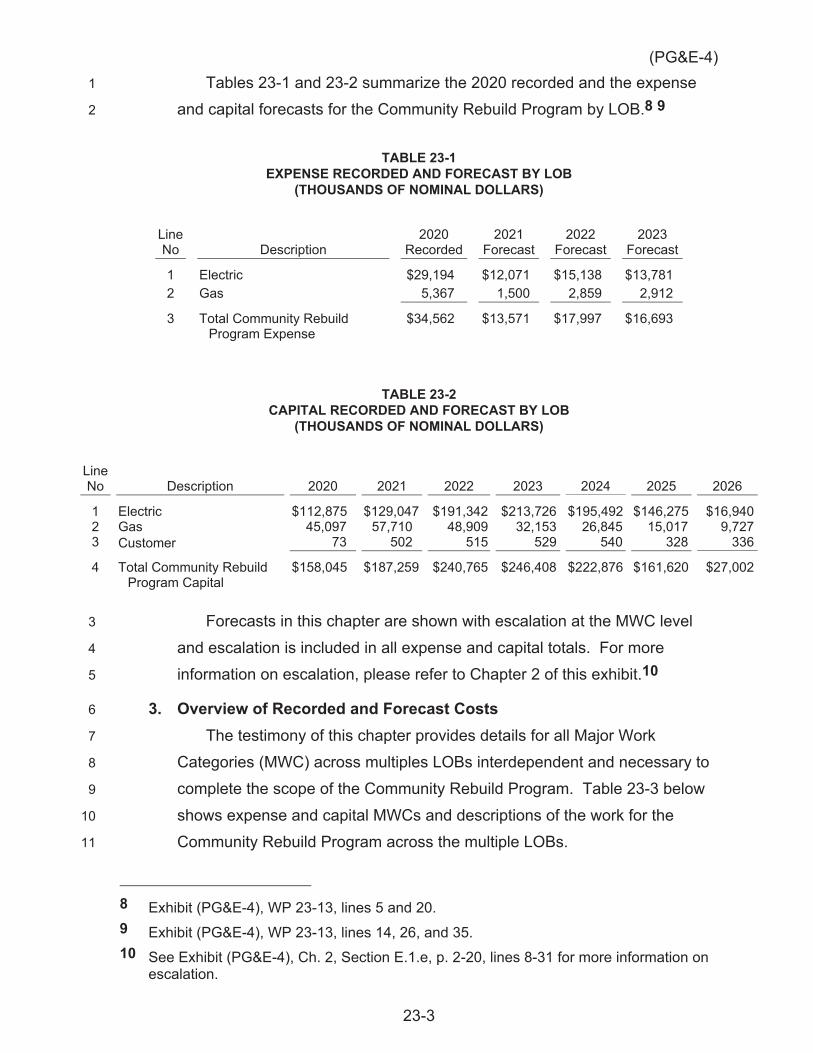
(PG&E-4)
23-3
Tables 23-1 and 23-2 summarize the 2020 recorded and the expense 1
and capital forecasts for the Community Rebuild Program by LOB.8 9 2
TABLE 23-1 EXPENSE RECORDED AND FORECAST BY LOB
(THOUSANDS OF NOMINAL DOLLARS)
Line No Description
2020 Recorded
2021 Forecast
2022 Forecast
2023 Forecast
1 Electric $29,194 $12,071 $15,138 $13,781 2 Gas 5,367 1,500 2,859 2,912
3 Total Community Rebuild Program Expense
$34,562 $13,571 $17,997 $16,693
TABLE 23-2 CAPITAL RECORDED AND FORECAST BY LOB
(THOUSANDS OF NOMINAL DOLLARS)
Line No Description 2020 2021 2022 2023 2024 2025 2026
1 Electric $112,875 $129,047 $191,342 $213,726 $195,492 $146,275 $16,940 2 Gas 45,097 57,710 48,909 32,153 26,845 15,017 9,727 3 Customer 73 502 515 529 540 328 336
4 Total Community Rebuild Program Capital
$158,045 $187,259 $240,765 $246,408 $222,876 $161,620 $27,002
Forecasts in this chapter are shown with escalation at the MWC level 3
and escalation is included in all expense and capital totals. For more 4
information on escalation, please refer to Chapter 2 of this exhibit.10 5
3. Overview of Recorded and Forecast Costs 6
The testimony of this chapter provides details for all Major Work 7
Categories (MWC) across multiples LOBs interdependent and necessary to 8
complete the scope of the Community Rebuild Program. Table 23-3 below 9
shows expense and capital MWCs and descriptions of the work for the 10
Community Rebuild Program across the multiple LOBs. 11
8 Exhibit (PG&E-4), WP 23-13, lines 5 and 20. 9 Exhibit (PG&E-4), WP 23-13, lines 14, 26, and 35. 10 See Exhibit (PG&E-4), Ch. 2, Section E.1.e, p. 2-20, lines 8-31 for more information on
escalation.
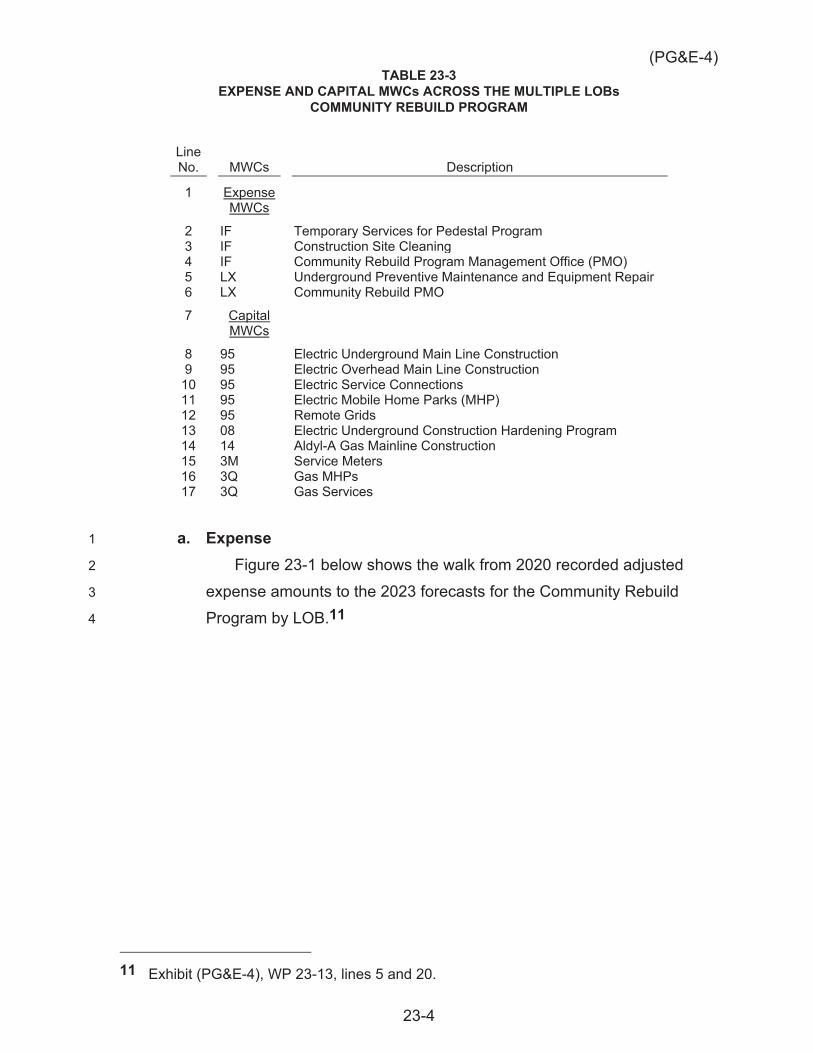
(PG&E-4)
23-4
TABLE 23-3 EXPENSE AND CAPITAL MWCs ACROSS THE MULTIPLE LOBs
COMMUNITY REBUILD PROGRAM
Line No. MWCs Description
1 Expense MWCs
2 IF Temporary Services for Pedestal Program 3 IF Construction Site Cleaning 4 IF Community Rebuild Program Management Office (PMO) 5 LX Underground Preventive Maintenance and Equipment Repair 6 LX Community Rebuild PMO
7 Capital MWCs
8 95 Electric Underground Main Line Construction 9 95 Electric Overhead Main Line Construction 10 95 Electric Service Connections 11 95 Electric Mobile Home Parks (MHP) 12 95 Remote Grids 13 08 Electric Underground Construction Hardening Program 14 14 Aldyl-A Gas Mainline Construction 15 3M Service Meters 16 3Q Gas MHPs 17 3Q Gas Services
a. Expense 1
Figure 23-1 below shows the walk from 2020 recorded adjusted 2
expense amounts to the 2023 forecasts for the Community Rebuild 3
Program by LOB.11 4
11 Exhibit (PG&E-4), WP 23-13, lines 5 and 20.
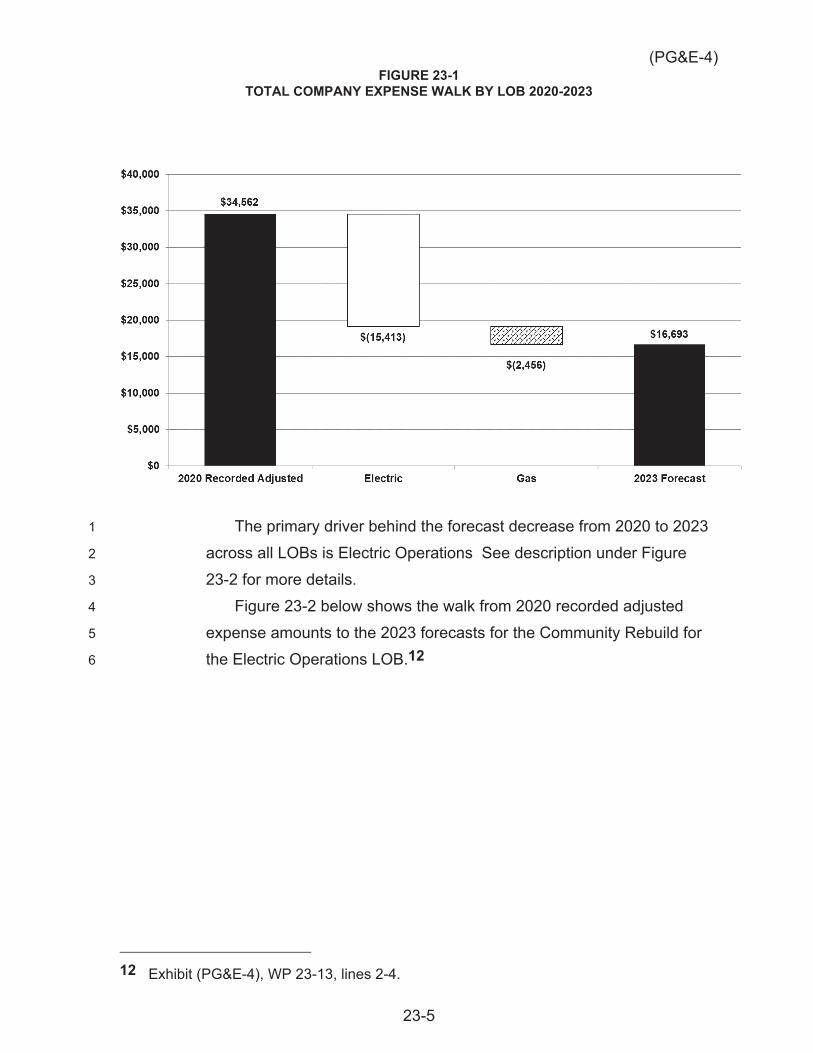
(PG&E-4)
23-5
FIGURE 23-1 TOTAL COMPANY EXPENSE WALK BY LOB 2020-2023
The primary driver behind the forecast decrease from 2020 to 2023 1
across all LOBs is Electric Operations See description under Figure 2
23-2 for more details. 3
Figure 23-2 below shows the walk from 2020 recorded adjusted 4
expense amounts to the 2023 forecasts for the Community Rebuild for 5
the Electric Operations LOB.12 6
12 Exhibit (PG&E-4), WP 23-13, lines 2-4.

(PG&E-4)
23-6
FIGURE 23-2 ELECTRIC OPERATIONS EXPENSE WALK 2020-2023
(THOUSANDS OF NOMINAL DOLLARS)
As shown in Figure 23-2, the decrease in expenses from 2020 to 1
2023 is primarily due to a forecast decrease in Construction Site 2
Clearing spending. In 2020, PG&E incurred significant Construction Site 3
Clearing costs due to continuing efforts to remove debris related to the 4
2018 Camp Fire. In 2023, demand for Construction Site Clearing is 5
expected to be much lower as progress is expected to continue until the 6
site is cleared of debris. 7
b. Capital 8
Figure 23-3 below shows the 2020 recorded capital expenditures 9
and the 2021 to 2026 forecast capital expenditures for the Community 10
Rebuild Program by LOB.13 11
13 Exhibit (PG&E-4), WP 23-13, lines 14, 26, and 35.
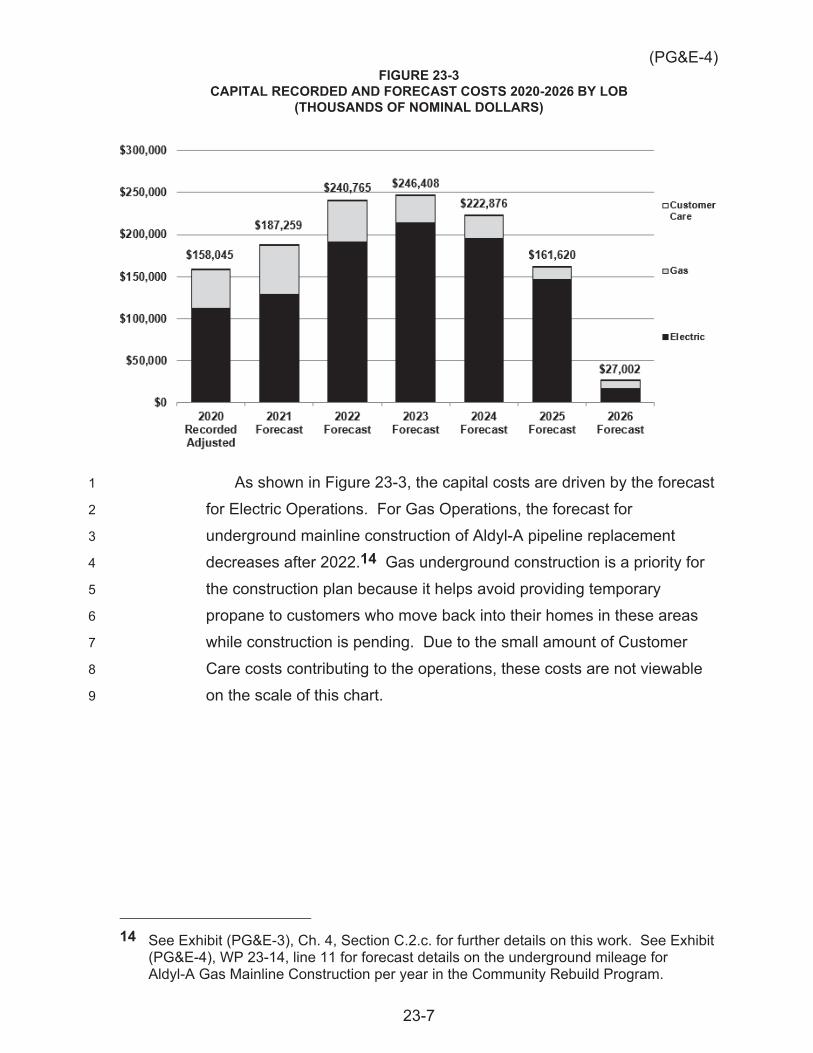
(PG&E-4)
23-7
FIGURE 23-3 CAPITAL RECORDED AND FORECAST COSTS 2020-2026 BY LOB
(THOUSANDS OF NOMINAL DOLLARS)
As shown in Figure 23-3, the capital costs are driven by the forecast 1
for Electric Operations. For Gas Operations, the forecast for 2
underground mainline construction of Aldyl-A pipeline replacement 3
decreases after 2022.14 Gas underground construction is a priority for 4
the construction plan because it helps avoid providing temporary 5
propane to customers who move back into their homes in these areas 6
while construction is pending. Due to the small amount of Customer 7
Care costs contributing to the operations, these costs are not viewable 8
on the scale of this chart. 9
14 See Exhibit (PG&E-3), Ch. 4, Section C.2.c. for further details on this work. See Exhibit
(PG&E-4), WP 23-14, line 11 for forecast details on the underground mileage for Aldyl-A Gas Mainline Construction per year in the Community Rebuild Program.
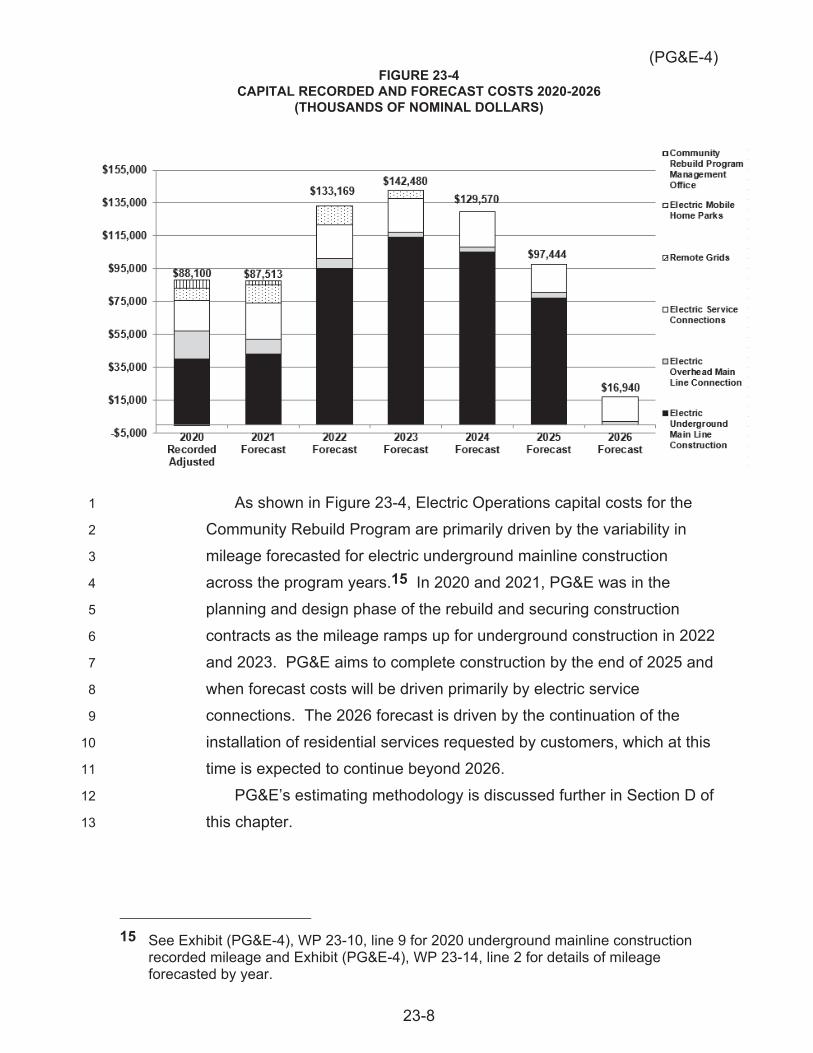
(PG&E-4)
23-8
FIGURE 23-4 CAPITAL RECORDED AND FORECAST COSTS 2020-2026
(THOUSANDS OF NOMINAL DOLLARS)
As shown in Figure 23-4, Electric Operations capital costs for the 1
Community Rebuild Program are primarily driven by the variability in 2
mileage forecasted for electric underground mainline construction 3
across the program years.15 In 2020 and 2021, PG&E was in the 4
planning and design phase of the rebuild and securing construction 5
contracts as the mileage ramps up for underground construction in 2022 6
and 2023. PG&E aims to complete construction by the end of 2025 and 7
when forecast costs will be driven primarily by electric service 8
connections. The 2026 forecast is driven by the continuation of the 9
installation of residential services requested by customers, which at this 10
time is expected to continue beyond 2026. 11
PG&E’s estimating methodology is discussed further in Section D of 12
this chapter. 13
15 See Exhibit (PG&E-4), WP 23-10, line 9 for 2020 underground mainline construction
recorded mileage and Exhibit (PG&E-4), WP 23-14, line 2 for details of mileage forecasted by year.
(PG&E-4)
23-9
4. Support for Request 1
PG&E has an obligation to serve customers and restore assets following 2
any disaster once service is requested. Complete restoration of electric 3
distribution, gas distribution, and customer meter assets are all necessary to 4
rebuild the Community damaged by the Camp Fire. The testimony supports 5
funding to restore assets to the Town of Paradise and parts of Magalia in a 6
safe and reliable way to serve the long-term needs of the customers, and 7
safely return to a renewed community. 8
5. Organization of the Remainder of This Chapter 9
The remainder of this chapter is organized as follows: 10
Section B – Program and Risk Overview; 11
Section C – Activities, Costs, and Forecast Drivers by Workstream; 12
Section D – Estimating Methods; 13
Section E – Compliance with Prior Commission Decisions; and 14
Section F – Cost Tables. 15
B. Program and Risk Overview 16
1. Program Description 17
a. Program Overview 18
In the 2018 Camp Fire, approximately 199 miles of electric 19
distribution lines and 34 miles of gas pipeline were destroyed. In 20
May 2019, PG&E decided to underground all the electric distribution 21
assets in the Town of Paradise and adjacent parts of Butte County (also 22
known as the underground footprint) the following reasons: 23
Safety – During the fire many distribution poles fell into the streets 24
and blocked access to egress routes during the fire. The impacted 25
area is in a Tier 2 (Elevated) and 3 (Extreme) High Fire Threat 26
District (HFTD) area, with a very small non-tiered area. The 27
undergrounding of assets will help reduce wildfire risk from power 28
lines in the area and help ensure access to safe egress routes if 29
there is a wildfire (regardless of source of ignition). 30
Joint Trench Opportunities – During the 2018 Camp Fire, 30 miles of 31
Aldyl-A gas main were destroyed. In addition, 27 miles of gas main 32
that were not destroyed were planned to be replaced under the 33
(PG&E-4)
23-10
Aldyl-A Pipeline Replacement Safety Program. Even if the Camp 1
Fire didn’t occur, all 57 miles of Aldyl-A gas main would be replaced 2
at some time in the future and is discussed further in Section C.2.c. 3
In these areas of Paradise, PG&E is taking advantage of the unique 4
opportunity to underground replacement gas and electric facilities in 5
a joint trench. Performing joint trench work helps reduce 6
underground construction costs over the entire program for both the 7
gas and electric business. In addition, if communication companies 8
choose to participate in the trench, that will provide additional 9
opportunities to lower the cost of the underground construction. 10
City Planning – Government leaders and PG&E’s customers in 11
Paradise and Butte County have expressed the strong desire for 12
underground utilities in their community to improve the safety egress 13
paths and improve their town design. During the rebuild efforts, the 14
Paradise City Council intends to enforce a “dig-once” ordinance. 15
PG&E is coordinating construction closely with Paradise to complete 16
construction before the town repaves its primary town arteries. 17
Public Safety Power Shutoff (PSPS) Improvements – In 2020, the 18
Paradise and Butte County areas experienced five PSPS events 19
spanning a total of 13 days. As the Community Rebuild project is 20
executed over the next several years, it will enable undergrounded 21
areas of Paradise to remain energized during PSPS events. 22
Scoping for the Community Rebuild is prioritizing PSPS mitigation 23
while working with the community to align with their rebuild plans. 24
The Community Rebuild is managed centrally under a core team 25
that oversees many LOBs within PG&E to complete the scope of 26
work (electric, gas, sourcing, etc.). The team also regularly 27
communicates with Federal Emergency Management Agency and 28
the local county and cities to coordinate construction locations and 29
timelines. 30
b. Management Structure 31
The Community Rebuild program is managed within PG&E’s 32
Community Rebuild and Resiliency Program (CRRP) Project 33
Management Organization (PMO) within the Major Projects and 34
(PG&E-4)
23-11
Programs division of EO. PG&E established CRRP oversight in 1
February 2019 to provide both operational and financial direction, as 2
well as controls and governance for the various Community Rebuild 3
workstreams. The Community Rebuild Program involves various 4
coordinated efforts among several matrixed teams within PG&E. 5
Through the CRRP, PG&E ensures that the right amount of resources is 6
made available to timely complete Community Rebuild activities, 7
consistent with the needs of the Paradise community and customers. 8
To that end, CRRP management ensures that the Community 9
Rebuild Program has dedicated resources for construction 10
management, operations coordination, underground program 11
management, services program management, business analysts, and 12
customer outreach specialists to help manage work scope, schedule, 13
budget, and customer inquiries regarding the program. Dedicated 14
resources for the program from other PG&E organizations include: 15
Safety, Shared Services (Land, Environmental, Permitting, Materials), 16
Service Planning and Design, Gas and Electric General Construction, 17
State Infrastructure, Portfolio and Project Management, LOBs, 18
Estimating/Engineering, Customer Care, Finance, and Planning. 19
Following the 2017 North Bay Fires, PG&E developed a Disaster 20
Rebuild Annex (Annex to the Company Emergency Response Plan) to 21
create processes and procedures for restoring significantly interrupted 22
services caused by disasters, such as wildfires or earthquakes. Each 23
disaster involves unique circumstances, but one key metric PG&E 24
closely monitors is its response time for restoring service to customers 25
from the time they apply for service to when they can move back into 26
their homes. 27
2. Risk Integration 28
Chapter 3 of this exhibit describes how EO uses the Enterprise and 29
Operational Risk Management Program to manage electric system risks. 30
Table 23-4 below shows the EO risks associated with the forecasts 31
discussed in this chapter. 32
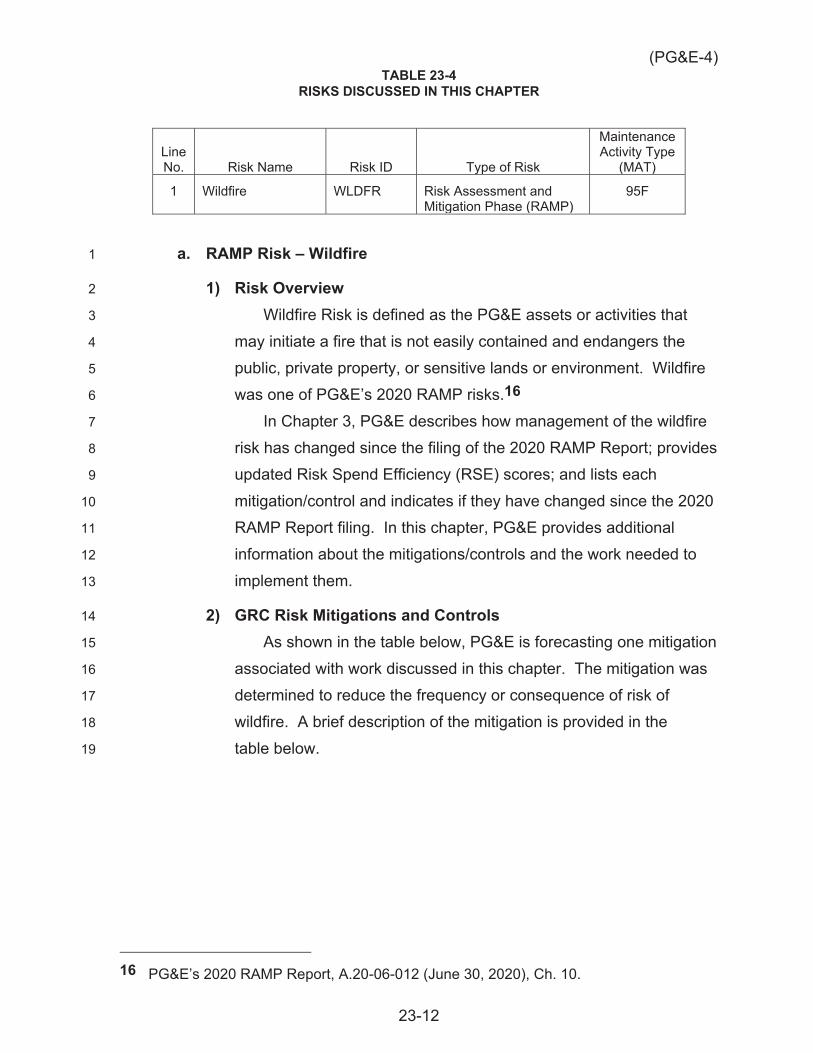
(PG&E-4)
23-12
TABLE 23-4 RISKS DISCUSSED IN THIS CHAPTER
Line No. Risk Name Risk ID Type of Risk
Maintenance Activity Type
(MAT)
1 Wildfire WLDFR Risk Assessment and Mitigation Phase (RAMP)
95F
a. RAMP Risk – Wildfire 1
1) Risk Overview 2
Wildfire Risk is defined as the PG&E assets or activities that 3
may initiate a fire that is not easily contained and endangers the 4
public, private property, or sensitive lands or environment. Wildfire 5
was one of PG&E’s 2020 RAMP risks.16 6
In Chapter 3, PG&E describes how management of the wildfire 7
risk has changed since the filing of the 2020 RAMP Report; provides 8
updated Risk Spend Efficiency (RSE) scores; and lists each 9
mitigation/control and indicates if they have changed since the 2020 10
RAMP Report filing. In this chapter, PG&E provides additional 11
information about the mitigations/controls and the work needed to 12
implement them. 13
2) GRC Risk Mitigations and Controls 14
As shown in the table below, PG&E is forecasting one mitigation 15
associated with work discussed in this chapter. The mitigation was 16
determined to reduce the frequency or consequence of risk of 17
wildfire. A brief description of the mitigation is provided in the 18
table below. 19
16 PG&E’s 2020 RAMP Report, A.20-06-012 (June 30, 2020), Ch. 10.
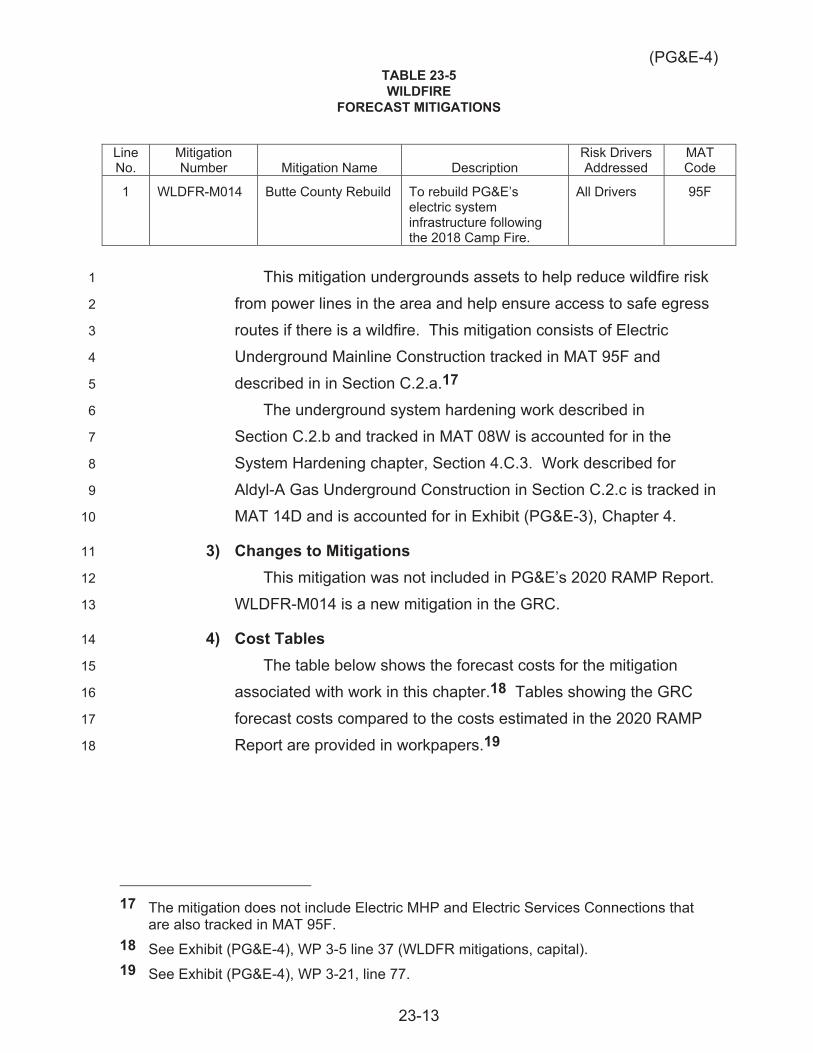
(PG&E-4)
23-13
TABLE 23-5 WILDFIRE
FORECAST MITIGATIONS
Line No.
Mitigation Number Mitigation Name Description
Risk Drivers Addressed
MAT Code
1 WLDFR-M014 Butte County Rebuild To rebuild PG&E’s electric system infrastructure following the 2018 Camp Fire.
All Drivers 95F
This mitigation undergrounds assets to help reduce wildfire risk 1
from power lines in the area and help ensure access to safe egress 2
routes if there is a wildfire. This mitigation consists of Electric 3
Underground Mainline Construction tracked in MAT 95F and 4
described in in Section C.2.a.17 5
The underground system hardening work described in 6
Section C.2.b and tracked in MAT 08W is accounted for in the 7
System Hardening chapter, Section 4.C.3. Work described for 8
Aldyl-A Gas Underground Construction in Section C.2.c is tracked in 9
MAT 14D and is accounted for in Exhibit (PG&E-3), Chapter 4. 10
3) Changes to Mitigations 11
This mitigation was not included in PG&E’s 2020 RAMP Report. 12
WLDFR-M014 is a new mitigation in the GRC. 13
4) Cost Tables 14
The table below shows the forecast costs for the mitigation 15
associated with work in this chapter.18 Tables showing the GRC 16
forecast costs compared to the costs estimated in the 2020 RAMP 17
Report are provided in workpapers.1918
17 The mitigation does not include Electric MHP and Electric Services Connections that
are also tracked in MAT 95F. 18 See Exhibit (PG&E-4), WP 3-5 line 37 (WLDFR mitigations, capital). 19 See Exhibit (PG&E-4), WP 3-21, line 77.
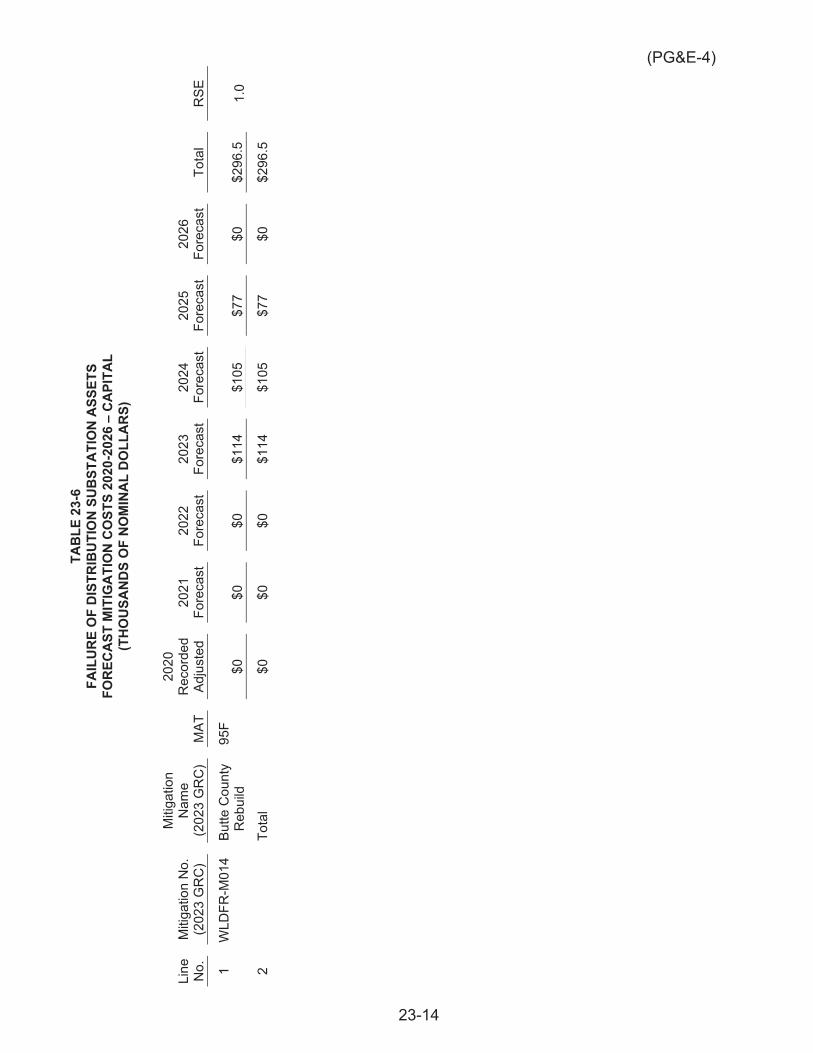
23-14
(PG&E-4) TA
BLE
23-
6 FA
ILU
RE
OF
DIS
TRIB
UTI
ON
SU
BST
ATI
ON
ASS
ETS
FOR
ECA
ST M
ITIG
ATI
ON
CO
STS
2020
-202
6 –
CA
PITA
L (T
HO
USA
ND
S O
F N
OM
INA
L D
OLL
AR
S)
Line
N
o.
Miti
gatio
n N
o.
(202
3 G
RC
)
Miti
gatio
n N
ame
(202
3 G
RC
) M
AT
2020
R
ecor
ded
Adju
sted
20
21
Fore
cast
20
22
Fore
cast
20
23
Fore
cast
20
24
Fore
cast
20
25
Fore
cast
20
26
Fore
cast
To
tal
RSE
1 W
LDFR
-M01
4 Bu
tte C
ount
y R
ebui
ld
95F
$0
$0
$0
$114
$1
05
$77
$0
$296
.5
1.0
2
Tota
l
$0
$0
$0
$114
$1
05
$77
$0
$296
.5
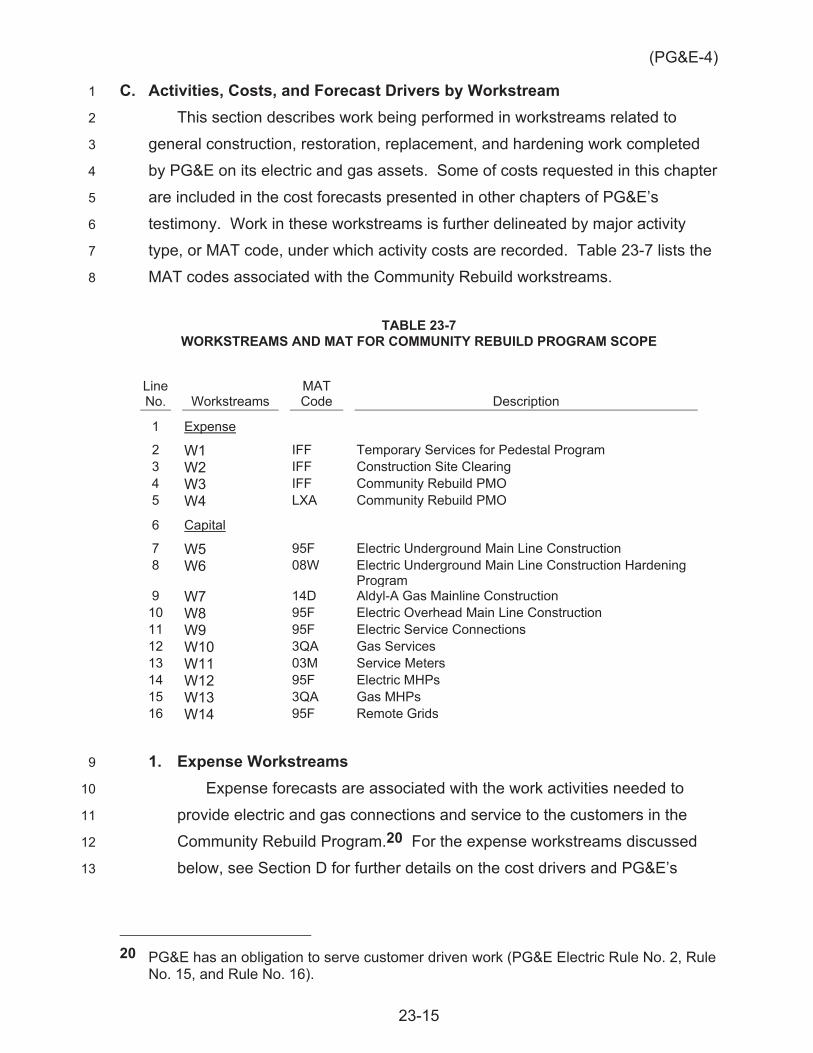
(PG&E-4)
23-15
C. Activities, Costs, and Forecast Drivers by Workstream 1
This section describes work being performed in workstreams related to 2
general construction, restoration, replacement, and hardening work completed 3
by PG&E on its electric and gas assets. Some of costs requested in this chapter 4
are included in the cost forecasts presented in other chapters of PG&E’s 5
testimony. Work in these workstreams is further delineated by major activity 6
type, or MAT code, under which activity costs are recorded. Table 23-7 lists the 7
MAT codes associated with the Community Rebuild workstreams. 8
TABLE 23-7 WORKSTREAMS AND MAT FOR COMMUNITY REBUILD PROGRAM SCOPE
Line No. Workstreams
MAT Code Description
1 Expense
2 W1 IFF Temporary Services for Pedestal Program 3 W2 IFF Construction Site Clearing 4 W3 IFF Community Rebuild PMO 5 W4 LXA Community Rebuild PMO
6 Capital
7 W5 95F Electric Underground Main Line Construction 8 W6 08W Electric Underground Main Line Construction Hardening
Program 9 W7 14D Aldyl-A Gas Mainline Construction 10 W8 95F Electric Overhead Main Line Construction 11 W9 95F Electric Service Connections 12 W10 3QA Gas Services 13 W11 03M Service Meters 14 W12 95F Electric MHPs 15 W13 3QA Gas MHPs 16 W14 95F Remote Grids
1. Expense Workstreams 9
Expense forecasts are associated with the work activities needed to 10
provide electric and gas connections and service to the customers in the 11
Community Rebuild Program.20 For the expense workstreams discussed 12
below, see Section D for further details on the cost drivers and PG&E’s 13
20 PG&E has an obligation to serve customer driven work (PG&E Electric Rule No. 2, Rule
No. 15, and Rule No. 16).
(PG&E-4)
23-16
Project and Program Authorization and Approval Procedure utilized for 1
calculating the Expected Case Forecast. 2
The table in section C.1.d. summarizes the forecast for each expense 3
workstream. 4
a. W1 – Temporary Services for Pedestal Program (MAT IFF) 5
This work category concerns PG&E’s activities for providing 6
temporary electrical service. PG&E filed Advice Letter (AL) 5744-E on 7
January 24, 2020 and received CPUC approval on April 17, 2020 to 8
install underground temporary electric service pedestals to customers 9
that apply for temporary service within the underground footprint of the 10
Community Rebuild. This program results in costs savings for both 11
PG&E and the customer due to the nature of the program construction 12
timeline. Once the underground construction is completed in the 13
residential underground footprint, the program will conclude. The 14
expenses for this program include the cost of the pedestal material and 15
the labor to remove the pedestal at the time the permanent service is 16
installed. The capital costs include the labor and material to install the 17
permanent splice box to connect to the temporary pedestal. 18
b. W2 – Construction Site Clearing (MAT IFF) 19
This work category is associated with Site Clearing activities to 20
maintain a safe construction site for crews working on the Community 21
Rebuild. Many dead trees were left over from the 2018 Camp Fire in 22
construction zones where PG&E’s Community Rebuild activities occur. 23
PG&E will remove trees that pose a safety risk to construction crews. 24
Per PG&E’s accounting guidelines, removal of dead trees adjacent to 25
infrastructure is expense work. 26
c. W3 and W4 – Community Rebuild PMO (MATs IFF and LXA) 27
As described above, the Community Rebuild PMO provides 28
oversight on the matrixed resources supporting the program and 29
ensures that the project scope, schedule, and financials are governed 30
appropriately. 31

(PG&E-4)
23-17
d. Expense Worksteam Summary 1
Table 23 -8 below presents 2020 recorded and 2021 through 2023 2
forecasted expenses for the Community Rebuild Program, by LOB and 3
Workstream. 4
TABLE 23-8 EXPENSE RECORDED AND FORECAST BY LOB AND WORKSTREAM
(THOUSANDS OF NOMINAL DOLLARS)
Line No. Workstream 2018 2019 2020 2021 2022 2023
1 Electric 2 W1/W9 - Electric Service Connections $(44) – $156 $360 $205 $215 3 W2 – Construction Site Clearing 123,521 231,744 23,840 8,751 11,986 10,471 4 W3 – Community Rebuild PMO – 1,549 5,198 2,960 2,947 3,095
5 Gas 6 W7 – Gas Main Construction – 5,325 (4,016) – – – 7 W10 – Gas Services – 71 8,454 – – – 8 W14 – Community Rebuild PMO – 1,355 930 1,500 2,859 2,912
9 Total $123,477 $240,045 $34,562 $13,571 $17,997 $16,693
2. Capital Workstreams 5
The capital workstreams describe the work that enables the construction 6
of permanent rebuild of electric and gas distribution assets to restore service 7
to customers in the Community Rebuild Program.21 For the capital 8
workstreams discussed below, see Section D for the capital expenditure 9
estimating method. 10
The table in section C.2.j. summarizes the forecast for each capital 11
workstream. 12
a. W5 – Electric Underground Main-Line Construction (MAT 95F, 13
WLDFR-M014) 14
This work category involves activities performed for restoring electric 15
distribution assets underground. The capital expenditures recorded in 16
MAT 95F are activities associated with restoring underground mainline 17
where the service was underground prior to the fire and that PG&E has 18
an obligation to restore, or where the underground mainline work is 19
21 PG&E has an obligation to serve customer driven work (PG&E Electric Rule No. 2, Rule
No. 15, and Rule No. 16).

(PG&E-4)
23-18
located in non-HFTD areas.22 For these reasons these underground 1
assets are not recorded to MAT 08W although they are built to the same 2
standards as the wildfire mitigation work in the system hardening 3
program and provide risk reduction. This electric underground main-line 4
construction work recorded in 95F is Wildfire Mitigation (WLDFR-M014), 5
so will be included in the WMBA in 2023.23 6
b. W6 – Electric Underground Main-Line Construction Hardening 7
Program (MAT 08W) 8
This work category covers activities for underground construction of 9
electric distribution assets in Tier 2 or Tier 3 HFTD areas. Assets in this 10
category for the Community Rebuild were previously overhead and are 11
being transitioned to underground. PG&E plans to underground 39.2 12
miles that were previously overhead as part of the Community Rebuild 13
under the MAT 08W category of work. PG&E seeks approval for costs 14
related to the underground construction of electric distribution assets 15
that is part of the Community Rebuild Program in Chapter 4.3 of this 16
Exhibit. This work is part of the broader System Hardening Program in 17
MAT 08W and, as such, is included in the overall System Hardening 18
Program forecast.24 19
c. W7 – Aldyl-A Gas Underground Construction (MAT 14D) 20
The work category involves PG&E’s proactive replacement of 21
Aldyl-A assets as part of the Aldyl-A Gas Pipeline Replacement 22
Program. 25 To share construction costs in the areas where these 23
replacements are occurring, PG&E is performing joint trenching with the 24
electric distribution assets that are being restored. All the joint trenching 25
of electric and gas assets includes the replacement of Aldyl-A pipe. 26
22 For a description of the underground construction, including justification and benefits,
please see workpaper Exhibit (PG&E-4), Ch. 23 – Project Summary – Community Rebuild Program.
23 See discussion of the WMBA in Exhibit (PG&E-4), Chapter 4, Section D.1. Also see Exhibit (PG&E-4), WP 4-35.
24 This work is included in mitigation WLDFR-M002 that is described in Exhibit (PG&E-4), Ch. 4.3, Section C.1.a and C.1.b.
25 This program work is described further in Exhibit (PG&E-3), Ch. 4, Section B.2.c, starting at p. 4-27; also see, p. 4-30, line 23 to p. 4-31, line 9.
(PG&E-4)
23-19
Some of Aldyl-A pipe is being replaced because it was destroyed by the 1
Camp Fire and subsequently decommissioned. In other cases, the pipe 2
is still in working condition, but is being replaced as part of the workplan 3
for the pre-existing Aldyl-A Program. The higher leak rate for plastic 4
pipe installed prior to 1985 correlates with known issues of Aldyl-A 5
plastic pipe installed prior to 1985 (i.e., susceptibility of pipe to slow 6
crack growth when exposed to external stress), which is being 7
addressed through the Plastic Pipe Replacement Program in 14D.26 8
d. W8 – Electric Overhead Main-Line Construction (MAT 95F) 9
This work category concerns distribution overhead hardening work 10
in areas outside of the footprint where PG&E plans to underground 11
distribution assets. Many customers in remote locations were served by 12
overhead distribution assets that were destroyed by the Camp Fire. In 13
these areas, PG&E will replace the assets with overhead distribution 14
assets that meet current hardened standards. PG&E has estimated and 15
designed all of these locations, but only completes the construction 16
when a customer applies for service and there is an existing need for 17
the line to be restored. 18
e. W9 – Electric Services (MAT 95F) 19
This work category concerns the restoration of electric service to 20
customers. 13,400 customers lost their homes in the 2018 Camp Fire. 21
As customers rebuild their homes, PG&E restores their electric service. 22
All the services within the planned underground footprint in Paradise 23
and surrounding areas are constructed underground, sharing a trench 24
with the gas service if the customer also received gas from PG&E. In 25
the areas outside the underground footprint, PG&E restores the service 26
as an overhead service. If a customer did not have electric service prior 27
to the 2018 Camp Fire, they must apply for service under the Rule 16 28
Tariff and pay for the service. 29
26 Exhibit (PG&E-3), Ch. 4, WP 4-40, Project Summary - Plastic Pipe Replacement
Program.
(PG&E-4)
23-20
f. W10 – Gas Services (MAT 3QA) 1
This work category concerns the restoration of gas service to 2
customers. In locations where customers had gas service prior to the 3
Camp Fire, PG&E will restore the gas service when the customers apply 4
for service after they rebuild their homes. As noted above, PG&E will 5
joint trench electric and gas utilities when possible to save on 6
construction costs and leverage limited space for trenching on the 7
customer property. If a customer did not have gas service prior to the 8
2018 Camp Fire, they must apply under the current Rule 16 Tariff and 9
pay for the service. 10
g. W11 – Service Meters (MAT 03M) 11
This category concerns the meters installed as part of the 12
establishment of permanent service.27 13
h. W12 and W13 – Electric and Gas Mobile Home Parks (MATs 95F 14
and 3QA) 15
The scope of work for this team is to rebuild the electric and gas 16
distribution system at Mobile Home Parks (MHPs) in Paradise and 17
surrounding areas. In contrast to the MHP Utility Conversion Program 18
(Chapter 13), the scope of work excludes the beyond the meter 19
connection from the electric pedestal or gas meter to the mobile home, 20
but includes additional service connections to other non-mobile home 21
infrastructure within the MHP, such as apartment buildings and multiple 22
common areas. The reason why the scope of work excludes the 23
beyond the meter connection from the electric pedestal or gas meter to 24
the mobile home is that the MHPs are currently vacant, and there are no 25
mobile homes to receive the connection. 26
i. W14 – Remote Grids 27
In a few locations for the Community Rebuild Program, PG&E 28
analyzed potential opportunities to leverage the Remote Grid Program 29
to serve customers. These locations were pockets of isolated small 30
customer loads served via long electric distribution feeders in HFTD 31
27 See Exhibit (PG&E-6), Chapter 7 Metering Services and Engineering, WP 7-10 and
WP 7-14.
(PG&E-4)
23-21
areas. To date, Remote Grid did not emerge as the best rebuild 1
alternative for the sites assessed as other more cost effective rebuild 2
alternatives were identified. The CRRP team regularly evaluates 3
potential opportunities with PG&E’s Remote Grid Program and may be 4
deployed as a rebuild option if it is determined to be the best alternative 5
for specific remote locations going forward. Please see Exhibit 6
(PG&E-4), Chapter 4.3 for more information on the Remote Grid 7
Program. 8
j. Capital Workstream Summary 9
Table 23-9 below presents the 2019 and 2020 recorded costs and 10
2021 through 2026 forecasted capital costs for the Community Rebuild 11
Program, by LOB and Workstream. 12
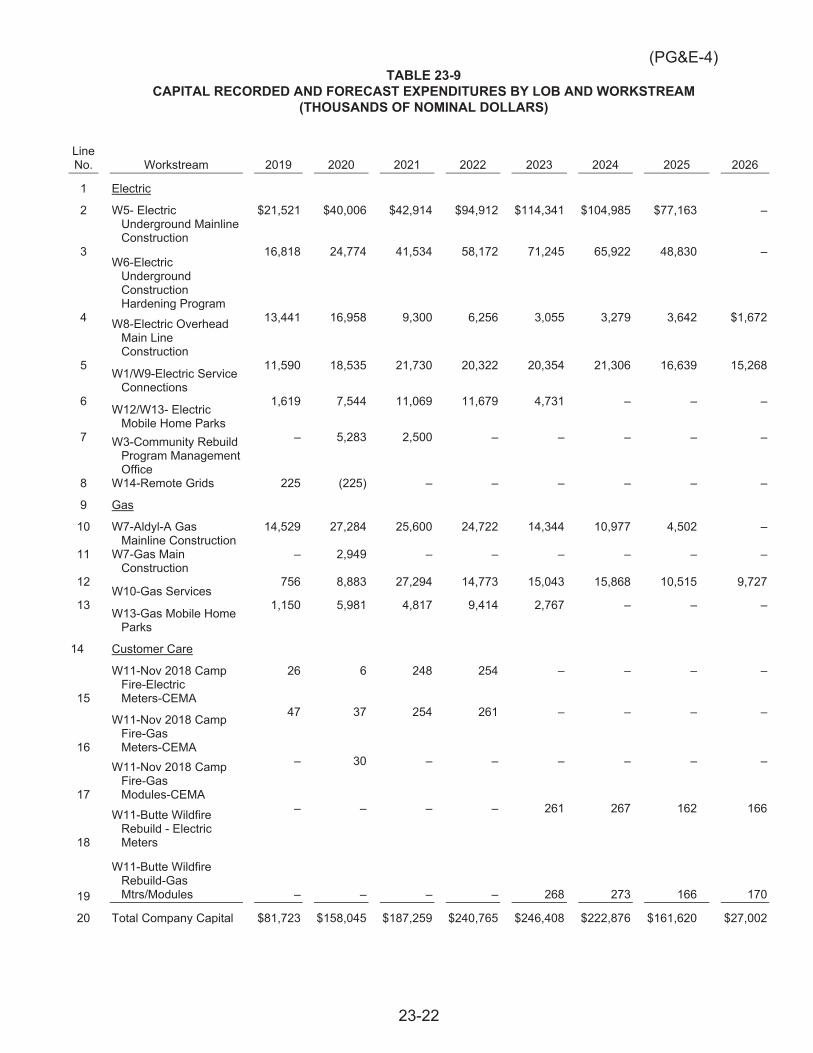
(PG&E-4)
23-22
TABLE 23-9 CAPITAL RECORDED AND FORECAST EXPENDITURES BY LOB AND WORKSTREAM
(THOUSANDS OF NOMINAL DOLLARS)
Line No. Workstream 2019 2020 2021 2022 2023 2024 2025 2026
1 Electric
2 W5- Electric Underground Mainline Construction
$21,521 $40,006 $42,914 $94,912 $114,341 $104,985 $77,163 –
3 W6-Electric
Underground Construction Hardening Program
16,818 24,774 41,534 58,172 71,245 65,922 48,830 –
4 W8-Electric Overhead Main Line Construction
13,441 16,958 9,300 6,256 3,055 3,279 3,642 $1,672
5 W1/W9-Electric Service
Connections
11,590 18,535 21,730 20,322 20,354 21,306 16,639 15,268
6 W12/W13- Electric
Mobile Home Parks
1,619 7,544 11,069 11,679 4,731 – – –
7 W3-Community Rebuild Program Management Office
– 5,283 2,500 – – – – –
8 W14-Remote Grids 225 (225) – – – – – –
9 Gas
10 W7-Aldyl-A Gas Mainline Construction
14,529 27,284 25,600 24,722 14,344 10,977 4,502 –
11 W7-Gas Main Construction
– 2,949 – – – – – –
12 W10-Gas Services
756 8,883 27,294 14,773 15,043 15,868 10,515 9,727
13 W13-Gas Mobile Home
Parks
1,150 5,981 4,817 9,414 2,767 – – –
14 Customer Care
15
W11-Nov 2018 Camp Fire-Electric Meters-CEMA
26 6 248 254 – – – –
16
W11-Nov 2018 Camp Fire-Gas Meters-CEMA
47 37 254 261 – – – –
17
W11-Nov 2018 Camp Fire-Gas Modules-CEMA
– 30 – – – – – –
18
W11-Butte Wildfire Rebuild - Electric Meters
– – – – 261 267 162 166
19
W11-Butte Wildfire Rebuild-Gas Mtrs/Modules – – – – 268 273 166 170
20 Total Company Capital $81,723 $158,045 $187,259 $240,765 $246,408 $222,876 $161,620 $27,002
(PG&E-4)
23-23
D. Estimating Methods 1
PG&E describes here the methods used to develop the Community Rebuild 2
expense and capital forecasts. See the workpapers for this chapter for more 3
details on the forecast and the workstreams. 4
1. Expense 5
Community Rebuild expense costs are based on costs for material and 6
labor costs. 7
The Temporary Service for Pedestal Program workstream W1 forecast 8
is based on the cost of the pedestal material and the labor to remove the 9
pedestal at the time the permanent service is installed. There is also a 10
capital component based on the labor and material to install the permanent 11
splice box to connect to the temporary pedestal. 12
The Construction Site Clearing workstream W2 forecast is based on unit 13
cost per foot for construction Site Clearing during PG&E’s initial emergency 14
response effort to the 2018 Camp Fire, program progress in 2019 and 2020, 15
and on factors specific to the Community Rebuild program. 16
The Community Rebuild PMO workstreams W3 and W4 consists 17
primarily of Community Rebuild Program’s PMO labor, or headcount needed 18
for program oversight and support. 95 percent of headcount for the PMO is 19
charged directly to major capital project costs for the underground 20
construction on the Community Rebuild. The other 5 percent of the 21
headcount for the Community Rebuild Program PMO is reflected in the 22
expense forecast. This expense forecast is further split 50/50 between gas 23
and electric to share support resources since both commodities are built in 24
the program. 25
2. Capital 26
PG&E used both a unit cost and project cost estimating methodologies 27
to forecast the costs for the work described herein. 28
Electric Underground and Overhead MainLine Construction, and 29
Electric and Gas Services 30
To develop an initial forecast for workstreams W5, W6, W8, W9, and 31
W10 PG&E benchmarked the rebuild costs associated with the Coffey Park 32
rebuild after the 2017 Northern California Wildfire Season due to similar 33
(PG&E-4)
23-24
construction factors such as joint trench construction, urban environment, 1
and soil conditions. PG&E then adjusted the cost from the Coffey Park 2
rebuild to account for factors specific to the Camp Fire footprint. The 3
primary factors driving the adjustments were joint utility participation28 and 4
resource availability. Workstreams W5, W6 and W8 forecasts were based 5
on a cost/foot, and workstreams W9 and W10 were based on a cost per 6
premise (typically property or account) from the Coffey Park rebuild. The 7
units for underground mainline mileage were based on the miles of 8
distribution that existed prior to the Camp Fire. 9
Aldyl-A Gas Underground Construction, Service Meters, and 10
Electric and Gas Mobile Home Parks 11
For workstream W7, PG&E used the replacement unit cost for Aldyl-A 12
Gas Mainline Construction described in Exhibit (PG&E-3) Chapter 4, 13
WP 4-18. 14
For workstream W11, PG&E used the unit cost method for meters as 15
described in the Metering Services and Engineering Chapter Exhibit 16
(PG&E-6), WP 7-10 and 7-14. Annual units for residential and commercial 17
services for the Community Rebuild Program are based on current demand 18
trends and rebuild rates from other disasters, specifically including the 2017 19
and 2018 Northern California Wildfires. 20
For workstreams W12 and W13, PG&E evaluated the cost per space 21
based on historical averages mobile home spaces costs for PG&E for years 22
2016 – 2018 and adjustments based on factors specific to the Camp Fire 23
footprint drivers, as described above. Units for MHPs are forecasted based 24
on current customer demand to rebuild MHPs; the majority of MHPs in the 25
Community Rebuild scope have applied for participation. 26
There is no forecast for Remote Grid workstream W14 and therefore no 27
estimating method. 28
28 Communication companies have the option to participate in the underground mainline
trench and services. If they choose to do so, they each pay a fee based on the Form B Agreement, which helps drive down the costs of the construction. To date, the participation from communication companies had been less than the participation from the Coffey Park project.
(PG&E-4)
23-25
Following the initial capital forecast development described above, 1
workstream costs were adjusted in 2020 based on the actual costs incurred 2
on the Community Rebuild project in 2019 and 2020. 3
E. Compliance With Prior Commission Decisions 4
1. Compliance With Section 5.2 of the 2020 GRC Settlement Agreement 5
(“Deferred Work Principles”) 6
The 2020 GRC Settlement Agreement requires PG&E to include 7
testimony in this GRC on deferred work if the following criteria are met: 8
(a) The work was requested and authorized based on representations that it 9
was needed to provide safe and reliable service (Check 1); 10
(b) PG&E did not perform all the authorized and funded work, as measured 11
by authorized (explicit or imputed) units of work (Check 2); and 12
(c) PG&E continues to represent that the curtailed work is necessary to 13
provide safe and reliable service (Check 3). 14
For work covered in this chapter, Check 1 in (a) was deemed to not 15
apply, as this work was not forecasted in the 2020 GRC. This analysis is 16
presented in the workpapers supporting Chapter 2 of this exhibit.29 17
2. Compliance With Other Commission Decisions 18
As outlined in PG&E’s 2021 Wildfire Mitigation Plan, the Community 19
Rebuild Program completed 21.3 miles of underground construction within 20
the Camp Fire boundaries, exceeding the 20-mile target for 2020.30 21
PG&E’s target for 2021 is 23 miles. 22
Cost recovery for Community Rebuild Expenditures for 2019-2020 23
excludes costs disallowed by the Wildfire Order Instituting Rulemaking 24
disallowances in accordance with Decision 20-05-019. 25
System hardening costs recorded to MWC 08W through December 31, 26
2020 are included in the 2020 Wildfire Mitigation Catastrophic Events 27
Application (Application 20-09-019). 28
Recovery of program costs not forecast in this GRC may be included in 29
future proceedings. AL 5744-E was approved by the CPUC for PG&E to 30
29 See Exhibit (PG&E-4), WP 2-15. 30 See R.18-10-007, PG&E’s 2021 WMP Report (Feb. 5, 2021) Section 7.3.3.17.6,
Butte County Rebuild Program, for further details.
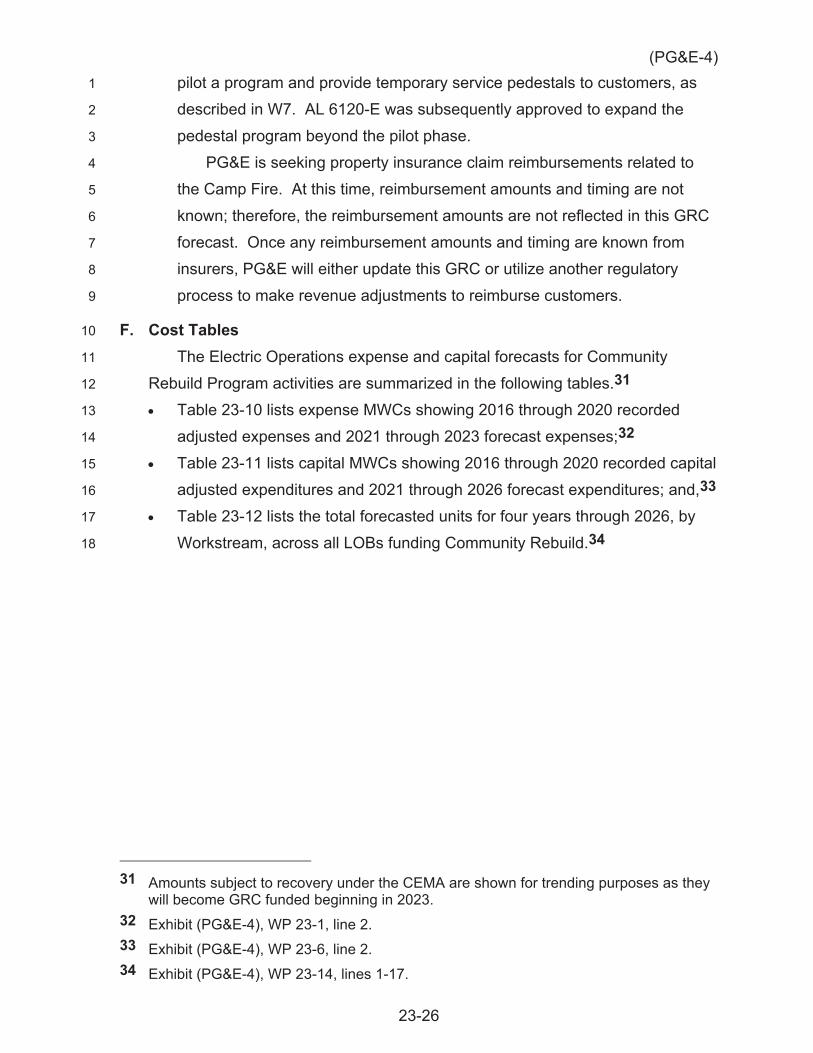
(PG&E-4)
23-26
pilot a program and provide temporary service pedestals to customers, as 1
described in W7. AL 6120-E was subsequently approved to expand the 2
pedestal program beyond the pilot phase. 3
PG&E is seeking property insurance claim reimbursements related to 4
the Camp Fire. At this time, reimbursement amounts and timing are not 5
known; therefore, the reimbursement amounts are not reflected in this GRC 6
forecast. Once any reimbursement amounts and timing are known from 7
insurers, PG&E will either update this GRC or utilize another regulatory 8
process to make revenue adjustments to reimburse customers. 9
F. Cost Tables 10
The Electric Operations expense and capital forecasts for Community 11
Rebuild Program activities are summarized in the following tables.31 12
Table 23-10 lists expense MWCs showing 2016 through 2020 recorded 13
adjusted expenses and 2021 through 2023 forecast expenses;32 14
Table 23-11 lists capital MWCs showing 2016 through 2020 recorded capital 15
adjusted expenditures and 2021 through 2026 forecast expenditures; and,33 16
Table 23-12 lists the total forecasted units for four years through 2026, by 17
Workstream, across all LOBs funding Community Rebuild.34 18
31 Amounts subject to recovery under the CEMA are shown for trending purposes as they
will become GRC funded beginning in 2023. 32 Exhibit (PG&E-4), WP 23-1, line 2. 33 Exhibit (PG&E-4), WP 23-6, line 2. 34 Exhibit (PG&E-4), WP 23-14, lines 1-17.
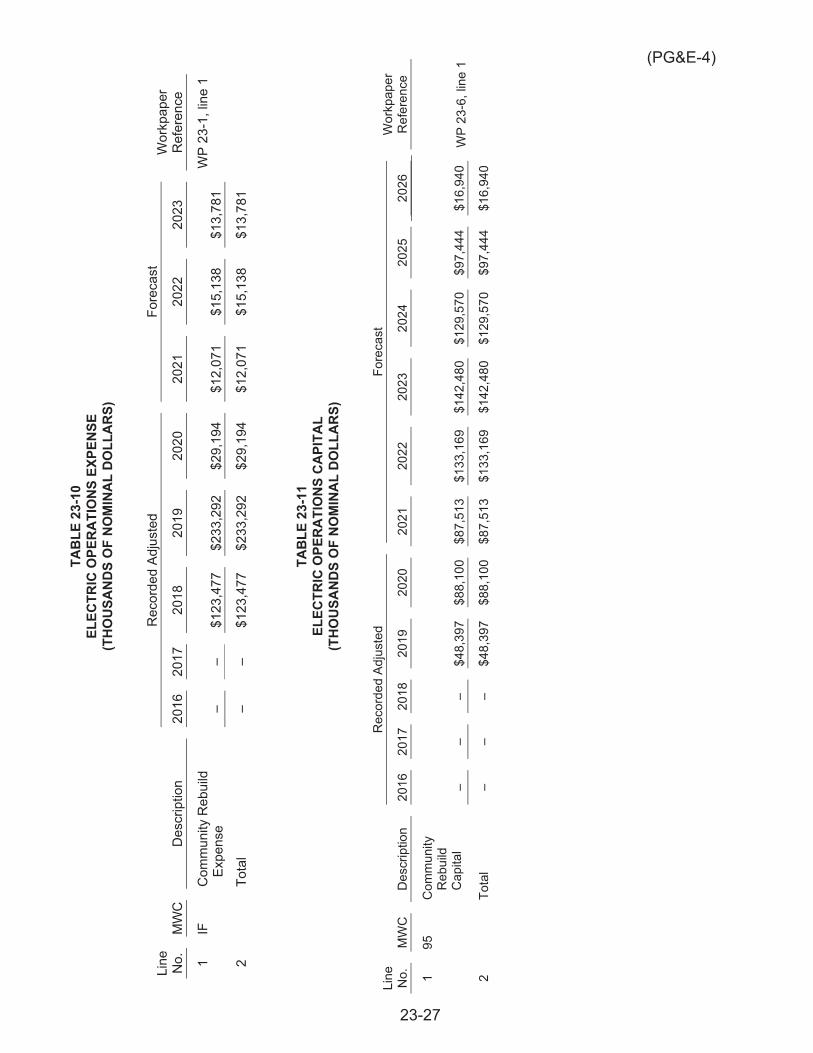
(PG&E-4)
23-27
TA
BLE
23-
10
ELEC
TRIC
OPE
RA
TIO
NS
EXPE
NSE
(T
HO
USA
ND
S O
F N
OM
INA
L D
OLL
AR
S)
Line
N
o.
MW
C
Des
crip
tion
Rec
orde
d Ad
just
ed
Fore
cast
W
orkp
aper
R
efer
ence
20
16
2017
20
18
2019
20
20
2021
20
22
2023
1 IF
C
omm
unity
Reb
uild
Ex
pens
e –
– $1
23,4
77
$233
,292
$2
9,19
4 $1
2,07
1 $1
5,13
8 $1
3,78
1 W
P 23
-1, l
ine
1
2
Tota
l –
– $1
23,4
77
$233
,292
$2
9,19
4 $1
2,07
1 $1
5,13
8 $1
3,78
1
TAB
LE 2
3-11
EL
ECTR
IC O
PER
ATI
ON
S C
API
TAL
(TH
OU
SAN
DS
OF
NO
MIN
AL
DO
LLA
RS)
Line
N
o.
MW
C
Des
crip
tion
Rec
orde
d Ad
just
ed
Fore
cast
W
orkp
aper
R
efer
ence
20
16
2017
20
18
2019
20
20
2021
20
22
2023
20
24
2025
20
26
1 95
C
omm
unity
R
ebui
ld
Cap
ital
– –
– $4
8,39
7 $8
8,10
0 $8
7,51
3 $1
33,1
69
$142
,480
$1
29,5
70
$97,
444
$16,
940
WP
23-6
, lin
e 1
2
Tota
l –
– –
$48,
397
$88,
100
$87,
513
$133
,169
$1
42,4
80
$129
,570
$9
7,44
4 $1
6,94
0
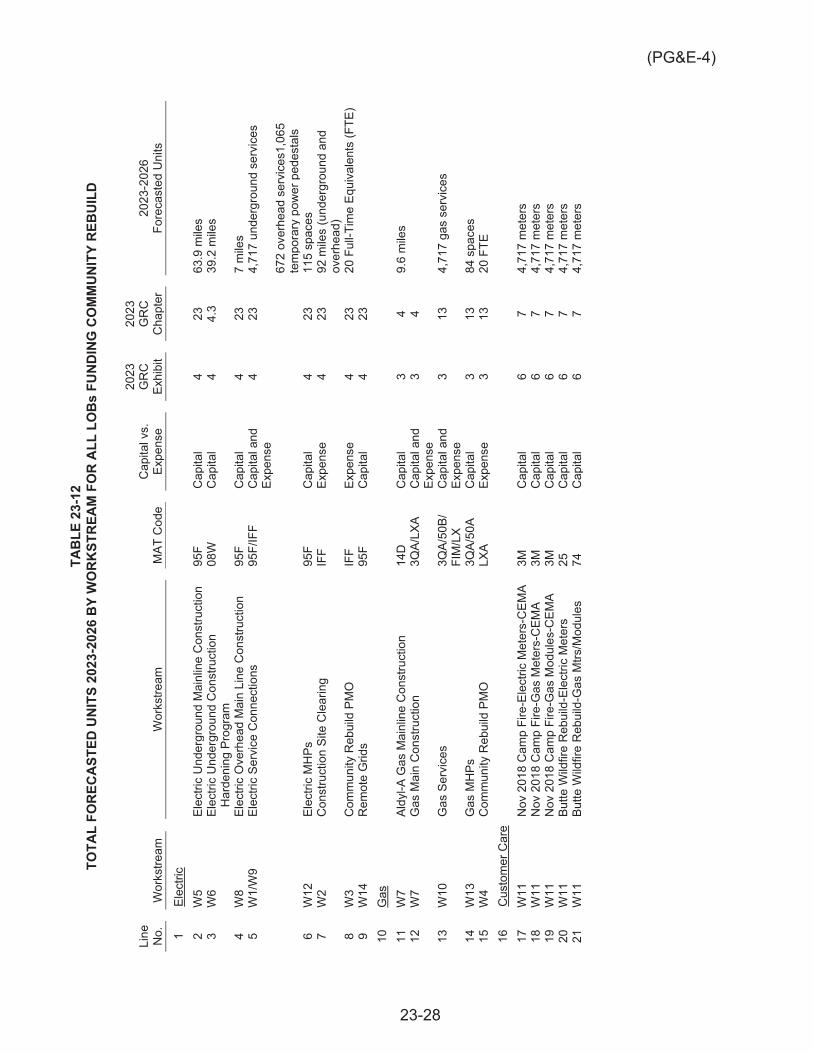
(PG&E-4)
23-28
TA
BLE
23-
12
TOTA
L FO
REC
AST
ED U
NIT
S 20
23-2
026
BY
WO
RK
STR
EAM
FO
R A
LL L
OB
s FU
ND
ING
CO
MM
UN
ITY
REB
UIL
D
Line
N
o.
Wor
kstre
am
Wor
kstre
am
MAT
Cod
e C
apita
l vs.
Ex
pens
e
2023
G
RC
Ex
hibi
t
2023
G
RC
C
hapt
er
2023
-202
6 Fo
reca
sted
Uni
ts
1 El
ectri
c 2
W5
Elec
tric
Und
ergr
ound
Mai
nlin
e C
onst
ruct
ion
95F
Cap
ital
4 23
63
.9 m
iles
3 W
6 El
ectri
c U
nder
grou
nd C
onst
ruct
ion
Har
deni
ng P
rogr
am
08W
C
apita
l 4
4.3
39.2
mile
s
4 W
8 El
ectri
c O
verh
ead
Mai
n Li
ne C
onst
ruct
ion
95F
Cap
ital
4 23
7
mile
s 5
W1/
W9
Elec
tric
Serv
ice
Con
nect
ions
95
F/IF
F C
apita
l and
Ex
pens
e 4
23
4,71
7 un
derg
roun
d se
rvic
es
672
over
head
ser
vice
s1,0
65
tem
pora
ry p
ower
ped
esta
ls
6 W
12
Elec
tric
MH
Ps
95F
Cap
ital
4 23
11
5 sp
aces
7
W2
Con
stru
ctio
n Si
te C
lear
ing
IF
F Ex
pens
e 4
23
92 m
iles
(und
ergr
ound
and
ov
erhe
ad)
8 W
3 C
omm
unity
Reb
uild
PM
O
IFF
Expe
nse
4 23
20
Ful
l-Tim
e Eq
uiva
lent
s (F
TE)
9 W
14
Rem
ote
Grid
s 95
F C
apita
l 4
23
10
Gas
11
W7
Aldy
l-A G
as M
ainl
ine
Con
stru
ctio
n 14
D
Cap
ital
3 4
9.6
mile
s 12
W
7 G
as M
ain
Con
stru
ctio
n 3Q
A/LX
A C
apita
l and
Ex
pens
e 3
4
13
W10
G
as S
ervi
ces
3QA/
50B/
FI
M/L
X C
apita
l and
Ex
pens
e 3
13
4,71
7 ga
s se
rvic
es
14
W13
G
as M
HPs
3Q
A/50
A C
apita
l 3
13
84 s
pace
s
15
W4
Com
mun
ity R
ebui
ld P
MO
LX
A Ex
pens
e 3
13
20 F
TE
16
Cus
tom
er C
are
17
W11
N
ov 2
018
Cam
p Fi
re-E
lect
ric M
eter
s-C
EMA
3M
Cap
ital
6 7
4,71
7 m
eter
s
18
W11
N
ov 2
018
Cam
p Fi
re-G
as M
eter
s-C
EMA
3M
Cap
ital
6 7
4,71
7 m
eter
s
19
W11
N
ov 2
018
Cam
p Fi
re-G
as M
odul
es-C
EMA
3M
Cap
ital
6 7
4,71
7 m
eter
s
20
W11
Bu
tte W
ildfir
e R
ebui
ld-E
lect
ric M
eter
s 25
C
apita
l 6
7 4,
717
met
ers
21
W
11
Butte
Wild
fire
Reb
uild
-Gas
Mtrs
/Mod
ules
74
C
apita
l 6
7 4,
717
met
ers
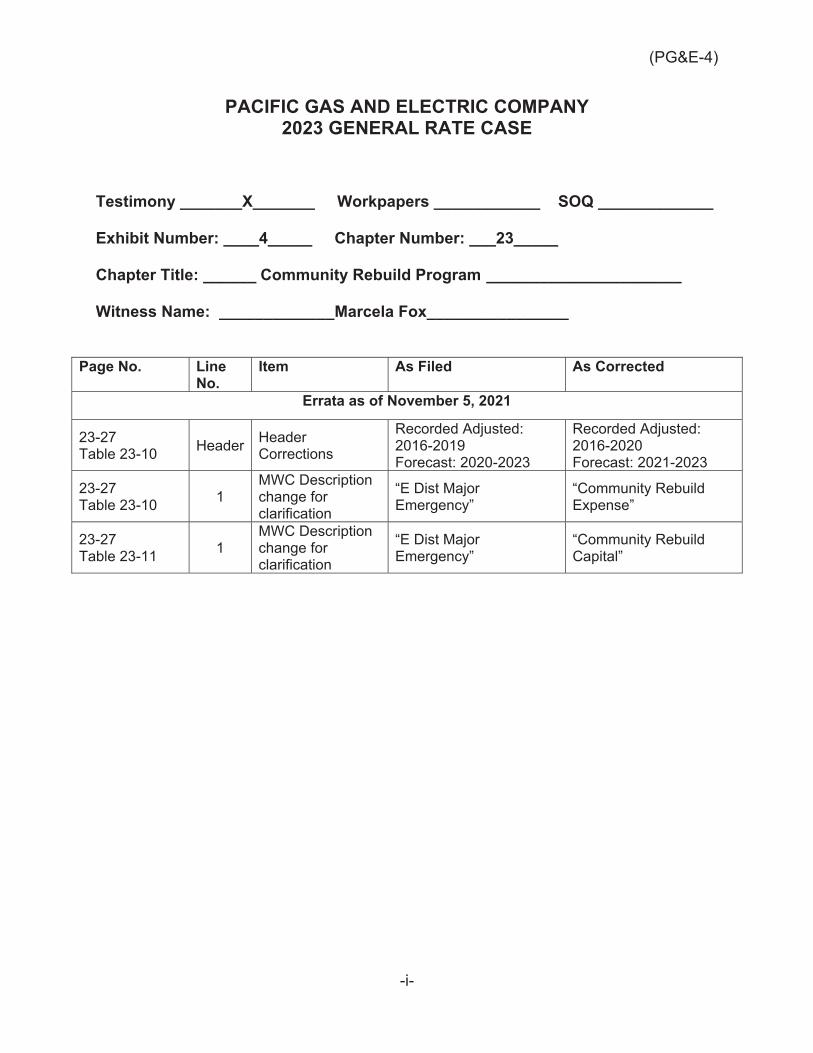
(PG&E-4)
-i-
PACIFIC GAS AND ELECTRIC COMPANY 2023 GENERAL RATE CASE
Testimony _______X_______ Workpapers ____________ SOQ _____________ Exhibit Number: ____4_____ Chapter Number: ___23_____ Chapter Title: ______ Community Rebuild Program ______________________ Witness Name: _____________Marcela Fox________________
Page No. Line No.
Item As Filed As Corrected
Errata as of November 5, 2021
23-27 Table 23-10 Header Header
Corrections
Recorded Adjusted: 2016-2019 Forecast: 2020-2023
Recorded Adjusted: 2016-2020 Forecast: 2021-2023
23-27 Table 23-10 1
MWC Description change for clarification
“E Dist Major Emergency”
“Community Rebuild Expense”
23-27 Table 23-11 1
MWC Description change for clarification
“E Dist Major Emergency”
“Community Rebuild Capital”
(PG&E-4)
PACIFIC GAS AND ELECTRIC COMPANY
APPENDIX A
CONFIDENTIAL COSTS FOR THE ELKHORN BATTERY
ENERGY STORAGE SYSTEM
(PUBLIC)
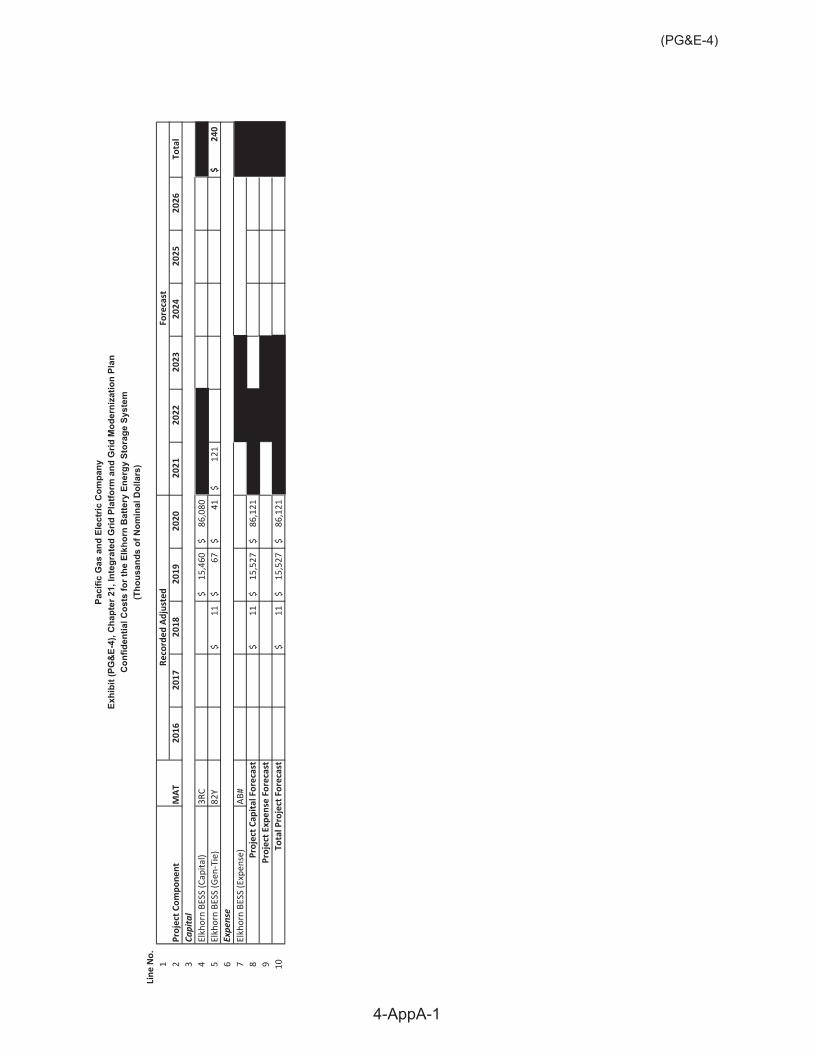
Line
No.
1 220
1620
1720
1820
1920
2020
2120
2220
2320
2420
2520
26To
tal
3 4Elkh
ornBE
SS(Cap
ital)
3RC
15,460
$86
,080
$5
Elkh
ornBE
SS(G
enTie)
82Y
11$
67$
41$
121
$24
0$
6 7Elkh
ornBE
SS(Exp
ense)
AB#
811
$15
,527
$86
,121
$9 10
11$
15,527
$86
,121
$
Con
fiden
tial C
osts
for t
he E
lkho
rn B
atte
ry E
nerg
y St
orag
e Sy
stem
Exhi
bit (
PG&
E-4)
, Cha
pter
21,
Inte
grat
ed G
rid P
latfo
rm a
nd G
rid M
oder
niza
tion
Plan
Paci
fic G
as a
nd E
lect
ric C
ompa
ny
Expe
nse
ProjectC
ompo
nent
MAT
Recorded
Adjusted
Forecast
Capita
l
ProjectC
apita
lForecast
ProjectE
xpen
seFo
recast
TotalP
roject
Forecast
(Tho
usan
ds o
f Nom
inal
Dol
lars
)
4-AppA-1
(PG&E-4)