p tr n - fisheries and oceans · pdf filep tr n prn f th thr trtn d tr cndn atlnt hr ... nl t...
TRANSCRIPT

Not to be cited without Ne pas citer sans
permission of the authors' autorisation des auteurs'
Canadian Atlantic Fisheries Comité scientifique consultatif des
Scientific Advisory Committee péches canadiennes dans l'Atlantique
CAFSAC Research Document 92/6 CSCPCA Document de recherche 92/6
Assessment of the Voisey stock unit Arctic charrpopulation in 1991
by
J. B. DempsonScience Branch
Department of Fisheries and OceansP. 0. Box 5667
St. John's, Newfoundland A1C 5X1
This series documents the scientificbasis for fisheries management advicein Atlantic Canada. As such, itaddresses the issues of the day in thetime frames required and the ResearchDocuments it contains are not intendedas definitive statements on the subjectsaddressed but rather as progress reportson ongoing investigations.
Research Documents are produced in theofficial language in which they areprovided to the Secretariat by theauthor.
Cette série documente les basesscientifiques des conseils de gestiondes péches sur la côte atlantique duCanada. Comme telle, elle couvre lesproblèmes actuels selon les échéanciersvoulus et les Documents de recherchequ'elle contient ne doivent pas êtreconsidérés comme des énoncés finalssur les sujets traités mais plutôtcomme des rapports d'étape sur lesetudes en cours.
Les Documents de recherche sont publiésdans la langue officielle utilisée parles auteurs dans le manuscrit envoyéau secret

2
Abstract
Reported landings of Arctic charr from the Voisey assessment unit totaled11 t in 1991, a decrease of 45% from 1990. Landings have fluctuated between 11and 21 t for the past eight years largely in response to varying levels ofeffort. Standardized catch rates in 1991 were the lowest on record. Catch atage data from the 1991 fishery indicated that the 1981 and 1982 year classeswere the most abundant in the fishery representing 47% of the catch in numbers
of fish. A standardized catch rate, derived using a multiplicative model, wasused in an age disaggregated formulation of ADAPT to estimate fishing mortalityand stock size in 1991. The assessment indicated that fishing mortality on age9+ fish was about 0.32 with an estimated population size of about 571000 fish,about the same as in the past two years, but among the lowest on record.Caution is noted regarding low recruitment estimates in recent years. Theprojected reference level catch for 1992 (F01 = 0.4) suggests a reduction ofthe current TAC by about 20% to 13.4 t.
Résumé
Les debarquements déclarés Womble chevalier provenant de l'united'évaluation de la baie Voisey ont atteint 11 t en 1991,. ce qui représente unediminution de 45 % par rapport a 1990. Les debarquements ont fluctué entre 11et 21 t au cours des huit dernières années, cela principalement a cause d'unniveau variable d'effort. Les taux de prises normalisés de 1991 ont été lesplus bas de tous. Les données sur les prises selon l'áge en 1991 révèlent queles classes d'age de 1981 et 1982 étaient les plus abondantes, représentant47 des prises en nombre de poissons. On a eu recours a tin modéleinultiplicatif pour établir un taux de prise normalisé, que Von a appliqué aune formule de la méthode ADAPT décomposée par age af in d'estimer la inortalitédue a la péche et la grosseur des stocks en 1991. Selon cette estimation, lamortalité due a la péche parnii les poissons de 9 ans et plus était d'environ0,32 et la population se chiffrait approximativement a environ 57 000poissons, soit le méme nombre qu'il y a environ deux ans et le plus basenregistré. Les faibles estimations de recrutement des dernières annéesinspirent la prudence. D'après la projection du niveau de référence desprises de 1992 (F0 - 0,4), ii conviendrait de réduire de 20 Z le TPA actuel,qui serait ramené a 13,4 t.

3
1. Introduction
Arctic charr catch statistics from the Voisey stock unit, made up ofVoisey Bay and Antons subareas (Fig. 1), have been available since 1974. Itwas first assessed as a single unit in 1985 (Dempson and LeDrew 1986). Annuallandings have ranged from 4 to 41 t (mean = 20 t, 1974-91), and from 1977 to1991 have contributed 16% of the commercial catch of charr from the Nainfishing region. In 1991, 20% of the commercial charr catch was taken In theVoisey unit. The recommended Total Allowable Catch (TAC) in 1991 wasmaintained at 17 t; the same value since 1987.
This paper summarizes information from the 1991 fishery and provides anestimate of current stock size derived from a formulation of the adaptiveframework (Gavaris 1988).
2. Trends in catch and effort data - conventional series
Catch and effort data for the Voisey stock unit are summarized in Table 1for the period 1974-91. The highest catch of 41 t occurred in 1979, the lowestcatch of 4 t was in 1975. The TACs listed in Table 1 for 1979 to 1984 appliedonly to the Voisey Bay subarea. The quota area catch in Table 1 summarizes thelandings for from Voisey Bay for those years. Since 1985, the TAC has appliedto the entire stock unit.
Landings in 1991 totaled 11 t; a decrease of 45% from 1990 when the TACwas obtained. Landing have fluctuated between 11 and 21 tfor the past eightyears (Fig. 2) largely in response to varying levels of effort. In 1991,effort decreased by only 13% from 1990, while catch per unit effort (CUE)declined 36% to the lowest value recorded (Table 1).
2.1 Timing of the fishery
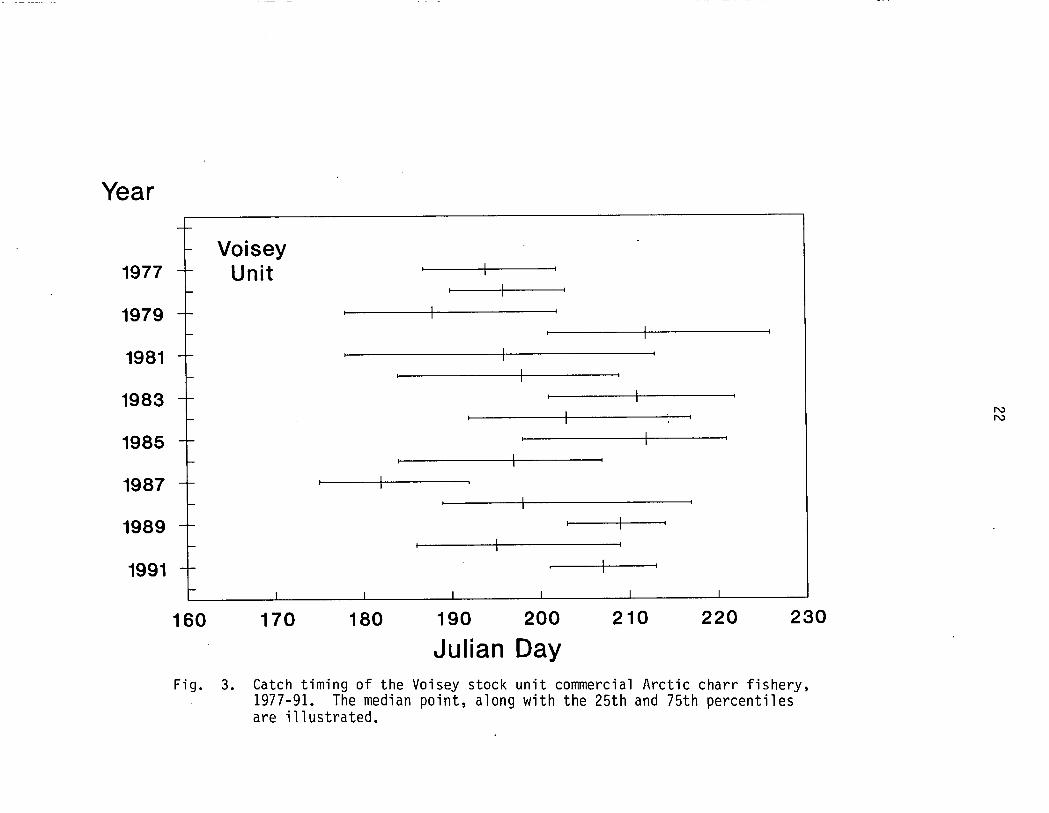
In 1991, severe ice conditions contributed to the disruption of normalfishing activities along much of the northern Labrador coast. In many areas,fisherpersons were delayed or prevented from accessing traditional fishingberths. In the Nain stock unit, mean timing of the 1991 commercial catch wasapproximately three weeks later in comparison with the previous 14 years. Forthe Voisey Unit, the mean timing of the 1991 fishery was about one week laterthan the average for the past 14 years, but the greatest impact was in thecontracted fishery that occurred (Fig. 3). Peak movements of charr out of thebays early in the summer, or return runs back to rivers in mid to late summercould easily be missed with such a short fishery. This may have contributed toreduced catches and catch rates during the past year.
3. Catch and average weights at age
Catch at age data are available since 1977 and are summarized in Table 2.Catch at age, along with the estimated standard error and coefficient ofvariation for the 1991 data are provided in Table 3. The 1981 and 1982 yearclasses (year of hatching) represented by 9 and 10 year old fish in 1991 werethe most abundant representing 47% of the catch (Table 2). These year classes

4
were also the most abundant last year. Mean age of the catch in 1991 was 9.3years and has ranged from 8.2 y in 1979 to 9.3 in both 1990 and 1991. Asummary of the percent at age in the catch is provided in Table 4.
Weights at age were derived from length-weight relationships obtained fromsampling the commercial fishery as explained in past years (Dempson 199k).Gutted head-on weights were converted.to whole weight using the conversionfactor 1.22 (Dempson 1984). A comparison of recorded total landings with thecross product total (sum of the matrix of estimated numbers at age x matrix ofweights at age) agreed quite well with the discrepancy between the two of about0.6% for 1991. Weight at age data are provided in Table 5.
4. Standardization of catch rates
A multiplicative model (Gavaris 1980) was used to account for differencesin catch rates between year and week. The regression of ln catch rate for theperiod 1977 to 1991 was initially fitted using SAS REG procedures (SAS 1985) toavail of the various diagnostics available. Diagnostics included leverageestimates (diagonal elements of the hat matrix) and influence statistics usingthe DFFITS calculation (Freund and Littell 1986; Myers 1986). Cumulativeprobability plots of residuals were used in assessing normality of residuals.Standardized catch rates were obtained using the STANDAR (APL) version of themultiplicative analysis program.
The regression of in catch rate of charr for the 1977-91 period in thismodel explained 48% of the variation (Table 6). Normal probability plotsconfirmed the general log normal distribution of the data (Fig. 4).Observations with high leverage were identified in 1982, 1984 and 1991 (Fig. 4)but appear to have little influence as indicated by the generally well balancedDIFFITS values. Both year and week classification variables were significant(Table 6). A comparison of the standardized and unstandardized catch rates forthe Voisey stock unit is provided in Fig. 5. Standardized catch rates andestimated effort are provided in Table 7. As indicated earlier, the lowestcatch rate recorded was in 1991.
A catch rate index at age was derived using the catch at age along withthe estimated effort obtained from the standardization of commercial catchrates (Table 8).
5. Estimation of stock size
Last year, several formulations of the adaptive framework (Gavaris 1988)were run to estimate population size in 1990. These included age aggregatedand age dissagregated formulations. The ADAPT process is based on establishedmethods for nonlinear parameter estimation. The minimization procedure isapplied to determine a set of parameter values such that the predictedabundance indices by age group are closest to the observed values (furtherdetails provided in CAFSAC 1988 p. 32).
Several age disaggregated formulations were attempted this year.Previously, it had been established that intercepts were not significant andthus were not included in the current analysis. Initially, calibrations were

5
attempted on ages 6 to 12. Results of this run indicated that both the age 6and 7 population numbers were not significant, similar to results obtained lastyear. Additional formulations calibrating on ages 7 to 12 yielded significantresults.
The resulting formulation is as follows:
Parameters:
- Year-class estimates
Ni, 1991 i = 7 to 12
- Calibration coefficients for commercial catch rates
Ki i=7to12
Structure:
- Natural mortality assumed to be 0.2;- Error in catch at age assumed negligible;- Fishing mortality (F) for age groups 13-14 set equal to the weighted F
for age groups 9-12;- Model did not include an intercept.
Input:
Ci,t i = 6 to 14, t = 1977-91C/Ei,t i = 7 to 12, t = 1977-91
Objective function:
- Minimize:
EE(obs(C/Ei,t) - pred(C/Ei,t))2it
Summary:
- Number of observations = 90- Number of parameters = 12
5.1 Assessment Results
Abundances were estimated with coefficients of variation (CV) ranging from0.23 to 0.38 for ages 7 to 12 (Table 9). CVs on the slopes ranged from 0.10 to0.11. The mean square residual was 0.147. Correlations among estimated

6
parameters were generally low (Table 10). Residuals displayed some patterns(Table 9) with positive year effects for 1985, 1989, and 1990, and negativeeffects for 1982, 1987, and 1989.
A summary of estimated population numbers and fishing mortality are givenin Table 11. Fishing mortality in 1991 was estimated to be about 0.32 on 9+fish. Population size estimated for 1991 was low and is influenced by thevirtual absence of age 6 fish; a pattern observed in previous years. As statedabove, however, age 6 was excluded from the calibration process. Using ageometric mean from 1982-89 to estimate age 6 fish in 1991 results in a totalestimated population size of about about 57,000 fish (Fig. 6).
Results of the above formulation suggest that population size during thepast three years has remained somewhat stable, but among the lowest levelsrecorded. Estimates, however, are sensitive to recruitment in the recentyears. Excluding 1991, the results suggest, and caution is advised, thatrecruitment levels during the past few years have declined resulting in overalllower population sizes.
5.2 Retrospective analysis
Variability in recruitment estimates for the terminal year prompted aretrospective examination using the current ADAPT formulation. Theretrospective analysis repeated the current assessment by going back as far as1986. Resulting population sizes are illustrated in Fig. 7. As observed inthe figure,'dramatic differences in the estimated stock size can occur as newinformation is added. The population size in the terminal year is oftenunderestimated, primarily because of the poor estimation of the recruiting yearclass. As mentioned above, this age class is omitted from the ADAPTcalibration process due to lack of fit to the model. The addition of one ormore years of data, however, tend to smooth out the problem.
As in past assessments, and assessments on other Labrador charr stocks(Nain unit), recruitment values in the terminal year are normally derived froman average. Fig. 7 also illustrates the retrospective pattern of populationsizes when average recruitment is used. As expected, there is less variabilityin the estimation of terminal year population sizes, and more consistency asnew information is added. A comparison of population sizes for 1987 and 1988from the current ADAPT run was made with the population size estimated at thattime using the traditional calibration process. The comparison showed thatstock size was overestimated by only 6 to 7.5%.
6. Prognosis
Parameters used for projections of reference level catches were derivedfrom the above ADAPT results and are summarized in Table 12. Weights at agewere averages of 1988-91 data. Natural mortality was assumed to be 0.2 and
was 0.4. Partial recruitment values for the projection were derived fromaveraging fishing mortalities over the period 1982-89. Recruitment for theprojection was based on the geometric mean population numbers for age 6 fish(1982-89).

Results of the projection suggest that the reference level catch for 1992should be reduced from the current iTt TAC by about 20% to 13.4 t.Maintaining the current reference level catch at 17 t would increase fishingmortality to over over 0.52. The suggestion of low recruitment levels inrecent, and possibly subsequent years, is noted.
References
CAFSAC. 1988. Advisory document 88/17. Advice on the management ofgroundfish stocks in 1989.
Dempson, J. B. 1984. Conversion factors for northern Labrador Arctic charrlandings statistics. CAFSAC Res. Doe. 84/6.
Dempson, J. B. 1991. Assessment of the Voisey stock unit Arctic charrpopulation in 1990. CAFSAC Res. Doe. 91/28. 22 p.
Dempson, J. B., and L. J. LeDrev. 1986. Assessment of the Voisey assessmentunit Arctic charr population in 1985. CAFSAC Res. Doe. 86/27.
Freund, R. J. and R. C. Littell. 1986. SAS system for regression. 1986Edition. SAS Institute Inc., Cary, North Carolina. 165 p.
Gavaris, S. 1980. Use of a multiplicative model to estimate catch rate andeffort from commercial data. Can. J. Fish. Aquat. Sci. 37: 2272-2275.
Gavaris, S. 1988. An adaptive framework for the estimation of populationsize. CAFSAC Res. Doe. 88/29. 12 p.
Myers, R. H. 1986. Classical and modern regression with applications.Duxbury Press, Boston, Massachusetts. 359 p.

8
Table 1. Catch (kg) and effort (person-weeks fished) statistics for the Voiseyassessment units from 1974 to 1991. Quota area catch (QAC) refers tothe landings from those subareas specifically under TAC regulationonly, prior to the derivation of assessment units in 1985.
Year TAC1 QAC Catch Effort CUE OffshoreUnit as % of Nain
Region Total
1974 29180 31 24
1975 3727 94 81976 14652 57 257 21 111977 24108 75 321 9 13
1978 36991 102 363 11 17
1979 22500 21880 40590 116 350 47 23
1980 22500 11557 19694 82 240 42 121981 16100 16325 23810 90 265 33 101982 16100 2688 13309 60 222 45 71983 16100 2953 25593 80 320 89 171984 16100 8133 20873 101 207 62 171985 23400 15648 57 275 91 15
1986 23400 16655 82 203 82 171987 17000 21242 101 210 41 22
1988 17000 14037 52 270 60 191989 17000 11019 32 344 100 131990 17000 19895 69 288 64 231991 17000 10971 60 183 26 20
'TAC applied only to Voisey Bay subarea from 1979 to 1984.
IE

9
Table 2. Estimated catch at age from the commercial Arctic charr fisheryin the Voisey stock unit, 1977-91.
CATCH AT AGE
AGE 1977 1978 1979 1930 1981 1982 1983 1984 1985 1986 1987----+---------------------------------------------------------------------------
6 313 619 475 154 68 316 1045 291 1 44 87 2085 4374 4914 303 915 755 2947 2891 1917 851 13123 I 4030 5372 7928 3386 2571 1566 3410 3254 3066 3230 28139 2086 2330 3382 4140 4803 2346 3449 2238 3242 :3888 4420
10 1237 1236 1163 1424 2359 1226 1611 1392 433 1400 202911 I 600 1141 634 500 941 657 2.084 753 324 686 96612 I 389 380 212 238 406 65 827 414 233 244 28013 1 212 380 159 159 41 13 147 355 64 149 3814 1 108 334 55 28 19 27 45 83 55 123 57----+---------------------------------------------------------------------------
6+ 1 11065 16166 18922 10832 12123 6971 14565 11671 9335 10615 119237+ 1 10747 15547 18447 10673 12055 6655 13520 11380 9334 10571 11915
AGE 1938 1989 1990 1991-------------------------
5 i 140 68 17 971 1638 911 1110 909S 2319 1445 2865 10479 I 1465 1520 2945 1625
10 1440 1135 1827 125711 771 702 1083 69112 1 289 245 588 36213 28 107 440 15514 43 183 136 89----+-------------------------
6+ 1 8133 6316 11011 61447+ 1 7993 6248 10994 6135

10
Table 3. Summary of the catch at age in 1991 with an estimate of thestandard. error and coefficient of variation (C.V.) for theVoisey stock unit.
Age Catch at age Standard error C.V. (Z)
6 9 6.1 67.67 909 106.1 11.78 1047 123.1 11.89 1625 142.0 8.7
10 1257 132.2 10.511 691 96.3 13.912 362 70.9 19.613 155 44.6 28.814 89 33.8 38.0

11
Table 4. Summary of the percent at age in-the commercial catch of Arcticcharr from the Voisey stock unit, 1977-91.
PERCENT AT AGE FOR THE VOISEY STOCK UNIT
I 1977 1978 1979 1980----------------------------6 1 2.9 3.8 2.5 1.47 I 18.8 27.1 26.0 7.48 j 36.4 33.2 41.9 31.39 I 18.9 14.4 17.9 38.2
10 I 11.2 7.6 6.1 13.111 I 5.4 7.1 3.4 4.612 I 3.5 2.4 1.1 2.213 I 1.9 2.4 0.8 1.514 I 1.0 2.1 0.3 0.3
1981 1982 1983 1984 1985 1986 1987 1988
0.6 4.5 7.2 2.5 0.0 0.4 0.1 1.77.5 10.8 20.2 24.8 20.5 8.0 11.0 20.1
21.2 22.5 23.4 27.9 32.8 30.4 23.6 28.539.6 33.7 23.7 19.2 34.7 36.6 37.1 18.019.5 17.6 11.1 11.9 4.6 13.2 17.0 17.77.8 9.4 7.4 6.5 3.5 6.5 8.1 9.53.3 0.9 5.7 3.5 2.5 2.3 2.3 3.60.3 0.2 1.0 3.0 0.7 1.4 0.3 0.30.2 0.4 0.3 0.7 0.6 1.2 0.5 0.5
I 1989------I. ------
6 I 1.17 I 14.4
IQ I
9 I 24.110 I 18.011 I 11.112 I 3.913 I 1.714 I 2.9
1390 1991
0.2 0.110.1 14.826.0 17.026.7 26.416.6 20.59.8 11.25.3 5.94.0 2.51.2 1.4

12
Table 5. Average weight at age (kg-round) from the commercial Arcticcharr fishery, Vosiey stock unit, 1977-91.
AVERAGE WEIGHT AT AGE
AGE 1 1977 1978 1979 1980 1981----+------------------------------6 1.53 1.53 1.53 1.03 0.937 1.77 1.77 1.77 1.24 1.268 I 2.07 2.07 2.07 1.60 1.779 I 2.60 2.60 2.60 1.89 2.04
10 I 2.78 2.78 2.78 2.19 2.1711 1 2.94 2.94 2.94 2.42 2.3012 1 3.24 3.24 3.24 2.49 2.3713 1 2.60 2.60 2.60 2.70 3.3614 I 2.76 2.76 2.76 3.73 2.76
AGE I 1989 1990 1991----.- ------------------6 1 1.27 1.12 1.117 I 1.43 1.48 1.478 I 1.68 1.70 1.649 I 1.79 1.83 1.79
10 I 1.95 1.94 1.8411 I 2.06 2.01 2.0112 I 1.90 1.92 2.113 2.04 1.90 2.0114 1.90 2.29 2.15
1982 1983 1984 1985 1986 1987 1988
1.20 1.33 1.25 1.05 1.07 1.03 1.231.46 1.54 1.53 1.39 1.21 1.41. 1.501.70 1.64 1.71 1.62 1.44 1.73 1.692.02 1.89 1.93 '1.77 1.64 1.80 1.782.20 2.04 2.06 1.98 1.72 1.95 1.892.49 2.18 2.14 1.99 1.90 2.02 1.982.33 2.10 2.32 2.18 1.90 1.92 1.882.83 2.20 1.91 2.26 1.97 2.31 2.233.42 2.55 1.82 2.26 1.45 1.58 1.45
MEAN AGE OF INDIVIDUALS IN CATCH
AGE 11 1977 1978 1979 1980 1981 1982 1983 1984 1985 1986 1987 1988----+------------------------------------------------------------------------
I 2.62 8.50 2.20 8.86 9.09 8.84 8.63 8.66 8.51 3.97 8.92 8.77
AGE I 1989 1990 1991
9.18 9.28 9.31
MEAN WEIGHT OF INDIVIDUALS IN CATCH
AGE1 1977 1978 1979 1980 1981 1982 1983 1984 1985 1986 1987 1988----+------------------------------------------------------------------------
2.28 2.21 2.17 1.83 1.98 1.94 1.78 1.79 1.68 1.58 1.79 1.73
AGE I 1939 1990 1991----±------------------
1.78 1.81 1.77

Table 6.. Results of the analysis of variance of log transformed catch rates from the Voiseystock unit, 1977-91.
GENERAL LINEAR MODELS PROCEDURE
DEPENDENT VARIABLE: CUE
SOURCE DF SUM OF SQUARES MEAN SQUARE F VALUE PR > F a-SQUARE C.V.
MODEL 24 14.77779945 0.61574164 3.89 0.0001 0.477910 7.2537
ERROR 102 16.14390046 0.15827353 ROOT uSE CUE MEAN
CORRECTED TOTAL 126 30.92169991 0.39783606 5.48456548
SOURCE OF TYPE I SS F VALUE PR > F DF TYPE III SS F VALUE PR ) F
IVWK
1410
8.222096066.55570338
3.71 0.0001
4.14 0.00011410
5.916181026.55570338
2.674.14
0.00230.0001
PARAMETER ESTIMATES
PARAMETER STANDARD T FOR 00:VARIABLE DF ESTIMATE ERROR PARAN!PER-0 PROD ) IT!
INTERCEP 1 5.67894421 0.17266160 32.891 0.00011176 1 0.20171088 0.19388653 1.040 0.30061179 1 0.24769399 0.19445667 1.275 0.20531180 1 -0.0126246 0.20017556 -0.064 0.94901181 1 10.0219671 0.19019559 -0.115 0.90831162 1 -0.391577 0.19642766 -1.993 0.04691163 1 0.36543103 0.20782234 1.758 0.06171164 1 -0.132252 0.19066136 -0.693 0.46991165 1 0.10729602 0.19366653 0.553 0.56121166 1 -0.205329 0.19019559 -1.080 0.26291167 1 -0.151795 0.21673477 -0.694 0.46931188 1 -0.0286212 0.19019559 -0.150 0.68071169 1 0.19265331 0.21605627 0.692 0.37471190 1 0.06763313 0.20647681 0.424 0.67221191 1 -0.46912 0.19642766 -2.388 0.0166WK25 1 0.10000191 0.21554098 0.464 0.6437W926 1 -0.353662 0.16264521 -2.174 0.0320WK27 1 -0.252579 0.15129331 -1.669 0.0981WK28 1 -0.16463 0.15124652 -1.222 0.2245wK29 1 -0.0762424 0.14627966 -0.514 0.6062WK30 1 0.04574516 0.14621966 0.309 0.7583WE32 1 0.04392565 0.15036790 0.292 0.1706WK33 1 -0.20927 0.15744275 -1.329 0.1666W934 1 -0.707512 0.16659550 -4.247 0.0001WK35 1 -0.613801 0.26296319 -3.094 0.0025
c.)

14
Table 7. Commercial catch rate index for the Voisey stock unit, 1977-91.
StandardizedYear catch rate Standard error Effort
1977 312 54 771978 382 64 971979 400 67 1011980 308 53 641981 306 50 781982 211 35 631983 449 81 571984 274 45 761985 348 58 451986 255 41 651987 267 53 801988 304 49 461989 377 71 291990 340 61 581991 195 33 56

1986 1987 1988
0.7 0.1 3.013.1 16.4 :35.64E.7 35.2 50.459.8 55.3 31.821.5 25.4 31.310.6 12.1 16.83.8 3.5 6.32.3 0.5 0.61.9 0.7 0.9
15
Table 8. Catch rate index at age for the Voisey stock unit, 1977-91.
VOISEY STOCK UNIT CATCH RATE AT AGE INDEX
I 1977 1978 1979 1980 1981 1982 1983 1984 1985---+-------------------------------------------------------
6 I 4.1 6.4 4.7 2.4 0.9 5.0 18.3 3.8 0.07 I 27.1 45.1 48.7 12.5 11.7 12.0 51.7 38.0 42.6B I 52.3 55.4 78.5 52.9 33.0 24.9 59.8 42.8 68.19 1 27.1 24.0 33.5 64.7 61.6 37.2 60.5 29.4 72.0
10 I 16.1 12.7 11.5 22.2 30.2 19.5 28.3 18.3 9.611 1 7.8 11.8 6.3 7.8 12.1 10.4 19.0 9.9 7.212 I 5.1 3.9 2.1 3.7 5.2 1.0 14.5 5.4 5.213 I 2.8 3.9 1.6 2.5 0.5 0.2 2.6 4.7 1.414 I 1.4 3.4 0.5 0.4 0.2 0.4 0.8 1.1 1.2
I 1989 1990 1991-- -+------------------
6 1 2.3 0.3 0.27 1 31.4 19.1 16.28 I 49.3 49.4 18.79 I 52.4 50.8 29.0
10 I 39.1 31.5 22.411 1 24.2 18.7 12.312 I 8.4 10.1 6.513 1 3.7 7.6 2.814 1 6.3 2.3 1.6

16
Table 9. Parameter estimates and residuals from ADAPT for the Voiseystock unit, ages 7-12, 1977-91.
ESTIMATED PARAMETERS AND STAHI'AF:E' ERRORSAPPROXIMATE STATISTICS ASSUMING LINEARITY NEAR SOLUTION
ORTHOGONALITY OFFSET,,,,,,,,, 0.019720MEAN SQUARE RESIDUALS ,,,..., 0.146783
AGE PARAMETER ESTIMATE STD, ERF:, T-STATISTIC C.V.
7 ABUNDANCE 1,17152E4 4,44297E3 2,63679E0 0.388 ABUNDANCE 7,06945E3 1.94485E3 3,63495E0 0.289 ABUNDANCE 7.76181E3 1.83955E3 4.21941E0 0.24
10 ABUNDANCE 5.19551E3 1,22011E3 4,25823E0 0.2311 ABUNDANCE 2.09245E3 5,02061E2 4.16773E0 0.2412 ABUNDANCE 1,14280E3 2.83615E2 4,02940E0 0,257 RV SLOPE 1,60655E3 1,70961E4 9.39720E0 04118 RV SLOPE 4,36605E3 4.53826E4 9,62053E0 0.109 RV SLOPE 7.40449E3 7.68217E4 9,63853E0 0.10
10 RV SLOPE 7.33830E3 7,64984E4 9.59275E0 0.1011 RV SLOPE 8,83085E3 9,28480E4 9,51108E0 0.1112 RV SLOPE 7,90422E3 8.31103E4 9,51052E0 0.11
LOG RESIDUALS FOR ABUNDANCE INDEX
I 1977 1978 1979 1980 1981 1982 1983 1984 1985 1986---+ ----------------------------------------------------------------------7 I 0.105 0.009 0.370 0.533 0.512 0.625 0.614 0,179 0.326 0.4908 I 0.343 0.097 0.078 0.103 0,197 0.434 0.394 0.147 0.148 0.1489 I 0.120 0.254 0.202 0.036 0.189 0,042 0.587 0,241 0,445 0.055
10 I 0.184 0.097 0.208 0.176 0.014 0.229 0.428 0,364 0.861 0.07811 I 0.206 0.305 0.066 0.008 0.308 0.597 0.269 0.060 0.042 0.51312 I 0.236 0.105 0.248 0.554 0.834 1.320 0,595 0.071 0.311 0.222
1987 1988 1989 1990 1991---+ ------------------------------------7 I 0.260 0.360 0.309 0.360 0.0008 I 0.115 0.240 0.013 0.138 0.3079 I 0,062 0.256 0,210 0.024 0,446
10 I 0.072 0.222 0,458 0.335 0,26711 I 0.112 0.000 0.374 0.212 0.06812 I 1.021 0.045 04066 0.305 0,010
SUM OF INDEX 1 RESIDUALS : 0.0001445195 MEAN RESIDUAL : 0,0000016058

17
Table 10. Parameter correlation matrix for the Voisey stock unitADAPT run caltithrated using ages 7-12, 1977-91.
PARAMETER CORRELATION MATRIX10
1 2 3 4 5 6 7 8 9
0.040 0.033 0.024-------------------------------------------------------------0.019 0.268 0.022 0.017 0.015
1 I 1.000 0.0511.000 0.060 0.048 0.035 0.028 0.190 0.213 0.025 0,022
2 I 0.0511.000 0.027 0,046 0,060 0.150 0,173 0.217 0,065
3 I 0,0400.033
0.0600.048 0.027 1,000 0.066 0,073 0.122 -0,134 0.171 0.242
0,1844 IS I 0.024 0.035 0.046 0.066 1,000 0,082 0.088
0.0700.1010,081
0.1280.104 0.133
6 I 0.019 0.028 0.060 0.073 0.0820,088
1.0000.070 1.000 0.084 0.063 0.055
7 I 0.268 0.190 0.150 0.1220.134 0.101 0,081 0.084 1,000 0.072 0.062
8 I 0.022 0.213 0.1730.217 0.171 0.128 0.104 0.063 0,072 1.000 0,079
9 I 0.017 0.0250.065 0.242 0.184 0.133 0.055 0.062 0.079 1,000
10 Iii I
0.0150,014
0.0220.021 0.092 0.101 0.275 0.193 0.053 0.060 0.076
0.0800,0900.084
12 I 0.015 0.022 0.130 0.139 0.119 0.286 0,056 0.063
I 11 12----------
1 I 0.014 0.0152 I 0.021 0,0223 I 0.092 0.1304 I 0.101 0.1395 I 0.275 0,1196 I 0,193 0.2867 I 0.053 0.056B I 0.060 0.0639 I 0.076 0.080
10 I 0.090 0.08411 I 1.000 0.09512 1 0.095 1,000

18
Table 11 Estimated population numbers and fishing mortality fromADAPT for the Voisey stock unit, calibrated using ages 7-12,1977-91.
POPUL4TIO1. NUMBERSI 1977 1978 1979 1980 1981 1982 1983 1 984 9851 1 986---+ ----------------------------------------------------------------------
6 I 40971 32422 19036 17243 19404 25936 29910 27496 18544 188337 I 21883 33257 25985 15156 13978 15825 20948 23542 22249 151828 I 11885 16029 23270 16828 11682 10616 12273 14484 16659 16481910
I 5853 6084 8263 11879 10714 7238I 7275 6963 8915 1086511
3670 2905 2873 3705 5979 4426 3803 2835 3676 436512
I 1574 1885 1260 1300 1745 2761 2514 1656 1062 261813
I 1135 746 511 458 612 577I 1111 577 2671666 1078 674 576
14
227 160 134I 314 718 129 75 42
414 616 508 34194
--------------------------------------------------------------------98 206 183 3 58
6+1 88396 94623 81594 66869 64314 67605 78900 78877 72469 69619I 1987 1988 1989 1990 1991
---------------------------------------6 I 22017 20166 12071 14283 10557 I 15380 18019 16384 9821 116788 I 11660 11405 13270 12590 70379 I 10571 7001 7239 9557 7715
10 I 5378 4656 4406 4552 516011 I 2307 2567 2509 2580 207312 I 1522 1015 1404 1419 113313 I 251 993 569 928 62914 I 145 171 788 369 361---+-----------------------------------6+1 69230 65991 58640 56099 36843
FISHING MORTALITYI 1977 1978 1979 1980 1981 1982 1983 1 984 9851 9861 1 987---+-----------------------------------------------------------------------
6 I7
0.009 0.021 0.028 0.010 0.004 0.014 0,039 0.012 0.000 0.003 0.000I8 I
0.111 0.157 0.234 0.060 0.075 0.054 0.169 0.146 0.100 0.064 0.0999 I
0.470 0.463 0.472 0.252 0.279 0,178 0.367 0.285 0.227 0.244 0.31010 I
0.501 0.550 0.602 0.486 0.684 0.444 0.7420.466 0.439 0.514 0.503 0.620
11 10.635 0.593 0.553 0.573 0.365 0.631
0.547 0.782 0.139 0.438 0.54012 I
1.105 0.812 0.554 0.906 0.305 0.6470.476 0.828 0.613 0.854
0.698 0.411 0.342 0.62113 I
1.322 0.133 0.7950.237 1.302 1.074 1.492 0.334 0.114 0.499
0.553 0.481 0.631 0.22714 I 0.472 0.708 0.630 0.528 0,687 0.381 0.699
1.0140.582
0.1500.400
0.6580.472
0.1830.563
I 1988 1989 1990 1991--------------------
6 1 0.008 0.006 0.001 0.0097 I 0.106 0.063 0.133 0.0908 I 0.255 0.128 0.290 0.1799 I 0.263 0.264 0.416 0.263
10 I 0.418 0.335 0.586 0.31111 I 0.403 0.370 0.623 0.45412 I 0.378 0.214 0.613 0.43113 I 0.032 0.233 0.743 0.31514 1 0.323 0.294 0.516 0.315

19
Table 12. Parameters used as input for catch projections of Voisey stock unitArctic charr.
Age Mean weight (kg.)Age disaggregated
Population numbers 1991 PR
6 1.21 21142 0.021
7 1.47 11678 0.241
8 1.68 7037 0.602
9 1.80 7715 0.895
10 1.91 5160 1.0
11 2.02 2073 1.012 1.94 1133 1.013 2.05 629 1.0
14 1.95 361 1.0

20
58°
57°
63° 62° 610
"SAGLEK
9 'THE DOMES
i HEBRON
NAPARTOK
\MUGFORD
OKAK -.NA. I
.- iCUTTHROAT_/1J
TASIUYAK—_,!'\/
%KIGLAPAITS
'fl) !
IWEBB BAY BLACK ISLAND
TIKKOATOXAK—_..•.
RIVER
ING ISLANDANAKTALIK....•
iso
RO
560
/
C
LABRADOR
56°
- r *— — --
r!G\ ANIONS• :/W
:.VOISEY •-'• :• •
fob db
0 25
:•
25
SCALE I km)I ' S
630 629 610
Figure 1. Geographical separation of the Nain Fishing Regionsubareas.

Landings (tonnes)50 50
Voisey Unit Landings
40——TAC 40
10- 10
1974 1976 1978 1980 1982 1984 1986 1988 1990 1992
Year
Fig. 2. Summary of Arctic charr landings from the Voisey stock unit in relation to the TAC.
Ni
Year
- Voisey1977 - - Unit
1979
1981
1983 - N)
1985 -
1987 --
1989 --
1991
160 170 180 190 200 210 220 230
Julian DayFig. 3. Catch timing of the Voisey stock unit commercial Arctic charr fishery,
1977-91. The median point, along with the 25th and 75th percentilesare illustrated.

RE$I00UAL.S
00
00 0 0
00
00 0
o o 0 00 B
00
8 ° 0
n H 80 0 8 0 H 0 0 u B
0 0 Q 0o 0
o 0 g 0 00 0 13 B 0 0
00
000
00
0
-21 I76 77 78 79 80 81 82 83 84 85 86 87 88 89 90 91 92
YEAR
1
00 0
• 0
0 00 0 0
0
0 00000 c9 oo
0 0 ,. °q° ctp°00
0 0 u 0p
0 00 00°0
0
000000 0
0 0 0 0
0
00
-1
-3
-2 -1 0 1 2 3 4 5 6
RANKED RESIDUAL PREDICTED
Fig. 4. Residual plots and influence diagnostics fot the Voisey stock unit catch rate series,• 1977-91.
2
1
D
10-1
0.60
0.55
0.50
0.45
LEV 0.40
ERA 0.35CE
0.30
0.25
0.20
0.15
76 77 78 79 80 81 82 83 84 85 86 87 88 89 90 91 92
YEAR
1
RE5
DOUALS.
-1
N.)(A)
7

Catch per unit effort (kg)500
Voisey Unit
400-
300- N.)
200-Unstandardized
—El— Standardized
100 ' I.' I I I I
1976 1978 1980 1982 1984 1986 1988 1990 1992
Year
C
Fig. 5. Comparison of standardized and unstandardized commercial catch rates for the Voiseystock unit, 1977-91.

25
Numbers of fish (thousands)110
90
70
50
OU
1976 1978 1980 1982 1984 1986 1988 1990 1992
Year
Fishing Mortality (9+)11.
0.8
0.6
0.4
0.2
01 1 1 1 1I1 1 1I1 1 1 1 I
1976 1978 1980 1982 1984 1986 1988 1990 1992
Year
Fig. 6. Estimated population numbers and fishing mortality'from the Voisey stock unit Arctic charr population,1977-91.

26
Numbers of fish (thousands)110
90
70
50
301 1 I I I I I
1976 1978 1980 1982 1984 1986 1988 1990 1992
Year
Numbers of fish (thousands)110
Voisey Stock Unit
90
70
50
1976 1978 1980 1982 1984 1986 1988 1990 1992
Year
Fig. 7. Comparison of the Voisey stock unit population numbersderived through retrospective ADAPT runs from 1977-86to 1977-91. Lower figure illustrates populationnumbers when a correction for recruitment (mean) isused in the terminal year.