p a g e 1 - kolmetz.comkolmetz.com/pdf/ep/engineering_practice_2016_07.pdf · p a g e 1 vision to...
TRANSCRIPT


P A G E 1
VISION
To become a globally recognized association for certification of professional engineers.
WWW.IACPE.COM | [email protected]
KNOWLEDGE. CERTIFICATION. NETWORKING
MISSION Based on engineering first principles and practical real world applications our curricu-
lum has been vetted by academic and industry professionals. Through rigorous study
and examination, candidates are able to prove their knowledge and experience. This
body of certified professionals engineers will become a network of industry profes-
sionals leading continuous improvement and education with improved ethics.
ABOUT
International Association of Certified Practicing Engineers provides a standard of pro-
fessional competence and ethics. Identifies and recognizes those individuals that have
meet the standard. And requires our members to participate in continuing education
programs for personal and professional development.
In additional to insuring a professional level of competency and ethics the IACPE fo-
cuses on three major areas of development for our members: Personal, Professional,
and Networking.
HISTORY
The International Association of ertified Practicing Engineers concept was ormulat-
ed by he any oung professionals and students e eet during our careers
working n the field, running training courses, and lecturing at universities.
During question and answer sessions we found the single most common question
was: What else can I do to further my career?
We found, depending on the persons avail able time and finances, and very often de-
pendent on the country in which the person was from, the options to further ones
career were not equal.
Many times we found the options available to our tudents in developing countries
oo costly and or provided too little of value in an expanding global business
The reality is that most of our founders come from countries that require rigor-
ous academic standards at four year universities in order to achieve an engineering
degree. Then, after obtaining this degree, they complete even stricter government
and state examinations to obtain their professional censes in order to join profes-
sional organizations. They have been fforded he opportunity o continue heir
personal and professional development with many affordable schools, programs, and
professional organizations. The IACPE did not see those same opportunities for every-
one in every country.
So we set out to design and build an association dedicated to supporting those engi-
neers in developing in emerging economies.
The IACPE took input from industry leaders, academic professors, and students
from Indonesia, Malaysia, and the Philippines. The goal was to build an organiza-
tion that would validate a candidates engineering fundamentals, prove their
individuals skills, and enhance their networking ability. We wanted to do this
in a way that was cost effective, time conscience, and utilized the latest technologies.

P A G E 2
LETTER FROM THE PRESIDENT
KARL KOLMETZ
Dear Friends,
I hope you are doing great. There are many people that attempt to predict the future. Science Fiction
writers have been amazingly accurate. Financial analysts have not been as successful. How are you going
to predict your future?
One way to predict your future is to create it.
One of the best methods to create your future comes from entrepreneurs: those people who have creat-
ed two or more successful businesses. In the face of an unknown, unpredictable future, these entrepre-
neurs act specifically, they:
Figure out what they want in their life
Take a small step toward making it reality this year
Pause to think about what they learned from taking that step.
Build that learning into their next step
In other words, the best way to create the future is to: Act. Learn. Build. Repeat.
Figure out what you want in your life.
Make a long term plan to be happy, healthy, have a good family and be financially stable. If you cannot
make a good 20 year plan; make a five-year plan. You will need to readjust your five-year plan as you get
older and your situation changes.
Take a small step toward making it reality this year - Act.
Make plans for this year to accomplish your five-year goals. Accomplish this year’s goals.
Pause to think about what you learned from taking that step - Learn.
Learn the lessons from the one-year plan – sometimes this can be a hard lesson, but be honest to your-
self.
Build that learning into your next step - Build.
Take the hard honest lessons and adjust your one and five-year goals If that means adjusting from the ini-
tial path, so be it.
Repeat.
Repeat the process yearly.
We believe that the best way to assure your future, is to create it even in this uncertain changing world.
There are many ways to assure your future. Most people state the same items when asked: work hard,
be honest, gain knowledge, certify your knowledge and build a network.
We also believe that IACPE is a great way to create your future.
All the best in your career and life,
Karl


P A G E 4
INDUSTRY NEWS CB&I awarded license and engineering design for alkylation
technology in Indonesia
CB&I has been awarded the license and engineering design of a grassroots
alkylation unit by PT Pertamina (Persero). The unit will use CB&I’s ad-
vanced sulfuric acid alkylation technology and Haldor Topsoe’s WSA
(Wet gas Sulfuric Acid) technology as part of the upgrade of Pertamina’s Refinery Unit V in Balikpapan, East Kaliman-
tan, Indonesia.
Amec Foster Wheeler wins Indonesian refinery upgrade contract
Amec Foster Wheeler has been awarded an engineering and project management services contract by PT Pertamina
(Persero) and Saudi Aramco for the upgrade and expansion of the 348 Mbpd Cilacap Refinery in Central Java.
The upgrade and expansion project is intended to increase the capacity of the refinery to 370 Mbpd, maximize pro-
duction of cleaner gasoline and diesel, produce higher quality base oils for the domestic market, and expand aromat-
ics and polypropylene production to more than 600 Mtpy and 160 Mtpy, respectively.
Indonesia's Pertamina to appoint Shell to process Iraq crude
Indonesia's Pertamina has selected Shell to process one million barrels per month of crude from Iraq at a Singapore
refinery, a senior official at the state owned company said on Wednesday.
"We've selected Shell because they are the most competitive," said Daniel Purba, the senior vice president of Per-
tamina's Integrated Supply Chain unit.
Thailand's PTT delays building of Vietnam petrochemical com-
plex
Thailand's largest energy company PTT Plc has postponed plans to build a
$20 B refinery and petrochemical complex in Vietnam, it said on Tuesday,
citing uncertainty in global oil markets.
PTT has studied the possibility of investing in central Vietnam for more
than four years and had aimed to start construction this year in partnership
with Saudi Aramco, the world's biggest oil producer.
Petron Malaysia says no supply disruption from Port Dickson fire
Petron Malaysia reported a fire broke out at its Port Dickson oil refinery
on Friday 24th June, but there were no injuries or supply disruptions. The
fire started at 21:00 local time (13:00 GMT) and was put out two hours later.
Petron Malaysia said it was assessing the damage and investigating the cause of the fire at the refinery, which has a
capacity of 88,000 bbpd.
Axiall and Lotte Chemical break ground on its grassroots ethane
cracker
LACC LLC, the joint-venture company formed by Axiall Corp. and Lotte
Chemical Corp., held a groundbreaking ceremony at its Calcasieu Parish, La. construction site.
This follows a December 2015 announcement that the boards of Lotte and Axiall reached final investment decisions
to construct an ethane cracker facility adjacent to Axiall’s existing Lake Charles complex. In addition to constructing
the ethane cracker that is expected to produce 1 MMtpy of ethylene, Lotte Chemical will also construct an adjacent
plant to produce 700 Mtpy of ethylene glycol.
Schneider Electric implements SimSci Spiral Suite at SK Innova-
tion site
SK Innovation, South Korea’s largest refining and petrochemicals compa-
ny, has successfully implemented Schneider Electric’s SimSci Spiral Suite
software solution for unified supply chain optimization, planning and crude
knowledge management.
The suite’s unified enterprise supply chain solution has successfully been
implemented to replace the installed legacy system. SK Innovation’s assay
specialists, process engineers and planners from multiple sites can now
collaborate to optimize plans, manage business and ultimately increase
performance across their enterprise.

P A G E 5
NEWS Career Guidelines Seminar at W.R Supratman University in Surabaya, Indonesia
In July 2016 the IACPE
held a seminar titled Ca-
reer Guidelines conduct
by IACPE’s President Karl Kolmetz,
CPE at W.R Supratman University in
Surabaya, Indonesia. There were over
150 students, along with the president,
lectures and alumni attending the semi-
nar.
In July IACPE sponsored the 2016 International Conference on Physics and Mechanics of New Materials
and their Applications hosted by Universitas 17 Agustus 1945 in Surabaya, Indonesia. IACPE sent Guide-
lines for Reducing Corrosion under Insulation and it’s Safety Consequences authors IACPE President Karl
Kolmetz, M.Salem Abdul Ajes and Reni Mutiara Sari. PHENMA 2016 held at the Hotel ELMI.
PHENMA 2016

P A G E 6
Fluid Flow Fundamentals
INTRODUCTION Understanding the fundamentals of fluid flow is critical when designing equipment. Most equipment has internal fluid flows, includ-
ing pumps, compressors, control valves, relief valves, distillation columns, reactors, and pipelines. The equipment may have vapor,
liquids and sometime both vapor and liquids.
The understanding of how gasses and liquids flow in equipment is the foundation of equipment design. The principles of single
phase fluid flow are not complex, but neither are they simple due to the interdependence of pressure drop and friction. The
principles of two phase flow are complex and well as the principles of hydraulic surge.
One of the best ways to understand single phase fluid flow fundamentals is to study the principles of pipe sizing. Piping accounts
for as much as one-third of the total plant cost. Pumping energy cost is directly related to the design of the piping and hydraulic
systems.
Fluid Physical Properties Liquid Density
The density of a liquid is the weight of a unit volume at the
temperature during measurement, and is may be ex-
pressed in lb/ft3. For example, the density of water is: ⍴60w
= 62.37 lb/ft3 at 60°F.
For a hydrocarbon sometimes the API Gravity is utilized
Pressure has no practical effect on liquid density.
However, increasing temperatures will cause liquids to
expand. Process flowrates may be given at a basic 60°F
temperature, coupled with an expansion factor at points
where the temperature changes in a pipe system.
This expansionfactor is:
E = ⍴60/⍴,
where ⍴ is the density at flowing temperature. Hence, the
volume flowrate, Q in gpm, at temperature will be:Q =
Q60E where Q60 is volumeflowrate at 60°F.Piping-design
calculations should be made at flowing temperatures. In
addition, alternative conditions (for example, at a cold
startup) should also be investigated.
Specific Volume
Specific volume, Ṽ; is the reciprocal of density Ṽ, =1/ρ, ft3/lb.Specific gravity at standard temperature relates thedensity of any liquid at 60°F to that of water at 60°F:
A relation more often used gives the specific gravity of the
liquid at flowing temperature, S, from:
where ⍴ is the density of liquid at fl.owing temperature. If
S> 1,the liquid is heavier than water at 60°F; and if S< 1,
the liquid is lighter than water.
Vapor and Gas Density
A convenient equation for calculating vapor or gas
densities is derived from the well-known gas law:
where:
Pis absolute pressure, lb/ft2; Ṽ is specific volume, ft3/lb; T
is temperature, °R; R is the universal gas constant, (ft)(lb)/
(lb)(°R); and z is a correction factor accounting for the
nonideal behavior of a gas (usually, z = 1).
Since R = 1,544/M, whereMis the molecular weight; P=
144P', where P'is the absolute pressure, psia; and Ṽ= 1/⍴,
ft3/lb, the gas law can be rewritten as:
From equation above, we can now find an expression. for
gas density, ⍴, as:
As the equation above shows, gas densities depend on
pressure and temperature; Hence, for purposes of
API
FFS.deg5.131
5.14160/60
KLM Technology Group is a technical
consultancy group, providing
specialized services and training to
improve process plant operational
efficiency, profitability and safety.
We provide engineering solutions by offering training, technical services,
process safety management consult-ing, HAZOP facilitation, best practices, specialized equipment and engineering designs to meet the specific needs of our partner clients. Since 1997, KLM Technology Group has been providing engineering, opera-tions, and maintenance support for the hydrocarbon processing industry.
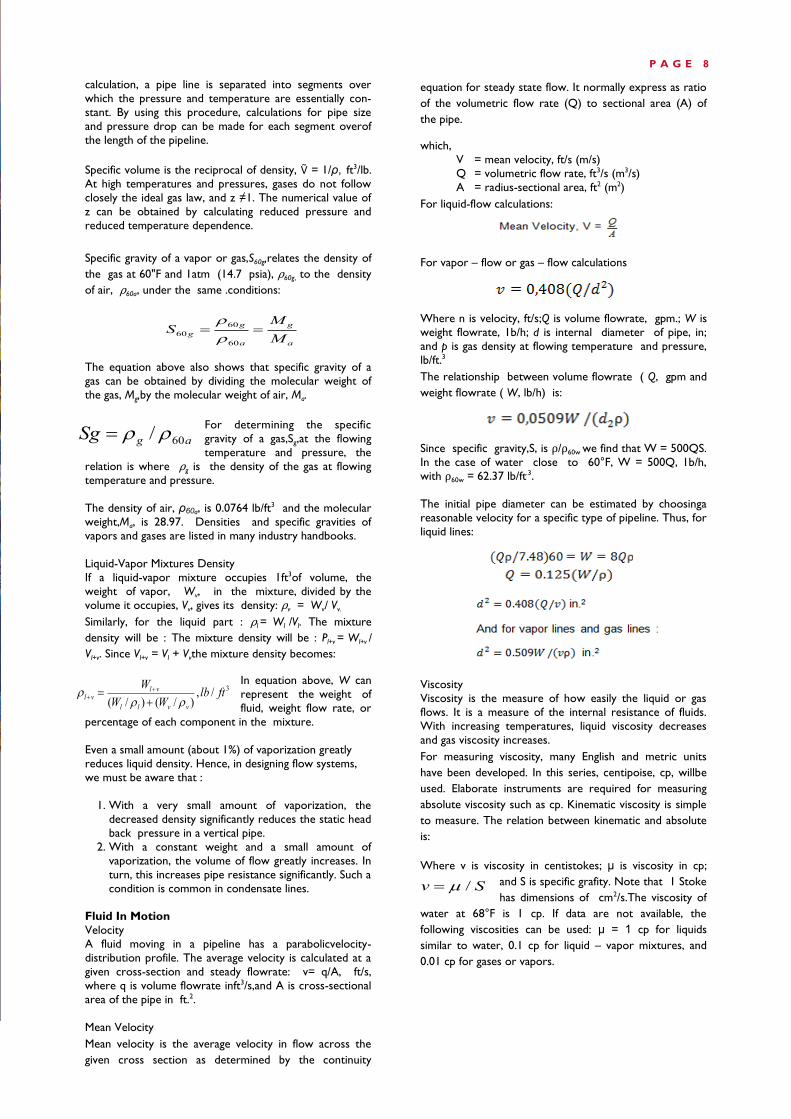
calculation, a pipe line is separated into segments over
which the pressure and temperature are essentially con-
stant. By using this procedure, calculations for pipe size
and pressure drop can be made for each segment overof
the length of the pipeline.
Specific volume is the reciprocal of density, Ṽ = 1/ρ, ft3/lb.
At high temperatures and pressures, gases do not follow
closely the ideal gas law, and z ≠1. The numerical value of
z can be obtained by calculating reduced pressure and
reduced temperature dependence.
Specific gravity of a vapor or gas,S60g,relates the density of
the gas at 60"F and 1atm (14.7 psia), ⍴60g, to the density
of air, ⍴60a, under the same .conditions:
The equation above also shows that specific gravity of a
gas can be obtained by dividing the molecular weight of
the gas, Mg,by the molecular weight of air, Ma.
For determining the specific
gravity of a gas,Sg,at the flowing
temperature and pressure, the
relation is where ⍴g is the density of the gas at flowing
temperature and pressure.
The density of air, ρ60a, is 0.0764 lb/ft3 and the molecular
weight,Ma, is 28.97. Densities and specific gravities of
vapors and gases are listed in many industry handbooks.
Liquid-Vapor Mixtures Density
If a liquid-vapor mixture occupies 1ft3of volume, the
weight of vapor, Wv, in the mixture, divided by the
volume it occupies, Vv, gives its density: ⍴v = Wv/ Vv.
Similarly, for the liquid part : ⍴l = Wl /Vl. The mixture
density will be : The mixture density will be : Pl+v = Wl+v /
Vl+v. Since Vl+v = Vl + Vvthe mixture density becomes:
In equation above, W can
represent the weight of
fluid, weight flow rate, or
percentage of each component in the mixture.
Even a small amount (about 1%) of vaporization greatly
reduces liquid density. Hence, in designing flow systems,
we must be aware that :
1. With a very small amount of vaporization, the
decreased density significantly reduces the static head
back pressure in a vertical pipe.
2. With a constant weight and a small amount of
vaporization, the volume of flow greatly increases. In
turn, this increases pipe resistance significantly. Such a
condition is common in condensate lines.
Fluid In Motion
Velocity
A fluid moving in a pipeline has a parabolicvelocity-
distribution profile. The average velocity is calculated at a
given cross-section and steady flowrate: v= q/A, ft/s,
where q is volume flowrate inft3/s,and A is cross-sectional
area of the pipe in ft.2.
Mean Velocity
Mean velocity is the average velocity in flow across the
given cross section as determined by the continuity
equation for steady state flow. It normally express as ratio
of the volumetric flow rate (Q) to sectional area (A) of
the pipe.
which,
V = mean velocity, ft/s (m/s)
Q = volumetric flow rate, ft3/s (m3/s)
A = radius-sectional area, ft2 (m2)
For liquid-flow calculations:
For vapor – flow or gas – flow calculations
Where n is velocity, ft/s;Q is volume flowrate, gpm.; W is
weight flowrate, 1b/h; d is internal diameter of pipe, in;
and p is gas density at flowing temperature and pressure,
lb/ft.3
The relationship between volume flowrate ( Q, gpm and
weight flowrate ( W, lb/h) is:
Since specific gravity,S, is ⍴/⍴60w we find that W = 500QS.
In the case of water close to 60°F, W = 500Q, 1b/h,
with ⍴60w = 62.37 lb/ft.3.
The initial pipe diameter can be estimated by choosinga
reasonable velocity for a specific type of pipeline. Thus, for
liquid lines:
Viscosity
Viscosity is the measure of how easily the liquid or gas
flows. It is a measure of the internal resistance of fluids.
With increasing temperatures, liquid viscosity decreases
and gas viscosity increases.
For measuring viscosity, many English and metric units
have been developed. In this series, centipoise, cp, willbe
used. Elaborate instruments are required for measuring
absolute viscosity such as cp. Kinematic viscosity is simple
to measure. The relation between kinematic and absolute
is:
Where v is viscosity in centistokes; μ is viscosity in cp;
and S is specific grafity. Note that 1 Stoke
has dimensions of cm2/s.The viscosity of
water at 68°F is 1 cp. If data are not available, the
following viscosities can be used: μ = 1 cp for liquids
similar to water, 0.1 cp for liquid – vapor mixtures, and
0.01 cp for gases or vapors.
P A G E 8
a
g
a
g
gM
MS
60
60
60
agSg 60/
3/,)/()/(
ftlbWW
W
vvll
vlvl
Sv /

Reynolds Number and Friction Factors.
Experiment and observations made in glass pipes have
shown that several types of flow exist in a fluid stream;
these depend on the velocity of the stream. Such flows can
be observed by injecting fine colored streams into the
main body of the liquid. At low velocities, the colored
streams retain their sharpness, and flow is laminar.
As fluid velocity increases, the fine streams begin to break
up, and glow is now in a transition or critical zone.
For estimating the type of flow in a pipeline, the Reynolds
number, NRe, is used. The Reynolds number is a
dimensionless combination of pipe diameter, velocity,
density and viscosity.
Practical formulas for calculating NRe are :
Where Q is volume flow, gpm; W is weight flow, lb/h; d is
internal diameter of pipe, in.; ρ is density, lb/ft3 and μ is viscosity, cp.
Resistance to fluid motion depends on the type of flow in
the pipeline and on the roughness of the pipe wall.
Relative roughness is where is the absolute
roughness (i.e., the depth of the unevenness of the internal
pipe wall), and D is the internal diameter of the pipe. Both
and D should be measured with the same dimensional
unit.
In the laminar zone, where NRe<2,000, the friction factor
depends on the Reynolds number only. Hence,
. In the critical zone, where 2,000
⩽NRe⩽ 4,000, the friction factor is unpredictable.
If the NRe ranges from 4,000, the flow is in the transitional
turbulent zone. Here the friction factor varies with the
Reynolds number. The zone to the right of the dashed line
is totally turbulent, and the friction factor remains
constant with increasing Reynolds number.
Because glass and plastic materials have smooth pipe walls,
the friction factors for them are independent of relative
roughness or pipe diameter.For steel pipes, the border
line between transitional and total turbulence can be
estimated. This is done by multiplying the nominal pipe
size (in) by 106 to get the borderline NRe. Friction factors
in the totally turbulent zone are listed in the table below.
Friction factors obtained directly from tables and diagrams
are used in calculations where the pipe material is new,
and where the fluids (for example, light hydrocarbons) do
not deteriorate the pipe wall. For fluids that corrode the
pipe wall, form deposits, or cause scaling or erosion, the
friction factor should be increased by a safety factor can
be 1.25 to 1.5, depending on the size and the expected life
of the installation
Friction factors for Total Turbulence (In new com-
mercial steel pipes)
The dimensional properties of pipe are published by
manufacturers. For steel pipes, these are based on the
recommendations of the American National Standards
Institute.
D/
Re/64 Nf
P A G E 9
eDvN /Re
dWdQN /31.6)/)(/(6.50Re
Nominal Pipe Size
Ln
Friction Factor
f
Nominal Pipe Size
Ln
Friction Factor
f
1 ½ 0.0205 10 0.0136
2 0.0195 12 0.0132
3 0.0178 14 0.0125
4 0.0165 16 0.0122
5 0.016 18 0.012
6 0.0152 20 0.0118
8 0.0142 24 0.0116


The tables below give practical velocities for liquid lines,
and vapor lines.
Typical Liquid Velocities in steel Pipelines
Typical Velocities in gas Vapor Lines
Note: Within the above velocities and line-size ranges,
(a) large lines can have higher velocities than smaller ones,
and (b) short lines, and leads from headers, can have high-
er velocities lhan long lines and headers.
To prevent corrosion or erosion of the internal pipe wall,
some chemicals should not exceed the maximum
velocities listed in the table below. Only a few examples
are listed in this table.
Maximum Velocities To Prevent Erosion Or
Corrosion of Pipe Wall
P A G E 1 1
Nominal Pipe Sizes, In
2 or less
3 to 10 10 to 20
Lioquid and Line Velocity Ft/S
Velocity Ft/S
Velocity Ft/S
Water
Pump suction 1 to 2 2 to 4 3 to 6
Pump discharge (long)
2 to 3 3 to 5 4 to 7
Discharge (short) 4 to 9 5 to 12 8 to 14
Boiler feed 4 to 9 5 to 12 8 to 14
Drains 3 to 4 3 to 5 ---
Sloped sewer --- 3 to 5 4 to 7
Hydrocarbon liquids
(Normal viscosities)
Pump suction 1.5 to 2.5
2 to 4 3 to 6
Discharge header (long)
2.5 to 3.5
3 to 5 4 to 7
Discharge leads (short)
4 to 9 5 to 12 ---
Drains 3 to 4 3 to 5 ---
Viscous oils --- 1.5 to 3 2.5 to 5
Pump suction
Medium viscosity --- 1.5 to 3 2.5 to 5
Tar and fuel oils --- 0.4 to 0.75
0.5 to 1
Discharge (short) --- 3 to 5 4 to 6
Drains 1 1.5 to 3 ---
Nominal Pipe Size
Ln
Saturated Steam
or Saturated Vapor
Superheated Steam
Superheated Vapor, or Gas
Low Pressure
Medium Pressure
High Pressure
Velocity, Ft/s Velocity,
Ft/s
Velocity Ft/
s
2 or less 45 to 10 40 to 80 30 to 60
3 to 4 50 to 110 45 to 90 35 to 70
6 60 to 120 50 to 120 45 to 90
8 to 10 65 to 125 80 to 160 65 to 125
12 to 14 70 to 130 100 to 190
80 to 145
16 to 18 75 to 135 110 to 210
90 to 160
20 80 to 140 120 to 220
100 to 170
Equipment Lines
Velocity,Ft/s
Reboiler,downcomer 9liquid) ..............
3 to 7
Reboiler, riser (liquid and vapor)............
35 to 45
Overhead condenser..............................
25 to 100
Two-phase flow......................................
35 to 75
Compressor, suction...................................................
75 to 200
Compressor, discharge................................................
100 to 250
Inlet, steam turbine.................................
120 to 320
Inlet, gas turbine.....................................
150 to 350
Liquid in carbon-steel pipe Maximum Velocity Ft/S
Phenolic water 3
Concentrated sulfuric acid 4
Cooling-tower water 12
Salt water 6
Calcium chloride brine 8
Caustic soda C>5% by volume
4
Aqueous amine (mono or diethanol amine
10
Wet phenolic water 60
Liquid in plastic or rubber-lined pipe
10

Thermodynamic Properties
In routine calculations for pipng and component sizing,
thermodynamics is rarely involved. However, it is useful
to recognize when physical changes takes place in the
flowing fluid. For example, if a liquid flows near its boiling
point, even a little vaporization (usually due to pressure
reduction) can increase piping and component resistances.
In order to understand the meanings of the terms
subcooled and saturated as applied to a liquid, and the
terms saturated and superheated as applied to a vapor, we
will use the temperature – volume relations that are
shown.
When a liquid is heated a t constant pressure, its
temperature increases and its volume expands. ( See line
segment from a to b) On reaching the boiling
temperauture , the liquid becomes saturated. The liquid
below the boiling point is called subcooled. More heat will
gradually vaporize the liquid while its pressure and
temperature remain constant but its volume increases
(Line b to c).
During this stage; both liquid and vapor phases are
present. After sufficient heat absorption, all of the liquid vaporizes (Point c). At this point, the vapor is saturated.
Further heating (Line c-d) will cause both the temperature
and the volume of vapor to increase. Vapor above the
saturation temperature is superheated.
At a higher constant pressure, the boiling temperature
will be higher, and less heat will be required to
vaporizethe liquid. At the critical point, the densities of
liquid and vapor become identical. Just below the critical
temperature, the substance is considered liquid, just
above it is considered vapor.
The quantity of heat needed to vaporize a unit weight of
saturated liquid at constant pressure (Line b-c) is called the latent heat (usually expressed in Btu/1b).
Flashing Liquid
When a liquid is flowing near its saturation point (also
called the equilibrium point or boiling point) in a pipeline,
decreased pressure will cause vaporization. The greater
the pressure difference, the greater the vaporization.
When flashing occurs,pipe resistance cannot be
calculated as for liquid flow. We will now have a two-
phase flow problem. The quantity of vaporized liquid can
be estimated by using the data of the
thermodynamicproperties of the liquid.
Specific Heat
The quantity of heat aborsed by a unit weight of substance
while its temeperature is raised 1° is termed the specific
heat. Customary units are in Btu/(lb)(°F).
Specific heat can be measured at constant volume, cᵥ, and
at constant pressure, cp. At constant pressure, cp≈Δh/Δt,
where Δh is the number of Btu absorbed by 1 lb of substance over a temperature span of ΔtoF.
At adiabatic gas flow (no heat exchange betwee the gas
and its environment), the ideal-gas law becomes PṼk = RT,
where k = cp/cv. For various gases,therange of k is from
1.2 to 1.4,with few exceptions. In isothermal (constant
temperature) flow, k = 1. Thequantity k is called the
specific heat ratio or adiabaticexponent. Data for cp, cv
and k are available in engineering hand books.
Bernoulli’s Equation
Bernoulli’s equation is useful in the calculation of the fluid
flow. It follows the first law of Thermodynamics and it
calculates the energy balance in steady state and
incompressible flow. The formula for the friction term in
pipe line is expressed as :
which,
P = pressure drop in pipe, Ibf/in2(Pa – For the
SI unit remember to divide the pressure
head with the acceleration of gravity. )
z = elevation of pipe, ft (m)
g = acceleration of gravity, ft/s2 (m/s2) –
32.2ft/s2
hL = Head loss, ft (m)
Dancy’s Formula
Dancy’s formula of the friction in pipe line is expressed as
which,
f = friction factor, dimensionless
L = length of pipe, ft (m)
P A G E 1 2
Lh
2g
Vz
ρ
P 2
g
V
D
LfhL
2.
2
Dancy’s friction factor, f is determined experimentally.
Normally friction factor for the laminar flow conditions
(Re <2100) is simple calculated with just function of the
Reynolds number only, which can be expressed as
In the transition zone which with the Reynolds number of
approximately 2100 to 4000. In this zone, the flow is
either laminar or turbulent depending upon several
factors. In this zone the friction factor is indeterminate
and has lower limits based on laminar flow and upper
limits based on turbulent flow conditions.
For the turbulent flow with the Reynolds number > 4000,
the friction factor is not only factor of the function of
Reynolds number it is function of the pipe wall as well.
The piping roughness will affect the friction loss as well.
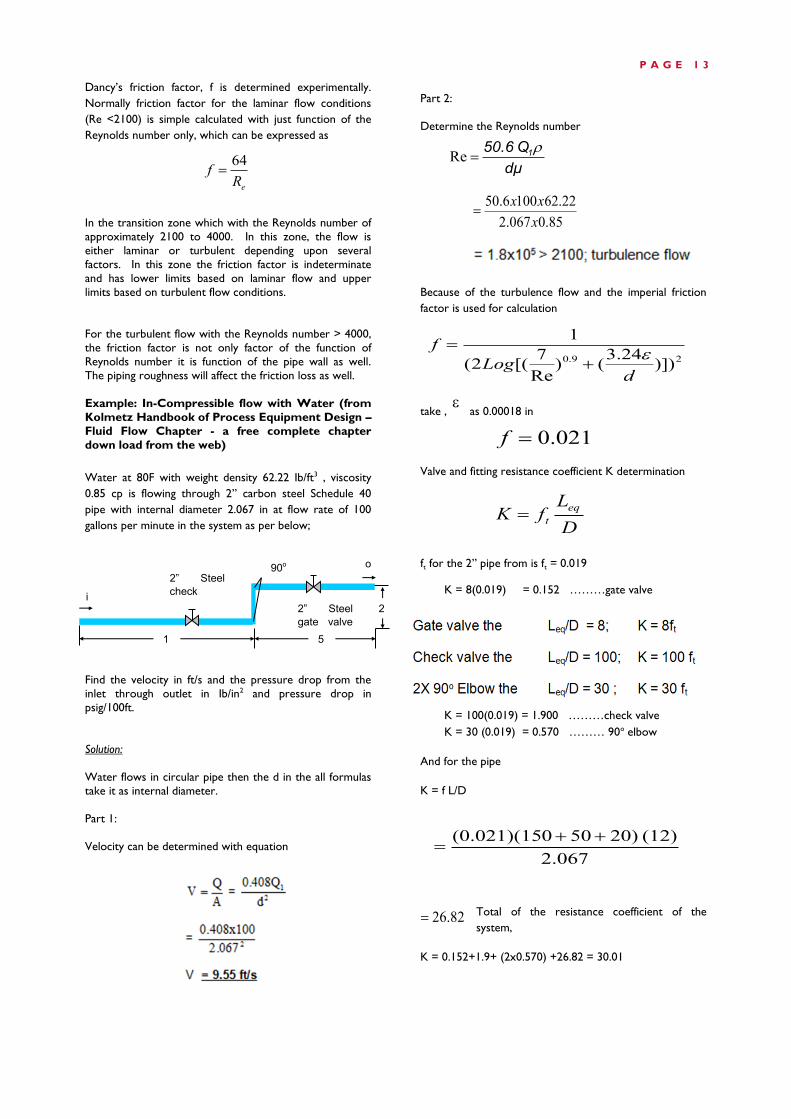
Example: In-Compressible flow with Water (from
Kolmetz Handbook of Process Equipment Design –
Fluid Flow Chapter - a free complete chapter
down load from the web)
Water at 80F with weight density 62.22 Ib/ft3 , viscosity
0.85 cp is flowing through 2” carbon steel Schedule 40
pipe with internal diameter 2.067 in at flow rate of 100
gallons per minute in the system as per below;
Find the velocity in ft/s and the pressure drop from the
inlet through outlet in Ib/in2 and pressure drop in
psig/100ft.
Solution:
Water flows in circular pipe then the d in the all formulas
take it as internal diameter.
Part 1:
Velocity can be determined with equation
Part 2:
Determine the Reynolds number
Because of the turbulence flow and the imperial friction
factor is used for calculation
take , as 0.00018 in
Valve and fitting resistance coefficient K determination
ft for the 2” pipe from is ft = 0.019
K = 8(0.019) = 0.152 ………gate valve
K = 100(0.019) = 1.900 ………check valve
K = 30 (0.019) = 0.570 ……… 90o elbow
And for the pipe
K = f L/D
Total of the resistance coefficient of the
system,
K = 0.152+1.9+ (2x0.570) +26.82 = 30.01
P A G E 1 3
eRf
64
o
i2” Steel
gate valve
2
1 5
2” Steel
check
90o
dμ
Q50.6 1Re
85.0067.2
22.621006.50
x
xx
29.0 )])24.3
()Re
7[(2(
1
dLog
f
021.0f
D
LfK
eq
t
2.067
(12) 20)500(0.021)(15
82.26

Pressure of the system = Pressure drop in horizontal line
+ Pressure drop in elevation
Pressure drop in
Exit velocity
Summary
The paper is a review of fluid flow fundamentals which are essential to understand before designing equipment. This
review has included physical properties, thermodynamic
properties and dimensionless units. It has given some
typical industry standards for velocity in pipe sizing.
References
1. Keenan,J.H., Keyes, F. G, Hill, P. G. and Moore,
J. G., "Steam Tables," Wiley, New York, 1969.
2. Gallant, R. W., "Physical Properties of
Hydrocarbons," Vol.1 and Vol. 2, Gulf Publishing
Co., Houston, 1968 and 1971.
3. Perry, R. H. and Chilton, C. H., "Chemical
Engineers' Handbook,"5th ed., McGraw-Hill,
New York, 1973.
4. "Flow of Fluids,"Crane TechnicalPaper No.
410,Chicago, IL 60632
5. Kern, Robert, “Useful Properties of Fluids”
Chemical Engineering, Dec 23, 1974
6. Kolmetz Handbook of Process Equipment De-
sign, 1st Edition, 2015
P A G E 1 4
144
22.622022.62
2.321442
)55.9(01.30 2 xx
xx
2/)64.836.18( inlb
2/00.27 inlb
)067.2)(2.32)(144(2
)22.62)(12()55.9)(100)(021.0(100/
2
ftpsi
ftpsi 100/46.7
sft
VpgV totex /93.10
22.62
55.922.625.027174.3225.025.0
25.0
2

I think of how much the engineering profession has
changed since I entered the workforce in the 1980s. I
walked into a production plant my first day ready to put
all my years of school to use. I had even thought about a
set of ideas to implement my first few weeks on the job. I
had been hired as a production manager for a small facili-
ty that manufactured polyurethane material in the U.S. I
managed a staff of 12, including one supervisor. In retro-
spect, that was not a good entry-level job for me or, I
would argue, most engineers. There are so many things
you need to know about managing people that you do
not have when you come out of an engineering curricu-
lum. (However, this is all fodder for a future article, let
me get back to the point of this one.)
I walked through the door full of ideas, and quickly found
that I was going to need information from others. During
my interviews with various plant managers, I had gleaned
some of the problems the plant was having making prod-
uct that was on-spec (i.e., passing the specification stand-ards set up by the customers). I started with the assump-
tion that we could do better. I still start with that as-
sumption when facing problems today. But I realized that
to improve the process, I needed to know more about
how we were currently running the process.
This was in the days just before initiatives like statistical
quality control had taken firm hold throughout industry –
especially in smaller companies. But I knew intuitively that
controlling the process and eliminating variability were
keys to producing a more consistent product. However,
the more I asked for information on the current process,
the more people seemed to resist providing it. That was
not true in all cases, some people from the laboratory,
production floor, and engineering department were eager
to help and appreciated my effort to improve the process
which, I explained, would improve the outcome. Howev-
er, more people seemed to resist.
So what caused people to withhold information from me?
I think there were at least two things, maybe more, that I
was witnessing. In some cases, people who had been
involved with a decision did not feel completely comfort-
able with it, and did not want someone else to revisit it.
That was especially true for some young fresh out of
school know-it-all like me.
The other reason I think people withheld information, and
the real point of this article, is that a lot of people at that
plant felt their job security depended on them being the
only person to know something. They had mounds of
folders in their offices, often locked up in cabinets, and
only they knew where the information was kept. I would
often hear comments like,
“Oh, (fill in the blank with a name) knows about that. You
have to go see him.” This situation fed a culture of one
person having compiled and held onto information such
that, that individual really was invaluable to the organiza-
tion. And maybe that was good for that individual, but it
was not good for the organization. An organization cannot
be so person-based that if that person leaves or does not
perform well, the organization suffers.
engineers of today live in exciting times. Information is
more readily accessible than ever in history. Considering
the field of safety where I have been for much of my ca-
reer, I remember safety managers in the past walking into
a meeting with a folder full of information on accidents
that happened at other similar facilities. He, or she, had
that folder, they knew where the accidents had happened,
and they were the single-point “go to” person on acci-
dents.
Today, most any engineer with access to the internet can find gobs of information on accidents, provided the infor-
mation is in the public domain. Therefore, it could be ar-
gued that today, having information is not nearly as im-
portant as knowing what to do with the information. To-
day’s engineer, and tomorrow’s engineer, are – and will be
- judged less by what they know, and more by the reason-
ing skills and decision making they apply using information:
What I call wisdom and judgement verses compiling and
holding. It is not enough to simply know that an accident
happened in a similar plant and having a hard copy of the
report. You absolutely have to be aware that something
happened, but that information is more readily available
than ever. It is important to understand the breadth of
inputs and breakdowns that led to that that accident, what
cultural issues at the plant may have either caused or ena-
bled those breakdowns, deficits in their management sys-
tems, and how all that applies to different operations.
Oftentimes, I have seen people look at an accident and
focus on differences between the plant where the acci-
dent happened and their own plant to provide a sense of
relief that the same thing cannot happen where they are.
Instead, engineers should strive to determine the similari-
ties between the conditions where an accident occurred
and conditions in their own plant. This rationale applies
not just to safety, but environmental initiatives, process
improvement, product enhancement, and even areas such
as public relations.
Exercising wisdom to know what to do about a problem
counts for much more than knowing a problem may exist.
It is basically a given today that engineers will know some-
thing went wrong (or consequently – know that some
companies have best practices and consistently do things
right). What is not a given, and can set a young engineer
P A G E 1 5
THE ENGINEER OF
TOMORROW
WISDOM AND JUDGESMENT VERSES
COMPILING AND HOLDING
apart from the rest, is to exercise good judgement in de-
termining a course of action to apply that knowledge to a
different – though similar – situation.
In summary, we may never completely get away from the
temptation of some to acquire and hoard information. I
still run into that with some people today. However, this
approach gets less and less successful over time. Today
and tomorrow’s engineers are expected to know infor-
mation, what will set them apart is the wisdom they
demonstrate in applying that information to different
problem sets. The ability to find information, which often
valued in the past, has given way to the ability to wisely
use information. Tomorrow’s engineer will strive to con-
stantly develop and enhance the necessary skills to use
wisdom and good judgement where the amount of infor-
mation that exists outweighs the solutions available.
Stephen J. Wallace is a Certified Safety Professional and Profes-
sional Engineer, registered in multiple states in the US. In his
career, he has led award-winning environment, safety, and
health programs in the public and private sectors. He was a
lead investigator into the causes of chemical accidents for the
US Government for several years. He has published numerous
articles in engineering and safety journals, and has provided
consulting services and taught courses throughout the US and
internationally. He is an honorary Industrial Advisor to the IAC-
PE Board.
P A G E 1 6
Antoine Technical Consulting LLC joined forces with Ade-
lante Sciences Corporation to shed some light on the issue
of water intrusion into the helmets of astronauts that has
been plaguing NASA over the past three years. The latest
occurrence was as recent as January 2016, indicating that
this potentially life-threatening issue still remains unre-
solved. Antoine Technical Consulting LLC and Adelante
Sciences Corporation worked on this issue in hopes of
providing an outside perspective that could lead to a solu-
tion. Please note that the work described in this article was
done as a matter of interest using publicly available infor-
mation and does not represent paid work done by any of
these business entities for NASA.
NASA has had a nagging issue of water intrusion into the
helmets of astronauts’ spacesuits over the past three years.
By far the most concerning case was the incident with Luca
Parmitano, a European Space Agency (ESA) astronaut from
Italy, on July 16, 2013. This incident could have resulted in
loss of life as Luca’s helmet filled with about 1.5 L of water over a 45-minute period during his spacewalk on the Inter-
national Space Station (ISS). Luca’s mouth and ears were
submerged, his vision was impaired and he had difficulty
communicating with ground control and other support in
orbit in the ISS
The spacesuit underwent a major parts overhaul and it
seemed that the water intrusion problem had been fixed.
However, these water intrusion incidences have recurred,
although with reduced severity. The reduced severity is in
great part due to the difference in the response behavior of
the astronauts, on-orbit and ground control support.
NASA personnel are now quick to terminate a spacewalk if
a water intrusion event occurs
Many systems require water for various needs such as fire
suppression/sprinkler system, thermal management, and
drinking water to name a few. In this study, we see that a
process requiring water can extend to something as individ-
ual as the liquid cooling ventilation garment that an astro-
naut wears for thermal management during spacewalks.
Regardless of the end-use of the water, addition of biocides
is a necessary step to prevent bio fouling, for health safety
preventing the transmission of waterborne diseases such as
Legionnaires disease and to inhibit microbiological induced
corrosion.
From the NASA Mishap Investigation Report, it was found
that what caused the water intrusion event was a buildup of
moisture in the ventilation loop, a piping network which
carries humidified breathing gas to the astronaut – princi-
pally oxygen – and metabolic waste gases and moisture
away from the astronaut for elimination. This buildup was
due to blockage of the separator part of the complex, high-
ly integrated fan/pump/separator component. There was a
buildup of silica on the pitot separator that came from the
offline water scrubbing protocol that is periodically used to
rid the thermal water of particulate contaminants, corro-
sion products, and biological contaminants. The pitot sepa-
rator separates moisture from the ventilation gas.
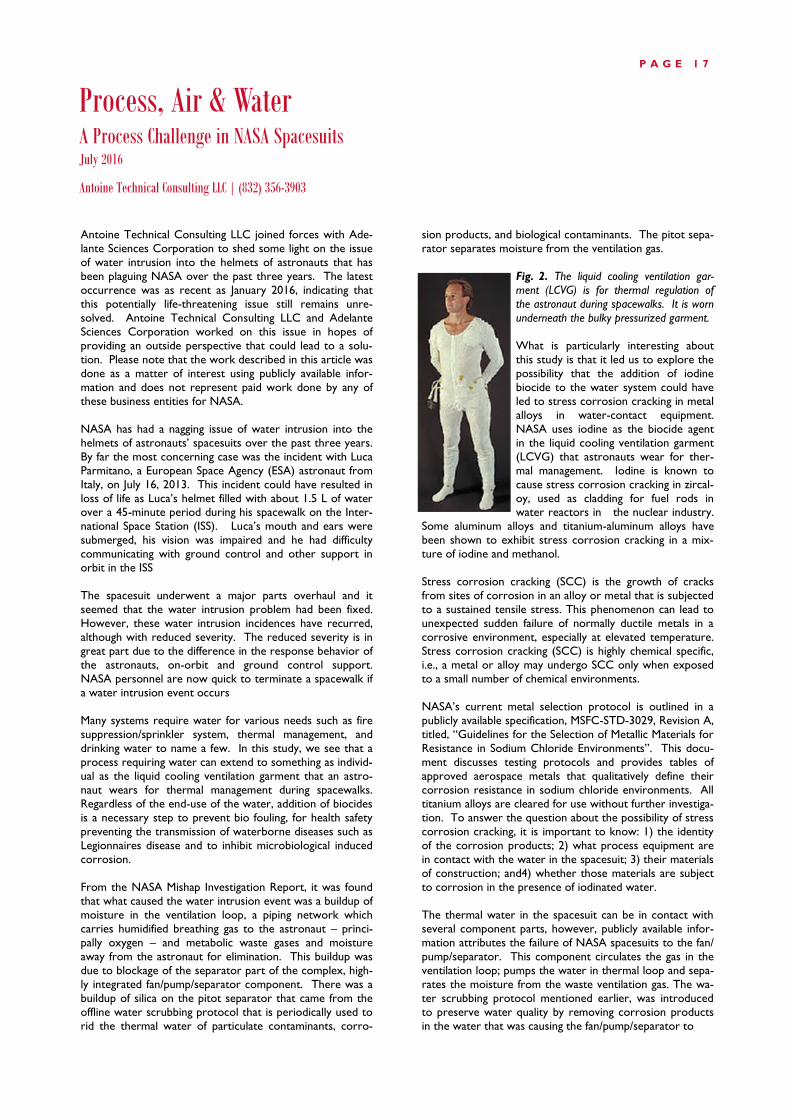
Fig. 2. The liquid cooling ventilation gar-
ment (LCVG) is for thermal regulation of
the astronaut during spacewalks. It is worn
underneath the bulky pressurized garment.
What is particularly interesting about
this study is that it led us to explore the
possibility that the addition of iodine
biocide to the water system could have
led to stress corrosion cracking in metal
alloys in water-contact equipment.
NASA uses iodine as the biocide agent
in the liquid cooling ventilation garment
(LCVG) that astronauts wear for ther-
mal management. Iodine is known to
cause stress corrosion cracking in zircal-
oy, used as cladding for fuel rods in water reactors in the nuclear industry.
Some aluminum alloys and titanium-aluminum alloys have
been shown to exhibit stress corrosion cracking in a mix-
ture of iodine and methanol.
Stress corrosion cracking (SCC) is the growth of cracks
from sites of corrosion in an alloy or metal that is subjected
to a sustained tensile stress. This phenomenon can lead to
unexpected sudden failure of normally ductile metals in a
corrosive environment, especially at elevated temperature.
Stress corrosion cracking (SCC) is highly chemical specific,
i.e., a metal or alloy may undergo SCC only when exposed
to a small number of chemical environments.
NASA’s current metal selection protocol is outlined in a
publicly available specification, MSFC-STD-3029, Revision A,
titled, “Guidelines for the Selection of Metallic Materials for
Resistance in Sodium Chloride Environments”. This docu-
ment discusses testing protocols and provides tables of
approved aerospace metals that qualitatively define their
corrosion resistance in sodium chloride environments. All
titanium alloys are cleared for use without further investiga-
tion. To answer the question about the possibility of stress
corrosion cracking, it is important to know: 1) the identity
of the corrosion products; 2) what process equipment are
in contact with the water in the spacesuit; 3) their materials
of construction; and4) whether those materials are subject
to corrosion in the presence of iodinated water.
The thermal water in the spacesuit can be in contact with
several component parts, however, publicly available infor-
mation attributes the failure of NASA spacesuits to the fan/
pump/separator. This component circulates the gas in the
ventilation loop; pumps the water in thermal loop and sepa-
rates the moisture from the waste ventilation gas. The wa-
ter scrubbing protocol mentioned earlier, was introduced
to preserve water quality by removing corrosion products
in the water that was causing the fan/pump/separator to
Process, Air & Water A Process Challenge in NASA Spacesuits July 2016
Antoine Technical Consulting LLC | (832) 356-3903
P A G E 1 7

malfunction. It should be noted that the presence of the
corrosion products in the thermal water followed the prop-
agation of the fan/pump/separator component in NASA
spacesuits. We have not been able to locate information
within the public domain that explicitly calls out the materi-
als of construction of the fan/pump/separator to which
failure of several spacesuits have been attributed. It is
known, however, that the corrosion products are due to
rotor growth from internal corrosion of the permanent
magnet (typically a NdFeB alloy) potting within the rotor.
As corrosion would not occur in a moisture-free environ-
ment, the presence of corrosion products suggests that the
exclusion of moisture in supposedly dry areas, like inside
the rotor shaft, still remains a challenge.
Summarizing, we have not explicitly found that iodinated
water would accelerate corrosion in the thermal water
loop. NASA has done extensive materials compatibility
tests in iodine environments for time periods as long as one
year and so materials currently in use have been selected with care. It may be that for the extended period of use of
the spacesuits, ~ 6 years, the materials may be reaching the
end of their useful lives. We suggest that a migration to an
ionic silver-based biocide may be beneficial. There is prece-
dent as the Russian Space Agency uses an ionic silver bio-
cide in cosmonaut suits. NASA is already looking at replac-
ing the iodine biocide with ionic silver in drinking water due
to the non-related but important logistics of removing the
biocide prior to astronaut consumption. It may well be,
however, that a move to ionic silver is serendipitous to the
reduction of corrosion products in the thermal cooling
water.
Antoine Technical Consulting LLC offers solutions to help clients
improve their primary and auxiliary processes using chemical
process simulation to perform process engineering and design,
energy assessments, troubleshooting and scale-up.
For your service inquiry, please contact:
Antoine Technical Consulting LLC
P.O. Box 57862, Webster, TX 77598
832-356-3903
www.antoinetech.com
Thank you for reading the Process, Air & Water. In this issue
we see that water quality is an issue that can affect mechan-
ical equipment even in small parts used on NASA space-suits. References were obtained by performing searches at
NASA Technical Reports Server: http://ntrs.nasa.gov/
search.jsp.
We invite you to contact us with your questions or feed-
back.
P A G E 1 8
Advertisers IACPE………………………………….Page 3
KLM Technology Group………………Page 7
Summit Technology Management……..Page 10
CPSP Program…………………………Page 14
CPPM Program……………………….. Page 16
PT. Dinamika Teknik Persada…………Page 18
