ozone transport commission materials... · · 2017-09-08ozone transport commission ozone...
TRANSCRIPT

OZONE TRANSPORT COMMISSION
OZONE TRANSPORT COMMISSION
Ali Mirzakhalili, P.E.Stationary and Area Sources Committee
OTC /MANE-VU Committees’ Meeting
September 7, 2017
Hall of States, Washington DC.
1

Stationary and Area Sources Committee (SAS)
2
• SAS Workgroup Products o Control Measures
Model Rule on NatGas Compressors
Cement Kiln Recommendations
GN SIP Statement
o HEDD
Whitepaper with Strategies and Recommendations for Formal Action (Statement/Resolution/MOU)
• Future Work

SAS Workgroups Recommendations & Model Rules Consider in GN SIPs Due in 2018
3
Largest Contributors Workgroup Control Measures Workgroup HEDD Workgroup
2017 SAS ChargeReport on OTC, EPA, & individual state efforts on:
1. Optimal operation of existing EGU controls to ensure maximum NOx emission reductions, focusing on EGUs in OTC modeling domain2. Addition of controls to large uncontrolled EGUs inside & outside of the OTR.
Units CoveredEGUs ≥25 MW that report to CAMDEGUs having no post-combustion controlsEGUs not running existing controls optimally
Fuel Type CoalResidual Oil
Performance Metric for ControlsSCR = 0.10 lb/mmBTUSNCR = 0.30 lb/mmBTU
Geography States in CSAPR U + OTR + NC
Work in Progress
2017 SAS Charge3. Develop recommendations & model rules for SAS strategies for 2018 Good Neighbor SIPs considering sector NOx/VOC emissions, potential emissions reduction, cost, ease of implementation, etc.
Source sectors
Pipeline CompressorsCement Kilns
Fuel type Coal Residual OilNatural Gas
Geography
States in CSAPR U + OTR
2017 SAS Charge4. Develop recommendations for at least one specific strategy to reduce HEDD emissions and an implementation mechanism.
Units covered
boilers serving EGUs ICI boilers simple cycle & combined cycle combustion turbines landfill/digester gas-fired reciprocating engines other fuel-burning equipment
Fuel type CoalResidual Oil or Other Oils Natural Gas
Strategies Rule-Based (enforceable) Outreach-Based (voluntary)
Geography States in OTR

Top 25 2016 Ozone Season OTR/CSAPR State NOx Emitters with SCR or SNCR
4
State Facility Name Facility - Unit ID
Avg. NOx Rate
(lb/MMBtu)
NOx
(tons)
2017
Allocations SCR? SNCR?
Best Observed Rate
(lb/mmBTU) Year
1 MO New Madrid Power Plant 2167-2 0.457 3,832 695 Yes 0.094 2009
2 OH W H Zimmer Generating Station 6019-1 0.199 3,239 1,063 Yes 0.056 2006
3 MO New Madrid Power Plant 2167-1 0.709 3,000 681 Yes 0.090 2008
4 PA Montour, LLC 3149-1 0.379 2,316 478 Yes 0.044 2003
5 MO Thomas Hill Energy Center 2168-MB3 0.233 2,225 907 Yes 0.054 2009
6 PA Montour, LLC 3149-2 0.233 2,225 432 Yes 0.047 2003
7 PA Cheswick 8226-1 0.302 2,791 1,000 Yes 0.060 2003
8 VA Clover Power Station 7213-1 0.356 2,460 349 Yes 0.232 2003
9 WV Harrison Power Station 3944-3 0.277 2,052 696 Yes 0.066 2005
10 MO Thomas Hill Energy Center 2168-MB2 0.186 2,033 397 Yes 0.066 2009
11 PA Bruce Mansfield 6094-3 0.185 2,009 656 Yes 0.074 2005
12 WV Harrison Power Station 3944-2 0.241 2,004 648 Yes 0.067 2006
13 KY Paradise 1378-3 0.221 1,933 1,280 Yes 0.100 2005
14 OH Gen J M Gavin 8102-1 0.113 1,912 1,132 Yes 0.069 2004
15 OH Killen Station 6031-2 0.233 1,904 572 Yes 0.089 2005
16 VA Clover Power Station 7213-2 0.268 1,867 344 Yes 0.229 2003
17 PA Keystone 3136-1 0.183 1,859 657 Yes 0.042 2003
18 PA Homer City 3122-3 0.267 1,854 439 Yes 0.087 2005
19 PA Conemaugh 3118-1 0.197 1,822 616 Yes 0.069 2017
20 PA Keystone 3136-2 0.190 1,749 665 Yes 0.043 2008
21 WV Mountaineer (1301) 6264-1 0.108 1,688 579 Yes 0.039 2007
22 LA Dolet Hills Power Station 51-1 0.200 1,663 1,239 Yes 0.178 2011
23 PA Bruce Mansfield 6094-2 0.156 1,626 599 Yes 0.080 2004
24 IA George Neal South 7343-4 0.188 1,568 910 Yes 0.187 2015
25 AL Gorgas 8-10 0.164 1,543 577 Yes 0.064 2004
Many Units with SCR Continue to Operate above the Best Observed Rate (BOR)

Top 25 2016 Ozone Season CSAPR State NOx Emitters
5
State Facility Name Facility - Unit IDAvg. NOx Rate (lb/MMBtu)
NOx
(tons)2017
Allocations1 LA Ninemile Point 1403-4 0.394 3,918 6622 IN Rockport 6166-MB2 0.195 3,444 2,1533 LA Ninemile Point 1403-5 0.346 2,922 7464 TX Oklaunion Power Station 127-1 0.302 2,791 1,0005 AR Independence 6641-1 0.273 2,686 9806 IN Rockport 6166-MB1 0.197 2,578 2,2297 AR Independence 6641-2 0.247 2,528 1,0068 AR White Bluff 6009-1 0.356 2,460 1,0849 WV Fort Martin Power Station 3943-1 0.293 2,416 590
10 PA Brunner Island, LLC 3140-3 0.401 2,414 45211 TX Limestone 298-LM2 0.198 2,369 1,48212 IN Cayuga 1001-2 0.296 2,320 72313 IA Walter Scott Jr. Energy Center 1082-3 0.401 2,414 1,05214 VA Clover Power Station 7213-1 0.709 3,000 349
15 IN IPL - Petersburg Generating Station 994-4 0.272 1,966 894
16 AR White Bluff 6009-2 0.307 1,874 1,06317 VA Clover Power Station 7213-2 0.268 1,867 34418 TX Limestone 298-LM1 0.197 1,854 1,35019 LA Little Gypsy 1402-3 0.407 1,848 41520 MI Belle River 6034-2 0.207 1,840 1,03121 TX H W Pirkey Power Plant 7902-1 0.157 1,791 1,18622 TX Martin Lake 6146-1 0.153 1,783 1,36323 NC Marshall 2727-4 0.230 1,778 52624 WV Fort Martin Power Station 3943-2 0.313 1,762 58225 IN Cayuga 1001-1 0.314 1,690 740
• All Coal Units Except in LA (NG Units)
• SCR Units Excluded

CSAPR Allowance Prices (4/17/15 – 8/25/17)
6Still Cheaper to Buy Allowances than to Run Controls in most cases!
$0
$100
$200
$300
$400
$500
$600
$700
$800
$900
$1,0004
/20
15
5/2
01
5
6/2
01
5
7/2
01
5
8/2
01
5
9/2
01
5
10
/20
15
11
/20
15
12
/20
15
1/2
01
6
2/2
01
6
3/2
01
6
4/2
01
6
5/2
01
6
6/2
01
6
7/2
01
6
8/2
01
6
9/2
01
6
10
/20
16
11
/20
16
12
/20
16
1/2
01
7
2/2
01
7
3/2
01
7
4/2
01
7
5/2
01
7
6/2
01
7
7/2
01
7
8/2
01
7
$/s
ho
rt t
on
Annual NOx Ozone Season NOx
EPA S & L Low NOx Operating Cost Estimate Annual NOx + Ozone Season NOXNOx
Allowance Price Data Source: Argus Air Daily, Control cost estimates calculated using Sargent and Lundy method
Note: EPA CSAPR Update S&L High NOx Operating Cost Estimate = $1,400 - $ 3,400/ston
2017 Vintage OS NOx
2016 Vintage OS NOx

- 40 80 120 160 200(1000 tpy)
Control Measures Workgroup
7
Top 15 NOx Emitting Stationary Source Categories in CSAPR Update & OTR States (Excluding EGUs, Airport LTO, & Sources from VA); Source: 2014 NEI v.1
CSAPR U States not in OTROTR

Control Measures Workgroup (Continued)
8
Top 10 NOx Emitting Stationary Source Categories in OTR (Excluding EGUs, Airport LTO, & Sources from VA); Source: 2014 NEI v.1
- 5 10 15 20 25(1000 tpy)
12 States + DC in OTR

9
2017 SAS Charge #3
Develop recommendations & model rules for SAS strategies for 2018 Good Neighbor SIPs considering sector NOx/VOC emissions, potential emissions reduction, cost, ease of implementation, etc.
Source sectors
Pipeline CompressorsCement Kilns
Fuel type Coal Residual OilNatural Gas
Geography States in CSAPR U + OTR
Whitepaper summarizing Control Measures for Two Sources
A. Good Neighbor provision for the 2015 Ozone NAAQS under the CAAB. Two NOx Emissions Source Categories
1. Natural Gas Pipeline Compressor Prime Moversi. Emissions Control ii. Opportunities for Further Emissions Reductions
2. Cement Manufacturingi. Cement Plants in the OTR and CSAPR Update Statesii. Existing NOx Emissions Controliii. Recommendations for NOx Emissions Control
Model Rule for Control of NOx Emissions from Natural Gas Pipeline Compressor Fuel-Fired Prime Movers (Two & Four
Stroke Lean & Rich Burn ICE, Combustion Turbines)
Recommendations on Cement Kilns (Wet, Long Dry, Dry
Preheater & Precalciner Kilns)
Control Measures Workgroup & Recommendations

NOx Limits in the Model Rule for NatGas Pipeline Compressor Fuel-Fired Prime Movers
10
Four-Stroke Rich Burn ICE
Nameplate Rating
(HP)
NOx Rate (g/BHP-hr)
or (% Reduction)
200 - 499 1.5 (90%)
500 - 1999 1.5 (90%)
≥2000 1.0 (95%)
Four-Stroke Lean Burn ICE
Nameplate Rating
(HP)
NOx Rate (g/BHP-hr)
or (% Reduction)
200 - 499 1.5 (90%)
500 - 1999 1.5 (90%)
≥2000 1.5 (90%)
Two-Stroke Lean Burn ICE
Nameplate Rating (HP)NOx Rate (g/BHP-hr)
or (% Reduction)
200 - 499 2.0 (80%)
500 - 1999 1.5 (80%)
≥2000 1.5 (90%)
Combustion Turbines*
Nameplate Rating (HP)
(MW)NOx Rate (ppmvd @ 15% O2)
≤2000 (1.5) 150.0 (6.0 lb/MWhr)
2000 - 4999 (1.5-3.7) 50.0 (2.0 lb/MWhr)
≥5000 (3.7) 25.0 (1.0 lb/MWhr)
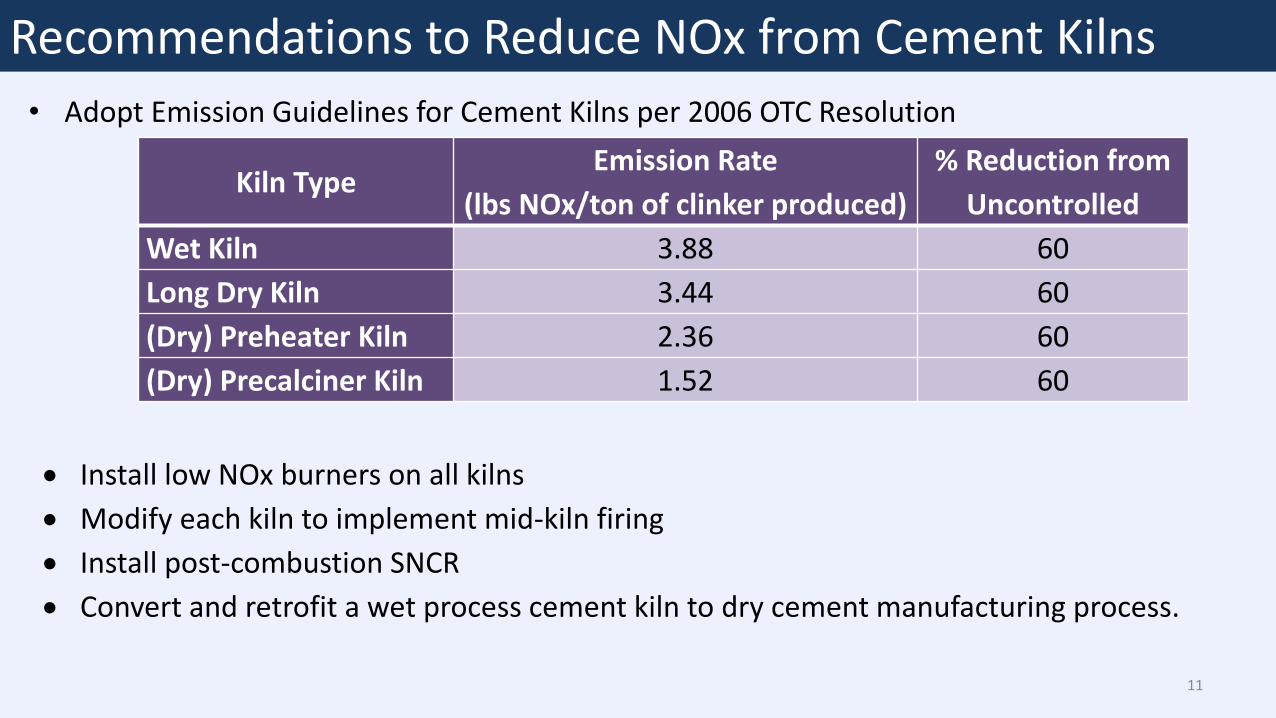
Recommendations to Reduce NOx from Cement Kilns
11
Kiln TypeEmission Rate
(lbs NOx/ton of clinker produced)
% Reduction from
Uncontrolled
Wet Kiln 3.88 60
Long Dry Kiln 3.44 60
(Dry) Preheater Kiln 2.36 60
(Dry) Precalciner Kiln 1.52 60
Install low NOx burners on all kilns
Modify each kiln to implement mid-kiln firing
Install post-combustion SNCR
Convert and retrofit a wet process cement kiln to dry cement manufacturing process.
• Adopt Emission Guidelines for Cement Kilns per 2006 OTC Resolution

12
2017 SAS Charge
Develop recommendations for at least one specific strategy to reduce High Electricity Demand Day (HEDD) emissions & an implementation mechanism.
WHITEPAPER
• Enforceable Rule-Based Strategy to Limit NOx Emissions from Boilers, Turbines, and Other Combustion Devices
1. Applicability: (a) Sources not Major for NOx; (b) Exemptions2. Daily NOx Mass Emissions Limit3. Emission Rate Limitations: (a) Boilers serving EGUs; (b) ICI boilers; (c) Simple cycle combustion turbines; (d) Combined cycle combustion turbines; (e) Reciprocating engines; (f) Additional fuel burning devices.4. Tune-up Requirements5. Record Keeping and Reporting
• Enforceable Rule-Based Strategy to Further Limit NOx from Non-Emergency Generators Powered by Reciprocating Engines
1. Applicability2. Emissions Limitations3. Record Keeping and Reporting4. Registration
• Voluntary Outreach-Based Strategy1. General Public; 2. Facility Owners
• 3 Options for an Implementation Mechanism1. Statement, 2. Resolution, Option 3. MOU
• Reciprocating Engines and Federal New Source Performance Standards
High Electricity Demand Day (HEDD) Workgroup & Recommendations
Installed before June 1, 2018:
4.0 lb/MWh (1.3 g/bk hp-hr)
Installed on or after June 1, 2018:
0.6 lb/MWh (0.2 g/bk hp-hr)

Consumer Products Workgroup
13
• CARB 2008, parts of 2009, 2010, 2012 and 2013 rules reviewed
• Nearly 40 Product Categories identified for update
• Considering excluding:
a. Anti-seize lubricant
b. Cutting or tapping oil
c. Gear, chain or wire lubricant
d. Rust preventative or rust control lubricant
• Approximately 25 tons per day reduction of VOCs within OTR

Recommendations for Future Work / 2018 SAS Charges
14
– consider current versions as status reports
LargestContributors
• Complete analysis for EGU status reports 1&2 before making recommendations
• 24h averaging
Control Measures
• Estimate potential reductions & costs for each measure • All GN SIPs should contain the recommended measures
HEDD• Compile database of Major and non-Major non-CAMD sources that supply
to, or offset from, the electricity grid• Evaluate potential daily emission reductions from control strategies
Consumer Products
• Update Model Rule by 1st Quarter of 2018• Recommend inclusion in GN SIPs
AIM• Monitor CARB survey results and update model rule as appropriate• Recommend inclusion in GN SIPs

Questions?
15