oxygen saturation: tests, causes and possible affects by chris vaught
TRANSCRIPT

Oxygen Saturation:Oxygen Saturation:Tests, Causes and Possible AffectsTests, Causes and Possible Affects
By Chris VaughtBy Chris Vaught

Oxygen SaturationOxygen Saturation What is it?What is it?
• Amount of oxygen in the bloodAmount of oxygen in the blood• Measurement oxygen molecules attached to Measurement oxygen molecules attached to
hemoglobinhemoglobin

BackgroundBackground
Diagnosed with low oxygen Diagnosed with low oxygen saturation at the age of 12saturation at the age of 12
Several possibilities ruled outSeveral possibilities ruled out Confused the doctorsConfused the doctors

SymptomsSymptoms
Shortness of breathShortness of breath FatigueFatigue WeaknessWeakness NumbnessNumbness Mental RetardationMental Retardation

OximetryOximetry
The measurement of the oxygen The measurement of the oxygen saturation.saturation.
Two common ways for taking Two common ways for taking measurements:measurements:• Pulse OximetryPulse Oximetry• Arterial Blood GasArterial Blood Gas

Pulse OximetersPulse Oximeters
That little thing That little thing they put on your they put on your finger.finger.
Measuring the Measuring the oxygen saturation oxygen saturation through the through the capillaries.capillaries.
Can also attach to Can also attach to the ear or toes.the ear or toes.
Needs as little as Needs as little as 0.3 to 0.5 mL of 0.3 to 0.5 mL of bloodblood

How it WorksHow it Works
Based on the Based on the principle of light principle of light absorption.absorption.
Oxygenated Oxygenated Hemoglobin Hemoglobin absorbs more absorbs more Infrared light.Infrared light.
Deoxygenated Deoxygenated blood absorbs blood absorbs more Red light.more Red light.

Arterial Blood GasesArterial Blood Gases Blood drawn from an artery to test the gases Blood drawn from an artery to test the gases
in the blood.in the blood.
Partial pressure of oxygen (PaO2):
70–100 millimeters of mercury (mm Hg)
Partial pressure of carbon dioxide (PaCO2):
35–45 mm Hg
pH: 7.35–7.44
Bicarbonate (HCO3): 21–28 milliequivalents per liter (mEq/L)
Oxygen content (O2CT): 15%–23% (15–23 milliliters [mL] per 100 mL of blood)
Oxygen saturation (O2Sat): 95%–100%

How an ABG is DoneHow an ABG is Done
Determine the site Determine the site using the Allan using the Allan test.test.
Prep the areaPrep the area Insert the needle Insert the needle
into the artery to into the artery to get the sampleget the sample

Causes of Low SaturationCauses of Low Saturation
Abnormal hemoglobin levels or Abnormal hemoglobin levels or functionfunction
Pulmonary FunctionPulmonary Function
ShuntShunt
Cardiac EfficiencyCardiac Efficiency

Hemoglobin LevelsHemoglobin Levels Normal levels are 12 to 18 grams per deciliterNormal levels are 12 to 18 grams per deciliter Higher levels Higher levels
• Dehydration, Dehydration, • Excess production of red blood cells Excess production of red blood cells • Severe lung diseaseSevere lung disease
Lower LevelsLower Levels• Deficiencies Deficiencies • Inherited hemoglobin defectsInherited hemoglobin defects• Inherited defects affecting the red blood cells Inherited defects affecting the red blood cells • excessive destruction of red blood cells excessive destruction of red blood cells • kidney disease kidney disease • bone marrow failure bone marrow failure • cancers that affect the bone marrowcancers that affect the bone marrow
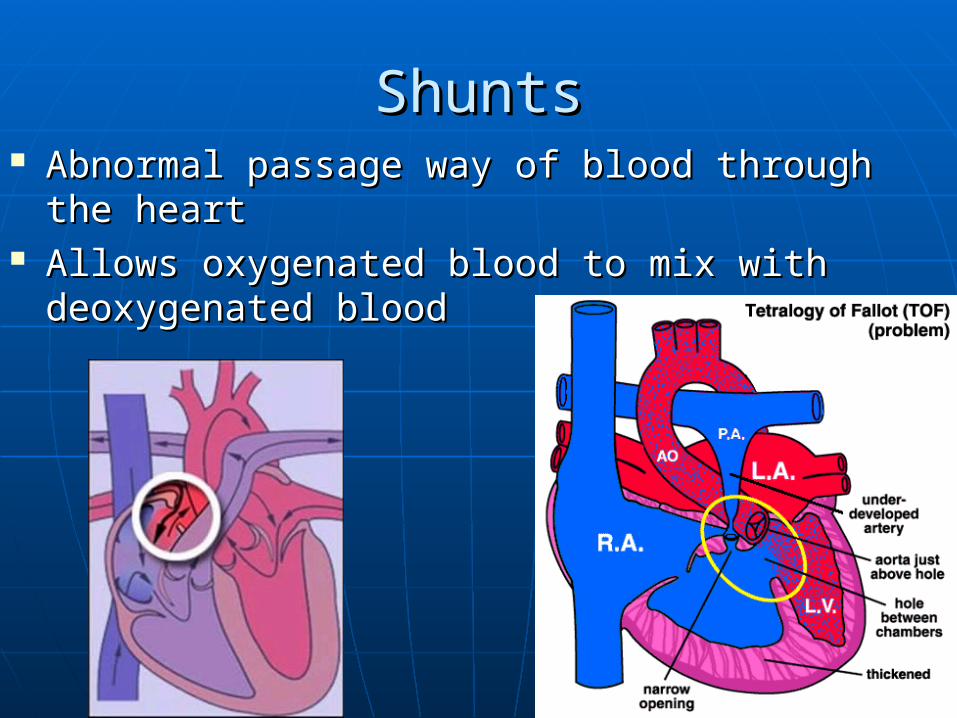
ShuntsShunts Abnormal passage way of blood through the Abnormal passage way of blood through the
heartheart Allows oxygenated blood to mix with Allows oxygenated blood to mix with
deoxygenated blooddeoxygenated blood

Lung FunctionLung Function
Tests the function Tests the function of the lungsof the lungs• Total Lung CapacityTotal Lung Capacity• Functional Residual Functional Residual
Capacity averages Capacity averages 3L3L
• Residual Volume Residual Volume averages 1.5Laverages 1.5L
• Expiratory Reserve Expiratory Reserve Volume averages Volume averages 1.5L1.5L

Cardiac CatheterizationCardiac Catheterization Introduce a series of Introduce a series of
catheters to gain catheters to gain information inside the information inside the heart.heart.
Cardiac Output normal Cardiac Output normal 55% Left Ventricle and 55% Left Ventricle and 45% Right Ventricle 45% Right Ventricle ejection fractionsejection fractions
Oxygen Saturation Oxygen Saturation inside the heart inside the heart chambers >75% on chambers >75% on the Right and >95% the Right and >95% on the Lefton the Left

Cardiac Catheterization ProcedureCardiac Catheterization Procedure
Prepped: Shaved, Prepped: Shaved, Cleaned and CoveredCleaned and Covered
Conscious SedationConscious Sedation Local Anesthetic to Local Anesthetic to
Entry SiteEntry Site Small Incision about Small Incision about
2mm Made2mm Made Artery is Found then Artery is Found then
Accessed Using the Accessed Using the Seldinger TechniqueSeldinger Technique

Seldinger TechniqueSeldinger Technique
Both Walls are Both Walls are PuncturedPunctured
Stylet is RemovedStylet is Removed Cannula is Withdrawn Cannula is Withdrawn
until Arterial Blood until Arterial Blood Flowback is PresentFlowback is Present
Guide Wire is InsertedGuide Wire is Inserted Cannula RemovedCannula Removed A Sheath is Slid over A Sheath is Slid over
Guide Wire then Guide Guide Wire then Guide Wire is RemovedWire is Removed

Access With CathetersAccess With Catheters
Catheters will be Introduced Catheters will be Introduced Depending on which Chamber is Depending on which Chamber is Desired.Desired.
Blood Samples can be Obtained Blood Samples can be Obtained through the Catheters for Saturation through the Catheters for Saturation Levels.Levels.
Contrast can be Injected for Contrast can be Injected for VentriculogramsVentriculograms

Cardiac Ejection FractionCardiac Ejection FractionVentriculogram
Calculating the ejection fraction of the ventricle is accomplished by defining the edge of the ventricle wall during systole and diastole (top), by tracing the borders (bottom), and allowing the computer to do its work.

ConclusionConclusion
Doctors Have Found No Doctors Have Found No Cause for the Lowered Cause for the Lowered Saturation Levels or any Saturation Levels or any Problems Caused by the Problems Caused by the Lowered Levels.Lowered Levels.
Planning the Planning the Catheterization Procedure Catheterization Procedure after Graduationafter Graduation
I am a FREAK of ScienceI am a FREAK of Science

Stay In School!Stay In School!