overview presentation on demerger...overview presentation on demerger july 2007 this presentation is...
TRANSCRIPT

OVERVIEW PRESENTATION ON DEMERGER
July 2007This presentation is being made only to and is directed only at (a) persons who have professional experience in matters relating to investments falling within Article 19(1) of the Financial Services and Markets Act 2000 (Financial Promotion) Order 2005 (the “Order”) or (b) high net worth entities, and other persons to whom it may otherwise lawfully be communicated, falling within Article 49(1) of the Order (all such persons together being referred to as “relevant persons”). Any person who is not a relevant person should not act or rely on this presentation or any of its contents.

PAGE 1
OVERVIEW OF THE MONDI DEMERGER
� Dual listed company structure (DLC)
� Primary listings:
� Mondi plc – LSE main market
� Mondi LTD – Johannesburg Stock Exchange
� Secondary listing – Mondi plc on the Johannesburg Stock Exchange
Listing
� 100% demerger
� No capital raising by either Mondi or Anglo American
� For every 20 Anglo American plc Ordinary Shares held:
� 5 Mondi Plc (“MPLC”) Ordinary Shares
� 2 Mondi Limited (“MLTD”) Ordinary Shares
Structure
� Goldman Sachs International (UK)
� UBS Limited (UK, SA)Joint Sponsors
Friday 01 June 2007
Monday 25 June 2007
Tuesday 03 July 2007
Time Table
� Mondi prospectus published and circular sent to Anglo American shareholders
� Anglo American shareholder meeting
� Expected admission to listing, start of trading

PAGE 2
EXPERIENCED MANAGEMENT TEAM
Relevant experience� CFO BPB plc � CFO De La Rue plc � CFO Ransomes plc
Relevant experience� Corporate Development
Director Mondi Europe� VP Corporate Finance
Anglo American
Relevant experience� Member of Management
Board MBP� Production Director MBP
Relevant experience� CEO MP Corr. Bus.� CEO MP Bag Conv. and
Flex.� Plant Manager Bags
Maastricht� Corporate Controller
Frantschach Group
Relevant experience� Member of Board of
Management of Zellstoff Pöls
� CFO MBP� Senior Consultant Ernst
& Whinney
Relevant experience� CEO Mondi Europe� Financial Director Mondi Group� Divisional Finance Manager Anglo American
Relevant experience� Chairman Pensions
Trustees AMEC plc� Director UK Airports and
Heathrow Airport BA� HR Director BA
Kurt Mitterböck(Technical/
Procurement)55 years old
Peter Oswald (CEO MP)
44 years old
Günther Hassler (CEO MBP)48 years old
Andrew King(Strategy/BD)37 years old
Paul Hollingworth
(CFO)47 years old
David Hathorn(CEO)
45 years oldMervyn Walker
(HR/Legal)48 years old
PAGE 3
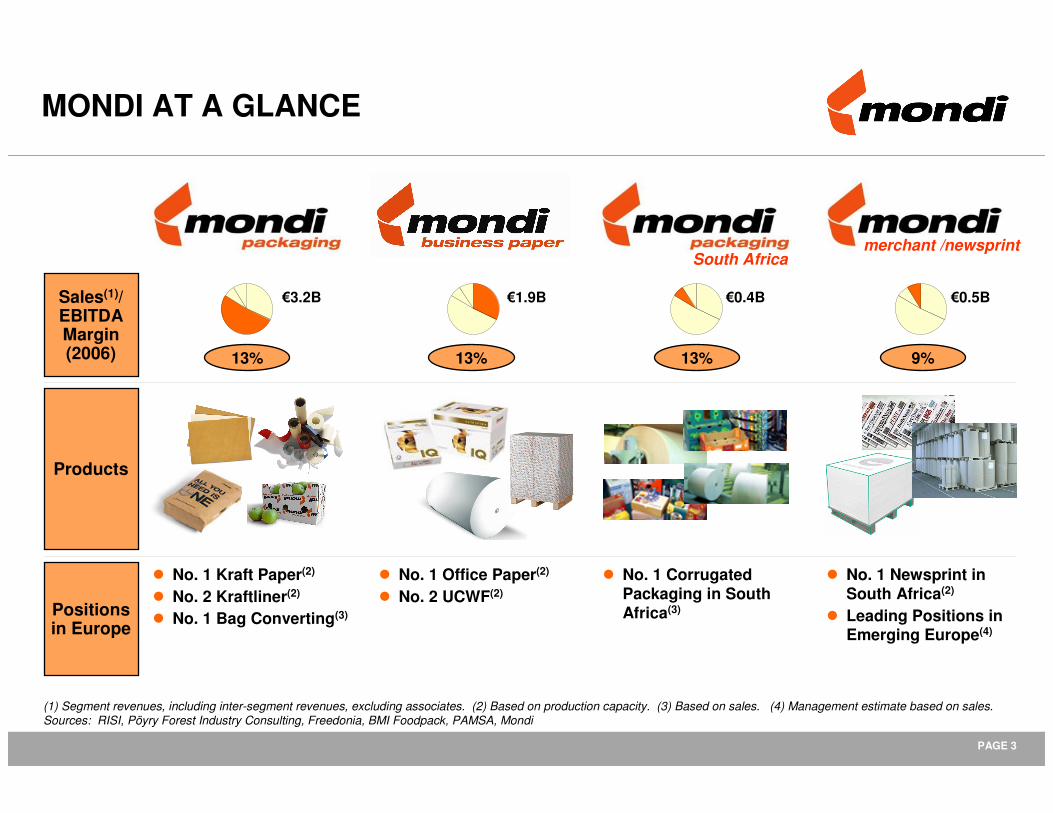
MONDI AT A GLANCE
Sales(1)/EBITDA Margin (2006)
Products
Positions in Europe
�0.4B
South Africa
�0.5B
merchant /newsprint
13% 9%
�3.2B
13%
� No. 1 Kraft Paper(2)
� No. 2 Kraftliner(2)
� No. 1 Bag Converting(3)
� No. 1 Corrugated Packaging in South Africa(3)
� No. 1 Newsprint in South Africa(2)
� Leading Positions in Emerging Europe(4)
�1.9B
13%
� No. 1 Office Paper(2)
� No. 2 UCWF(2)
(1) Segment revenues, including inter-segment revenues, excluding associates. (2) Based on production capacity. (3) Based on sales. (4) Management estimate based on sales.Sources: RISI, Pöyry Forest Industry Consulting, Freedonia, BMI Foodpack, PAMSA, Mondi

PAGE 4
ROCEMondiGroup
MondiGroup
vs.peers (index)
MONDI GROUP OUTPERFORMANCE VS. PEERS
21% 17% 11% 9%18%
Notes: (a) Mondi ROCE figures stated as reported by Mondi. (b) Competitors' ROCE figures average unweighted.Source: Public filings of peers and Mondi internal filings
8%
147197 203
131 144109
2001 2002 2003 2004 2005 2006
Ø peer= 100
Strong asset base
Leading market position
+
Focus on performance
+
Outperforming its peers
=
2.0%
4.0%
6.0%
8.0%
10.0%
12.0%
14.0%
(10.0)% (5.0)% 0.0% 5.0% 10.0% 15.0% 20.0%
Sales CAGR in Local Currency 2001-2006 (%) �6bn Sales 2006
SCA
Int.Paper
M-real Smurfit-Stone
UPM
DS Smith
MeadWestvaco
Domtar
Portucel¹
PCA
StoraEnso
Weyer-hauser
Mondi
SmurfitKappa²
Wei
ghte
d A
vera
ge R
OC
E3
2001
-200
6
Sappi
(1) Data per 2001-2005A. (2) Data per 2003-2006A. (3) ROCE = EBIT (before special items)/CE = St borrowing + Lt borrowing + pref. equity + minority interest + total common equity– cash and near cash.

PAGE 5
MONDI STRATEGIC DRIVERS
� Upstream production cost advantages� Vertically integrated
Strong asset base
+
=
� Comprehensive Business Excellence programmes� Proven M&A/integration track record
� Rigorous asset allocation management
Focus on performance
� Outperformed peers measured by ROCE over the cycleOutperforming its peers
� Well placed to benefit from any upcycle
� Continued focus on profitability and value-added growth in attractive segments
Value creation
� Leading market positions � High exposure to attractive product segments and geographies
Strong market position
+

PAGE 6
1. Walki Wisa 9%2. Mondi 8%3. Amcor NA4. Stora Enso NA5. Schoeller NA
1. Avery Dennison 24%2. Raflatac 16%3. Mondi 9%4. Loparex 7%5. Huhtamaki 4%
1. Smurfit Kappa 27%2. Mondi 12%3. SCA 11%4. Ilim Pulp 8%5. Europac 5%
1. Mondi 21%2. Billerud 14%3. UPM 9%4. Segezha 7%5. Stora Enso 7%
LEADING MARKET SHARES
Strong market position
1. Smurfit Kappa 18%2. SCA 9%3. Mondi 4%4. DS Smith 4%4. International Paper 4%4. SAICA 4%
Corrugated Packaging(2)(3)Kraftliner(1)
1. Mondi 15%2. Segezha 7%3. Smurfit Kappa 5%4. Brit. Polythene 4%5. Bischof + Klein 3%
Bag
Bag Converting(4)Kraft Paper(1)
Corrugated
Flexibles
Extrusion Coating (4)(5)Release Liner(4)(5)
Top 5 Uncoated Woodfree
Top 5 Office Paper
Mondi BP generates approximately 65% of UCWF sales in faster growing Office Paper segment
Stora Enso
M-Real
Mondi
IP
Portucel
16%
11%
13%
10%
10%
Stora Enso
M-Real
Mondi
IP
Portucel
17%
14%
16%
13%
11%
(1) Based on capacity. (2) Based on demand. (3) Based on ICCA forecasts of market size for 2006. (4) Based on sales. (5) No public information available, market shares are Mondi estimates.Sources: Mondi, RISI, ICCA, Freedonia, Pöyry Forest Industry Consulting, company filings, Henry Poole
Packaging Office Paper

PAGE 7
(1) Excluding acquisitions.Sources: Pöyry Forest Industry Consulting, Mondi
SIGNIFICANT EXPOSURE TO GOOD GROWTH SEGMENTS
Mondi Group Sales 2006 Mondi Group Net Operating Assets 2006Strong market position
Emerging MarketsMature Markets
0
100
200
300
400
500
600
2004 2005 2006
Capital Expenditures (�M)(1)
70%
30%
75%
25%
Mature markets: �0.5B
� ~47% maintenance� ~53% expansion
Emerging markets:�1.1B
� ~34% maintenance
� ~66% expansionLarge investments create major upside in cyclical upturn
61%
39%
+
Strong market position
Strong asset base
55%45% 38%62%

PAGE 8
UPSTREAM PRODUCTION COST ADVANTAGES LOW-COST POSITIONS
Universal Office Paper
Note: The graphs show delivered cost to Frankfurt, Germany.Sources: Pöyry Forest Industry Consulting, Mondi
Mondi Paper Machines
+
Unbleached KraftlinerWhite-top Kraftliner
Cumulative capacity (Kt/a)
00 3,000
100% of Mondi Unbleached
Kraftliner capacity
�/t 1,500
91% of Mondi Universal Office Paper Capacity
00 3,500Cumulative capacity (Kt/a)
Cumulative capacity (Kt/a)
�/t 800
1,400
100% of Mondi White-top Kraftliner
capacity
00
�/t 500
Strong market position
Strong asset base
PAGE 9
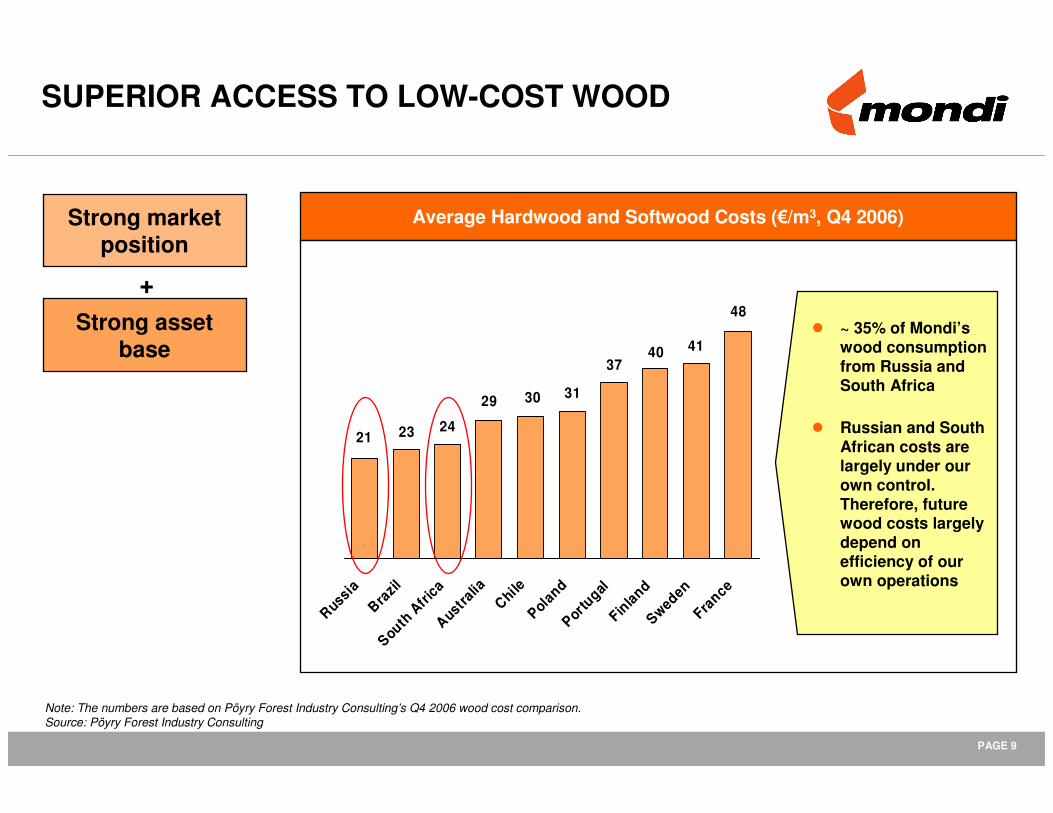
SUPERIOR ACCESS TO LOW-COST WOOD
Average Hardwood and Softwood Costs (�/m3, Q4 2006)
� ~ 35% of Mondi’s wood consumption from Russia and South Africa
� Russian and South African costs are largely under our own control. Therefore, future wood costs largely depend on efficiency of our own operations
48
3029
23
40 4137
31
2421
RussiaBra
zilSouth
Afri
caAustra
liaChile
PolandPortu
galFinlandSweden
France
+
Strong market position
Strong asset base
Note: The numbers are based on Pöyry Forest Industry Consulting’s Q4 2006 wood cost comparison.Source: Pöyry Forest Industry Consulting

PAGE 10
PLANNED MAJOR INVESTMENTS
SYKTYVKAR MILL EXPANSION� Modernisation and Expansion� Investment cost of �525M
� 3-4 yr investment period� Completion expected mid-2010
Universal Business Paper Cost Curve
200
400
600
800
1,000
1,200
0 1,000 2,000 3,000 4,000Cumulative capacity (1 000 t/a)
Syktyvkar PM14
�/t
+
Strong market position
Strong asset base
CONTAINERBOARD EXPANSION� New 470,000t lightweight recycled
containerboard machine and corrugated box plant� Capacity of c.250M m2/year
� Investment cost c.�350M� In final feasibility
� Start up mid-late 2009
100
150
200
250
300
350
0 5,000 10,000
Cumulative capacity (1 000 t/a)
�/t
Recycled Fluting Cost Curve
PM CEE Light
� Likely to be located at our Polish operations
� Additional volume is required to supply the high growth Emerging European markets
� Targeted to be clear cost leader in Europe
� Exposed to strong growth in demand for UCWF and containerboard in the domestic Russian market
� Well located to exploit the low-cost wood resources

PAGE 11
BENEFITING FROM INTEGRATED VALUE CHAIN
(1) Refers to Mondi’s demand and self-sufficiency of packaging paper (including MP and MPSA). Paper is the end product for non-packaging businesses.Notes: 2006 figures. Forestry figures are based on annual allowable cut (excluding firewood).Source: Mondi
Mondi’s own availability
Mondi’s own demand
Forestry Pulp Paper
Potential self sufficiency 51%
7.6mm3
14.8mm3
91%
3.5Mt
3.8Mt
154%(1)
5.8MtPackaging: 3.3Mt
2.1Mt(1)
+
Strong market position
Strong asset base

PAGE 12
DISCIPLINED AND VALUE-ORIENTED M&A
� Sustainable low-costadvantage
� Restructuring and optimisation potential
� Attractive positions in Emerging Markets
(1) Acquisition of part of business. (2) Share currently held: Syktyvkar 98%, Ruzomberok 51%. Mondi acquired 19.4% of Syktyvkar shares in 1997, 71.9% in 2002 and the remaining 6.7% thereafter. (3) Multiple average of Mondi weighted by Enterprise Value.
Note: The acquisition of Lenco, a South African Plastics Business, is excluded as regulator approval has not yet been received. Source: Mondi
Target
Napiag (A)
S&E (D, ITA), NBG (A)
Stambolijski (BG)
Akrosil (US, NL)
Bauernfeind (Europe)
Copamex (MEX)(1)
Syktyvkar (RUS)(2)
La Rochette (F, UK)
Danisco (UK)
Ruzomberok (SK)(2)
AssiDomän (Europe)(1)
Year
2007
2006
2006
2006
2004
2004
2002
2002
2001
2000
2000
Business
Flexibles
Flexibles
Bag
Flexibles
Corrugated
Bag
MBP
Corrugated
Corrugated
MBP
Bag, Flex.
EV/EBITDA multiple:
Mondi4.4x(3)
Regular review of acquisitions and integration to optimise value
M&A Strategy Major M&A Deals since 2000
+
Strong market position
Strong asset base
+Focus on
performance

PAGE 13
PERFORMANCE IMPROVEMENTSIN ACQUIRED COMPANIES
(1) First full year of acquisition. (2) Including forest workers. (3) CAGR.Note: Tons per capita based on employees year average Source: Mondi
Syktyvkar(2) (tonnes per capita)
2002 200683
Swiecie (tonnes per capita)
1997 2006
132902
24% p.a.(3)
� Leverage synergies with existing operations
� Transfer know-how
� Improve efficiency
� Improve product mix
� Closures/divestitures of underperforming sites
Ruzomberok (tonnes per capita)
2000 2006160
484
Integration Principles
(1)
(1)
(1)
135
20% p.a.(3)
13% p.a.(3)
+
Strong market position
Strong asset base
+Focus on
performance

PAGE 14
ACQUISITIONS PRIMARY GROWTH DRIVER
2000 Organicgrowth 2000-06
Acquiredgrowth 2000-06
2006
(1) (1)
(1) Growth figures refer to Compound Annual Growth Rate (CAGR), calculated as change in volume FY 2000 vs. FY 2006. (2) Any volume growth 12 rolling months after the first consolidation date is accounted for as organic growth.
Source: Mondi
2,768
5,784
Breakdown of Paper Production Volume Growth (Kt)
Of which 542 subsequent to M&A(2)
Total Growth: 3,016� Organic: 1,206
� Acquired: 1,810
CAGR(1) : 13%
5%
8%+
Strong market position
Strong asset base
+Focus on
performance

PAGE 15
RIGOROUS ASSET MANAGEMENT
Note: Closures and divestitures including activities within MBP and MP.Source: Mondi
� Reduced Testliner capacity by 11% in 2004(~110Kt; 2 plants)
� Closed 11% of corrugated board capacity (~280mm2) since 2004
� Sale/conversion of Dunaújváros in 2006 represents a substantial capacity reduction in UCWF (~110Kt from 2007 onwards)
� Closed 32 packaging converting plants since 2002
� Divested 30 packaging converting plants since 2002
+
Strong market position
Strong asset base
+Focus on
performance

PAGE 16
300
600
900
1,200
FIVE YEAR RECORD
Group Revenue
EBITDA
% Margin
Underlying Operating Profit
% Margin
Capital Employed
% Return
5,751 5,051 5,005 5,385 5,364
726N/A 873 779 718
12.6%N/A 17.4% 14.5% 13.4%
377 686 579 459 386
6.6%13.6% 11.7% 8.5% 7.2%
4,757 3,339 3,496 4,422 4,667
8%21% 17% 11% 9%
Note: N/A – not previously disclosed publicly.
2006IFRS
2002UK GAAP
2003UK GAAP
2004IFRS
2005IFRS
Uncoated Woodfree Prices Kraftliner PricesUncoated Woodfree Prices Kraftliner Prices
�/tonne

PAGE 17
Group Revenue (�M) EBITDA Margin (%) Operating Margin(1) (%)
BUSINESS UNIT THREE YEAR RECORD
Mondi Packaging 3,1672,848 2,902 13.014.9 14.1 7.18.7 7.8
Business Paper 1,8891,766 1,752 12.514.5 14.1 5.58.1 7.4
MPSA 360348 359 12.814.7 11.7 9.711.5 8.9
Merchant and Newsprint 539521 509 8.99.0 7.5 5.45.2 3.5
Other and Inter-company (204)(98) (158) –– – –– –
Total 5,7515,385 5,364 12.614.5 13.4 6.68.5 7.2
20062004 2005 20062004 2005 2004 2005 2006
(1) Underlying Operating Profit Margin.
CAGR
5.5%
3.4%
1.7%
1.7%
3.3%

PAGE 18
MONDI GROUP KEY FINANCIALS
Capital Expenditure
� Major recent capex investments include:
� Richards Bay – RB 720 � 250M� Merebank – PM 31 rebuild � 175M� Ruzomberok – Pulp mill rebuild � 136M
� Capex targeted at low cost resource� Maintenance capex targeted at circa 60% of depreciation and
amortisation
Cost Base
� There will be increased corporate costs post demerger
Cost Structure 2006
Personnel Costs 17%
Variable Selling Expense 10%
Energy 7%
Maintenance 6%
Other Variable Costs16%
Other Operating Expenses
6%
Depreciation/ Amortisation
7%
Wood, Pulp and Fibre 33%
0
100
200
300
400
500
600
700
2004 2005 20060%2%4%6%8%10%12%14%16%
Mature MarketsEmerging Markets
460
618551
�M
8.0%
11.5%10.3%
Capex/Sales
0
100
200
2004 2005 2006
2.8%
3.9% 3.6%
% of cash cost
Gross Cost Reduction Initiatives (�M)

PAGE 19
MONDI GROUP KEY FINANCIALS
Borrowing Facilities Dividends
� Net debt at demerger estimated at circa �1.5B
� Targeting investment grade rating
� Negotiating a new �1.75B committed debt facility
� �1.55B of new facility in Mondi plc for five years with
ZAR 2B (�0.2B) in Mondi LTD for three years
� In addition Mondi has existing Group committed
facilities of circa �0.9B at varying maturities
� Targeting one covenant of net debt to EBITDA of 3.5x
� Cross guarantees will be in place between Mondi plc
and Mondi LTD
� Would expect to make an interim dividend payment in 2007
� Dividends will be determined by new board going forward, and expected to take into account:
� Actual Mondi trading
� Both peer group and market dividend policies
� Target of 2-3 times earnings coverage on average over the cycle
� In the absence of unforeseen circumstances, the Board would have recommended distributing a dividend of 20 Euro cents per share for 2006 assuming that the demerger had been effective for the full year
(1)
(1) Implied underlying Mondi shares outstanding of 518 million, being the pro forma combined number of shares that is expected to be in issue upon admission.

OVERVIEW PRESENTATION ON DEMERGER APPENDIX
July 2007

PAGE 21
INDUSTRY FUNDAMENTALS: EUROPEAN CONTAINERBOARD AND CORRUGATED PACKAGING
� Demand
� Demand for corrugated packaging in Europe grew by 2.7% per annum from 2000 to 2006, driven by strong growth in Emerging Europe of 11% per annum(1). Over the 2004 to 2006 period, demand grew by around 2.4Mt
� Future demand growth is expected to be broadly in line with these historic trends
� 2.7% growth on 2006 demand of around 25Mt represents around 0.68Mt
� Supply� Total European containerboard capacity increases
between 2004 and 2006 of around 3.8Mtpa offset by capacity closures of around 2.4Mtpa, gave a net increase in capacity over the period of around 1.4Mtpa (excluding capacity creep)
� Recent significant capacity increases now absorbed into the market. No new paper machines announced to come on line in 2007/2008
� Rationalisation of kraftliner capacity in North America has contributed to reduced imports to Europe
200
250
300
350
400
450
500
550
600
650
2001 2002 2003 2004 2005 2006 2007
�/to
nne
Kraftliner 175gTestliner 2
(2)
(1) Growth on tonnage basis 2000 to 2006 based on 2006 forecasts. (2) Q4 2001 – Q1 2007.Sources: ICCA, RISI, Pöyry Forest Industry Consulting
(2)

PAGE 22
INDUSTRY FUNDAMENTALS: EUROPEAN UNCOATED WOODFREE PAPER
� Demand� European uncoated woodfree demand grew by 3%
per annum in the period from 2000 to 2006, driven by strong growth in the office paper segment of around 4% per annum(1)
� Within the office paper segment, growth mainly attributed to strong growth in Emerging Europe. Growth in Emerging Europe was around 7% over 2005-2006(2)
� Moderate demand growth anticipated to continue, with Emerging Europe exhibiting the strongest growth in the region albeit at lower levels than experienced over the 2000 to 2006 period
� 3% demand growth on total 2006 demand of around 11.8Mt represents around 0.35Mt
� Supply� Announced European capacity closures in 2006 of
180Ktpa, with further closures of 540Ktpa announced for 2007
� Global capacity is expected to grow in line with demand, with most new capacity planned for Asia in response to strong Chinese demand growth.
� Only announced major expansion in Europe is a new 500Ktpa machine at Portucel’s Setubal mill, planned for commissioning in 2009
600
700
800
900
1,000
1,100
1,200
2001 2002 2003 2004 2005 2006 2007
�/to
nne
UCWF
(3) (3)
(1) Volume growth based on 2000 to 2006 demand estimates by Pöyry Forest Industry Consulting. (2) Demand estimates by Pöyry Forest Industry Consulting. (3) Q4 2001 – Q1 2007.
Sources: Mondi, Pöyry Forest Industry Consulting, CEPIFINE, RISI

PAGE 23
Note: Dotted lines represent average 1990 - Q1 2007.Source: Pöyry Forest Industry Consulting
+
Strong market position
Strong asset base
+Focus on
performance
=Outperforming
its peers
MONDI WELL PLACED TO BENEFIT FROM UPTURN IN PAPER PRICING
300
400
500
600
700
800
900
1,000
1,100
1,200
1990
1991
1992
1993
1994
1995
1996
1997
1998
1999
2000
2001
2002
2003
2004
2005
2006
2007
Uncoated Woodfree A4 B-Grade Copy Office Paper
Kraftliner 175g
Average Delivered Prices in Europe
�/to
nne

PAGE 24
Growth of Office PCs Drives Office Paper Growth
OFFICE PAPER DEMAND GROWTH EXPECTED TO CONTINUE
Office Paper used for “Work in progress”and “Reading”
Office Paper used for “Archiving”and “Distributing”
� Paper with inherent advantages
� Flexibility/portability� Possibility to annotate� Navigation
� Electronic processes often with advantages –ongoing substitution
� Overall increase in number of Office Paper users over-riding effect
(1) According to IDC.Sources: BCG, EIU, EMGE, IDC, Mondi, PPI
0
2
4
6
8
10
12
14
16
18
20
0 100 200 300 400 500
United States
United Kingdom
Germany
Italy
MexicoPoland
RussiaChina
Office PCs per1,000 heads (2003)
Office Paper consumption per head (kg, 2003)
PC penetration CAGR 2003-2010(1)
+4%
+6%
+6%
+9%
+16%
+19%
+6%
+8%
Detailed Understanding of Usage Patterns Strong market position

PAGE 25
KEY FEATURES OF THE DLC STRUCTURE
� Single Corporate Group
� MPLC and MLTD separate legal entities with separate stock exchange listings
� Unified boards and management
� Head office located in South Africa by December 2008
� Shareholders of both companies effectively vote together as a single decision making body
� Cross guarantees between MPLC and MLTD
� Any takeover offer must be made to shareholders of both MPLC and MLTD
MPLC Ordinary Shareholders
MLTD Ordinary Shareholders
MPLC MLTD
Non - African Operations African Operations
SINGLE CORPORATE GROUP
Sharing Agreement
Equalisation Ratio 1:1
PAGE 26
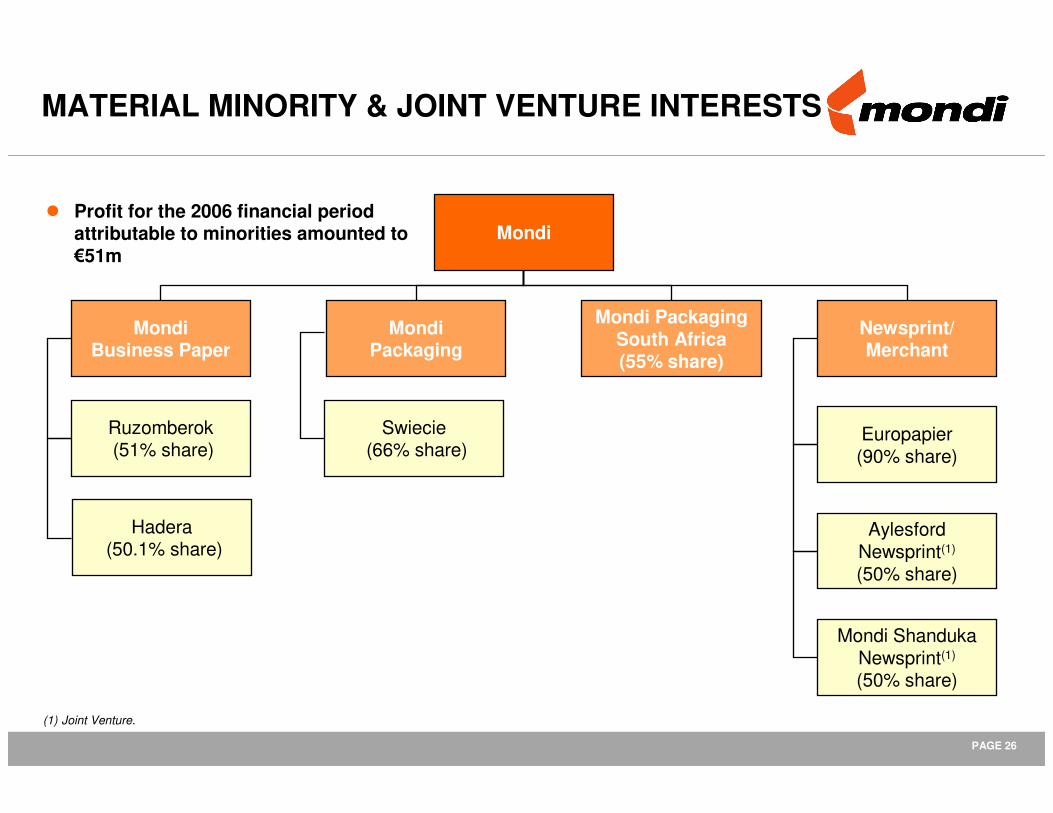
(1) Joint Venture.
Mondi Business Paper
MondiPackaging
Mondi Packaging South Africa (55% share)
Newsprint/Merchant
Mondi
Europapier (90% share)
Swiecie(66% share)
Aylesford Newsprint(1)
(50% share)
Ruzomberok(51% share)
Mondi Shanduka Newsprint(1)
(50% share)
Hadera(50.1% share)
MATERIAL MINORITY & JOINT VENTURE INTERESTS
� Profit for the 2006 financial period attributable to minorities amounted to �51m
