cylesdale demerger and ipo short form presentation€¦ · clydesdale demerger and ipo short form...
TRANSCRIPT

Clydesdale demerger and IPO Short Form Presentation
8 December 2015
NOT FOR RELEASE, PUBLICATION OR DISTRIBUTION, IN WHOLE OR IN PART, DIRECTLY OR INDIRECTLY, IN OR INTO OR FROM THE UNITED STATES, CANADA OR ANY OTHER JURISDICTION WHERE IT IS UNLAWFUL TO DISTRIBUTE THIS ANNOUNCEMENT
National Australia Bank Limited ABN 12 004 044 937

Please read the following before continuing.
This presentation does not contain or constitute an offer of, or the solicitation of an offer to buy or subscribe for any securities to any person in any jurisdiction. Nor is it contemplated any retail offer will be made as part of any IPO.
The information contained in this presentation is for background purposes only and does not purport to be full or complete. No reliance may be placed for any purpose on the information contained in this presentation or its accuracy, fairness or completeness. This presentation is not intended to be relied upon as advice to investors or potential investors and does not take into account the investment objectives, financial situation or needs of any particular investor.
Neither this presentation nor the information contained herein is for publication, distribution or release, in whole or in part, directly or indirectly, in or into or from the United States (including its territories and possessions, any State of the United States and the District of Columbia), Canada, Japan or any other jurisdiction where to do so would constitute a violation of the relevant laws of such jurisdiction. The distribution of this presentation may be restricted by law in certain jurisdictions and persons into whose possession any document or other information referred to herein comes should inform themselves about and observe any such restriction. Any failure to comply with these restrictions may constitute a violation of the securities laws of any such jurisdiction.
This presentation does not constitute a disclosure document under the Australian Corporations Act 2001 (Cth) (“Corporations Act”) or a product disclosure statement under Chapter 7 of the Corporations Act and will not be lodged with the Australian Securities and Investments Commission. This presentation is not, and under no circumstances is to be construed as, an advertisement or a public offering of any securities in Australia.
This presentation is not addressed to the public (i) in the United Kingdom or (ii) in any other Member State of the European Economic Area (“EEA”). In the event that an Institutional Offer proceeds, any investment in such offer may be made available only to (a) persons in member states of the ("EEA") who are qualified investors within the meaning of Article 2(1)(e) of the Prospectus Directive (Directive 2003/71/EC as amended, including by Directive 2010/73/EC) ("Qualified Investors") and (b) in the UK to Qualified Investors who are (i) are persons who have professional experience in matters relating to investments falling within Article 19(5) of the Financial Services and Markets Act 2000 (Financial Promotion) Order 2005, as amended (the "Order") or (ii) are persons who are high net worth entities falling within Article 49(2)(a) to (d) of the Order. This presentation must not be acted on or relied on (i) in the United Kingdom, by persons who are not relevant persons, and (ii) in any member state of the EEA other than the United Kingdom, by persons who are not Qualified Investors. Any investment or investment activity to which this presentation relates is available only to relevant persons in the United Kingdom and Qualified Investors in any member state of the EEA other than the United Kingdom, and will be engaged in only with such persons.
This presentation does not contain or constitute an offer of, or the solicitation of an offer to buy or subscribe for any securities to any person in any jurisdiction, including the United States, Australia, Canada or Japan. No securities may be offered or sold, directly or indirectly, in the United States unless registered under the United States Securities Act of 1933, as amended (the "US Securities Act") or offered in a transaction exempt from, or not subject to, the registration requirements of the US Securities Act. No offer or sale of any securities has been registered under the US Securities Act or under the applicable securities laws of Australia, Canada or Japan.
This presentation contains statements that are, or may be deemed to be, "forward-looking statements".
These forward-looking statements may be identified by the use of forward-looking terminology, including the terms "believe", "estimate", "plan", "project", "anticipate", "expect", "intend", “likely”, "may", "will", “could” or "should" or, in each case, their negative or other variations or other similar expressions, or by discussions of strategy, plans, objectives, targets, goals, future events or intentions. Such forward-looking statements are not guarantees of future performance and involve known and unknown risks, uncertainties and other factors, many of which are beyond the control of NAB and its respective affiliates (the “Group”), which may cause actual results to differ materially from those expressed or implied in such statements. There can be no assurance that actual outcomes will not differ materially from these statements. Further information on important factors that could cause actual results to differ materially from those projected in such statements is contained in the Group’s Annual Financial Report.
The Group expressly disclaims any obligation or undertaking to update, review or revise any of the forward looking statement contained in this presentation whether as a result of new information, future developments or otherwise.
To the maximum extent permitted by law, the Group, its advisers, affiliates, related bodies corporate, directors, officers, partners, employees and agents:
• Exclude and disclaim all liability (including without limitation for negligence) for any expense, loss, damage or cost incurred as a result of the information in this presentation being inaccurate or incomplete in any way for any reason; and
• Make no representation or warranty, express or implied, as to the currency, accuracy, reliability or completeness of information in this presentation.
NAB uses certain performance measures that are not statutory financial measures such as Cash Earnings and Underlying Profit as it better reflects what NAB considers to be the underlying performance of NAB. These measures are collectively referred to as non-IFRS financial measures and are not presented in accordance with Australian Accounting Standards. Further information regarding non-IFRS measures can be found in NAB’s Annual Financial Report for the year ended 30 September 2015, including how these measures are defined and a full reconciliation of cash earnings to statutory net profit attributable to owners.
CYBG Group also presents income statement data on a Management Basis and certain key non-statutory performance indicators as they reflect what CYBG Group considers to be useful supplementary information to assist in evaluating the underlying operating performance of CYBG Group. Refer to Section 3 of the Scheme Booklet for further details including the reconciliation of the CYBG HFI to the Management Basis.
IMPORTANT INFORMATION
2

3
Transaction summary
• Premium listing of shares on the Official List of the UKLA and the Main Market of the London Stock Exchange and concurrent listing of CHESSDepositary Interests (CDIs) on the Australian Securities Exchange on a foreign exempt basis
• Expected to qualify for full FTSE250 and S&P/ASX index inclusion
• Company: CYBG PLC ("Clydesdale"), which will become the holding company of CYB Investments Limited (formerly known as National Australia Group Europe Limited ("NAGE"))
• Seller: National Australia Bank Limited (“NAB”)
• 100% of Clydesdale expected to be distributed via a demerger and IPO• 75% to be distributed to NAB shareholders via demerger and up to 25% offered via IPO• Demerger and IPO proposed to be effective simultaneously• Greenshoe on the IPO component (inclusive within the IPO percentage, i.e. base offer size of 21.7% and Greenshoe of 3.3%)• Sale facility offered to small shareholders in NAB (who hold 2,000 NAB shares or less)
• 100% Secondary (no primary capital raised), all proceeds of the IPO to NAB
• Demerger of 75% of Clydesdale to NAB shareholders, and divestment of up to 25% by IPO to institutional investors• Demerger will be effected via a court-approved Scheme of Arrangement. The demerger will not be conditional on the IPO occurring• The proposed IPO and Demerger will be structured as a three cornered demerger with CYBG PLC as the newly formed holding company of
Clydesdale Bank PLC and CYB Investments Limited (formerly, National Australia Group Europe Limited)• IPO: Private placement to institutional investors in the EEA, 144A private placement to QIBs in the US, and Reg S complied offering outside the US• No retail offer• Timetable:
− Management roadshow: 8th – 11th Dec. 2015 (Australia) and 18th Jan. – 1st Feb. 2016 (Global) − PDIE: 15th – 18th Dec. 2015 (Australia) and 4th – 16th Jan. 2016 (Global)
• Global Co-ordinators: Morgan Stanley (sponsor), Macquarie Capital, BofA Merrill Lynch• Joint bookrunner: J.P. Morgan Cazenove• Co-leads: KBW, Royal Bank of Canada
Listing location
Company and Seller
Offering size
Use of proceeds
Transaction structure
Global coordinators and bookrunners

Investment highlights summary
4
Differentiated proposition relative to the UK challengers
Robust and de-risked balance sheet
Proven ability to attract and retain low cost customer deposits
Track-record of strong asset growth, while maintaining asset quality
Standalone and scalable full service operating platform
1
2
Strong fundamentals underpin the CYBG value proposition
3
4
5
Upside from execution
Highly experienced management team, leading a newly independent CYBG
Disciplined investment plan, delivering cost and efficiency savings
Omni-channel strategy underpinned by comprehensive digital agenda
Clear strategy to drive growth and deliver double digit RoTE
1
2
3
4

Established franchise positioning
5
275 Retail branches
154 Yorkshire
40 Business and private banking centres
Clydesdale 121
Current network 2015
Large existing customer base
– 2.6m Retail and 179k SME
Strong market shares in core regions
– 9.1% PCA share and 8.1% business lending share(1)
Loyal customer base
– 78% PCA customers with us > 10 years; 42% primary PCA(8)
Two well known and trusted brands
– Clydesdale and Yorkshire Bank
Recognised superior customer service
– NPS score ahead of peers(2); #1 “best customer service (branch)”(3)
Track record across key distribution channels
– 11 years in intermediary market – c.3% national lending share(4)
Underpinned by a proven platform with a clear plan to be standalone
– Ability to expand 2x peak transaction capacity
1. BBA 1Q2015 SME lending stock; 2. Defined as net promoter score. Peers: YB - Barclays, Co-Op, Halifax, HSBC, Lloyds, Nationwide, NatWest, Santander, TSB / CB - Bank of Scotland, RBS, Santander, TSB; 3. uSwitch annual customer survey responses, based on 10,000 current account customers survey during 9th to 16th March 2015. Ranking and response pertaining to Clydesdale Bank only not CYBG; 4.Estimate based on 60% (from CML Regulated Mortgage Survey) as proxy for overall intermediary lending as proportion of total lending (CML); 5. Ability to transact through post office branches, providing access where CYBG not present in the vicinity; 6. Cushman & Wakefield Retail Centre Rankings; 7. Based on Experian Branch Catchments (September 2015); 8. Primary (i.e. main bank) customer must be party to at least one MT account of a selected product type which meets the following criteria: i) credit turnover averaging at least £1000 in the last 3 consecutive months, ii) three or more standing orders or direct debits (or a combination of the three) in place, iii) three or more customer initiated transactions (ATM, point of sale, branch counter services
Presence in 7 of top 10 Retail sites in GB (6)
c.18 MM customers within a 10 minute drive of a Clydesdale / Yorkshire retail branch (7)
11.8k Post office outlets (5)

71% 90% 95% 31%
88% 53% 97% 25% 1%
61% 5% 47% 3% 4% 10% 5% 9% 7%
Mortgages SME / Corporate Unsecured
49% 31% 21% 19% 21% 12% 43% 37% 39% 23% 67% 30% 57% 57% 42% 42% 77% 33%
Current accounts Fixed Variable
Source: Company Information, Mintel, BBA, Bank of England
1. CYBG, TSB, Virgin, OSB , W&G, Aldermore and Co-op represent the total group; 2. W&G based on RBS FY2014 disclosure; 3. Excluding Optimum and Non Core Corporate; 4. Based on BBA postcode lending data; 5. Latest portfolio mix disclosure for W&G is as at H1 2012; 6. PCA market share based on Mintel data July 2014. For W&G, based on Santander report, August 2010; 7. CYBG PCAs includes non interest bearing demand deposits; 8. Represents RBS UK mix; 9. Amounts repayable within one year assumed as proxy for variable; 10. Includes flexible savings; 11. Defined as mobile banking app available on line with transaction functions; 12. Estimated branches adjusting for announced branch closures post Sabadell acquisition announcement. Currently at 633 branches; 13. Core branches; 14. Defined as retail branches only, not SME centres (of which there are 11); 15. Short track record, offering available only since 19 January 2015; 16. All functions embedded in RBS platform with no fully standalone capabilities; 17. Data as at FY2014, except gross loans as at 1H2015. CYBG shown on a FY15 basis; 19. TSB gross loans and loan mix pro forma for £3.3 Bn UKAR mortgage acquisition
6
Largest of the mid-sized UK banks
Full service offering with strong SME presence
Multichannel distribution Retail branches
Intermediary Telephony Mobile(11)
Strong current account foothold based in core
regions
Figures (Latest) in £ Bn unless stated otherwise(17)
3% 2% 3% n/a n/a 4%
UK gross loans (£ Bn) and mortgage market share (%) (1)
UK gross loans mix and SME lending market share (%)(4,5)
(3)
n/a
2% <1% <1% 2% 2% 1% 1%
<1% n/a n/a 4% n/a <1% 7%
SME lending market share
PCA market share (%)
✓ ✓ ✓
275 ✓ ✓
75 (✓) (✓) (✓)
314 ✓ ✓ ✓
222(13)
✓ ✓
0(14)
✓ ✓
9
The only UK mid-market bank which has material scale, full service capabilities and a substantially standalone IT platform
(7)
Customer deposit mix and PCA market share (%) (6)
(8) (9) (10)
Mortgage market share
(2,6)
(16)
(16)
(16)
(8) (8)
Differentiated position to UK challengers
29 25 25 20 15 5 5
(✓) ✓ ✓
c.615(12)
(15)
(19)

Strategic direction clear
7
We are a strong regional bank with established Retail and SME franchises supported by trusted local community brands
• Leverage our capabilities in existing core regional markets
• Continue our successful national growth strategy focusing on selected products and sectors where we have a strong history and established capabilities
• Deliver a consistently superior experience to our customers underpinned by our local community brands and a customer driven omni-channel strategy
• Deliver enhanced shareholder returns
Our business today
Our strategic aims

1,294
263
377
143
1,671
406
2012(incl CRE)
2015
Gross impaired assets Total 90+DPD
8
Management actions strengthened balance sheet Asset portfolio de-risked Funding position improved Loan book reshaped
15.4
20.5
1.3
1.2
16.5 7.1
33.2
28.8
2012(incl CRE)
2015
Mortgages Retail unsecured Business
4%
50%
46%
5%
25%
71%
CAGR (2012 –2015)
(25%)
10%
(2%)
231bps
5.0%
% of gross loans Impairment charge to gross average loan balances (bps)
10.7 13.0
5.2
7.8
9.9 5.5
0.6 0.1 3.2 3.8
7.7
1.0
0.6
0.4
38.0
31.5
2012(inc. CRE)
2015
CAGR (2012 –2015)
(49%)
+6%
20%
8%
70%
6%
Gross stock loans, £ Bn Portfolio asset quality (£ MM) £ Bn
154 Blended cost of funds (bps)
21bps
1.4%
3%
12%
84%
108
Current account Savings Term Deposits
Secured funding Due to NAB Other wholesale
+14%
Other wholesale deposits

• Total capital and leverage ratio comfortably in excess of regulatory requirements
– 13.2% CET1 ratio and 7.1% leverage ratio
– Includes pension and indemnity buffer
• Standardised approach to risk weighting IRB upside potential
• Additional capital protection from £1.1 Bn conduct indemnity from NAB
– Supplemented by existing unutilised provision of c.£1.0 Bn
• Existing Tier 2 and AT1 to be replaced at separation(2)
– NAB to remarket securities post completion of the transaction
9
13.2%
2.5%
3.2%
18.9%
2015 Capital Ratio
CET1 Ratio
AT1
Tier 2
7.1 Leverage ratio (%)
(£0.6 Bn)
(£0.5 Bn)
(£2.4 Bn)
2015 Total RWAs (£ Bn) 18.2
2015 Credit RWAs (£ Bn) 16.3
Credit RWAs / Loans (%) 57%
Total RWAs / Assets (%) 47%
Group capital structure(1)
% RWA
1. Capital structure of CYB Investments Limited at 30 September 2015. Capital structure in CYBG will mirror after 3 corner demerger and AT1 / Tier 2 repurchase and reissue; 2. Tier 2 £475 MM 10NC5 5% coupon & AT1 £450 MM PNC7 8% coupon
Robustly capitalised to support growth ambition

£1.7 BN conduct mitigation package
£120 MM £465 MM
£1,115 MM £1,700 MM
CYBG risk share Pre-separationsupport (Unutilised)
NAB riskshare (indemnity)
Conduct mitigationpackage
10
Conduct protection sized to provide cover in severe stress
• CYBG capital requirement includes £120 MM
risk share, which is deployed alongside the
NAB indemnity
o Draw downs are pro rata1 between NAB and
CYBG
• Mitigation package amount is the result of
stress tests to CYBG’s provision models and
conduct exposures, and reflects:
o A series of extreme stresses to underlying
provision assumptions
o Multi-factor stresses
o Potential lifetime cover
£2.1 BN provisions and indemnity
£521 MM £465 MM
£1,115 MM £2,101 MM
Remaining pre-FY15provisions
Pre-separationsupport (Unutilised)
NAB riskshare (indemnity)
Total 2
Unutilised provisions: £986 MM
Key messages
CYBG has in aggregate £2.1 BN of unutilised provisions and indemnity (excluding £120 MM CYBG risk share) to absorb future costs arising from conduct issues, including redress and cost to do
1. Based on £1.115 BN of indemnity, CYBG’s risk share is a fixed 9.7% of each relevant conduct cost. If there is no further specific support provided by NAB prior to implementation of the Demerger, the risk share will stay at 9.7%
2. This excludes CYBG £120 MM risk share. The indemnity provided by NAB is drawn pro rata with CYBG risk share
1

11
Diversified funding with proven low cost deposit growth Diversified funding mix
Deposits £26.3 Bn, 83%
Secured funding £3.8 Bn, 12%
Due to NAB £1.0 Bn, 3%
Other wholesale funding £0.4 Bn, 1%
Total funding: £31.5 Bn
1.1 1.1 1.1 0.5
6.1
1.4 1.1 0.1
0.5
0.4 0.4 0.4
7.7
3.0 2.6 1.0
2012 2013 2014 2015Subordinated liabilities Wholesale funding RMBS
Reduced NAB funding £ Bn
2015
154 147 121
108
2012 2013 2014 2015
Strong track record of growing low cost deposits
Reducing overall funding costs and maintaining stable funding position
109 104 115 109
10.7 11.2 12.0 13.0
5.2 5.8 6.2 7.8 9.9 6.9 5.7
5.5
26.5 24.3 24.0
26.3
2012 2013 2014 2015
PCAs Personal variable rate savings Personal fixed rate term Other
Gross deposits balances (£ Bn)
Blended cost of funds, (Bps)
Loan-to-deposit ratio (“LDR”), (%)
CAGR (2012 –2015)
14%
6%
(18%)
46 bps reduction since
2012
• All NAB senior funding now repaid(1)
• RMBS to be refinanced at expected call in 2017/18 • Sub debt to be remarketed post demerger
1. £100m loan repaid in October 2015, three months earlier than maturity date```
Already investment grade rated by all agencies, with and without parental support notches

12
Demonstrated track-record of retail franchise growth Track record of mortgage growth
15.4 20.5
2012 2015
Established intermediary franchise Unsecured propositions reinvigorated
16.3
34.2
2014 2015
Retail new card issuance, 000s(1)
1. Includes private banking credit cards sold via face-to-face / branches; 2. Based on 10,000 current account customers survey during 9th to 16th March 2015. Ranking and response pertaining to Clydesdale Bank only not CYBG; 3. Survey consists of First Direct, Nationwide Building Society, Clydesdale Bank, TSB, Santander, Yorkshire Bank, Co-op, Halifax, Bank of Scotland, NatWest, Lloyds, Barclays, HSBC and RBS; 4. Peers: YB - Barclays, Co-Op, Halifax, HSBC, Lloyds, Nationwide, NatWest, Santander, TSB / CB - Bank of Scotland, RBS, Santander, TSB; 5. CAGR based 2012 to 2015. Market CAGR based on CML 2012 to 2015; 6. Awards as at 2014 for Yorkshire Bank; 7. Estimate based on 60% (from CML Regulated Mortgage Survey) as proxy for overall intermediary lending as proportion of total lending (CML);
Gross new mortgage lending volumes, £ Bn Gross stock balances, £ Bn
Customer advocacy improved Recognised service quality
(17%)
9% 1%
7%
Oct 2014 Aug 2015
CB Peers
15% 18%
8% 8%
Oct 2014 Aug 2015
YB Peers
uSwitch Annual customer survey responses(2), %
78 77 72
66
Best online service Best customerservice (branch)
Overall satisfaction Best customerservice (overall)
#2 #2
# Rank vs. peers(3)
#1 #2
Net Promoter Scores(4)
10% CYBG CAGR(5) 1% Market CAGR(5)
Award winning “first time buyers” proposition with Moneyfacts 2 years running and “best regional lender” with
Your Mortgage(6)
Digital enablement − increased sales via aggregators Competitive credit card proposition - 0% offer on purchases
2.1 3.7 0.3
0.4 0.8
0.9 3.1
4.9
2012 2015Broker Private Banking Branch & direct
68% 76%
Intermediary lending market share now c.3% (7)

10.8 6.0
5.7
1.1
16.5
7.1
2012 2015Core 2012 CRE 2015 Identified run-off
13
SME franchise repositioned for growth Strategic realignment of SME book
Targeted acquisition of Small Business(4) customers
Focused on growth in high return product areas
Entering under-served subsectors with expertise
2,161 2,529
3,647 4,311
1Q'15 2Q'15 3Q'15 4Q'15
Number of BCA opened (accounts)
Business banking loan book, £ Bn
(1)
1. Low-yielding run-off was only identified in 2014; 2. Facilities accepted and available to customer; 3. £185m since formal launch on 1 February 2015; 4. Defined as micro customers, business direct and small business customers with turnover <£2.0m and lending <£0.25m; 5. Run-off of £682 MM in 2015 at average NIM of c. 1.30%
Gross new facilities accepted and available to customers, 2015
£200 MM YoY(2,3) origination in specialist / niche propositions New Head of CRE and team – operational in Sept 2015 Additional examples of sub-sector focus areas identified below:
Overdrafts £430 MM, 22%
Term £923 MM, 47%
Asset finance £404 MM, 21%
Invoice finance £169 MM, 9%
Treasury & trade finance £10 MM, 1%
Agriculture Small scale renewables
Health Health development
Manufacturing Automotive Tooling
Hospitality Hotel development
• Actively managed attrition since 2012 of SME lending book to improve risk quality and improve overall yields
• Further run-off portfolio identified in 2014 of £1.8 Bn, consisting of low yielding corporate book
• Residual £1.1 Bn(5) largely exited by 2017, with a small tail fully running-off by 2019
Gross new facilities: £1.9 Bn

77 76
2014 2015
2.65 2.66
2014 2015
14
Growth while maintaining prudent risk appetite
Note: 2012 values shown excluding CRE portfolio 1. Other includes transport & storage, utilities, post & telecommunications, construction and resources and entertainment and personal services; 2. Includes housing association; 3. Average LTI is based on approvals from 2014 (September 13 to August 14, inclusive) and 2015 (September 14 to August 15, inclusive), average LTI is based on residential approvals that have a valid LTI; 4. Defined as total provisions as a % of 90DPD and impaired assets; 5. Includes 90+DPD
Prudence maintained on front book lending
Ret
ail
SME
Gross new facilities accepted and available to customers, 2015
Business Services 16%
Agriculture 16%
Retail & Wholesale 15%
Manufacturing 13%
Government, Health & Education 12%
Finance 4%
Other(1)
17%
CRE(2)
4%
Hospitality 3%
% of mortgage front book below 80% LTV, %
Average mortgage origination loan-to-income (“LTI”)(3), x
66 55
2012 2015
1.1
0.7
2012 2015
2.3 0.7
1.6
0.3
3.9
1.0
2012 2015
Reduced mortgage LTVs
Reduced unsecured 90+DPD
SME categorised loans reduced
Average Mortgage LTV, %
Unsecured 90+DPD as a % UPLs
Categorised SME portfolio, £ Bn
Maintained LTI cover LTV broadly stable
67% from existing
customers
SME lending sector diversification
Watch Defaulted & Impaired(5)
Asset quality improved following de-risking activities
1.4% 2.5%
Coverage Ratio % of gross loans
452 263
233
143
685
406
2012 2015Gross impaired assets Total 90+DPD
£ MM
57.4 66.0
(4)
Down from 5.0% incl. CRE

Identified opportunities for improvement Positive dynamics …
...with areas that require improvement and change
• Loyal customers
• Motivated, engaged staff
• Solid financial fundamentals
• Cultural transformation required to change
subsidiary mind-set
• Simplify internal governance and processes
• Streamline operations and decrease
inefficiencies
• Significantly enhance productivity
Near term focus areas
15
People
Omni-channel delivery
Grow customer franchise
Disciplined investment, cost
and efficiency
3
1
2
4

16
New management team driving forward the strategic agenda Create
customer centric culture
Empower & deepen cross
bank talent
Drive accountability
& responsibility
Appropriate reward
structure
Focus on governance framework
Near term actions Progress
• Senior Board appointments
• Leadership team restructured
• Number of key senior positions filled
• Senior management bench strength
assessment exercise ongoing
• Reduction in policies and committees
• New employee engagement approach
Priorities
• Strengthen leadership team for standalone environment
• Identify and fill key capability gaps
• Full employee clarity on strategic direction
• Reward programme aligned to strategic goals and customer
Board
Management
Broader employee base Leadership team
Cross bank approach

17
Disciplined investment, cost and efficiency Targeted
investment in growth plan
Rigorous approach to cost control
Appropriate investment in
resilience
Streamline customer and
staff processes
Near term actions Progress
• Review of investment spend linked to customer strategy agenda and resilience of franchise
• Revised governance and control framework for costs
• Targeting specific areas for cost reduction
• End-to-end process simplification
• Increased productivity and continued optimisation of branch network
• Investment in data architecture
Priorities
Path to improved operational efficiency
75%
<60%
FY2015 Targeted
Cost-income-ratio (“CIR”), %
• Targeting centralised costs and inefficiencies
• Investment in growth strategy
• c.£300 MM investment spend for growth and resilience across FY2015/2016
• Structural integration of retail and SME franchises
• 24 branch closures in FY 2015 aligned to network reconfiguration
• 70% of business centres co-located with retail branches
• Cost reduction and simplification initiatives
• End-to-end mortgage process to be replicated in business lending
• Targeted headcount reductions across the business
Significantly enhanced
productivity

18
Franchise opportunity from delivery of omni-channel strategy
Strengthen our existing digital
channels
Leverage “B” platform and functionality
Enhance customer data and analytics
Digitise internal and customer
processes
Priorities
Near term actions Distribution
• Next generation branch format / automation - Live
• Optimisation of footprint aligned to customer needs
• Digital connectivity to non-branch channels
Processes
• Online current account opening – Live
• Mortgage end-to-end process simplification
Customer data analytics
• “Digital Next Best Action” – Live
Mobile / Internet
• Enhanced mobile banking proposition
• Public Launch of “B” platform
Consistent, superior customer experience delivered through seamless omni-channel platform
Tablet banking
ATM’s
Branches
Telephone banking
Internet banking
Mobile banking
“B” platform
Intermediary
Optimise our branch
footprint
Deepened relationships
Broadened offering
Extended reach
Digitised operating platform

19
• Income continues to rebase in line with expectations:
− Net interest income reflects growth in mortgages offset by lower business lending and unsecured volumes
− OOI lower due to changes to current account charging structures and non-recurrence of prior period sale and leaseback gains
• Expenses reflect increased investment to support franchise growth:
− Increase compared to 2014 in part due to due to increased spend in marketing, digital platform and developing new propositions
• Strong asset quality and low credit losses:
− Continued strong credit performance and prudent approach
− GIA and 90+DPD continue to decline while coverage ratios increased (6)
− Through the cycle expected loss estimated at c.30 bps(7)
Income statement (management basis) (1)(2) Key trends in 2015
1. Presented on a management basis which represents the historical results of Clydesdale excluding adjustments that Clydesdale's Directors believe are non-recurring, or otherwise not indicative of the underlying performance of the business. These include conduct redress expenses, restructuring costs, impacts of the disposed UK CRE portfolio, impairment losses on goodwill and other one off items. Conduct charges exclude charges relating to Interest Rate Hedging Products (IRHP) in 2014. Underlying profit after tax is a non-statutory profit measure; 2. Management basis also excludes the impacts of the "Insurance Intermediary Business" (the non-trading holding company National Wealth Management Europe Holdings Ltd, and its trading subsidiary National Australia Insurance Services Ltd (NAIS), the operations of which were acquired by Clydesdale Bank PLC on 30 September 2015). Total income and net profit after tax for the Insurance Intermediary Business for the year ended 30 September 2015 was £22 MM (2014: £23 MM, 2013: £31 MM, 2012: £41 MM) and £13 MM (2014: £12 MM, 2013: £17 MM, 2012: £22 MM) respectively; 3. Management basis RoTE is defined as underlying profit less non-controlling, AT1 and preference share distributions as a percentage of average tangible equity (total equity less intangible assets excluding minorities, AT1 and preference shares for a given period). AT1 distributions commenced June 2015 with £18 MM paid in 2015 (£300 MM 6M LIBOR+763bps, £150 MM 6M LIBOR+ 690bps); 4. 2015 impairment charge includes £8 MM representing additional collective provision overlay on secured book for losses incurred but not recognised following conclusion of the Asset Quality Review in 2015; 5. Pre AT1 and preference shares distributions and minority interests 6. Total provisions as a percentage of Impaired & 90DPD 2014 = 57.4%, 2015 = 66.0%; 7. CYBG Group has, using a financial model whose key inputs are cycle neutral probability of default ("PD"), loss given default ("LGD") and exposure at default ("EAD"), estimated the through the cycle ("TTC") expected loss on its non defaulted customer loan portfolio as at 30 September 2015 over a one year time horizon at approximately 30 basis points. The PD/LGD/EAD model inputs are based on internal models that have not been subject to any external validation process. No assurance can be given that future losses on, or future impairment charges with respect to, CYBG Group's total customer loan portfolio, which changes over time and which includes non-defaulted and defaulted customers loans, will not exceed the TTC expected loss set forth herein; 8. Defined as total impairments charge including fair value loan credit adjustments to gross average loan balances. 2014 ratio calculated on losses of £80 MM, being total losses on credit exposures of £74 MM plus fair value loan credit risk adjustment £6 MM. 2015 ratio calculated on losses of £60 MM, being total losses on credit exposures of £78 MM plus fair value loan credit risk adjustment £ (18) MM
2015 performance reflecting ongoing business reshaping
Year Ended 30 September
£ MM 2014 2015 % change
Net interest income 785 787 0.3%
Other operating income (“OOI”) 205 175 (14.6%)
Gains & losses on financial instruments at FV (8) 2 n.m.
Total income 982 964 (1.8%)
Operating and administrative expenses (686) (727) 6.0%
Operating profit before impairment losses 296 237 (19.9%)
Impairment losses (credit exposures) (74) (78) 5.4%
- Of which specific provisions (95) (73) (23.2%)
- Of which collective provisions 21 (5) n.a.
Underlying profit before tax (5) 222 159 (28.4%)
NIM 2.30% 2.20% (10)bps
Cost-to-income ratio (‘CIR‘) 70% 75% 5ppts
Impairment/Average Customer Loans(8) 30bps 21bps (9)Bps
RoTE (Underlying basis) (3) 7.7% 5.1% (2.6)ppts
(4)
220 218
230
220
2012 2013 2014 2015
20
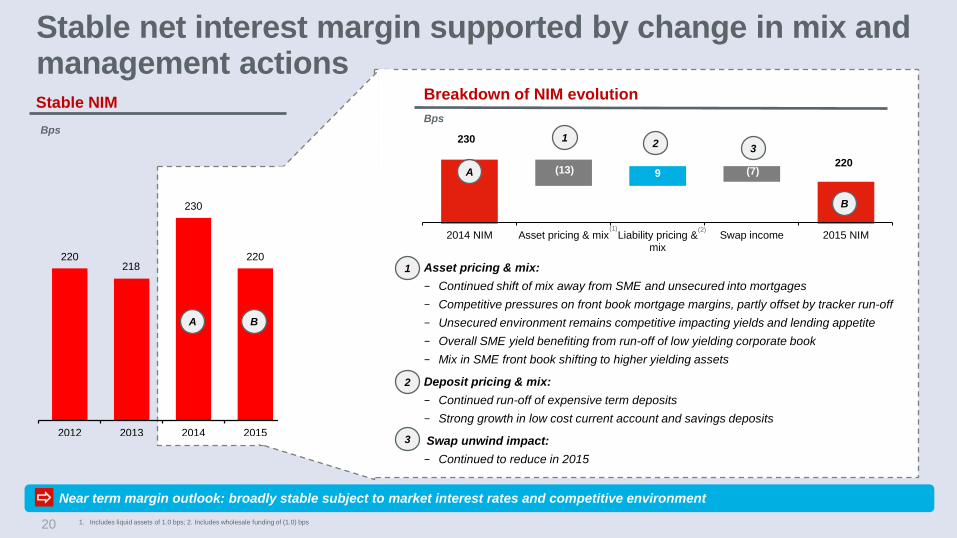
Stable NIM
Stable net interest margin supported by change in mix and management actions
1. Includes liquid assets of 1.0 bps; 2. Includes wholesale funding of (1.0) bps
Bps
Breakdown of NIM evolution
Bps
• Asset pricing & mix: − Continued shift of mix away from SME and unsecured into mortgages − Competitive pressures on front book mortgage margins, partly offset by tracker run-off − Unsecured environment remains competitive impacting yields and lending appetite − Overall SME yield benefiting from run-off of low yielding corporate book − Mix in SME front book shifting to higher yielding assets
• Deposit pricing & mix: − Continued run-off of expensive term deposits − Strong growth in low cost current account and savings deposits
• Swap unwind impact: − Continued to reduce in 2015
A B
230
(13) 9 (7) 220
2014 NIM Asset pricing & mix Liability pricing &mix
Swap income 2015 NIM
A
B
(1) (2)
1 2 3
1
2
3
• Near term margin outlook: broadly stable subject to market interest rates and competitive environment

21
Strategy to deliver growth and shareholder returns
• Normalisation of the credit cycle
• Evolving OOI environment
• New surcharge tax • Regulatory costs
Other
5
Near term investment & standalone build costs
• Increased costs in 2016, from transition to fully standalone operations and investment to support growth
1
• Run-off of lower yielding corporate and tracker portfolios
• Focus on higher yielding SME segments
• Continued growth in higher return mortgage segments
• Continued acquisition of low cost customer deposit funding maintaining LDR up to 115%
Change in asset and liability mix
2
• Measured sustainable asset growth in line with our strategy
• Strong cost control with positive operating jaws
• Opportunity to simplify processes and reduce operating costs
• Digitisation of the distribution and operating model
Operating leverage and simplification
opportunities
3
• Well positioned to benefit from rising rates
• £7.2 Bn non / low interest bearing balances and £3.4 Bn of capital benefiting from structural hedge (as at FY2015)
Rising rate environment
4
5.1%
RoTE FY2015 Near term investment Change inasset / liability mix
Operating leverage /cost efficiencies
Yield curve benefit Other Medium term targetdouble digit RoTE
1 2
3
4 5
5.1%
(1)
1. Management basis

22
Clear set of targets underpins our objectives Target (within 5 years) Current (FY2015)
Asset growth • Mortgage book CAGR 10% (1)
• Total retail book CAGR 9% (1)
• Core business book stable
• 40 – 50% growth in mortgage book • 40 – 50% growth in retail lending book • 15 – 25% growth in SME lending book
Funding and capital • £13 Bn current accounts • LDR 109% • CET1 13.2%
• LDR up to 115% • CET1 range 12 – 13 %
Margins • 2.20% NIM • Broadly stable in the near term with potential for modest
widening, commensurate with expected movements in rates and competitive environment
Costs • 75% Cost-to-income ratio (“CIR”) • Positive jaws (after FY2016) • CIR below 60%
RoTE • Targeting double digit RoTE within the five year period post admission, following a period of planned increased investment in 2015 and 2016
Dividend (subject to regulatory approvals)
• Target modest inaugural dividend in respect of 2017 • In time, intended pay-out up to c.50% of earnings (after paying AT1 distributions)
Subject to assumptions as to interest rates, the broader macro-economic and competitive environment and having regards to the context of the current regulatory environment
1. 2012 vs. 2015

Investment highlights
23
Differentiated proposition relative to the UK challengers Largest of the mid-sized banks — 2.8m customers, £29bn loans, 275 branches 175 years of regional presence — two trusted brands, recognised service quality, leading regional market shares Full service Retail and SME capability — established SME franchise underpinned by strong customer relationships High regional market shares — 9.1% PCAs, c.14.0% BCAs, 8.1% Business Lending and 3.9% Mortgages 11 year track-record in intermediary channel — strong mortgage growth nationally through selective broker partnerships
Robust and de-risked balance sheet Well capitalised relative to peers — 13.2% CET1 ratio and 7.1% leverage ratio Legacy conduct issues addressed — £2.1bn total cover across provisions and conduct indemnity Improved funding and liquidity position — 109% LDR, 120% NSFR, all NAB senior funding repaid Robust asset quality and provision coverage — 21bps CoR; 55% average LTV; 66% coverage on 90+DPD
Proven ability to attract and retain low cost customer deposits c. 50% of deposits in the form of low cost current account balances — £13bn in FY2015 CA and savings balance growth ahead of market — 6% CAGR in CAs, 14% CAGR in Savings (’12-’15) Loyal and sticky customer deposit base — 78% PCA customers and 54% BCA customers with us > 10 years
Track-record of strong asset growth, while maintaining asset quality Growth in mortgage book ahead of market — 10% CAGR (’12-’15) Award winning propositions in key products — winner “first time buyers” proposition with Moneyfacts 2 years running Strong front book asset quality driven by tight lending controls — manual underwriting, no self-cert, affordability stress testing
Standalone and scalable full service operating platform Standalone core operating and IT platform post separation — limited TSAs with NAB Proven scalability delivering operating leverage — ability to expand 2x peak transaction capacity at low cost Track-record of investment, stepped up to support growth in 2015 — c. £300m investment spend 2015/2016
1
2
Strong fundamentals underpin the CYBG value proposition
3
4
5

1
2
3
4
Investment highlights Upside from execution
Highly experienced management team, leading a newly independent CYBG Cultural transformation from subsidiary mind-set ongoing Strengthened leadership team for a standalone environment, with clear delivery accountability Reward structures being aligned to strategic goals and positive customer outcomes Focus on governance framework, with new board appointments to complement existing talent
Disciplined investment plan, delivering cost and efficiency savings Investment spend closely linked to the omni-channel strategy and growth agenda Focus on cost reduction and simplification initiatives Targeted measures to increase staff and network productivity
Omni-channel strategy underpinned by comprehensive digital agenda Focus on optimisation of the branch footprint and delivering next generation layout / automation Launch of “B” platform in early 2016, supporting target customer acquisition at lower costs Digitising internal and customer processes — end-to-end process simplification driving reduced delivery time, improved satisfaction Improved customer data analytics — delivering product propositions tailored to customer needs
Clear strategy to drive growth and deliver double digit RoTE 40-50% asset growth targeted across the Retail book and 15 – 25% across the SME book, supported by targeted ongoing growth in low cost deposits Capital release from run-off of lower yielding SME corporate and mortgage tracker books – redeployed in higher margin segments <60% cost income ratio target, with positive jaws targeted after FY2016 Well positioned for a rise in rates, with £7.2 Bn non / low interest bearing balances
24

Research Analyst
Presentation (Part 1 of 2)
Q&A