overview of the environmental and health effects of urban
TRANSCRIPT
1
Ministry of Transport of the Russian Federation
Department of Transport and Communications of Moscow
European Conference of Ministers of Transport
United Nations Economic Commission for Europe
World Health
Organization Regional Office for Europe
CONFERENCE ON IMPLEMENTING SUSTAINABLE URBAN
TRAVEL POLICIES IN RUSSIA AND OTHER CIS COUNTRIES
30 September – 1 October 2004
Ministry of Transport of the Russian Federation
Sadovaya-Samotechnaya str.10 Moscow
Overview of the environmental and health effects of urban transport in the Russian Federation and the
other countries in eastern Europe, the Caucasus and central Asia
Dr Plamen Dimitrov
National Center of Hygiene, Medical Ecology and Nutrition, Bulgaria Consultant to the WHO UNECE THE PEP secretariat
2
Table of Contents
EXECUTIVE SUMMARY..........................................................................................4
MAIN URBAN TRANSPORT TRENDS IN THE EECCA COUNTRIES.....................................4 ENVIRONMENTAL AND HEALTH EFFECTS OF URBAN TRANSPORT TRENDS IN THE COUNTRIES IN
EASTERN EUROPE, THE CAUCASUS AND CENTRAL ASIA ...............................................5 Urban air quality...................................................................................................5 Road traffic injuries ...............................................................................................5 Noise .....................................................................................................................6 Energy consumption ..............................................................................................6 Urban transport management and land-use planning.............................................6 Reduced opportunities for physical activity............................................................7 Conclusions and recommendations ........................................................................7
INTRODUCTION .......................................................................................................9
OVERVIEW OF MAJOR URBAN TRANSPORT TRENDS IN THE COUNTRIES IN EASTERN EUROPE, THE CAUCASUS AND CENTRAL ASIA..........................10
INCREASING VOLUME OF TRANSPORT ........................................................................10 ROAD FREIGHT TRANSPORT.......................................................................................10 INCREASE IN PRIVATE MOTORIZATION .......................................................................11 DECLINE IN PUBLIC TRANSPORT ................................................................................14 USE OF ROAD-PRICING OR CONGESTION CHARGES......................................................15
ENVIRONMENTAL AND HEALTH EFFECTS OF URBAN TRANSPORT TRENDS IN EECCA COUNTRIES .........................................................................................17
EMISSIONS OF AIR POLLUTANTS AFFECTING URBAN AIR QUALITY ...............................17 HEALTH EFFECTS OF TRANSPORT-RELATED AIR POLLUTION........................................20
Overview of the health effects of transport-related air pollution...........................20 Assessing exposure ..............................................................................................21 Health effects of transport-related air pollution in the EECCA countries .............22
ENERGY CONSUMPTION OF VEHICLES ........................................................................24 ROAD TRAFFIC–RELATED INJURIES............................................................................25 TRANSPORT-RELATED NOISE IN URBAN SETTINGS ......................................................33 RISKS AND EFFECTS RELATED TO REDUCED PHYSICAL ACTIVITY.................................34 POLICY ON URBAN LAND-USE PLANNING AND TRANSPORT..........................................35
CONCLUSIONS AND RECOMMENDATIONS FOR FURTHER STEPS...........36
REFERENCES..........................................................................................................40
3
List of Figures FIGURE 1. CAR OWNERSHIP IN WESTERN EUROPE (EU-15), THE COUNTRIES OF CENTRAL AND EASTERN EUROPE (CEE)A
AND EECCA COUNTRIES AND PERCENTAGE CHANGE, 1990–1999...........................................................................................11 FIGURE 2. TRANSPORT-RELATED AIR POLLUTION EMISSIONS AS A PERCENTAGE OF TOTAL EMISSIONS IN VARIOUS
EECCA COUNTRIES AND CITIES.............................................................................................................................................18 FIGURE 3. ENERGY USED IN TRANSPORT AS A PERCENTAGE OF TOTAL ENERGY USED IN THE EECCA COUNTRIES, 2000.............25 FIGURE 4. STANDARDIZED MORTALITY RATES FROM ROAD TRAFFIC INJURIES PER 100 000 POPULATION IN THE WHO EUROPEAN REGION, 2002 OR LAST YEAR AVAILABLE .............................................................................................................26 FIGURE 5. STANDARDIZED MORTALITY RATES FROM ROAD CRASHES PER 100 000 POPULATION IN THE WHO EUROPEAN
REGION AND AMONG THE EU-15 COUNTRIES, THE COUNTRIES OF CENTRAL AND SOUTH-EASTERN EUROPE (CSEC)A AND
THE EECCA COUNTRIES........................................................................................................................................................27 FIGURE 6. ROAD TRAFFIC INJURIES PER 100 000 POPULATION AMONG THE EU-15 COUNTRIES, IN THE WHO EUROPEAN
REGION AND AMONG THE EU-15 COUNTRIES, THE COUNTRIES OF CENTRAL AND SOUTH-EASTERN EUROPE (CSEC)A AND
THE EECCA COUNTRIES........................................................................................................................................................28 FIGURE 7. PEOPLE KILLED AND INJURED IN ROAD CRASHES PER 100 000 IN 2000 IN SELECTED EECCA COUNTRIES ..................28 FIGURE 8. ROAD CRASHES IN BUILT-UP AREAS INVOLVING PERSONAL INJURY IN 2001 AS A PERCENTAGE OF TOTAL ROAD
CRASHES IN SELECTED EECCA COUNTRIES ............................................................................................................................29 FIGURE 9. SHARE OF ROAD CRASHES INVOLVING A PERSON UNDER THE INFLUENCE OF ALCOHOL IN 2001 IN SELECTED
EECCA COUNTRIES ..............................................................................................................................................................30 FIGURE 10. PEDESTRIANS, CYCLISTS AND CAR OCCUPANTS KILLED IN ROAD CRASHES AS A PERCENTAGE OF TOTAL ROAD
DEATHS IN 2001 IN SELECTED EECCA COUNTRIES AND THE AVERAGES FOR ECMT MEMBER STATES......................................31 FIGURE 11. CRASH SEVERITY: PEDESTRIANS, CYCLISTS AND CAR OCCUPANTS KILLED IN ROAD CRASHES PER 1000 INJURIES IN SELECTED EECCA COUNTRIES, 2000 ...................................................................................................................32
List of Tables TABLE 1. TRUCK FLEET IN SELECTED EECCA COUNTRIES .................................................................................................10 TABLE 2. NUMBER OF CARS IN SELECTED EECCA COUNTRIES AND PERCENTAGE CHANGE, 1990–2002 .............................11 TABLE 3. MORTALITY RATES FROM ROAD TRAFFIC INJURIES AMONG PEDESTRIANS IN THE RUSSIAN FEDERATION, 1997–2002............................................................................................................................................................................30

4
Executive summary
This report contains a brief overview of the main urban transport trends in 12 countries in eastern Europe, the Caucasus and central Asia (EECCA).1 Its main objective is to describe the
environment and health effects of the current and projected trends in this subregion and to
discuss their implications for the development of transport and urban development policies
sustainable for health and the environment. The report draws from and summarizes the data
already available in reports and databases published internationally.
Main urban transport trends in the EECCA countries
The volume of transport in the EECCA countries is rising after having sharply declined during
the economic recession of the early 1990s. The rate of motorization is increasing, largely
because the private car fleet is growing, especially in large cities. Car ownership in the
EECCA countries increased an average of 20% between 1990 and 1999 and is expected to
grow further in the coming years. Currently the number of cars per 1000 inhabitants ranges
from 240 in Moscow to less than 100 in the Caucasus and central Asia, which is still
considerably lower than in western Europe (defined here as the 15 countries that were
European Union members before 1 May 2004 (EU-15)), where the average figure is 450. Most
cars in the EECCA countries are more than 10 years old, are in relatively poor condition and
still use leaded petrol. The car fleet is being expanded by used cars imported from western
Europe. Catalytic converters are often destroyed or removed from the imported cars to allow
the use of the leaded petrol, which is more widely available than unleaded petrol. Only a few
EECCA countries ban the sale of leaded petrol, although most are planning to do so. Most
EECCA countries do not inspect vehicles systematically, and inspection bodies are not well
equipped for measuring technical vehicle requirements and fuel quality. The emission
controls, if they exist, may be based on outdated standards and therefore fairly ineffective.
In the former Soviet Union, public transport was highly subsidized and was an essential and
widely used service. The use of private cars was a limited and expensive privilege. Public
transport has declined sharply since the 1990s, following economic recession and subsequent
economic reforms. The state authorities transferred responsibility for urban public transport to
the municipalities but usually without allocating sufficient funding. This had reduced the
quality and quantity of public transport services, with declining competitiveness compared
with private transport. Similarly, the investment in and maintenance of the public transport
fleet and infrastructure are insufficient. Many EECCA countries have a trend of developing
public transport run by private operators, often informally. They offer competitive service and
meet a higher demand than formal public transport. The trolleybuses are expanding their share
in the public transport system. 1 The EECCA countries include: Armenia, Azerbaijan, Belarus, Georgia, Kazakhstan, Kyrgyzstan,
Republic of Moldova, Russian Federation, Tajikistan, Turkmenistan, Ukraine and Uzbekistan.
5
Environmental and health effects of urban transport trends in the countries in eastern Europe, the Caucasus and central Asia
Urban air quality
The average proportion of total pollution generated by the transport sector has been declining
across Europe but is increasing rapidly in the EECCA countries, affecting urban air quality
and health and contributing to the increase in greenhouse gas emissions. In some cities,
transport is responsible for almost all the emission of air pollutants, including suspended
particulate matter (PM), volatile organic compounds (VOC), carbon monoxide (CO), nitrogen
dioxide (NO2), lead, polycyclic aromatic hydrocarbons and benzo[a]pyrene. Air pollution due
to motor transport presents a serious risk to the health of the population. Elevated levels of PM
smaller than 10 µm in diameter, ground-level ozone and lead are especially of health concern.
Studies conducted in the EECCA countries have demonstrated that concentrations of
suspended PM at levels of 10–50 µg/m3 are associated with increased respiratory morbidity
and impaired pulmonary function, in accordance with findings from epidemiological studies
carried out elsewhere. Available data from the Russian Federation indicate that increased
pollution of urban air, especially by suspended PM, causes an estimated 40 000 additional
deaths per year in urban areas. In addition, each person living in an environment with the
highest levels of suspended PM (above 150 µg/m3) loses an estimated four years of life over a
mean lifetime. The elevated concentrations of NO2 resulting from vehicle emissions have
been associated with an increase of diseases of the lower respiratory tract among children.
Elevated concentrations of polycyclic aromatic hydrocarbons and benzo[a]pyrene contribute
to increasing the risk of cancer. Increased exposure to lead resulting from the use of leaded
petrol poses a risk of elevated blood pressure and adverse effects on reproduction among
adults and a risk of retarded neuropsychological development among children.
Road traffic injuries
More than 60 000 people die prematurely each year as a result of road traffic injuries in the
EECCA countries. The average mortality rates from road crashes in the WHO European
Region decreased from 23.4 per 100 000 in 1991 to 15.0 per 100 000 in 2001, but the rates are
still higher in the EECCA countries than in the EU-15 and in a group of countries in central and south-eastern Europe (CSEC),2 and road crashes remain a leading cause of mortality
among young people. The average number of crashes involving injuries per 100 000
population is lower than in the EU-15 and CSEC countries, indicating possible underreporting
of nonfatal crashes. In the EECCA countries, most crashes occur in built-up areas, where
speed limits are often dangerously high. Vulnerable road users such as children, pedestrians
and cyclists have a greater risk of mortality than other road users. Road traffic injuries cost an
2 Albania, Bosnia and Herzegovina, Bulgaria, Croatia, Cyprus, Czech Republic, Estonia, Hungary, Latvia,
Lithuania, Malta, Poland, Romania, Serbia and Montenegro, Slovakia, Slovenia, The former Yugoslav Republic of Macedonia and Turkey.

6
estimated 1.5% of gross domestic product in countries with economies in transition and waste
substantial resources that could be used to address other development priorities these
countries.
Noise
The noise pollution from transport, mainly from motor vehicles and aircraft, has been steadily
increasing in the major cities of the EECCA countries, especially around major transport
roads, airports and railroads. The rapid growth of car ownership, the composition of the
vehicle fleet, especially its age and its maintenance conditions, in addition to poor road
surfaces contribute to high noise levels arising from road transport. Evidence indicates that
continuous noise (LAeq) exceeding 55 dB affect communication, school performance and
sleep, and continuous noise exceeding 70 dB can cause adverse cardiovascular effects and
hearing impairment.
Energy consumption
Energy consumption, and especially the consumption of nonrenewable resources by transport,
is a major policy concern since it directly affects emissions of greenhouse gases and the
security of the energy supply. In the EECCA countries, the transport sector accounts on
average for 17% of total energy use, ranging from 29% in Tajikistan to 6% in Turkmenistan,
but this is still less than the 30% in western Europe (EU-15 countries plus Andorra, Iceland,
Liechtenstein, Monaco, Norway, San Marino and Switzerland). In all EECCA countries, road
transport accounts for most of the energy used by the transport sector. The increase in demand
for road and air transport will result in higher total energy use in the coming years, leading to
higher emissions of greenhouse gases.
Urban transport management and land-use planning
Unintegrated, institutionally separated policies and decisions on transport, environment, health
and urban land-use planning promote unhealthy, unsustainable development in urban areas.
The increasing shift in transport modes from public transport towards more private
motorization encourages the traditionally well-developed public transport infrastructure and
services in the EECCA countries to be replaced by new roads and parking space to meet the
demands of private car users. The investment in road infrastructure, in turn, is further boosting
road use, worsening traffic congestion and leading to greater pollution and noise instead of
improving people’s mobility. Further, as private transport infrastructure takes considerably
more space than public transport infrastructure, increasing private transport will lead to
reduced green spaces and opportunities for walking and cycling in urban areas. Dispersed
urban development and urban sprawl are further consequences of increasing car use and
unintegrated decisions on transport and urban land-use planning. Jobs, services and leisure
7
facilities tend to require travelling longer distances and to be increasingly accessible by
private transport only.
Reduced opportunities for physical activity
The unsustainable development of urban areas as described above decreases the opportunities
for physical activity practised through walking and cycling. The links between physical
inactivity and a broad range of noncommunicable diseases, such as cardiovascular diseases,
non-insulin-dependent diabetes mellitus, hypertension and some types of cancer as well as
risks related to overweight and obesity have been well established. WHO has estimated that
20–25% of the population of the EECCA countries is physically inactive versus 17% in the EUR A countries.3 Mortality attributed to physical inactivity ranges between 5% and 10% of
the total mortality in various European countries and is estimated to be about 600 000 deaths
per year in the WHO European Region. In EECCA countries, mortality attributable to
physical inactivity could be in the range of 8–10% of total mortality.
Conclusions and recommendations
Addressing the issues posed by the growth of transport requires profound rethinking of
transport management and urban development in the EECCA countries and a strong political
commitment to invest in a new range of policies and interventions capable of addressing
simultaneously the various challenges posed to health and to the environment. In particular,
this requires developing a better understanding of the complexities of the relationship between
transport and its effects on health and the environment and the capacity to bring together
various skills and sectors. This will require developing the necessary institutional and policy
tools that foster the dialogue between and the participation of relevant sectors in the decisions
affecting transport and urban development.
Several legal, policy, analytical and planning tools have been made available at the pan-
European level to provide a legal basis or a reference framework for development of national
strategies for the integration of environmental and health considerations into transport and
urban planning. They include: the Transport, Health and Environment Pan European
Programme; the Convention on Environmental Impact Assessment in a Transboundary
Context and the Protocol on Strategic Environmental Assessment to this Convention; and the
Children’s Environment and Health Action Plan for Europe. The EECCA countries should
consider taking advantage of these tools and actively implementing them to foster intersectoral
cooperation and to improve understanding of the environment and health consequences of
3 The EUR A subregion within the European Region comprises countries with very low adult mortality and
very low child mortality. The countries are: Andorra, Austria, Belgium, Croatia, Czech Republic, Denmark, Finland, France, Germany, Greece, Iceland, Ireland, Israel, Italy, Luxembourg, Malta, Monaco, Netherlands, Norway, Portugal, San Marino, Slovakia, Spain, Sweden, Switzerland and United Kingdom.
8
various transport policy options for making more informed and transparent decisions. Further,
the EECCA countries should consider giving high priority to taking urgent action on the
following issues to tackle the environmental and health externalities of urban transport:
� phasing out lead from petrol and improving the quality of fuel;
� investing in maintaining and upgrading public transport infrastructure, fleet and
services;
� integrating transport policies with urban planning to foster sustainable and
healthy development in urban areas;
� reinforcing the use of economic instruments to manage the demand for
transport;
� implementing effective measures for reducing and preventing road crashes and
injuries; and
� improving the availability and quality of data to support informed and
evidence-based decision making.
9
Introduction
This document has been prepared by a consultant to the WHO Regional Office for Europe and
the United Nations Economic Commission for Europe (UNECE) secretariat of the Transport,
Health and Environment Pan European Programme (THE PEP). It is being presented at the
Conference on Implementing Sustainable Urban Travel Policies in the Russian Federation and
Other CIS Countries in Moscow on 30 September and 1 October 2004, jointly organized by
the European Conference of Ministers of Transport (ECMT), the Ministry of Transport and
Communication of the Russian Federation, and THE PEP.
The Conference is concentrating on how countries – in particular the Russian Federation and 11 other countries in eastern Europe, the Caucusus and central Asia (EECCA)4 – are defining
and moving towards implementing effective sustainable urban travel policies. In so doing, it is
reviewing and discussing transport patterns and trends in large cities in these countries as well
as the effects of transport on environment and health.
This document starts by providing a brief overview of the main transport trends in the urban
areas of the EECCA countries before focusing on the effects of urban transport on health and
environment in these countries.
The major transport trends considered include: the growing volume of transport, increasing
private motorization and general decline in public transport. The environmental and health
effects of urban transport given particular attention are related to air pollutants emitted by
motor vehicles affecting urban air quality; road crashes and injuries; noise pollution; the
energy consumed by vehicles and the greenhouse gases emitted; and the development of
transport infrastructure and urban land-use planning causing urban sprawl and decreasing
opportunities for physical activity through walking and cycling.
Finally, the document discusses the implications of these trends and effects for the
development of policies on transport and urban development and identifies directions for
promoting more environmentally sound and healthier mobility and living conditions in cities
in the EECCA countries.
The urban transport trends and effects are described here based on various sources, including:
the environmental performance reviews developed by the UNECE with the collaboration of
the WHO Regional Office for Europe; ECMT and UNECE statistics on transport; and the
health for all database of the WHO Regional Office for Europe. In addition, other relevant
international sources of information and data have been mentioned when relevant.
4 The EECCA countries include: Armenia, Azerbaijan, Belarus, Georgia, Kazakhstan, Kyrgyzstan,
Republic of Moldova, Russian Federation, Tajikistan, Turkmenistan, Ukraine and Uzbekistan.
10
The document has certain limitations because international or national data are scarce for
some of the issues and countries discussed.
Overview of major urban transport trends in the countries in eastern Europe, the Caucasus and central Asia
Increasing volume of transport
The volume of transport in the EECCA countries declined during the early 1990s but is
currently rising. The decline was mainly due to economic recession, which all EECCA
countries experienced after the USSR dissolved. The volume of passenger transport in the
EECCA countries is currently at about the same level as in 1970 (1). No data are available for
the EECCA countries as a whole region, because data on vehicle use are lacking for most of
the countries. The data on transport fleet volume have some limitations because many of the
data provided are not reliable. However, passenger car ownership and the number of motor
vehicles have increased steadily in recent years. This leads to increasing road traffic density
and to frequent congestion. The poor road conditions, the ageing fleet and the increase in the
number of commuters worsen the situation in the EECCA countries.
Road freight transport
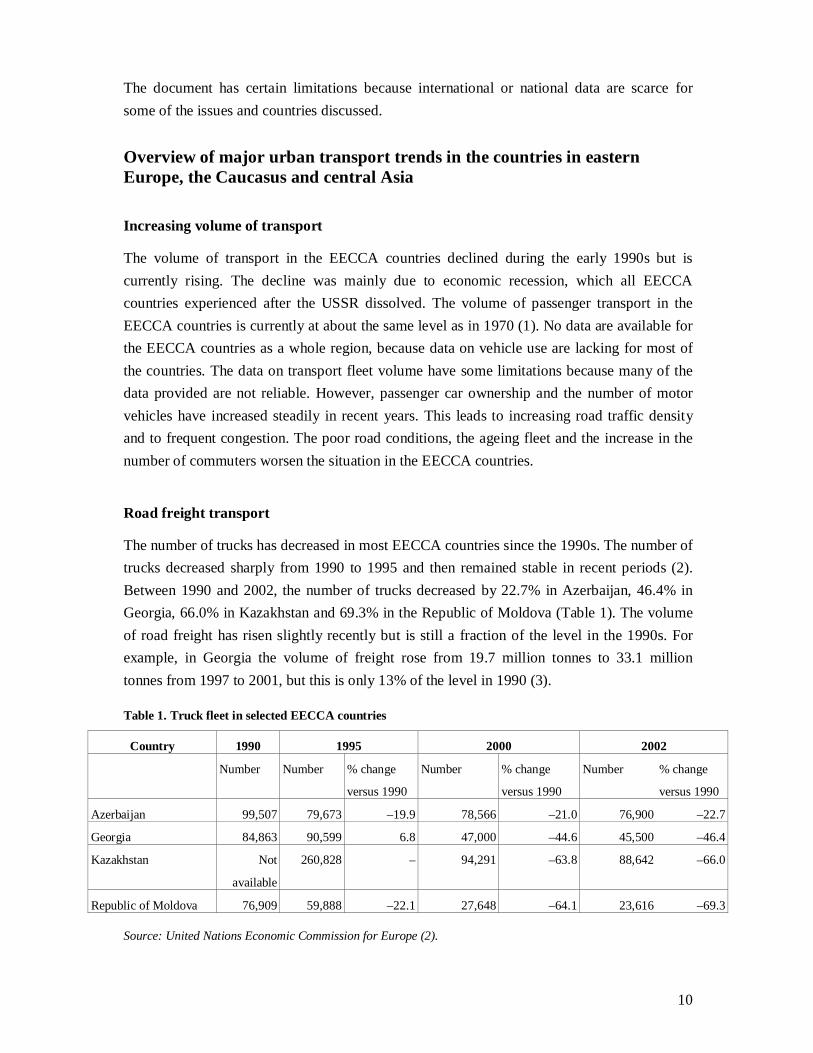
The number of trucks has decreased in most EECCA countries since the 1990s. The number of
trucks decreased sharply from 1990 to 1995 and then remained stable in recent periods (2).
Between 1990 and 2002, the number of trucks decreased by 22.7% in Azerbaijan, 46.4% in
Georgia, 66.0% in Kazakhstan and 69.3% in the Republic of Moldova (Table 1). The volume
of road freight has risen slightly recently but is still a fraction of the level in the 1990s. For
example, in Georgia the volume of freight rose from 19.7 million tonnes to 33.1 million
tonnes from 1997 to 2001, but this is only 13% of the level in 1990 (3).
Table 1. Truck fleet in selected EECCA countries
Country 1990 1995 2000 2002
Number Number % change
versus 1990
Number % change
versus 1990
Number % change
versus 1990
Azerbaijan 99,507 79,673 –19.9 78,566 –21.0 76,900 –22.7
Georgia 84,863 90,599 6.8 47,000 –44.6 45,500 –46.4
Kazakhstan Not
available
260,828 – 94,291 –63.8 88,642 –66.0
Republic of Moldova 76,909 59,888 –22.1 27,648 –64.1 23,616 –69.3
Source: United Nations Economic Commission for Europe (2).
11
Increase in private motorization
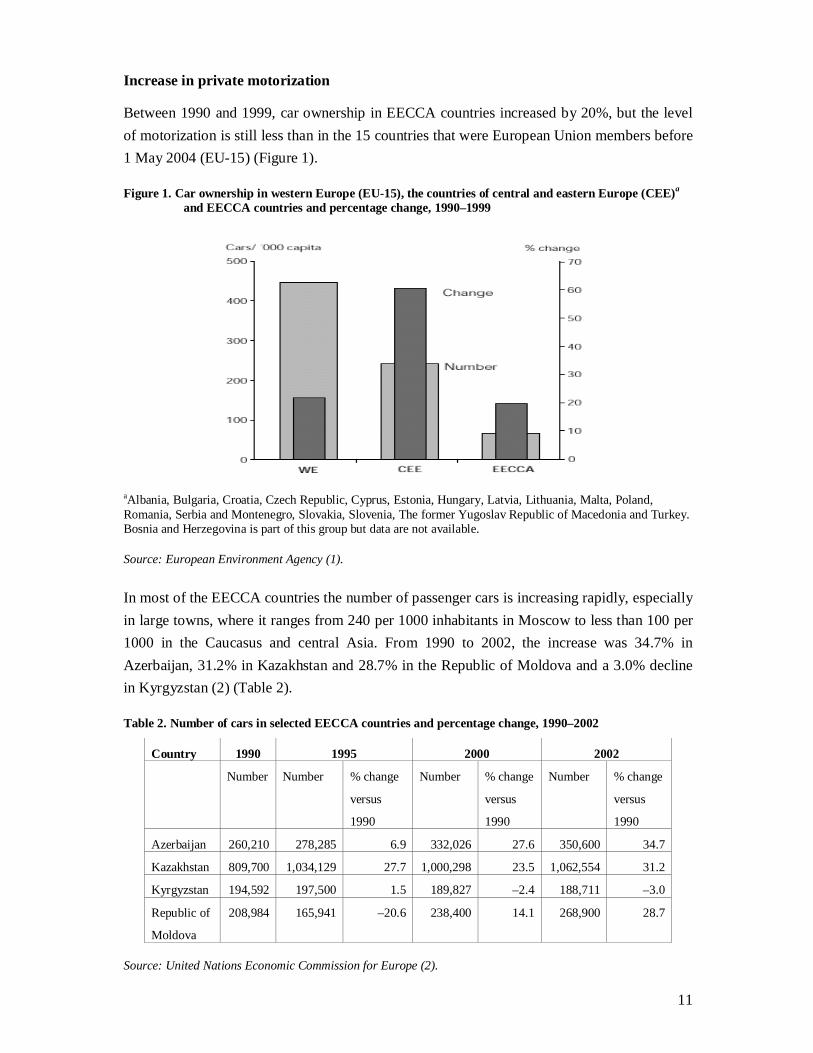
Between 1990 and 1999, car ownership in EECCA countries increased by 20%, but the level
of motorization is still less than in the 15 countries that were European Union members before
1 May 2004 (EU-15) (Figure 1).
Figure 1. Car ownership in western Europe (EU-15), the countries of central and eastern Europe (CEE)a and EECCA countries and percentage change, 1990–1999
aAlbania, Bulgaria, Croatia, Czech Republic, Cyprus, Estonia, Hungary, Latvia, Lithuania, Malta, Poland, Romania, Serbia and Montenegro, Slovakia, Slovenia, The former Yugoslav Republic of Macedonia and Turkey. Bosnia and Herzegovina is part of this group but data are not available.
Source: European Environment Agency (1).
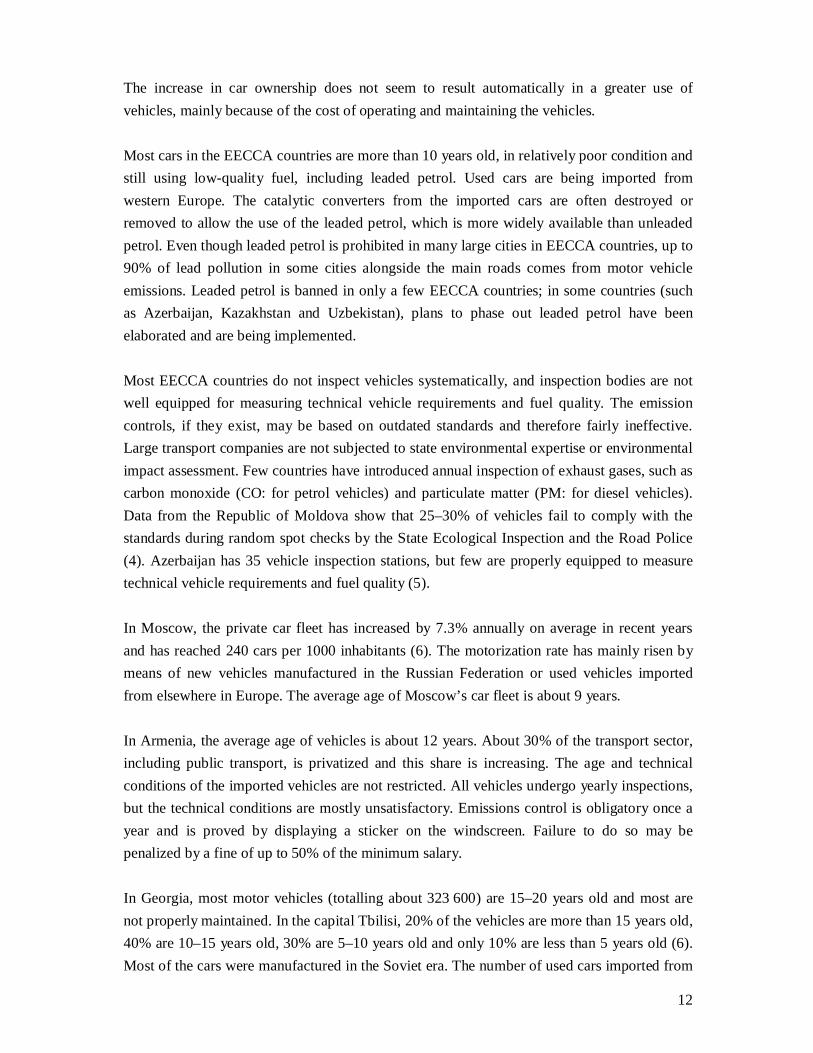
In most of the EECCA countries the number of passenger cars is increasing rapidly, especially
in large towns, where it ranges from 240 per 1000 inhabitants in Moscow to less than 100 per
1000 in the Caucasus and central Asia. From 1990 to 2002, the increase was 34.7% in
Azerbaijan, 31.2% in Kazakhstan and 28.7% in the Republic of Moldova and a 3.0% decline
in Kyrgyzstan (2) (Table 2).
Table 2. Number of cars in selected EECCA countries and percentage change, 1990–2002
Country 1990 1995 2000 2002
Number Number % change
versus
1990
Number % change
versus
1990
Number % change
versus
1990
Azerbaijan 260,210 278,285 6.9 332,026 27.6 350,600 34.7
Kazakhstan 809,700 1,034,129 27.7 1,000,298 23.5 1,062,554 31.2
Kyrgyzstan 194,592 197,500 1.5 189,827 –2.4 188,711 –3.0
Republic of
Moldova
208,984 165,941 –20.6 238,400 14.1 268,900 28.7
Source: United Nations Economic Commission for Europe (2).
12
The increase in car ownership does not seem to result automatically in a greater use of
vehicles, mainly because of the cost of operating and maintaining the vehicles.
Most cars in the EECCA countries are more than 10 years old, in relatively poor condition and
still using low-quality fuel, including leaded petrol. Used cars are being imported from
western Europe. The catalytic converters from the imported cars are often destroyed or
removed to allow the use of the leaded petrol, which is more widely available than unleaded
petrol. Even though leaded petrol is prohibited in many large cities in EECCA countries, up to
90% of lead pollution in some cities alongside the main roads comes from motor vehicle
emissions. Leaded petrol is banned in only a few EECCA countries; in some countries (such
as Azerbaijan, Kazakhstan and Uzbekistan), plans to phase out leaded petrol have been
elaborated and are being implemented.
Most EECCA countries do not inspect vehicles systematically, and inspection bodies are not
well equipped for measuring technical vehicle requirements and fuel quality. The emission
controls, if they exist, may be based on outdated standards and therefore fairly ineffective.
Large transport companies are not subjected to state environmental expertise or environmental
impact assessment. Few countries have introduced annual inspection of exhaust gases, such as
carbon monoxide (CO: for petrol vehicles) and particulate matter (PM: for diesel vehicles).
Data from the Republic of Moldova show that 25–30% of vehicles fail to comply with the
standards during random spot checks by the State Ecological Inspection and the Road Police
(4). Azerbaijan has 35 vehicle inspection stations, but few are properly equipped to measure
technical vehicle requirements and fuel quality (5).
In Moscow, the private car fleet has increased by 7.3% annually on average in recent years
and has reached 240 cars per 1000 inhabitants (6). The motorization rate has mainly risen by
means of new vehicles manufactured in the Russian Federation or used vehicles imported
from elsewhere in Europe. The average age of Moscow’s car fleet is about 9 years.
In Armenia, the average age of vehicles is about 12 years. About 30% of the transport sector,
including public transport, is privatized and this share is increasing. The age and technical
conditions of the imported vehicles are not restricted. All vehicles undergo yearly inspections,
but the technical conditions are mostly unsatisfactory. Emissions control is obligatory once a
year and is proved by displaying a sticker on the windscreen. Failure to do so may be
penalized by a fine of up to 50% of the minimum salary.
In Georgia, most motor vehicles (totalling about 323 600) are 15–20 years old and most are
not properly maintained. In the capital Tbilisi, 20% of the vehicles are more than 15 years old,
40% are 10–15 years old, 30% are 5–10 years old and only 10% are less than 5 years old (6).
Most of the cars were manufactured in the Soviet era. The number of used cars imported from
13
elsewhere in Europe is increasing. The catalytic converters of these cars are often altered or
removed to allow use with leaded fuel. The Soviet-made cars usually consume more fuel and
have higher emissions. The old cars are not properly maintained, often because resources are
lacking. All vehicles are subject to mandatory yearly inspection of the technical condition of
the vehicle and emissions. The efficacy of the inspection is low, because it is based on old
outdated standards. Air, water, soil and fuel quality are not monitored. The government
strongly supports the development of Georgia’s transport potential. Less attention has been
given to the serious potential environmental and health effects associated with transport.
In Kazakhstan the number of passenger cars is increasing, and the number of trucks has
steadily decreased. All passenger cars are imported, and about 80% are more than 10 years old
(7). Most of the older cars were made in the Soviet era and are in poor technical condition. In
recent years increasing numbers of cars have been imported from western Europe, Japan and
South Korea. They are equipped with catalytic converters, which are usually removed because
fuel quality is poor. Exhaust emissions must be checked once a year, but only CO and PM
emissions are measured. Public transport is mostly privatized but under city authorities. Public
transport vehicles must be inspected three times per year. Since 1999, diesel-fuelled buses
have been equipped with “neutralizers” (7) to reduce emissions.
In the Republic of Moldova, as in other EECCA countries, the transport fleet consists mainly
of vehicles manufactured in the Soviet era. During recent years many cars have been imported
as used cars from elsewhere in Europe, most built in the 1980s. In Chisinau, about 25% of the
car fleet originated in the European Union. Most of the imported cars are equipped with
catalytic converters, but because of the wide use of leaded petrol, they are being destroyed or
completely removed (4). An annual inspection of passenger cars for CO and PM emissions is
mandatory. Publicly owned vehicles have to pass the inspection twice a year. The transport
sector is becoming increasingly privatized, but state institutions still own many vehicles. The
process of privatization is not accompanying the modernization of the vehicle fleet or change
in management structures. Increasing car ownership and the increasing average distance per
trip are leading to congestion and air pollution. Priority is often given to non-private motor
vehicle transport by reducing car use in city centres, increasing parking costs and improving
infrastructure for biking and walking.
The number of road vehicles has increased steadily in Ukraine. The proportion of cars
imported from the rest of Europe is increasing substantially, but the age of the vehicles is still
very old. They use poor-quality leaded petrol, and especially cars made in the Soviet era. All
vehicles have to undergo annual safety inspection; they have to meet emission standards for
nitric oxide (NO), CO, hydrocarbons and PM. The standards are usually difficult to meet,
especially those for CO, which are stricter than in the European Union (8).
14
In Uzbekistan, the private transport sector owns more than 70% of the vehicles and more than
95% of the cars. The transport fleet is ageing; it mostly uses low-quality fuel. More than 50%
of the state transport fleet and more than 40% of privately owned transport vehicles have been
operating for more than 10 years. The vehicles are not consistently inspected for safety or
emissions. The data provided on transport emissions are not reliable because they are based on
the quantity of the fuel sold at petrol stations rather than on data on air quality (6,9).
Decline in public transport
A well-functioning public transport system is an important factor for social life and the proper
functioning of a city. In the former USSR, highly subsidized public transport was essential and
widely used. The use of private cars was limited and an expensive privilege. Since the 1990s,
following economic recession and subsequent economic reforms, public transport declined
drastically. The state authorities transferred responsibility for urban public transport to the
municipalities but usually without allocating sufficient funding. This reduced the quality and
quantity of public transport services. People who previously used public transport currently
use private cars, which leads to urban sprawl and congestion with which the public transport
now has to cope. The existing public transport fleet is maintained poorly. One option for
public transport widely used in EECCA countries is electric trolleybuses. Trolleybuses are
environmentally sound and reduce the hazards associated with emissions from internal
combustion engines, which makes them more attractive in the development of the public
transport system.
Many EECCA countries are developing public transport run by private operators, often on an
informal basis. They offer competitive service and meet higher demand than formal public
transport. One such form of private public transport is the development of a fleet of minibuses
that travel on fixed routes but stop at passengers’ request. This service is encouraged
elsewhere, but it needs to meet higher safety and emission standards requirements.
Moscow’s public transport system (one of the largest in the world) is a major component of
urban transport. Although the fleet of private cars has grown considerably, city residents still
depend widely on public transport, including the underground metro. In 2003, Moscow’s
public transport vehicle fleet consisted of 6328 buses, 1569 trolleybuses, 853 trams, 4221
metro cars and 8500 taxi and fixed-route minibuses. Public transport comprises 76% of the
total passenger volume of transport; surface public transport takes 43% of the total passenger
volume (6). Public transport companies in Moscow are unprofitable, similar to other large
cities in the Russian Federation. The lack of funds leads to improper service of the existing
vehicle fleet, which further deteriorates their technical condition. The shortage of vehicles and
the inability of public transport companies to renovate the existing vehicle fleet force some
commuters to switch to using cars, which further reduces the revenue of the public transport

15
companies. The public transport system also lacks skilled personnel, has low fares (covering
only 60% of the cost of transport) and insufficient fare collection (many people avoid paying).
Public transport in Baku (Azerbaijan) faces problems similar to those in other large cities in
EECCA countries – rapid growth in car traffic and difficulties in maintaining an operational
public transport system. Public transport vehicles are poorly maintained and do not undergo
regular technical inspections. In addition to buses (300 vehicles), trams (8–10 vehicles) and
the two metro lines, about 2600 to 2700 private minibuses are operating and their number is
still growing (5).
In Tbilisi (Georgia) the number of buses serving public transport decreased from 137 in 1990
to 75 in 2002; of these, only 43 are operating. The new form of public transport is minibuses.
The number of minibus lines has increased from 72 to 223 (3). Most minibuses are very old
and in poor technical condition. The specific geography of Tbilisi cannot permit the operation
of a large number of vehicles (4200–4500 vehicles per hour in some cases). Further, although
leaded petrol was banned in Georgia in 2000, substantial leaded fuel remains in the market,
presumably through illegal means. The existing law prohibits petrol containing more than
0.013 grams of lead per litre. This is still not acceptable but needs to be enforced. These facts
along with insufficient organization of road traffic increase congestion and worsen air quality,
especially in the city centre. Thus, Tbilisi has severe air quality problems.
In Chisinau (Republic of Moldova), about 80–90% of all urban passengers (600 000 on an
average day) use public transport (4). The Municipality of Chisinau operates its own public
transport company, which consists of more than 410 trolleybuses and 230 buses. The company
faces very serious problems – all buses are in poor condition and funds are lacking for
investment in modern equipment and for replacing an ageing transport fleet. Privately owned
minibuses are allowed to operate in the capital because the municipal transport company
cannot meet the passenger demand.
Use of road-pricing or congestion charges
In EECCA countries, transport fuel is taxed as part of the economic instruments for
environmental management and protection. The taxation varies by countries and differentiates
between leaded and unleaded petrol. Other economic instruments affect transport, such as
taxes on imported cars, registration taxes on cars and excise and value-added taxes on fuel.
Vehicle owners have to pay an annual property tax and service charge for preventive
maintenance. Freight vehicles pay transport taxes usually based on weight and hazardousness.
However, the use of economic instruments directed at influencing the transport demand and
modal share through congestion charges, road pricing and parking policies is still limited.

16
The mounting problem of road traffic in large cities, which reaches dramatic peaks in
Moscow, has prompted the search for measures to alleviate congestion. However, the broader
effects of various intervention options should be considered. For example, the Moscow
START project has improved the coordination of traffic lights to smooth road traffic flows,
increasing the capacity of the road network by an estimated 10–12%. Nevertheless, experience
from other countries shows that such increased capacity is quickly offset by further growth in
road traffic (6). Further, measures likely to increase average speeds may adversely affect road
safety, especially for pedestrians, and may create conditions that are even more intimidating
for vulnerable road users. The same considerations apply to measures turning two-way streets
into one-way streets to create more space for parking and alleviate congestion. The benefits of
investing in measures addressing congestion should be carefully weighed against the full
range of their possible effects and possible alternative options.
17
Environmental and health effects of urban transport trends in EECCA countries
Emissions of air pollutants affecting urban air quality
Transport is a major polluter of urban outdoor air. In most urban locations, road traffic is the
major source of ambient air pollutants such as nitrogen dioxide (NO2), CO, benzene, black
smoke and lead and an important source of PM with a diameter of less than 10 µm (PM10)
and PM with a diameter of less than 2.5 µm (PM2.5).
In the EECCA countries, the emission of many air pollutants has decreased in recent years,
mainly due to declining industrial production following the economic recession. Air pollution
from stationary sources declined very sharply. For example, in the Russian Federation the
total pollutants discharged into the atmosphere decreased from 34.1 million tonnes in 1990 to
19.1 million tonnes in 2001 (10,11). Emissions of air pollutants also declined in other EECCA
countries, but this decline has stopped in recent years. Despite the trend towards reduced
emissions, air pollution levels remain very high, especially in urban areas and in large cities.
This is a direct consequence of motor vehicle transport emissions, whose share of total
pollution is rapidly increasing (Fig. 2), and which have become responsible for almost all the
air pollutants emitted in some areas. The increase in the number of vehicles, especially private
ones, leads to systematic increase in suspended PM, volatile organic compounds (VOC), CO,
NO2, lead, polycyclic aromatic hydrocarbons and benzo[a]pyrene in the urban environment.
The most recent data on air pollution in the Russian Federation show that up to 30 million
people are exposed to elevated concentrations of ambient air pollutants; 15 million are
exposed to elevated concentrations of suspended PM; 14 million are exposed to elevated
concentrations of benzo[a]pyrene; and 5.6 million are exposed to elevated concentrations of
NO2 (10,11). Transport comprises an increasing share of these contaminants. The elevated
concentration of lead in ambient air is mostly due to the use of leaded petrol. This tendency
applies to all EECCA countries that still use leaded petrol.

18
Figure 2. Transport-related air pollution emissions as a percentage of total emissions in various EECCA countries and cities
0102030405060708090
100
Mos
cow - 2
002
Almaty
- 199
9
Armen
ia - 1
987
Armen
ia - 1
998
Azerb
aijan
- 200
2
Georg
ia - 1
991
Georg
ia - 2
001
Kyrgyzs
tan - 1
988
Kyrgyzs
tan - 1
988
Tajikis
tan - 1
990
Tajikis
tan - 2
002
Ukraine
- 199
8
Uzbek
istan
- 200
2
Tashk
ent -
2002
Per c
ent
Sources: UNECE (3,5,7–9,12–14); Donchenko V et al. (6); WHO Regional Office for Europe (10); UNECE and
WHO (15).
In Moscow, motor vehicles are the main source of air pollution. Transport is responsible for
more than 80% of all pollutants discharged. Cars contribute an estimated 65%, trucks 25% and
buses 10% of total air pollution from vehicles (15). The aged car fleet mostly does not comply
with modern environmental standards and is responsible for 70% of the emission of
hydrocarbons, NO2 and benzene. The sale of leaded petrol was prohibited in Moscow in 1993.
The standards for “city fuel” with lower concentrations of benzene and sulfur were
subsequently developed, and by 2000 the fuel required by Moscow’s vehicle fleet was fully
supplied with the cleaner fuel. These measures reduced pollutant emission from motor
vehicles by 15% (6).
Air emissions of the main pollutants are declining in Armenia (12). Since 1987 the emissions
from stationary sources decreased by more than 90% and by more than 70% from mobile
sources. During the same time, transport-related emissions increased to 90% of total emissions
in 1998 versus 67% in 1987. Even before the economic recession, transport pollution was the
main environmental concern. Given the renewed economic growth and extensive increase in
the number of motor vehicles, increasing air pollution can be expected, especially in large
cities. This can be ameliorated somewhat by replacing the very old vehicles with cars
equipped with catalytic converters. Data from the four largest cities in Armenia have shown
that the concentration of suspended PM, lead and NO2 often exceed both national maximum
permissible concentrations and WHO guidelines. For example, in 1995 the concentration of
lead in the air in Yerevan, which mostly originated from the road traffic emissions, was about
1.0–3.5 µg/m3, considerably higher than the WHO guideline value of 0.5 µg/m3. Vulnerable

19
groups such as children and elderly people suffer most from air pollution, especially during
the winter smog periods, when the high concentrations of sulfur dioxide (SO2) and total
suspended PM have been high and increased emissions from heating systems and power
plants add to those from transport.
Total air pollutants emitted by stationary and mobile sources have declined since the 1990s in
Azerbaijan as well. The decline from stationary sources was very sharp – from 2 million
tonnes in 1990 to 217 000 tonnes in 2002, one tenth as much (5). During the same period,
emissions from transport sources have grown rapidly, due to the rapid growth of car
ownership and car use and the decline of public transport services. In Baku alone, the total
emission from mobile sources reached 285 000 tonnes in 2001, exceeding all stationary
sources in the country combined. Ageing vehicles, poor fuel quality and the use of leaded
petrol worsen the emission problems and air pollution in large cities. In addition, few cars are
equipped with catalytic converters, which also leads to very high concentrations of CO, VOC
and NO. In 2002, 65% of total air emissions came from mobile sources (403 000 tonnes) and
35% from stationary sources. Most monitoring stations measure CO, SO2, NOx and total
suspended particles. However, the most health-damaging substances such as ground-level
ozone from transport emissions and PM10 and PM2.5 are not measured.
In Georgia, the proportion of pollution emitted from mobile sources increased from 70% of
total pollution emitted in 1991 to 91% in 2001, when they emitted 31% of the PM, 37% of the
SO2, 98% of the CO, 82% of the NOx and 90% of the non-methane VOC (3,6). Growing
motor transport, increasing traffic density, poor-quality fuel, a rising number of mostly
outdated and technically defective vehicles, insufficient fuel and vehicle-control systems and
poor public transport management largely contribute to the existing situation in Georgia. The
extensive use of leaded petrol causes serious health problems, especially for children, as their
intellectual development is vulnerable to lead exposure.
Air emissions from stationary sources have decreased by 50% in Kazakhstan since 1990 as a
result of a steep decline in industrial production (7). At the same time, transport-related
emissions, mostly concentrated in large cities, declined by 33%, but their proportion of the
total volume increased, reaching 90% of total emissions in Almaty. Air quality could be
improved by replacing ageing vehicles with cars equipped with catalytic converters. As the
use of high-octane leaded petrol is growing, the lead concentration in Almaty has been
increasing since 1988, reaching levels four times higher than limit values.
Transport-related emissions in Kyrgyzstan increased from 73% of total air pollution emissions
in 1988 to 83% in 1998 (13). In the most polluted part of Bishkek where traffic is very intense,
the concentrations of all pollutants exceed the permissible limits, except SO2. The highest
annual average concentration of suspended PM has been measured in the vicinity of the main

20
bus station, meaning that transport is the main source of PM. The annual mean concentration
of lead in the air is about 0.5–0.75 µg/m3, which is higher than the WHO guideline value. The
levels of polycyclic aromatic hydrocarbons and benzo[a]pyrene in areas with the highest level
of road traffic are 2–3 times higher than those in 1993. The concentration of transport-related
air pollutants is monitored in large cities, but the methods of monitoring currently applied
cannot assess the respirable fraction of pollution most important for health – PM10 and
PM2.5.
In Tajikistan, air pollution has declined in the past decade. In 2002, the air pollution emitted
by stationary sources declined to 30 800 tonnes versus 100 500 tonnes in 1991 (14). Transport
accounts for an increasing proportion of total air pollution. In the early 1990s, transport was
responsible for 77 000 tonnes, or 40% of total air pollution, but this increased to 70% in 2002.
In Ukraine, total emissions decreased, mainly due to declining industrial activity (8). In 1998
the total emissions from mobile sources were 31% of national levels, representing 63% of
emissions of lead, 54% of CO, 36% of VOC and 25% of NO. In some cities, mobile sources
provide up to 90% of total emissions. Cars are important contributors to air pollution, and
most still use leaded fuel; mobile sources emit 260 tonnes of lead annually.
The total emission of air pollutants in Uzbekistan is decreasing, mainly due to decreases from
stationary sources. These sources are losing their relative importance along with the constant
increase of the emissions from road transport, especially in urban areas. Emissions from
mobile sources increased from 1 316 000 tonnes in 1996 to 1 512 000 tonnes in 2000 and as a
share of total national emissions. Transport accounts for more than 60% of total emissions,
reaching 80% in Tashkent and other large cities. Transport is responsible for 90% of total CO
emission, more than 60% of NO emissions and 17% of PM and sulfur anhydride (SO3)
emissions (16). The use of low-quality leaded fuel and the increasing number of ageing
vehicles without catalytic converters are the main factors that contribute to air pollution from
transport. The continued extensive use of lead in fuel pollutes the environment especially in
large cities, and poses significant health concern. Up to 90% of lead emitted into the
atmosphere comes from vehicles. The high concentration of PM originating from the old
vehicles represents an additional pollution problem.
Health effects of transport-related air pollution
Overview of the health effects of transport-related air pollution
Outdoor air pollution due to motor vehicle transport presents a serious risk to the health of the
population.
21
About 100 000 people are estimated to die prematurely annually as a result of exposure to air
pollutants in the European Region. Of these, tens of thousand of deaths each year are
associated with transport-related air pollution, significantly reducing the life expectancy of
chronically exposed populations. Health risks imposed by transport-related air pollution
include increased cardiovascular and pulmonary morbidity and mortality and an increased risk
of developing non-allergic respiratory symptoms and of exacerbating allergic reactions. Lead
exposure has been associated with about 70 000 deaths per year in the European Region, with
the vast majority in the eastern part of the Region (17). In many EECCA countries, the
continued use of leaded fuel makes transport a major source of lead emissions. A WHO
assessment of air pollution in the EECCA countries indicated that annual mean values of total
suspended PM of 100–400 µg/m3 are quite common in large cities, where transport is
responsible for up to 75% of the total emissions of selected pollutants and is solely responsible
for air pollutants such as benzo[a]pyrene and PM (18). Children are especially vulnerable and
susceptible to exposure to air pollution. This is related to the ongoing process of lung growth
and development, an incomplete metabolic system and immature host defences. Exposure of
the developing lung to air pollution reduces the maximal functional capacity achieved as the
child enters adulthood and thus reduces the functional reserve. Among children, exposure to
air pollution, and especially to PM and ozone, has been associated with the exacerbation of
asthma attacks. Elevated concentrations of PM10 and PM2.5 are associated with both short-
and long-term cardiovascular and respiratory mortality and with respiratory morbidity and
decreasing lung functioning. Exposure to PM leads to increased prevalence and incidence of
bronchitis and cough. Exposure to lead from leaded fuel can have neurodevelopmental effects.
There is evidence for a causal relationship between exposure to lead, indicated by blood lead
concentrations of 100 mg/l and above, and neurobehavioural deficits in children. There is also
evidence for a causal relationship between PM air pollution and respiratory death in the post-
neonatal period. Children’s risk of mortality has been calculated to increase by 1% from
respiratory causes attributed to exposure to air pollution (19).
Assessing exposure
Estimating the effect of air pollution on human health in EECCA countries is difficult because
current monitoring systems are weak and do not allow population exposure to air pollution to
be estimated reliably. Emission reporting in most EECCA countries does not completely and
accurately portray national and urban emission patterns. The estimates of road transport
emissions are very often roughly calculated based on fuel composition. The monitoring
system is often still organized according to the old needs, more oriented towards controlling
industrial pollution than urban road transport emissions. The present system of norms and
standards for air quality in most countries is based on that inherited from the Soviet era.
Maximum permissible concentrations are often more stringent than WHO guideline values or
European Union standards, but few pollutants are monitored. Most monitoring stations
22
regularly measure CO, SO2, NO and total suspended PM. The most important weakness of
urban air monitoring in the EECCA countries is the lack of capacity to fully monitor and
analyse the respirable fractions of PM10 and PM2.5, which are considered good indicators of
exposure to air pollution and for which dose–response functions for a range of different health
outcomes are available from international epidemiological studies.
Various ministries and agencies share responsibility for air quality monitoring and control.
Various institutions are involved in establishing emission standards and measurement
methods, inspecting in-use vehicles, monitoring air quality and assessing public health and the
hygienic situation. Systems for monitoring air quality have to be strengthened, and PM10 and
PM2.5 should be monitored in the future given their relevance to health.
Basic regulations to reduce emissions of air pollutants from mobile sources such as fuel
standards or environmental requirements for motor fuel and modern emission controls for
vehicles are still lacking.
Health effects of transport-related air pollution in the EECCA countries
The most significant health effects of outdoor air pollution have been associated with PM10
and especially with PM2.5. To a lesser extent, ground-level ozone and lead are also of health
concern. A study of the burden of disease attributable to selected environmental factors among
Europe’s children indicates that outdoor air pollution accounts for a significant burden of
mortality among children. An estimated 4000 to 13 000 deaths per year among children 0–4 years old are attributable to outdoor air pollution (based on PM10),5 and up to 5000 annual
lives could be saved among children 0–4 years old if pollution levels were reduced across the
European Region to the European Union guideline level of 40 �g/m3 set for 2005. In the EUR B and C subregions to which the EECCA countries belong,6 outdoor air pollution is
estimated to be responsible for between 0.9% and 2.4% of children’s deaths from all causes
5 The lower estimate of 4000 deaths is based on applying relative risks to mortality from acute respiratory
infections only, whereas the upper estimate is based on applying relative risks to all causes of mortality. 6 The EUR B subregion within the European Region comprises countries with low child mortality and low
adult mortality and includes: Albania, Armenia, Azerbaijan, Bosnia and Herzegovina, Bulgaria, Georgia, Kyrgyzstan, Poland, Romania, Serbia and Montenegro, Slovakia, Tajikistan, The former Yugoslav Republic of Macedonia, Turkey, Turkmenistan and Uzbekistan.
The EUR C subregion comprises countries with low child mortality and high adult mortality and includes:
Belarus, Estonia, Hungary, Kazakhstan, Latvia, Lithuania, Republic of Moldova, Russian Federation and Ukraine.
The EUR A subregion comprises countries with very low adult mortality and very low child mortality.
The countries are: Andorra, Austria, Belgium, Croatia, Czech Republic, Denmark, Finland, France, Germany, Greece, Iceland, Ireland, Israel, Italy, Luxembourg, Malta, Monaco, Netherlands, Norway, Portugal, San Marino, Slovakia, Spain, Sweden, Switzerland and United Kingdom.
23
(relative risk is applied to acute respiratory infections only) and between 5.8% and 7.5%
(applying relative risk to all-cause mortality) among children 0–4 years of age (20).
Some national studies conducted in the EECCA countries have demonstrated that
concentrations of suspended PM at levels of 10–50 µg/m3 are associated with increased
respiratory morbidity and impaired lung functioning. In the large cities in EECCA countries,
the concentration of PM exceeds these levels, and these effects are therefore expected.
Available data from the Russian Federation show that increased pollution of urban air,
especially by suspended PM, is associated with an estimated 40 000 excess deaths in urban
areas (10,11). Data also suggest that each inhabitant of cities with the highest concentrations
of suspended PM loses about four years of life over a mean lifetime. The effects of high
concentrations of PM was assessed in the Republic of Moldova. According to national
estimates, suspended PM air pollution is associated with up to 200 premature deaths annually
and more than 5000 visits to accident and emergency departments. Studies conducted in
Armenia have shown that exposure to high concentrations of suspended PM is associated with
500 deaths annually among the population of Yerevan. Similar studies in Uzbekistan estimate
that elevated levels of suspended PM is associated with 21% of respiratory diseases and cause
3.4% of adult mortality (10). A study conducted in Tbilisi (Georgia) has shown that extensive
use of lead in petrol constitutes a serious public health problem, especially among children,
whose intellectual development is compromised by lead exposure. The population has a high
morbidity rate, increasing respiratory diseases, including bronchial asthma and pneumonia,
structural features of malignant tumours and a high prevalence of cardiovascular diseases, and
people living in areas with substantial road traffic have excessive blood lead concentrations
(21).
The elevated concentrations of NO2 from vehicle emissions are associated with an increase in
lower respiratory tract diseases among children. Studies conducted in Moscow showed that
the rates of diseases of the lower respiratory tract among children living close to transport
arteries carrying heavy traffic can be twice as high as those of the children living in less
polluted areas. Elevated concentrations of polycyclic aromatic hydrocarbons and
benzo[a]pyrene, which are known carcinogens, contribute to increasing the risk of cancer.
Increased exposure to lead resulting from the use of leaded petrol poses a risk of elevated
blood pressure and adverse effects on reproduction among adults and a risk of retarded
neuropsychological development among children. Chronic lead toxicity (blood lead
concentrations as low as 10 µg/dl or less) can cause significant neurological deficit among
infants and young children because the developing brain is uniquely vulnerable. Elevated
blood concentrations of lead have been estimated to be associated with 157 000 disability-
adjusted life years owing to mild mental retardation among European children aged 0–4 years,
and lead is responsible for 1.4% of the all-cause disability-adjusted life years lost in the
European Region. In the EUR B and C subregions to which the EECCA countries belong, lead
24
exposure has been associated with 0.9–3.1% of all-cause disability-adjusted life years lost
(20). Belarus, Kazakhstan, the Republic of Moldova, the Russian Federation and Ukraine are
among the most significant contributors to the total burden of lead-associated disease in the
European Region.
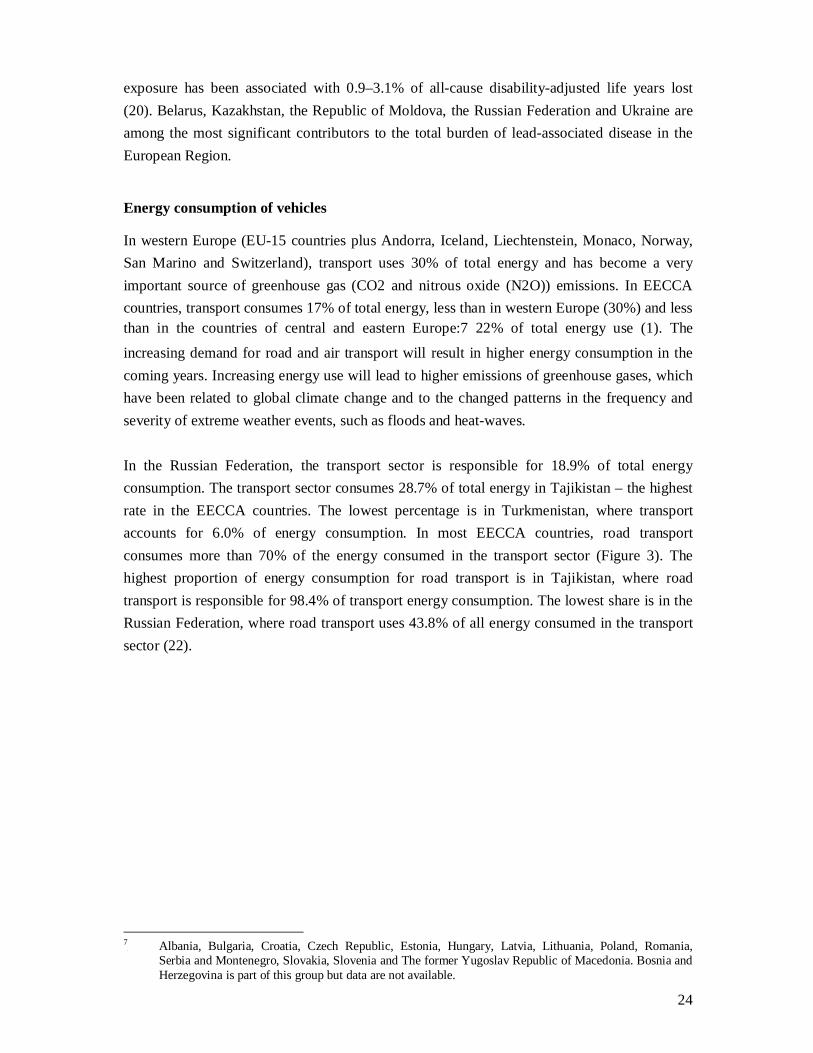
Energy consumption of vehicles
In western Europe (EU-15 countries plus Andorra, Iceland, Liechtenstein, Monaco, Norway,
San Marino and Switzerland), transport uses 30% of total energy and has become a very
important source of greenhouse gas (CO2 and nitrous oxide (N2O)) emissions. In EECCA
countries, transport consumes 17% of total energy, less than in western Europe (30%) and less than in the countries of central and eastern Europe:7 22% of total energy use (1). The
increasing demand for road and air transport will result in higher energy consumption in the
coming years. Increasing energy use will lead to higher emissions of greenhouse gases, which
have been related to global climate change and to the changed patterns in the frequency and
severity of extreme weather events, such as floods and heat-waves.
In the Russian Federation, the transport sector is responsible for 18.9% of total energy
consumption. The transport sector consumes 28.7% of total energy in Tajikistan – the highest
rate in the EECCA countries. The lowest percentage is in Turkmenistan, where transport
accounts for 6.0% of energy consumption. In most EECCA countries, road transport
consumes more than 70% of the energy consumed in the transport sector (Figure 3). The
highest proportion of energy consumption for road transport is in Tajikistan, where road
transport is responsible for 98.4% of transport energy consumption. The lowest share is in the
Russian Federation, where road transport uses 43.8% of all energy consumed in the transport
sector (22).
7 Albania, Bulgaria, Croatia, Czech Republic, Estonia, Hungary, Latvia, Lithuania, Poland, Romania,
Serbia and Montenegro, Slovakia, Slovenia and The former Yugoslav Republic of Macedonia. Bosnia and Herzegovina is part of this group but data are not available.
25
Figure 3. Energy used in transport as a percentage of total energy used in the EECCA countries, 2000
0
5
10
15
20
25
30
35
Armen
ia
Azerb
aijan
Belaru
s
Georg
ia
Kazak
hstan
Kyrgyz
stan
Republi
c of M
oldova
Russian
Federa
tion
Tajikis
tan
Turkmen
istan
Ukraine
Uzbek
istan
Per c
ent
Other modes of transport
Road transport
Source: United Nations Economic Commission for Europe (22).
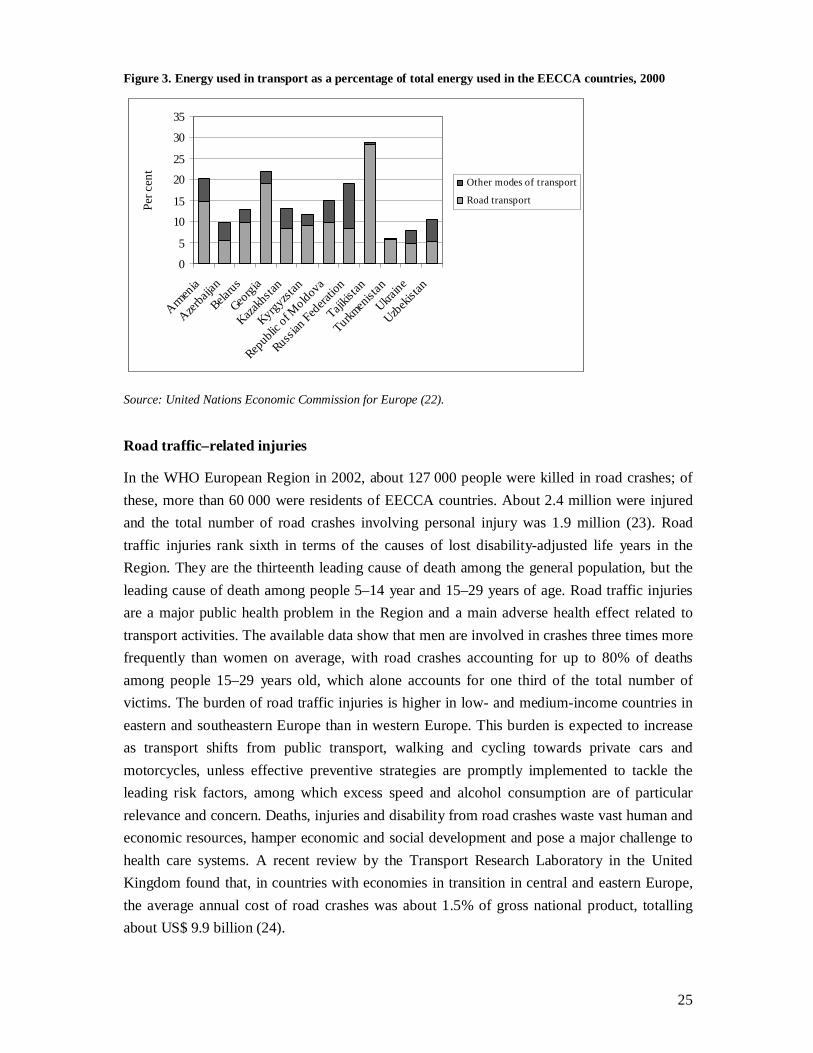
Road traffic–related injuries
In the WHO European Region in 2002, about 127 000 people were killed in road crashes; of
these, more than 60 000 were residents of EECCA countries. About 2.4 million were injured
and the total number of road crashes involving personal injury was 1.9 million (23). Road
traffic injuries rank sixth in terms of the causes of lost disability-adjusted life years in the
Region. They are the thirteenth leading cause of death among the general population, but the
leading cause of death among people 5–14 year and 15–29 years of age. Road traffic injuries
are a major public health problem in the Region and a main adverse health effect related to
transport activities. The available data show that men are involved in crashes three times more
frequently than women on average, with road crashes accounting for up to 80% of deaths
among people 15–29 years old, which alone accounts for one third of the total number of
victims. The burden of road traffic injuries is higher in low- and medium-income countries in
eastern and southeastern Europe than in western Europe. This burden is expected to increase
as transport shifts from public transport, walking and cycling towards private cars and
motorcycles, unless effective preventive strategies are promptly implemented to tackle the
leading risk factors, among which excess speed and alcohol consumption are of particular
relevance and concern. Deaths, injuries and disability from road crashes waste vast human and
economic resources, hamper economic and social development and pose a major challenge to
health care systems. A recent review by the Transport Research Laboratory in the United
Kingdom found that, in countries with economies in transition in central and eastern Europe,
the average annual cost of road crashes was about 1.5% of gross national product, totalling
about US$ 9.9 billion (24).

26
Figure 4. Standardized mortality rates from road traffic injuries per 100 000 population in the WHO European Region, 2002 or last year available
Source: WHO Regional Office for Europe (23).
The average mortality rate from road crashes in EECCA countries is higher than in the EU-15
countries and in central and eastern European countries. Mortality rates declined from 23.4 per
100 000 in 1991 to 15 per 100 000 in 2001, but they are still higher than in the European
Region as a whole (Figure 4; Figure 5). The decrease observed until 1997 could reflect more
the decline in transport activities, both in goods and in passenger transport, observed during
the 1990s rather than the results of strategies directed at improving road safety. This seems to
be supported by the observation that, starting in 1997, mortality rates from road traffic injuries
have again been rising, reflecting the increase in transport activities.
According to the WHO European health for all database, the average mortality rate from road
crashes in 2000 was 14.9 per 100 000 in the EECCA countries, 10.2 in the EU-15 countries and 13.6 in the CSEC countries.8 The highest mortality rates in EECCA countries are in the
Russian Federation, where mortality has reached 20.0 per 100 000 population, Belarus,
Ukraine, Kazakhstan and the Republic of Moldova, and the lowest in Armenia, Azerbaijan,
Georgia and Tajikistan.
8 Albania, Bosnia and Herzegovina, Bulgaria, Croatia, Czech Republic, Estonia, Hungary, Latvia,
Lithuania, Poland, Romania, Serbia and Montenegro, Slovakia, Slovenia and The former Yugoslav Republic of Macedonia.
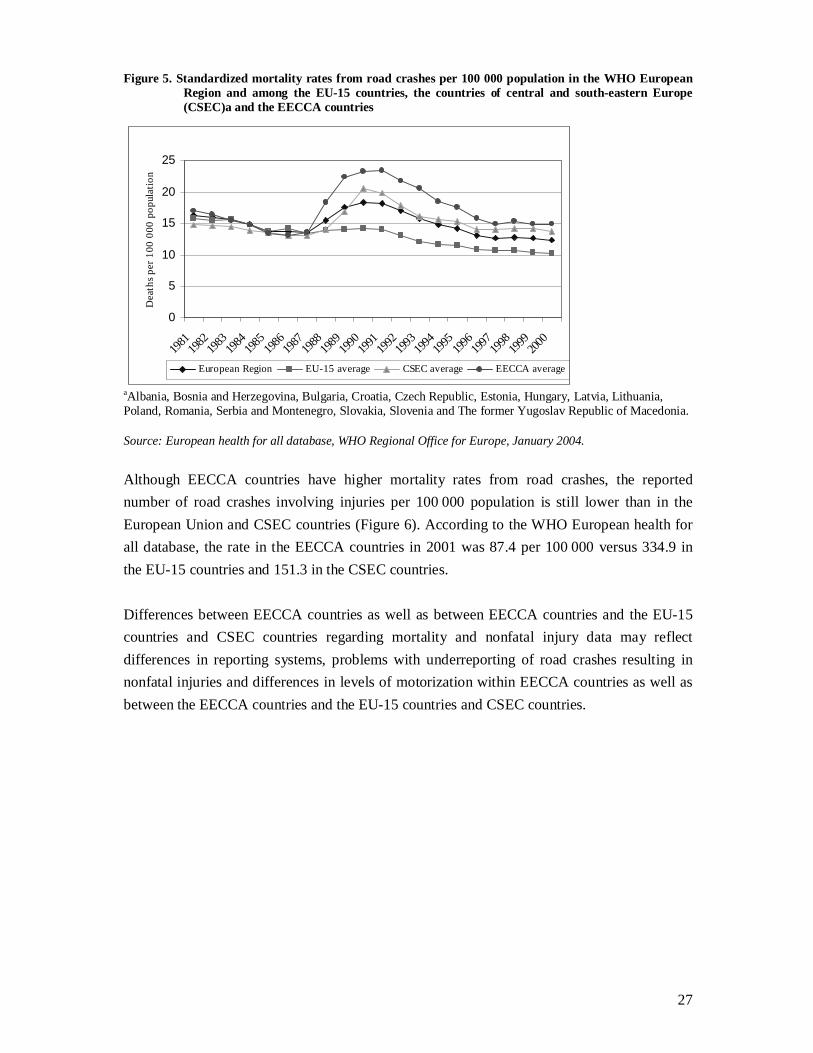
27
Figure 5. Standardized mortality rates from road crashes per 100 000 population in the WHO European Region and among the EU-15 countries, the countries of central and south-eastern Europe (CSEC)a and the EECCA countries
0
5
10
15
20
25
1981
1982
1983
1984
1985
1986
1987
1988
1989
1990
1991
1992
1993
1994
1995
1996
1997
1998
1999
2000
Year
Dea
ths
per
100
000
popu
lati
on
European Region EU-15 average CSEC average EECCA average
aAlbania, Bosnia and Herzegovina, Bulgaria, Croatia, Czech Republic, Estonia, Hungary, Latvia, Lithuania, Poland, Romania, Serbia and Montenegro, Slovakia, Slovenia and The former Yugoslav Republic of Macedonia.
Source: European health for all database, WHO Regional Office for Europe, January 2004.
Although EECCA countries have higher mortality rates from road crashes, the reported
number of road crashes involving injuries per 100 000 population is still lower than in the
European Union and CSEC countries (Figure 6). According to the WHO European health for
all database, the rate in the EECCA countries in 2001 was 87.4 per 100 000 versus 334.9 in
the EU-15 countries and 151.3 in the CSEC countries.
Differences between EECCA countries as well as between EECCA countries and the EU-15
countries and CSEC countries regarding mortality and nonfatal injury data may reflect
differences in reporting systems, problems with underreporting of road crashes resulting in
nonfatal injuries and differences in levels of motorization within EECCA countries as well as
between the EECCA countries and the EU-15 countries and CSEC countries.
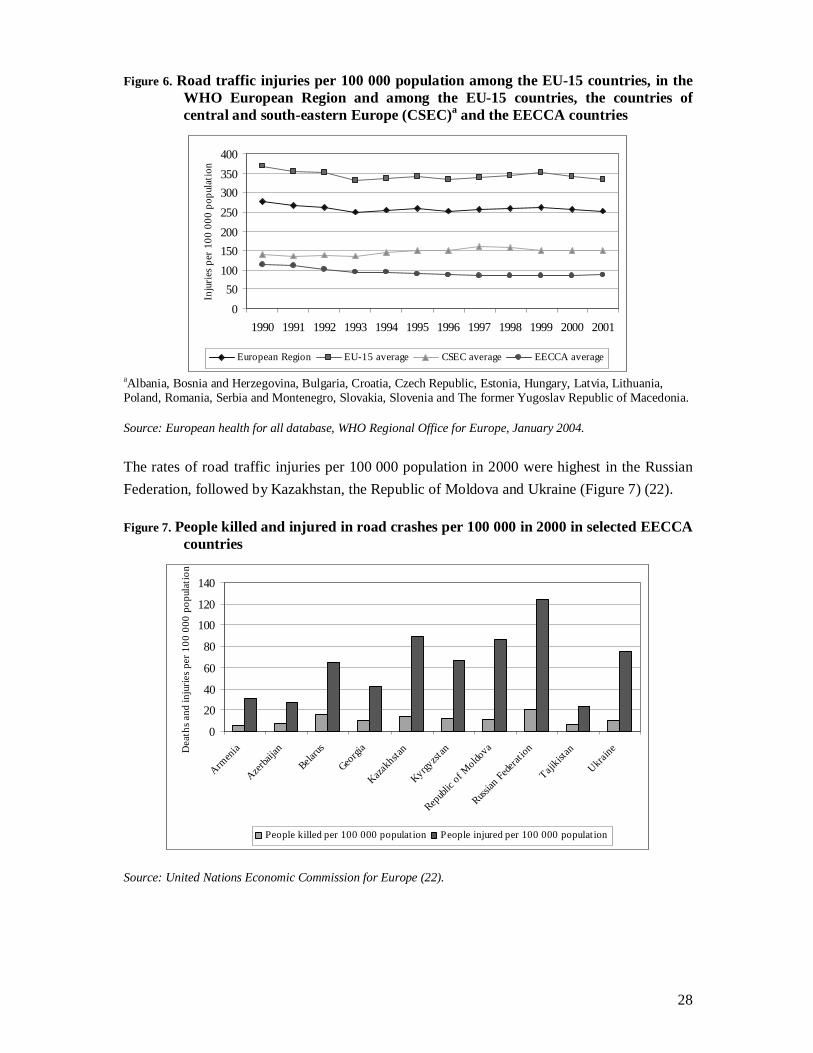
28
Figure 6. Road traffic injuries per 100 000 population among the EU-15 countries, in the WHO European Region and among the EU-15 countries, the countries of central and south-eastern Europe (CSEC)a and the EECCA countries
0
50
100
150
200
250
300
350
400
1990 1991 1992 1993 1994 1995 1996 1997 1998 1999 2000 2001
Inju
ries
per
100
000
pop
ulat
ion
European Region EU-15 average CSEC average EECCA average
aAlbania, Bosnia and Herzegovina, Bulgaria, Croatia, Czech Republic, Estonia, Hungary, Latvia, Lithuania, Poland, Romania, Serbia and Montenegro, Slovakia, Slovenia and The former Yugoslav Republic of Macedonia.
Source: European health for all database, WHO Regional Office for Europe, January 2004.
The rates of road traffic injuries per 100 000 population in 2000 were highest in the Russian
Federation, followed by Kazakhstan, the Republic of Moldova and Ukraine (Figure 7) (22).
Figure 7. People killed and injured in road crashes per 100 000 in 2000 in selected EECCA countries
0
20
40
60
80
100
120
140
Armen
ia
Azerb
aijan
Belaru
s
Georg
ia
Kazak
hstan
Kyrgyzs
tan
Repub
lic of M
oldo
va
Russian
Feder
at ion
Tajikist
an
Ukrain
eDea
ths
and
inju
ries
per
100
000
pop
ulat
ion
People killed per 100 000 populat ion People injured per 100 000 populat ion
Source: United Nations Economic Commission for Europe (22).

29
The analysis of crashes involving personal injuries show that most crashes occur in built-up
areas where, when they are not congested, driving speeds are often dangerously high, and
speed limits are higher than what would be considered appropriate based on current
knowledge (Figure 8). For example, according to the ECMT data on speed limits in force in
various ECMT Member States, Azerbaijan, Belarus, the Republic of Moldova and the Russian
Federation have a speed limit of 60 km/h in built-up areas, whereas broad scientific consensus
indicates that speed should not exceed 50 km/h in urban areas and 30 km/h in residential areas
and other areas with great potential conflict between vulnerable road users and motorized
vehicles. In 2001, 84% of all crashes involving injury in Georgia occurred in built-up areas,
the highest share among EECCA countries. The lowest share was in Azerbaijan, where only
51% of crashes with injuries occurred in built-up areas (25). Unless effective preventive
measures are implemented, the share of crashes in urban areas may continue to grow as the
private motor vehicle fleet increases, especially in large cities, where different types of road
users are more likely to interact and excessive speed plays a major role in determining the
frequency and severity of road crashes.
Figure 8. Road crashes in built-up areas involving personal injury in 2001 as a percentage of total road crashes in selected EECCA countries
0102030405060708090
Armen
ia
Azerb
aijan
Belaru
s
Georg
ia
Kazak
hstan
Kyrgy
zstan
Republi
c of M
oldova
Russian
Federa
tion
Ukraine
Per c
ent
Source: United Nations Economic Commission for Europe (25).
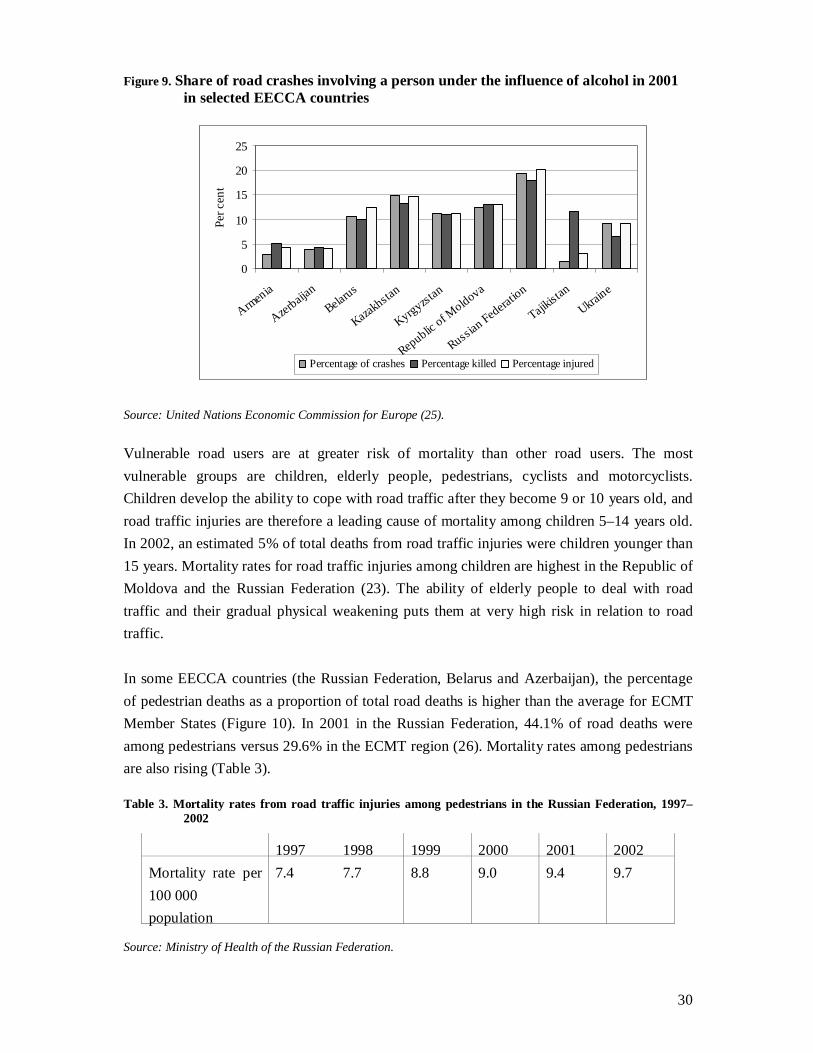
Data related to the involvement of alcohol in road crashes are very patchy and of very limited
comparability owing to important differences among countries in detection and reporting
procedures and in alcohol consumption patterns. Nevertheless, international data indicate that
the percentage of road crashes in which alcohol is involved is higher in the Russian Federation
(19.4% in 2001) than in other EECCA countries (Figure 9). Road crashes involving alcohol
are reported to be responsible for 18% of the deaths and 20% of the injuries from road crashes
in the Russian Federation. These percentages are lower in Armenia and Azerbaijan (26).
30
Figure 9. Share of road crashes involving a person under the influence of alcohol in 2001 in selected EECCA countries
0
5
10
15
20
25
Armen
ia
Azerbaij
an
Belarus
Kazakh
stan
Kyrgyzstan
Republic
of Moldova
Russian
Federa
tion
Tajikis
tan
Ukraine
Per c
ent
Percentage of crashes Percentage killed Percentage injured
Source: United Nations Economic Commission for Europe (25).
Vulnerable road users are at greater risk of mortality than other road users. The most
vulnerable groups are children, elderly people, pedestrians, cyclists and motorcyclists.
Children develop the ability to cope with road traffic after they become 9 or 10 years old, and
road traffic injuries are therefore a leading cause of mortality among children 5–14 years old.
In 2002, an estimated 5% of total deaths from road traffic injuries were children younger than
15 years. Mortality rates for road traffic injuries among children are highest in the Republic of
Moldova and the Russian Federation (23). The ability of elderly people to deal with road
traffic and their gradual physical weakening puts them at very high risk in relation to road
traffic.
In some EECCA countries (the Russian Federation, Belarus and Azerbaijan), the percentage
of pedestrian deaths as a proportion of total road deaths is higher than the average for ECMT
Member States (Figure 10). In 2001 in the Russian Federation, 44.1% of road deaths were
among pedestrians versus 29.6% in the ECMT region (26). Mortality rates among pedestrians
are also rising (Table 3).
Table 3. Mortality rates from road traffic injuries among pedestrians in the Russian Federation, 1997–2002
1997 1998 1999 2000 2001 2002
Mortality rate per
100 000
population
7.4 7.7 8.8 9.0 9.4 9.7
Source: Ministry of Health of the Russian Federation.
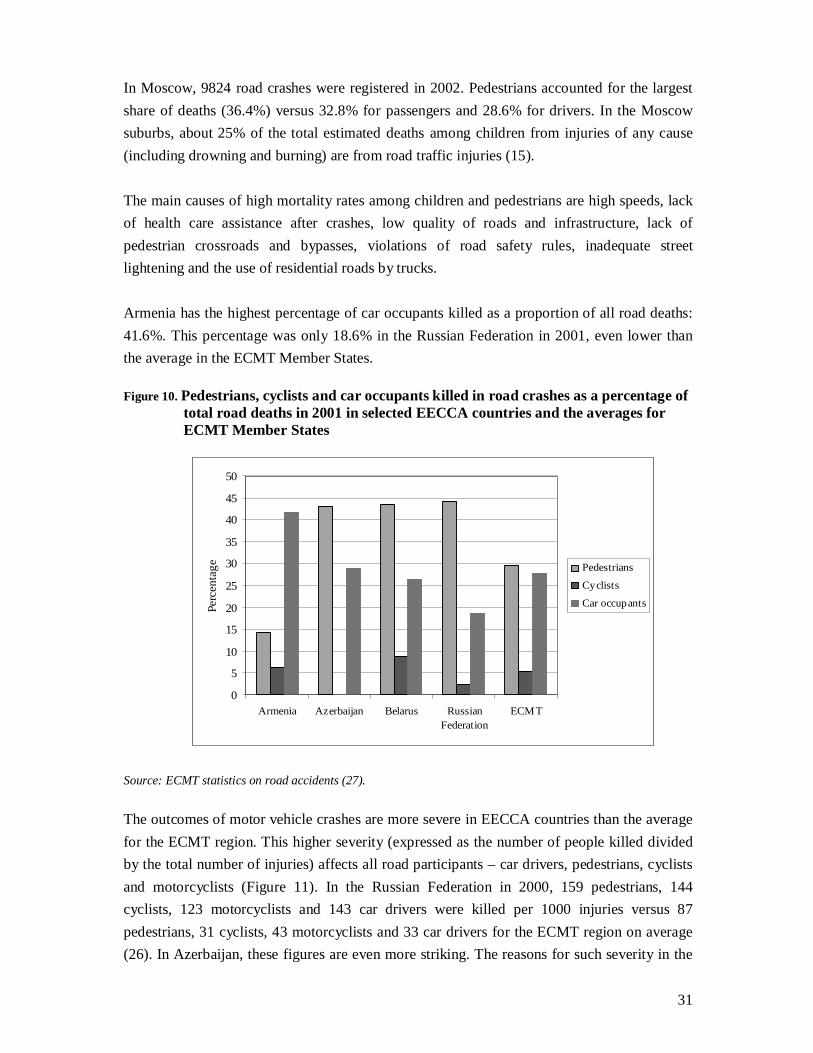
31
In Moscow, 9824 road crashes were registered in 2002. Pedestrians accounted for the largest
share of deaths (36.4%) versus 32.8% for passengers and 28.6% for drivers. In the Moscow
suburbs, about 25% of the total estimated deaths among children from injuries of any cause
(including drowning and burning) are from road traffic injuries (15).
The main causes of high mortality rates among children and pedestrians are high speeds, lack
of health care assistance after crashes, low quality of roads and infrastructure, lack of
pedestrian crossroads and bypasses, violations of road safety rules, inadequate street
lightening and the use of residential roads by trucks.
Armenia has the highest percentage of car occupants killed as a proportion of all road deaths:
41.6%. This percentage was only 18.6% in the Russian Federation in 2001, even lower than
the average in the ECMT Member States.
Figure 10. Pedestrians, cyclists and car occupants killed in road crashes as a percentage of total road deaths in 2001 in selected EECCA countries and the averages for ECMT Member States
0
5
10
15
20
25
30
35
40
45
50
Armenia Azerbaijan Belarus RussianFederation
ECMT
Perc
enta
ge Pedestrians
Cyclists
Car occupants
Source: ECMT statistics on road accidents (27).
The outcomes of motor vehicle crashes are more severe in EECCA countries than the average
for the ECMT region. This higher severity (expressed as the number of people killed divided
by the total number of injuries) affects all road participants – car drivers, pedestrians, cyclists
and motorcyclists (Figure 11). In the Russian Federation in 2000, 159 pedestrians, 144
cyclists, 123 motorcyclists and 143 car drivers were killed per 1000 injuries versus 87
pedestrians, 31 cyclists, 43 motorcyclists and 33 car drivers for the ECMT region on average
(26). In Azerbaijan, these figures are even more striking. The reasons for such severity in the

32
EECCA countries could be combinations of different factors, such as excessive speed, the
poor condition of the roads and vehicles (such as poor crashworthiness and tire blowouts
while driving), inadequate skills of road users and inadequate provision of emergency services
and trauma care.
Figure 11. Crash severity: pedestrians, cyclists and car occupants killed in road crashes per 1000 injuries in selected EECCA countries, 2000
0
50
100
150
200
250
300
350
Armen
ia
Azerb
aijan
Belaru
s
Russia
n Fed
eratio
n
Ukraine
ECM
T
Num
ber p
er 1
000
casu
altie
s
Pedestrians
Cyclists
Car occupants
Source: ECMT statistics on road accidents (27).
The alarming situation of road safety in the EECCA countries indicates the urgent need for
strong political leadership to mobilize commitment and engage a range of relevant sectors and
stakeholders, which include the transport, health, justice and education sectors as well as the
private sector and civil society, towards sharing the responsibility for implementing effective
preventive measures. In so doing, two paradigm shifts ought to take place.
1. Road safety should become a built-in component of transport systems rather than the road
users being solely responsible. This places higher responsibility for road safety on the
designers and providers of transport infrastructure, means and services and requires that those
planning transport systems consider that users are prone to make errors.
2. Road safety should be seen as an integral part of sustainable transport and addressed
along with policies that tackle other transport-related health effects. For example, speed
control not only reduces the risk and severity of road crashes but contributes to reducing
emissions of noise and air pollutants and to creating conditions that are less intimidating for
vulnerable road users.
Although these are long-term goals that require sustained commitment over the next decades,
action can be taken now without delay in implementing well-known and cost-effective
33
measures such as reducing speed and respecting speed limits, wearing seat-belts, wearing
helmets, using other safety restraints, preventing drink-driving and respecting vulnerable road
users. In addition, improving first aid and emergency services and the treatment and
rehabilitation of victims of injuries should receive higher priority.
Transport-related noise in urban settings
Transport activities and especially road traffic are the main sources of noise pollution in
Europe and the major cause of human exposure to noise. Evidence indicates that high levels of
noise affect communication, school performance and sleep and can cause adverse
cardiovascular effects and hearing impairment. When continuous background noise (LAeq)
exceeds 55 dB, people have to raise their voice to maintain good communication. Continuous
noise exceeding 30 dB(LAeq) and peak indoor noise exceeding 45 dB(LAmax) can cause
difficulty in falling asleep, reduction in deep resting sleep, increased awakening during sleep
and adverse effects such as fatigue and decreased performance. High levels of noise interfere
with mental activities of children, including acquiring reading skills, memorizing, paying
attention and dealing with complex analytical problems. Noise at 55 dB(LAeq) seriously
annoys people, and 80 dB(LAeq) makes them aggressive and reduces people’s willingness to
help others. Noise at 65–70 dB(LAeq) has some effect on the development of ischaemic heart
disease; given the high percentage of the population chronically exposed to such noise, it
could be very important for public health (27).
In the EECCA countries, noise pollution has been reduced overall in recent years. The main
reasons are reduction of industrial activity because of economic crisis and the improved
technology in many plants.
Nevertheless, noise pollution from transport is steadily increasing. The main contributors are
motor vehicles and aircraft. In the large cities in EECCA countries, the noise level near major
roads, airports and railroads is increasing significantly. One main reason is the growth in the
number of private vehicles and the accompanying increased transport activity.
In Moscow, 70–80% of the population lives in conditions of high noise pollution causing
acoustic discomfort from intensive motorized transport activities (10,11).
In Armenia, transport activities account for about 90% of the noise emitted in urban areas.
Noise levels have increased rapidly in recent years, mainly due to increasing motor vehicle
traffic, the declining quality of road surfaces and the ageing motor vehicle fleet. In some
residential areas near highways, noise reaches 80–90 dB(A). In Yerevan, about 30% of the
population is exposed to noise exceeding 65 dB(A). A survey in Yerevan showed that people
34
living in apartments where noise exceeded 60 dB(A) experienced serious annoyance and sleep
disturbance (10).
In Belarus, urban noise is increasing, mainly because road traffic noise is intensifying. In
Minsk, noise levels near transport arteries reach up to 83 dB(A), and about 60% of public
complaints concerning urban noise are about road traffic noise (10).
In Georgia, road traffic noise has reached disturbing levels in the major cities because road
traffic density is rising. Noise measurements in Tbilisi showed levels of 70–80 dB(A) in some
residential areas, mainly because of increased road traffic, deterioration in road quality and
very noisy engines in ageing cars (10). An additional burden is the frequent traffic jams and
recently increased number of minibus taxis, mostly in poor condition.
Data from the Republic of Moldova indicate that the composition of the vehicle fleet,
especially its age and its maintenance conditions, contributes to high noise levels in addition
to poor-quality road surfaces.
In Ukraine, transport is the major source of noise. Noise levels in buildings around main road
transport arteries in large cities are 85 dB(A), much higher than allowable standards (65
dB(A)) (8). In Uzbekistan, noise from transport is increasing, reaching 70–80 dB(A) in some
areas (9).
Risks and effects related to reduced physical activity
The overall trends of increasing numbers of private cars in the EECCA countries negatively
affect the daily life of the population. People ride in cars more frequently than they walk.
The increased shift in transport modes towards more private motorization as well as
unintegrated urban land-use planning leads to urban sprawl and decreases the opportunities for
physical activity practised through walking and cycling. The links between physical inactivity
and a broad range of noncommunicable diseases have been well established. These include
cardiovascular diseases, non-insulin-dependent diabetes mellitus, hypertension and some types
of cancer as well as risks related to overweight and obesity. Although available data are very
scarce, WHO (17) has estimated that 20–25% of the population in the EECCA countries is
physically inactive versus 17% in the EUR A countries. Mortality attributed to physical
inactivity accounts for 5–10% of the total mortality in various European countries, and
estimated 600 000 deaths per year in the WHO European Region. In the EUR B and C
subregions to which the EECCA countries belong, mortality attributable to physical inactivity
could be in the range of 8–10% of total mortality (17).
35
Because noncommunicable diseases have very great health effects and costs to society and to
the health sector, the loss of opportunities for integrating physical activity as part of daily life
is especially worrying in this part of the European Region, where investing in safe walking
and cycling, in combination with efficient public transport, could play a major role in re-
establishing or maintaining adequate levels of physical activity among the general population.
Policy on urban land-use planning and transport
Transport planning that is not integrated with urban land-use planning and environmental and
health considerations promotes the predominance of the private car and worsens congestion;
leads to more investment in new roads and parking space instead of public transport
infrastructure and services; and promotes urban sprawl, which further increases dependence
on cars for reaching services and jobs. The dense public transport network in urban areas of
the EECCA countries is being replaced by infrastructure to satisfy the growing demand for
private road transport. This trend affects the community environments of city residents and the
quality of life in the cities by reducing opportunities for walking and cycling and by reducing
green spaces. Roads seriously influence community environments, and historical buildings are
damaged by pollution and constant vibration from heavy road traffic.
The current unintegrated, institutionally separated policies and decisions on transport,
environment, health and urban land-use planning have led to unhealthy and unsustainable
urban areas. Unintegrated urban travel policies and land-use planning in the EECCA countries
contribute to increasing the dependence on car use and the length of the trips taken. Increasing
road traffic has many damaging effects, mainly crashes, noise, air pollution, adverse social
effects, lack of physical exercise, congestion, consumption of space in cities and urban sprawl.
In addition, it increases energy use, land use, crashes and pollution.
Urban development and land-use planning must be reoriented to the needs of effective public
transport. Public transport can achieve the same or better mobility for citizens in far less space
than private transport: metros can travel underground and create opportunities for buildings
overhead, and buses use 3–10% as much space as cars, including the space used for parking
and roads. Funds need to be redirected from building road infrastructure to developing public
transport and managing transport demand. Developing public transport leads to reduced road
traffic, emissions, noise, energy use and crashes. Developed public transport systems take less
space, encourage walking and cycling, use less land and reduce urban sprawl. Increased urban
sprawl spreads public transport more thinly over a wider area, thus making journeys longer
and more expensive. As a result of its reduced economic efficiency, public transport may
cease to exist. Developing the public transport system therefore has to be given priority in the
development of integrated travel policies and urban land-use planning.
36
Conclusions and recommendations for further steps
Over the past few years, EECCA countries have experienced a drastic increase in the number
of motor vehicles and a steady growth in passenger car ownership and freight transport. This
“new” fleet largely consists of old, poorly maintained and highly polluting vehicles. The
constantly increasing rate of car ownership and motorization is especially pronounced in
capitals and in large cities. This increase reflects economic growth and changes in social
aspirations and attitudes and in the mobility and accessibility needs of the population in these
countries. Nevertheless, it is promoted by the decline in the quality and quantity of public
transport, which is experiencing great difficulties in maintaining or regaining competitiveness
as compared with private transport in the absence of supportive policies and investments.
The volume of transport in the EECCA countries is growing at the expense of the environment
and the health of the population, especially the most vulnerable groups and young people, and
the quality of the urban environment. In EECCA countries, especially in urban areas, transport
has now become the main source of emissions of air pollutants (including lead, which is still
used as a fuel additive in most EECCA countries) and noise. Although the current systems for
monitoring air quality do not allow the population exposure to transport-related air pollution
to be reliably estimated, evidence available from the few studies carried out in these countries
indicates that the number of premature deaths related to air pollution is on the order of tens of
thousands per year. Transport has also become a leading cause of death and disability through
road traffic injuries, especially affecting the youngest and most economically active part of the
population as well as vulnerable groups such as children, elderly people, pedestrians and
cyclists. The increasing use of private vehicles is also contributing to making the lifestyle of
the population in EECCA countries increasingly sedentary, thereby increasing the risk of
severe diseases.
In addition, the development of new road infrastructure to cater for the increasing demand for
road transport and to deal with growing congestion unaccompanied by integrated urban land-
use planning reduces urban space that could be available for pedestrians and cyclists. This
creates conditions that are increasingly unsafe and hostile for those who do not choose or
cannot afford private transport and further reduces the ability of public transport to maintain
its competitiveness.
These issues represent a huge cost to society and drain important resources that could be made
available to address other priority development goals of EECCA countries. Road traffic
injuries alone are estimated to cost about 1.5% of gross domestic product: in EECCA
countries, about US$ 10 billion per year.
37
These issues cannot be addressed without profoundly rethinking transport management and
urban development in the EECCA countries and making a very strong political commitment to
invest in a new range of policies and interventions that can address simultaneously the various
challenges posed to health and to the environment.
This requires developing improved understanding of the complexities of the relationship
between transport and its effects on health and the environment, which in turn requires the
capacity to bring together various skills and sectors and to develop the necessary institutional
and policy tools that foster the dialogue between and the participation of relevant sectors in
the decisions affecting transport and urban development.
Continuing with transport planning that is not integrated with urban land-use planning and
environmental and health considerations will: further promote the predominance of the private
car; worsen urban congestion; lead to more investment in new roads and parking spaces
instead of in public transport infrastructure and services; and promote urban sprawl, which
further increases people’s dependence on cars for reaching services and jobs, ultimately
aggravating the burden of transport on the health of millions of people in these countries.
Several legal, policy, analytical and planning tools are available at the pan-European level to
provide a legal basis or a reference framework for developing national strategies for
integrating environmental and health considerations into transport and urban planning. They
include notably the UNECE and WHO Transport, Health and Environment Pan-European
Programme of UNECE and WHO; the Convention on Environmental Impact Assessment in a
Transboundary Context and the Protocol on Strategic Environmental Assessment to this
Convention; and the Children’s Environment and Health Action Plan for Europe (CEHAPE).
The EECCA countries should consider taking advantage of these tools and actively
implementing them to foster intersectoral cooperation and to improve understanding of the
environment and health effects of various transport policy options for making more informed
and transparent decisions.
EECCA countries should consider giving higher priority to developing and implementing
instruments such as environmental impact assessment, health impact assessment and strategic
environmental assessment. These bring together multidisciplinary teams of experts and
relevant stakeholders and undertake prior assessment of the effects that policies, plans and
programmes related to transport and urban development would be likely to have on health and
the environment. They also identify measures that may prevent or mitigate possible adverse
effects of the proposed intervention or policy. EECCA countries can leverage on their
experience, such as that provided by frameworks similar to environmental impact assessment
(including strategic environmental assessment) and hygiene assessment, which is in place in
most EECCA countries. They have common features based on the system of state
38
environmental review of planned actions including strategic proposals. As such these can be
considered as a process similar to strategic environmental assessment (28). According to
legislation in the Russian Federation, state environmental review is mandatory, and
environmental impact assessment (OVOS) may apply to strategic actions, including transport
plans and policies.
EECCA countries should specifically consider actively participating in and fostering the
implementation of the following policy instruments:
� the Protocol on Strategic Environmental Assessment to the Convention on
Environmental Impact Assessment in a Transboundary Context requires that
proposed strategic policy decisions be assessed for their potential effects on the
environment and health, which would be a major step in considering health
aspects as part of planning in transport and land use;
� the Transport, Health and Environment Pan European Programme managed by
WHO and the UNECE secretariat, which identifies the issues faced by EECCA
countries as a priority area for international action and support and facilitates
the establishment of a dialogue and the exchange of information and
experiences between the relevant sectors and the different parts of the European
Region, especially addressing the health and environmental effects of transport
in the urban environment;
� the Children’s Environment and Health Action Plan for Europe, which sets out
goals and proposed actions to reduce exposure to harmful environmental
factors and to give priority to preventing childhood diseases, including injuries,
the effects of lack of physical activity and exposure to air pollution and noise.
In particular, the Plan supports child-friendly urban planning and advocates
safe access to green spaces and safer mobility within the community.
Further, to tackle the transport, environment and health externalities arising from urban
transport and to promote sustainable and healthy urban mobility, the EECCA countries should
consider addressing the following issues on a priority basis:
� phasing out lead from petrol and improving the quality of fuel, involving
ratifying and implementing relevant international regulations, notably the
Protocol on Heavy Metals to the Convention on Long-range Transboundary Air
Pollution; and improving standards, data collection, vehicle inspections,
emissions testing, monitoring, fuel pricing and other economic instruments;
� investing in maintaining and upgrading the public transport infrastructure, fleet
and services to offer a competitive and attractive alternative to private car use;
39
� increasing the use of economic assessment of the possible effects of alternative
transport and urban development options and economic instruments to manage
the demand for transport;
� mobilizing political commitment towards implementing effective preventive
measures for reducing and preventing traffic-related crashes and injuries, by
implementing measures such as those addressing excessive speeds in urban
areas, driving under the influence of alcohol or other substances of abuse and
using the necessary safety devices, such as seat-belts, child restraints and
helmets; in strengthening the prevention of road traffic injuries, EECCA
countries could especially consider the recommendations of the World report
on road traffic injury prevention (29) and of Preventing road traffic injury: a
public health perspective for Europe (23); and
� improving the availability and quality of data to support informed and
evidence-based decision making, especially striving to improve the monitoring
and assessment of exposure to air pollution and noise, the risk of injuries and
the levels of physical activity.

40
References
1. Europe’s environment: the third assessment. Copenhagen, European Environment
Agency, 2003 (http://reports.eea.eu.int/environmental_assessment_report_2003_10/en,
accessed 17 September 2004).
2. Statistics of road traffic accidents in Europe and North America. 49th ed. Geneva, United
Nations Economic Commission for Europe, 2004.
3. Environmental performance review of Georgia. Geneva, United Nations Economic
Commission for Europe, 2003 (http://www.unece.org/env/epr/countriesreviewed.htm,
accessed 17 September 2004).
4. Environmental performance review of Moldova. Geneva, United Nations Economic
Commission for Europe, 1998 (http://www.unece.org/env/epr/countriesreviewed.htm,
accessed 17 September 2004).
5. Environmental performance review of Azerbaijan. Geneva, United Nations Economic
Commission for Europe, 2003 (http://www.unece.org/env/epr/countriesreviewed.htm,
accessed 17 September 2004).
6. Donchenko V et al. Promotion of the public transport as a base for sustainable urban
transport in Moscow City. A case study from Russian Federation. Geneva, Transport,
Health and Environment Pan European Programme, 2003
(http://www.thepep.org/en/workplan/urban/documents/RussianFederation.pdf accessed 17
September 2004).
7. Environmental performance review of Kazakhstan. Geneva, United Nations Economic
Commission for Europe, 2000 (http://www.unece.org/env/epr/countriesreviewed.htm,
accessed 17 September 2004).
8. Environmental performance review of Ukraine. Geneva, United Nations Economic
Commission for Europe, 1999 (http://www.unece.org/env/epr/countriesreviewed.htm,
accessed 17 September 2004).
9. Environmental performance review of Uzbekistan. Geneva, United Nations Economic
Commission for Europe, 2001 (http://www.unece.org/env/epr/countriesreviewed.htm,
accessed 17 September 2004).
10. Health and the environment in the WHO European Region: situation and policy at the
beginning of the 21st century. Copenhagen, WHO Regional Office for Europe, 2004
(http://www.euro.who.int/document/eehc/ebakdoc05.pdf, accessed 17 September 2004).
41
11. Fokin MV et al. [National environmental health profile of the Russian Federation.]
Moscow, Federal Center for Sanitary and Epidemiological Surveillance, 2003.
12. Environmental performance review of Armenia. Geneva, United Nations Economic
Commission for Europe, 2000 (http://www.unece.org/env/epr/countriesreviewed.htm,
accessed 17 September 2004).
13. Environmental performance review of Kyrgyzstan. Geneva, United Nations Economic
Commission for Europe, 2000 (http://www.unece.org/env/epr/countriesreviewed.htm,
accessed 17 September 2004).
14. Environmental performance review of Tajikistan. Geneva, United Nations Economic
Commission for Europe, 2004 (http://www.unece.org/env/epr/countriesreviewed.htm,
accessed 17 September 2004).
15. United Nations Economic Commission for Europe and WHO Regional Office for Europe.
Sustainable and healthy urban transport and land-use planning. Geneva, Transport,
Health and Environment Pan European Programme 2003
(http://www.thepep.org/en/workplan/urban/urban_docs.htm, accessed 17 September
2004).
16. United Nations Economic Commission for Europe and WHO Regional Office for Europe. A case study from Uzbekistan. Necessary environmental protection measures for reduction of environmental contamination due to transport in Uzbekistan. Geneva, Transport, Health and Environment Pan European Programme 2003 (http://www.thepep.org/en/workplan/urban/urban_docs.htm, accessed 17 September 2004).
17. World health report 2002: reducing risk, promoting healthy life. Geneva, World Health
Organization, 2002 (http://www.who.int/whr/2002/en, accessed 17 September 2004).
18. NIS environment strategy. Background paper “Pollution prevention and control”. Section
“Reducing urban air pollution”. Copenhagen: WHO Regional Office for Europe, 2002
(http://www.euro.who.int/document/aiq/nisaqbde.pdf, accessed 17 September 2004).
19. The effects of air pollution on children’s health and development: a review of the
evidence. Executive summary. Copenhagen: WHO Regional Office for Europe, 2004
(http://www.euro.who.int/document/EEHC/execsum.pdf, accessed 17 September 2004).
20. Burden of disease attributable to selected environmental factors and injuries among
Europe’s children and adolescents. Copenhagen, WHO Regional Office for Europe, 2004
(http://www.euro.who.int/eprise/main/WHO/Progs/CHE/Monitoring/20040519_1,
accessed 17 September 2004).

42
21. National environment and health plan for Georgia. Tbilisi, Ministry of Labour, Health and
Social Affairs of Georgia, 2003.
22. Annual bulletin of transport statistics for Europe and North America. Geneva, United
Nations Economic Commission for Europe, 2003.
23. Preventing road traffic injury: a public health perspective for Europe. Copenhagen, WHO
Regional Office for Europe, 2004
(http://www.euro.who.int/eprise/main/WHO/Progs/TRT/injuries/20040326_2, accessed 17
September 2004).
24. Jacobs G, Aeron-Thomas A, Astrop A. Estimating global road fatalities. Crowthorne,
Transport Research Laboratory, 2000.
25. Statistics of road traffic accidents in Europe and North America. 48th ed. Geneva, United
Nations Economic Commission for Europe, 2002.
26. ECMT statistics on road accidents. Paris, European Conference of Ministers of Transport,
2002 (http://www1.oecd.org/cem/stat/accidents, accessed 17 September 2004).
27. Transport, environment and health. Copenhagen, WHO Regional Office for Europe
(WHO Regional Publications, European Series, No. 89;
(http://www.euro.who.int/document/e72015.pdf, accessed 17 September 2004).
28. Strategic environmental assessment: an international review. London, International
Institute for Environment and Development, 2004.
29. Peden M et al., ed. World report on road traffic injury prevention. Geneva, World Health Organization, 2004 (http://www.who.int/world-health-day/2004/infomaterials/world_report/en, accessed 17 September 2004).