overview of preparative hplc - ais-indiaais-india.com/uploadedapps/preparative hplc...
TRANSCRIPT

Overview of preparative HPLC
Analytical Technologies Limited����� ������������������� ��������������
���������������� ���������������� ������������������������������������������
�

�� ���� ��• � ��!������������������������������"� ��!������������������������������"• ������������� �������"����������������� �������"����• �������"������"������"�����������"������"������"����• �����������������������������������������������

1.Review of liquid phase chromatography
origin
develop
prospect

Separationresult
Mobile phase
Stationary phase
origin
Tewett 1903

Kuhn
Martin & Synge
Stanford Moore & William Howard Stein
Liquid-stationarychromatographic theory
Paper chromatography andplate theory
AA analyzer
Develop

Chromatography developschronology
1903’s propose chromatographic method1931’s liquid- stationary absorption chromatography1940’s paper chromatography1950’s thin-layer chromatography50-60’s fast develop period of GC70’s HPLC1975’s ion-exchange chromatography80’s rip period of HPLC80’s development of capillary electrophoresis2003’s UPLC
develop

chromatography
Liquid Chromatography Gas Chromatography
PC TLC CCC LPLCMPLC
HPLC
analyzeprepare
analyzeprepare
analyzeprepare prepare
analyzeprepare
develop

develop
HPLC
Analyzequalitativelyquantitativelyanalyze theconsist of sample
prepareextractseparatepurifythe valuablecompound of rowmaterial

analyze
HPLC
prepare
High /Ultra PerformanceLiquid Chromatography
(H/UPLC)
Dynamic Axial compression(DAC)
Simulated Moving Bed(SMB)
prospect

2.ATL preparative HPLC system
From analysis topreparation
Correlation technique ofpreparation
ATL instrumentsystem

Preparative high pressure chromatographyhas no essential difference with traditionally classical columnchromatography. It has higher efficiency and achievesautomatic operation. About the instrument, a high pressurepump is adopted to deliver mobile phase. At the same time, adetector is connected to the outlet of the column which candetect the fraction on-line constantly.
FromAToP

The preparative high pressurechromatography has several features asfollowing:1.shortter column length;2. larger column ID;3. higher flow rate.Sometimes it is also called Highperformance preparative liquidchromatography
FromAToP

The difference and relation of analysis and preparativechromatography
analysis preparative
Applied area qualitatively analyze: sensitivityquantitatively analyze: resolution,repeatability
Extract, separate, purify compounds frommixture of row materialObtain specific fraction with high purificationfrom the sample; pilot preparation and low-costpreparation
Particle size ≤5um ≥10um
Flow rate 0.001-9.999ml/min 100~80000ml/min
Sample size 0.01-2mg 1-500000mg
Capillary ID 1/16” 1/8”~1/4”
Injectionmethod
Inject valve Inject valve and inject pump
Mobile phase No recovery recovery
Separate way linear Non-linear
FromAToP

Typical analysis HPLC system
Mobilephase
pump
injector
column
Work station
detector
waste
FromAToP

Largertank
Larger flowrate pump≥50ml Sample loop ≥1ml
Injection pump≥50ml
≥10mm flange columnDAC
Biggervolume flow
cell
Solventrecovery
Preparative system
Mobilephase
pump
injector
column
Work station
detector
waste

CorrelationTechnique ofpreparation
Samplefeature
cost
Time
Purity ofproduct Output
The five elements for preparative process

0.1 10 1000
Cost of solvent
Cost of manpower
Cost ofequipments
10000
Lab scale Process scale
cost
Output/g
CorrelationTechnique ofpreparation
Cost of Packing material

LinearchromatographyAnalysis
preparation
CorrelationTechnique ofpreparation
Non-Linearchromatography
Concentration in mobile phase
Concentration instationaryphase
Concentration in mobile phase
Langmuirian type
Concentration instationaryphase
Concentration in mobile phaseAnti-Langmuirian type
Concentration instationaryphase

The peak shape of preparative chromatography
signal
signal
Retention timeLangmuirian type
Retention timeAnti-Langmuirian
type
signal
signal
Retention timeLangmuirian type
Retention timeAnti-Langmuirian
type
CorrelationTechnique ofpreparation

Asymmetric peak shape
The retention time of peak ismodified by increasingsample concentration
The peak height (or peak area)is not proportional tosample concentration
FeatureOf
Non-linearchromatography
CorrelationTechnique ofpreparation

The most important thing in preparativechromatography:
Sample overload
CorrelationTechnique ofpreparation

Concentrationoverload
VolumeoverloadPK
Langmuir Type: the capacity factordecreases; the peak shape changes from Gaussian curve to triangle
Increasing sample concentration and keeping theinject volume invariantly; the sample size depends onthe solubility of sample in mobile phase; the outputdepends on selectivity and the particle size of packingmaterial has little influence on it
Invariant peak height;the peak width increase and presentrectangle
The sample size dependson inject volume; theoutput depends on columnID; it needs small particlesize packing material
CorrelationTechnique ofpreparation

Analysis
Preparation
amplification
Optimizing theanalytical method
Overloading onanalytical column
Amplifying onpreparative column
CorrelationTechnique ofpreparation

Adjust sample size:mp/ma=lp/la * rp /ra
L: column length;m:sample size;
r:column ID p: preparative column;a:analytical column
Keypoint 1
2 2
CorrelationTechnique ofpreparation

Adjust flow rate:
Fp/Fa = Vp/Va = Lp/La * rp /ra
F :flow rate ;V:column volume;L: column length;r:column ID;
p: preparative column;a:analytical column
Keypoint 2
2 2
CorrelationTechnique ofpreparation

Adjust gradient:
tp/ta = Vp/Va * Fp/Fa
F :flow rate ;V:column volume;t:gradient elution time;
p: preparative column;a:analytical column
Keypoint 3
CorrelationTechnique ofpreparation

10ml 3000 Seriesanalytical HPLC
system
Analytical Technologies 3000 SeriesHPLC System

50ml binary 3000Series
Semi-preparativesystem
3000 Series Semi PREPsystem

100~1000ml 6000Series
Preparativesystem
6000 Series PREPsystem

6000 Series100~1000mlPreparative
system 50~200mlDAC
PREP with DAC system

3.Industry preparative system

Composition of 2800 DAC system
pump85L/min
Injectpump
Control unitMCU2800
2800DAC
detector
8 fractioncollector
450LSlurry tank
Industry preparativesystem

Columnbody
Sieveplate
Flange ofcolumnbottom
Industry preparativesystem

2800DACPiston head
80Lpump
Industry preparativesystem

Pneumaticcollector
valve
explosion-proof
equipment
Industry preparativesystem

AutomaticSlurrytank
Industry preparativesystem

������������� ������������������ �����
example
Sample :The row material contains 68% target compound. It iswhite solid powder and stability for hot and light (cantolerate 100℃).
Custom requirement:After the purification, the purity must reach greater than99%; the single impurity must reach less than 0.8%; the
recovery must reach 70%.
Step1:Meet the requirements of custom

Step2:The analysis of original sample
example You must have an analysismethod to detect the purity ofthe fraction and final product.
A case of application

example
Analytical condition:methanol:acetonitrile:water=81:12:7Wavelength :246nmFlow rate:1.0mL/minColumn :C18,5μm,4.6*250mm
resultA case of application
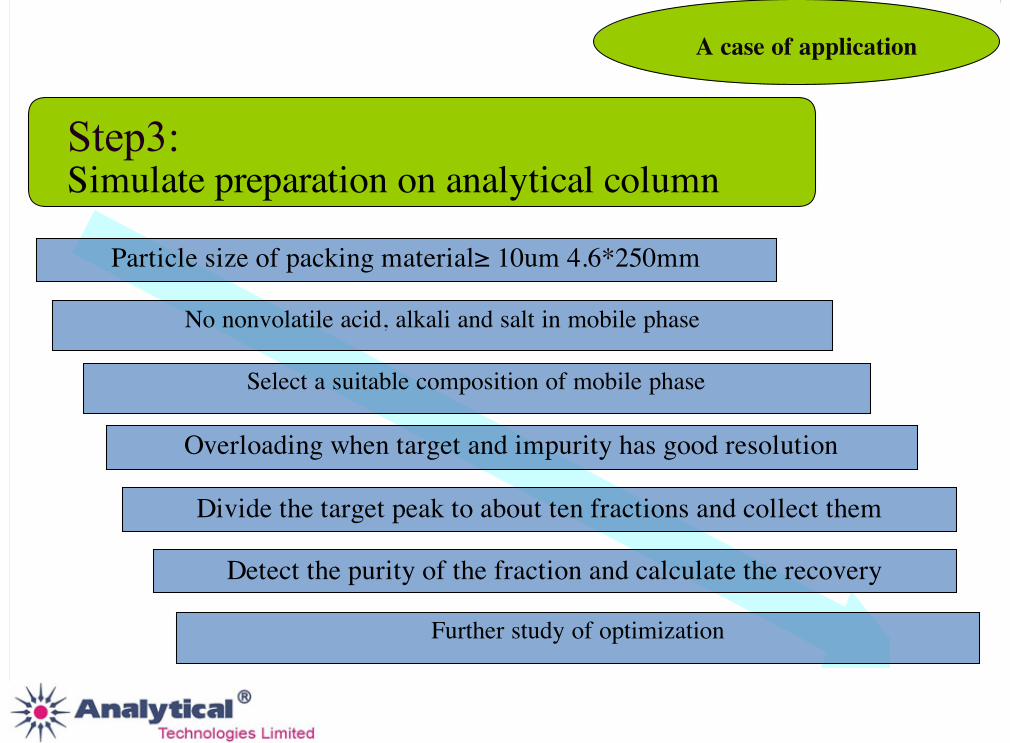
Step3:Simulate preparation on analytical column
Particle size of packing material≥ 10um 4.6*250mm
No nonvolatile acid, alkali and salt in mobile phase
Overloading when target and impurity has good resolution
Divide the target peak to about ten fractions and collect them
Detect the purity of the fraction and calculate the recovery
A case of application
Select a suitable composition of mobile phase
Further study of optimization

example Study of preparativemethod
Mobile phase Packing material
90%methanol、75%methanol、75%acetonitrile、70%acetonitrile、
60%acetonnitile。
Four kinds ofdifferent brand
packing material
60%acetonitile XX brandC8-10um-100A
select select
A case of application

2.645'3.177'
3.715'
3.968'
4.508'
5.589'
6.181'
7.728'
8.381'
9.348'
12.040'
14.171'
15.813'
16.641'
21.966'
35.288'
39.085'
52.157'
53.655'
76.363'
86.672'
100.659'
110.063'
119.893'
0
300
600
900
1200
1500
1800
2100
mV
10 20 30 40 50 60 70 80 90 100 110 min
exampleThe chromatogram of simulation on
analytical column
Result
A case of application

Step4:Confirm the maximum sample size
Enlarge the sample size continuously untilthe recovery decreases obviously.Theory sample size:3‰---8‰ of packingmaterial
A case of application

example
60% acetonitrile,sample size5‰,recovery 36.3%
60% acetonitrile,sample size3‰,recovery 78.9%
The optimization ofsample size is 3 ‰
A case of application

The final preparative method:Mobile phase:60% acetonitrile-waterSample size :3‰ of packing material weightPacking material:XX brand-C8-10um-100ASolvent of sample:mobile phase
A case of application

Step5:Amplification
Linear amplification of the simulative preparative method on analytical column topreparative column
Repeat this process several times, after the technology is mature, the targetpeak can be divided to only 4 to 6 fractions
Divide the target peak to about ten fractions and collect them
Detect the purity of the fractions and calculate the recovery
The formula is in front; the column size is decided by sample size
A case of application

12.298'
14.003'
15.378'
16.932'
-40
0
40
80
120
160
200
240
280
320
360
400mV
3 6 9 12 15 18 21 24 27 min
───────────────────────────────────────NO. Retention time percentage peak area resolution theory plate capacity factor tailing───────────────────────────────────────1 12.298 0.5167 42956 2.32 4218 -0.000 1.36 2 14.003 99.3 8255744 1.71 6614 0.139 1.14 3 15.378 0.1307 10865 1.74 4727 0.250 0.58 4 16.932 0.04702 3909 1.70 6200 0.377 0.95 ───────────────────────────────────────total 100 8313474
Chromatogram of the purification result
A case of application

Optimization ofpreparativemethod isendless!

Thank youFor your attention!