over-expression of bael quinolone synthase in tobacco ... · over-expression of bael quinolone...
TRANSCRIPT

FEBS Letters 589 (2015) 332–341
journal homepage: www.FEBSLetters .org
Over-expression of bael quinolone synthase in tobacco improves plantvigor under favorable conditions, drought, or salt stress
http://dx.doi.org/10.1016/j.febslet.2014.12.0160014-5793/� 2015 Federation of European Biochemical Societies. Published by Elsevier B.V. All rights reserved.
⇑ Corresponding author at: Plant Molecular Biology Division, Rajiv Gandhi Centrefor Biotechnology, Thycaud (P.O.), Thiruvananthapuram 695 014, Kerala, India. Fax:+91 471 234 8096.
E-mail addresses: [email protected] (M.S. Resmi), [email protected](P.J. Vivek), [email protected] (E.V. Soniya).
Mohankumar Saraladevi Resmi, Padmanabhan Jayanthi Vivek, Eppurathu Vasudevan Soniya ⇑Plant Molecular Biology Division, Rajiv Gandhi Centre for Biotechnology, Thycaud (P.O.), Thiruvananthapuram 695 014, Kerala, India
a r t i c l e i n f o
Article history:Received 20 October 2014Revised 4 December 2014Accepted 4 December 2014Available online 30 December 2014
Edited by Ulf-Ingo Flügge
Keywords:BaelDrought stressOver-expressionQuinolone synthaseSalt stressTobacco
a b s t r a c t
Type III polyketide synthases (PKSs) catalyze the biosynthesis of various medicinally important sec-ondary metabolites in plants, but their role in growth and stress response is unclear. Here, we over-expressed quinolone synthase (QNS) from bael in tobacco. QNS-overexpressing plants showed anoverall increase in growth, photosynthetic efficiency and chlorophyll content compared to wild typeplants. Second-generation (T2) transgenic plants grew to maturity, flowered early and set viableseeds under favorable conditions without yield penalty. An increased accumulation of flavonoids,phenols and alkaloids was associated with higher tolerance to drought and salinity stress in trans-genic plants. Thus, bael QNS seems to function as a positive regulator of plant growth and stressresponse, and could be potentially used for engineering plants tolerant to abiotic stress.� 2015 Federation of European Biochemical Societies. Published by Elsevier B.V. All rights reserved.
1. Introduction
Type III PKS superfamily of enzymes catalyzes the biosynthesisof diverse type of secondary metabolites in plants such aschalcones, resveratrols, benzophenones, quinolones and diarylhep-tanoids like phenylphenalenones, curcuminoids etc. [1,2]. They arehomodimer proteins where the active site in each subunit itera-tively catalyze the priming, extension and cyclization reactions togenerate an array of plant phenylpropanoids (of secondary biosyn-thetic origin) including flavonoids (Fig. 1). An interesting feature ofplant type III PKSs is that it shows an extremely broad substratespecificities. They can readily accepts a wide variety of unnaturalsubstrates, including aromatic and aliphatic thioesters andproduces novel, unexpected products with profound medicinalimportance [3].
The secondary metabolites synthesized by Type III PKS in plantsprovide protection against various environmental stresses. Theyplayed a key role in the early evolution of land plants by actingas UV-sunscreens [4]. Chalcone synthases (CHS), the most well-known representative of this family, are influenced by various
stresses and environmental factors such as UV, wounding or path-ogen attack, jasmonic acid, methyl jasmonate, low temperatureand high intensity light [5]. A chalcone synthase from Sorghumbicolor, SbCHS8 expression was reported to be induced in mesoco-tyls with the inoculation of Cochliobolus heterotrophus and Colleto-trichum sublineolum [6]. Recent studies reported an increasedaccumulation of quercetin (a phenolic compound) derivatives inPhyscomitrella patens following ultraviolet-B (UV-B) radiation [7].Moreover, an increased expression of stilbene synthase (STS),another well characterized type III PKS catalyzing the biosynthesisof stilbenes (resveratrol) were reported in response to various bio-tic and abiotic stresses [8]. Xu et al. [9] reported the isolation of astilbene synthase promoter from Vitis pseudoreticulata inducedunder pathogen, cold and salicyclic acid treatment.
Although the number of identified diverse type III PKS familyof enzymes is growing exponentially, the role of only a few likeCHS and STS were extensively studied in transgenic plants. CHSgene was over-expressed for increasing the production of lignincontent in Linumus itatissimum [10], phenolic acids and anthocy-anin in potato tubers [11] and flavonolignans in hairy rootcultures of Silybum marianum [12]. Moreover, over-expression ofCHS gene in tobacco plants resulted in white flowers [13]. Theover-expression of STS gene in various plants like tobacco,tomato, and alfalfa resulted in the accumulation of either resvera-trol or its glucoside which confers improved disease resistance tothe plants [14–17].

M.S. Resmi et al. / FEBS Letters 589 (2015) 332–341 333
Quinolone synthase (QNS) is a type III PKS identified from Aeglemarmelos Corr. which catalyze the biosynthesis of quinolones [2].Quinolones are naturally occurring anthranilic acid-derivedalkaloids found in a limited number of plant species of the familyRutaceae [18]. QNS is a unique type III polyketide synthase (PKS)that exhibits unusually broad substrate specificity to produce var-ious aromatic polyketides. QNS catalyzes the condensation of N-methylanthraniloyl-CoA with one malonyl-CoA to produce 4-hydroxy-2(1H)-quinolone; but with p-coumaroyl-CoA and onemolecule of malonyl-CoA to produce p-hydroxybenzalacetone [2](Fig. 1). The present study reports the over-expression of QNS inNicotiana tabacum var. petita hybrid and evaluation of its effecton the germination and physiological response of transgenic plantsunder favorable, salinity and drought stressed conditions. QNSover-expressing plants showed an overall increase in growth andother physiological responses under non-stressed conditions.Moreover, the ectopic expression of QNS conferred enhanced toler-ance under salinity and drought stressed conditions.
2. Results
2.1. Over-expression of QNS improves plant vigor under favorablegrowth conditions
To study the effect of over-expression of QNS in a heterologoussystem, where its preferable substrates are likely un-available, wehave transformed tobacco plants with the binary vector pMDC85-QNS-GFP, in which the A. marmelos quinolone synthase gene isunder the control of 2X35S promoter of Cauliflower mosaic virus.
Fig. 1. Metabolic flow from shikimate to flavonoid and quinolone alkaloid viaphenylpropanoid pathway. Key enzymes are indicated in arrow (upper case). PAL,phenylalanine-ammonia lyase; STS, stilbene synthase; CHS, chalcone synthase;QNS, quinolone synthase; CoA, coenzyme A. Hydroxybenzalacetone formation bybael QNS is shown in dotted square box.
The expressed protein will also contain a GFP epitope tag at its Cterminus. Ten hygromycin-resistant independently transformedtransgenic plants were selected (T0 generation), grew them tomaturity and rose up to T2 generation. Three different lines (TG1,TG4 and TG5) of T2 generation were selected and used for furtheranalysis. PCR of genomic DNA were used to identify the presenceof transgene in the selected T2 lines (Fig. 2A). Quantitative PCRanalysis indicated the presence of QNS transcripts in all transgeniclines but not in the WT tobacco (Fig. 2B). In order to examine thepresence of QNS protein in the transgenic lines, Western blot anal-ysis with anti-GFP epitope antibodies was performed. A cross-reacting band matching to the size expected of QNS-GFP in all ofthe three transgenic lines was observed which was absent in theWT plant (Fig. 2C).
To evaluate whether over-expression of bael QNS have anyeffect on the overall plant growth and development, experimentswere conducted to compare various growth parameters like shootand root biomass, shoot length, root length, leaf area etc. in trans-genic lines and WT plants grown in greenhouse. The transgenicplants exhibited a significantly altered growth rate and were tallerwith their average stem diameters enhanced by 11–13% than thoseof WT plants. The shoot biomass in transgenic plants was signifi-cantly higher with an overall increase of 2.5 fold in fresh weightand 1.7 fold in dry weight (Table 1). The physiological observationssummarized in Table 1 suggested that under favorable growth con-ditions, the plants with QNS over-expression developed profuseroot and shoot systems to support an increase in growth andbiomass.
Surprisingly transgenic lines bolted earlier than WT plants(Fig. 3). The number of days required for flowering and seed weightor pod weight of the transgenic and WT were also recorded. Thetransgenic plants flowered much earlier with almost 50% reductionin flowering time as compared to WT plants and were also having aconsiderable increase in seed or pod weight (Table 2).
2.2. Physiological assessment of transgenic plants under favorableconditions
When seeds of T2 generation transgenic plants (TG1, TG4 andTG5 lines) were placed in MS medium, they showed 100% germina-tion rate with an early response to germination as compared to WTplants (Fig. 4A and B). The seedlings also showed altered morphol-ogy with an overall increase in leaf size and root length (Fig. 4C).An overall increase in chlorophyll a, chlorophyll b and total chloro-phyll contents were also observed in transgenic plants (Fig. 4D). Totest whether the overall increased chlorophyll content in trans-genic lines are in line with increased photosynthetic efficiency,we examined several physiological parameters that control plantvigor. The various parameters studied included the transpirationrate, photosynthesis rate, chlorophyll fluorescence parameter Fv/Fm (for testing the vitality of photosystem II); light response curveor net CO2 uptake rate, intercellular CO2 concentration (Ci) and leafconductance. The QNS over-expressing plants showed significantlyhigher photosynthesis rates, transpiration rates, leaf conductance,net CO2 uptake rate, Ci and Fv/Fm than non-transformed controlplant (Fig. 5A–F) when grown under favorable growth conditions.The results suggest a positive relation between QNS over-expres-sion and increased growth vigor.
In order to study the effect of QNS over-expression on the over-all secondary metabolite production in tobacco, a phytochemicalanalysis was carried out. An overall increase of 1.75–2 fold in totalflavonoid, 2.3–6.4% in total phenol and 64–85% in total alkaloidcontents were noticed in transgenic plants as compared to WTplants (Table 3) under normal condition. The major in vitro productof QNS, 4-hydroxy-1-methyl (2H) quinolone (% w/w) was notdetected in any of the transgenic sample tested. These findings
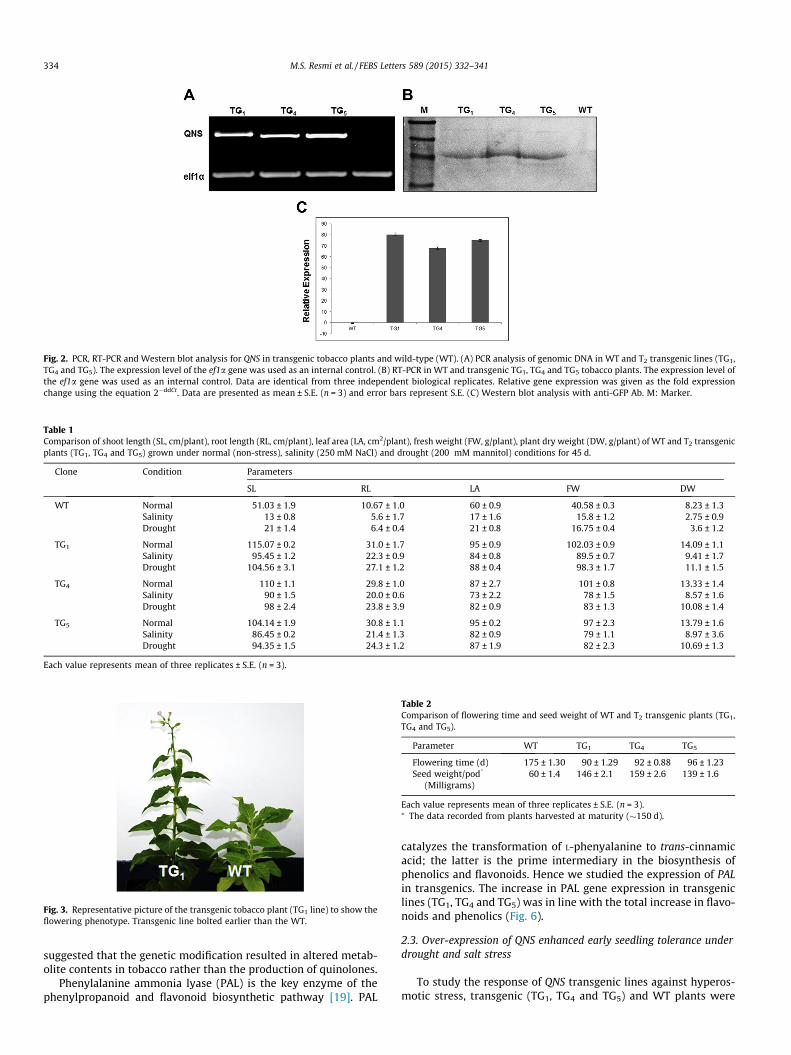
Fig. 2. PCR, RT-PCR and Western blot analysis for QNS in transgenic tobacco plants and wild-type (WT). (A) PCR analysis of genomic DNA in WT and T2 transgenic lines (TG1,TG4 and TG5). The expression level of the ef1a gene was used as an internal control. (B) RT-PCR in WT and transgenic TG1, TG4 and TG5 tobacco plants. The expression level ofthe ef1a gene was used as an internal control. Data are identical from three independent biological replicates. Relative gene expression was given as the fold expressionchange using the equation 2�ddCt. Data are presented as mean ± S.E. (n = 3) and error bars represent S.E. (C) Western blot analysis with anti-GFP Ab. M: Marker.
Table 1Comparison of shoot length (SL, cm/plant), root length (RL, cm/plant), leaf area (LA, cm2/plant), fresh weight (FW, g/plant), plant dry weight (DW, g/plant) of WT and T2 transgenicplants (TG1, TG4 and TG5) grown under normal (non-stress), salinity (250 mM NaCl) and drought (200 mM mannitol) conditions for 45 d.
Clone Condition Parameters
SL RL LA FW DW
WT Normal 51.03 ± 1.9 10.67 ± 1.0 60 ± 0.9 40.58 ± 0.3 8.23 ± 1.3Salinity 13 ± 0.8 5.6 ± 1.7 17 ± 1.6 15.8 ± 1.2 2.75 ± 0.9Drought 21 ± 1.4 6.4 ± 0.4 21 ± 0.8 16.75 ± 0.4 3.6 ± 1.2
TG1 Normal 115.07 ± 0.2 31.0 ± 1.7 95 ± 0.9 102.03 ± 0.9 14.09 ± 1.1Salinity 95.45 ± 1.2 22.3 ± 0.9 84 ± 0.8 89.5 ± 0.7 9.41 ± 1.7Drought 104.56 ± 3.1 27.1 ± 1.2 88 ± 0.4 98.3 ± 1.7 11.1 ± 1.5
TG4 Normal 110 ± 1.1 29.8 ± 1.0 87 ± 2.7 101 ± 0.8 13.33 ± 1.4Salinity 90 ± 1.5 20.0 ± 0.6 73 ± 2.2 78 ± 1.5 8.57 ± 1.6Drought 98 ± 2.4 23.8 ± 3.9 82 ± 0.9 83 ± 1.3 10.08 ± 1.4
TG5 Normal 104.14 ± 1.9 30.8 ± 1.1 95 ± 0.2 97 ± 2.3 13.79 ± 1.6Salinity 86.45 ± 0.2 21.4 ± 1.3 82 ± 0.9 79 ± 1.1 8.97 ± 3.6Drought 94.35 ± 1.5 24.3 ± 1.2 87 ± 1.9 82 ± 2.3 10.69 ± 1.3
Each value represents mean of three replicates ± S.E. (n = 3).
Fig. 3. Representative picture of the transgenic tobacco plant (TG1 line) to show theflowering phenotype. Transgenic line bolted earlier than the WT.
Table 2Comparison of flowering time and seed weight of WT and T2 transgenic plants (TG1,TG4 and TG5).
Parameter WT TG1 TG4 TG5
Flowering time (d) 175 ± 1.30 90 ± 1.29 92 ± 0.88 96 ± 1.23Seed weight/pod*
(Milligrams)60 ± 1.4 146 ± 2.1 159 ± 2.6 139 ± 1.6
Each value represents mean of three replicates ± S.E. (n = 3).⁄ The data recorded from plants harvested at maturity (�150 d).
334 M.S. Resmi et al. / FEBS Letters 589 (2015) 332–341
suggested that the genetic modification resulted in altered metab-olite contents in tobacco rather than the production of quinolones.
Phenylalanine ammonia lyase (PAL) is the key enzyme of thephenylpropanoid and flavonoid biosynthetic pathway [19]. PAL
catalyzes the transformation of L-phenyalanine to trans-cinnamicacid; the latter is the prime intermediary in the biosynthesis ofphenolics and flavonoids. Hence we studied the expression of PALin transgenics. The increase in PAL gene expression in transgeniclines (TG1, TG4 and TG5) was in line with the total increase in flavo-noids and phenolics (Fig. 6).
2.3. Over-expression of QNS enhanced early seedling tolerance underdrought and salt stress
To study the response of QNS transgenic lines against hyperos-motic stress, transgenic (TG1, TG4 and TG5) and WT plants were
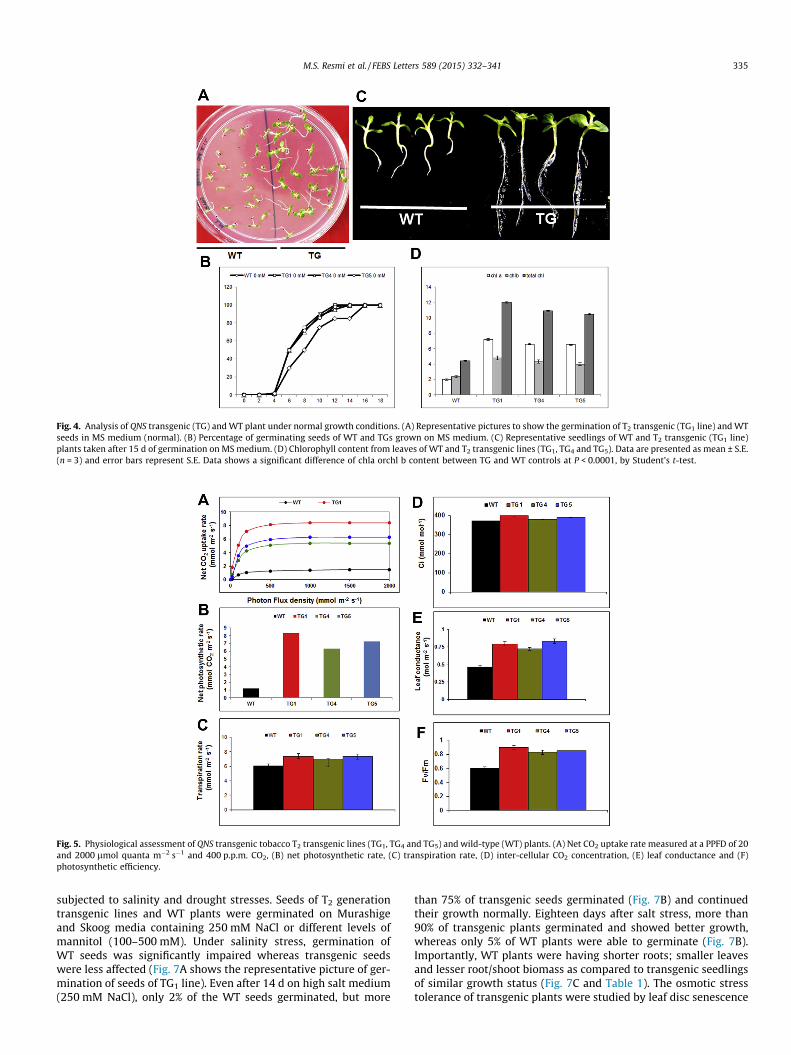
Fig. 4. Analysis of QNS transgenic (TG) and WT plant under normal growth conditions. (A) Representative pictures to show the germination of T2 transgenic (TG1 line) and WTseeds in MS medium (normal). (B) Percentage of germinating seeds of WT and TGs grown on MS medium. (C) Representative seedlings of WT and T2 transgenic (TG1 line)plants taken after 15 d of germination on MS medium. (D) Chlorophyll content from leaves of WT and T2 transgenic lines (TG1, TG4 and TG5). Data are presented as mean ± S.E.(n = 3) and error bars represent S.E. Data shows a significant difference of chla orchl b content between TG and WT controls at P < 0.0001, by Student’s t-test.
Fig. 5. Physiological assessment of QNS transgenic tobacco T2 transgenic lines (TG1, TG4 and TG5) and wild-type (WT) plants. (A) Net CO2 uptake rate measured at a PPFD of 20and 2000 lmol quanta m�2 s�1 and 400 p.p.m. CO2, (B) net photosynthetic rate, (C) transpiration rate, (D) inter-cellular CO2 concentration, (E) leaf conductance and (F)photosynthetic efficiency.
M.S. Resmi et al. / FEBS Letters 589 (2015) 332–341 335
subjected to salinity and drought stresses. Seeds of T2 generationtransgenic lines and WT plants were germinated on Murashigeand Skoog media containing 250 mM NaCl or different levels ofmannitol (100–500 mM). Under salinity stress, germination ofWT seeds was significantly impaired whereas transgenic seedswere less affected (Fig. 7A shows the representative picture of ger-mination of seeds of TG1 line). Even after 14 d on high salt medium(250 mM NaCl), only 2% of the WT seeds germinated, but more
than 75% of transgenic seeds germinated (Fig. 7B) and continuedtheir growth normally. Eighteen days after salt stress, more than90% of transgenic plants germinated and showed better growth,whereas only 5% of WT plants were able to germinate (Fig. 7B).Importantly, WT plants were having shorter roots; smaller leavesand lesser root/shoot biomass as compared to transgenic seedlingsof similar growth status (Fig. 7C and Table 1). The osmotic stresstolerance of transgenic plants were studied by leaf disc senescence

Table 3Biochemical contents in WT and T2 transgenic lines (TG1, TG4 and TG5).
Parameter Flavonoid (lg g�1) Phenol (lg g�1)tannic acid
Alkaloid(lg g�1)
Quercetin Kaempferol
WT 2000 ± 1.26 N/A 220,000 ± 2.65 14,000 ± 0.66TG1 4000 ± 2.04 N/A 230,000 ± 1.12 25,000 ± 1.34TG4 3500 ± 1.2 N/A 225,000 ± 0.04 23,000 ± 3.04TG5 4200 ± 2.31 N/A 234,000 ± 1.90 26,000 ± 2.02
All data correspond to mean values ± S.D. of three biological replicates. N/A, notavailable.
Fig. 6. Expression profile of PAL gene in transgenic tobacco T2 lines, (TG1, TG4 andTG5) and WT. All mRNA transcripts expressed in transgenic plants were quantifiedrelative to those expressed in WT tobacco. The expression level of the ef1a gene wasused as an internal control. Data are identical from three independent biologicalreplicates. Relative gene expression was given as the fold expression change usingthe equation 2�ddCt. Data are presented as mean ± S.E. (n = 3) and error barsrepresent S.E.
336 M.S. Resmi et al. / FEBS Letters 589 (2015) 332–341
assay. For that leaf disks from T2 transgenic lines and WT tobaccoplants were kept separately on 250 mM NaCl (salinity stress) orH2O for 96 h. Stress-induced damage were measured by the degree
Fig. 7. Germination rate and early seedling development of T2 transgenic (TG1 line) agermination of T2 transgenic and WT seeds in 250 mM NaCl. (B) Percentage of germinatimedium supplemented with 250 mM NaCl. (C) Representative seedlings of WT and T2 t250 mM NaCl. (D) Representative pictures to show phenotypic differences in leaf diskscontent from leaf disks of WT and T2 transgenic lines (TG1, TG4 and TG5) after incubation(n = 3) and error bars represent S.E. Data shows a significant difference of chla orchl b conTG1 alone is provided here for leaf disc and plate germination assay of the transgenic p
of bleaching in the leaf tissue after 96 h which were lower in QNSover-expressing lines as compared to those from the WT plants(Fig. 7D). The total chlorophyll content of NaCl-stress induced leafdisks from both transgenic and WT plants (Fig. 7E) were also mea-sured which provides further evidence about the role of QNS inenhancing tolerance to salinity stress.
Under water-deficit stress, WT seed growth was severelyimpaired even at lower concentration; with smaller leaves and les-ser root/shoot biomass, whereas transgenic lines were less affected(Fig. 8A and B and Table 1). At higher concentrations (300 and400 mM mannitol), WT germination was severely affected or evenabsent, whereas transgenic germination was more or less unaf-fected (Fig. 8A). However, at 500 mM mannitol, transgenic seedgermination was only 10% (Fig. 8A and C). Hence an early seedlingtolerance was shown by transgenics to mannitol-induced droughtstress. To study the drought tolerance of mature plants, leaf disksfrom transgenic (T2 generation) and WT tobacco plants were kepton solution containing 200 mM mannitol (drought stress) or H2O(control) for 96 h (200 mM mannitol was selected since WT seedswere able to germinate and grow normally only up to concentra-tions of 200 mM). Stress-induced damage which was measuredby the degree of bleaching and loss of chlorophyll was lower inQNS over-expressing lines as compared to WT plants (Fig. 8D andE). To summarize, the QNS over-expressing lines showed anenhanced tolerance to salinity and drought stress.
As water retention is a major stress adaptation against osmoticstress, we have examined the relative water content (RWC) oftransgenic and WT plants. During salinity stress, the RWC rangedfrom 70% to 89% in the transgenic plants, whereas it was only48% in the WT plants (Fig. 9A). After 4 weeks of drought stresstreatment, the RWC in the transgenic plants ranged from 70% to90% whereas it was only 55% in the WT plants (Fig. 9B). The phys-iological parameters described in Table 1 gives a clear pictureabout the stress tolerance shown by T2 transgenic plants comparedto wild type plants when grown under salt/drought stress for 45 d.
nd wild type (WT) under salinity stress. (A) Representative picture to show theng seeds of wild type (WT) and T2 transgenic lines (TG1, TG4 and TG5) grown on MSransgenic line taken after 15 d of germination on MS medium supplemented withof WT and T2 transgenic line after incubation in 250 mM solutions. (E) Chlorophyllin MS medium supplemented with 250 mM NaCl. Data are presented as mean ± S.E.tent between TG and WT controls at P < 0.0001, by Student’s t-test. Data for the line
lants. Experiments were performed on all three different lines with similar results.

Fig. 8. Germination rate and early seedling development of T2 transgenic (TG1 line) and wild type (WT) under osmotic stress. (A) Representative picture to show thegermination of WT and T2 transgenic seeds on MS medium supplemented with 200, 300, 400 and 500 mM mannitol. (B) Representative seedlings of WT and T2 line taken after15 d of germination on MS medium supplemented with 200 mM mannitol. (C) Percentage of germinating seeds of wild type (WT) and T2 transgenic lines (TG1, TG4 and TG5)grown on MS medium supplemented with different concentrations of mannitol (100–500 mM). (D) Representative pictures to show phenotypic differences in leaf disks of WTand T2 transgenic plants after incubation with 200 mM mannitol solution. (E) Chlorophyll content from leaf disks of WT and T2 transgenic lines (TG1, TG4 and TG5) afterincubation in MS medium supplemented with 200 mM mannitol. Data are presented as mean ± S.E. (n = 3) and error bars represent S.E. Data shows a significant difference ofchla orchl b content between TG and WT controls at P < 0.0001, by Student’s t-test. Data for the line TG1 alone is provided here for leaf disc and plate germination assay of thetransgenic plants. Experiments were performed on all three different lines with similar results.
Fig. 9. Analysis of relative water content (RWC) of QNS transgenic (T2) and WT plants under drought and salinity stress. QNS-expressing transgenic (TG) tobacco plantsexhibited higher relative water content (RWC) under salt and water deficiency conditions. T2 Transgenic lines TG1, TG4 and TG5 and wild-type (WT) plants grown undernormal conditions in growth room, subjected to water withholding or salt stress for 4 weeks and then examined for RWC. Plant leaf tissues were carefully clipped at theindicated dates and used for measuring RWC. (A) RWC for salt stress and (B) RWC for drought stress. Data are presented as mean ± S.E. (n = 3) and error bars represent S.E.
M.S. Resmi et al. / FEBS Letters 589 (2015) 332–341 337
3. Discussion
Type III PKSs forms a group of fascinating biosynthetic enzymesinvolved in the production of an array of diverse polyketides thathave applications in various agricultural crop improvement pro-grammes and in the pharmaceutical industry. They are alsoinvolved in many plant physiological processes including improve-ment of plant microbial resistance, quality of crops, or sometimesassociated with specific traits such as color or sterility as arereported by transgene or antisense expression studies [1]. Despitethe extensive studies on the biological functions of many type IIIPKSs, little is known about their role in plant’s growth, develop-ment and stress responses. The findings in this study have shownthat the over-expression of QNS, a Type III PKS enzyme involvedin the biosynthesis of quinolone alkaloids [2], enhances growthand physiological characteristics including photosynthetic param-
eters in tobacco. Moreover, QNS over-expressing tobacco plantshave improved adaptation against drought and salinity stress.
3.1. QNS over-expression has positive effects in tobacco
To study the role of QNS in a heterologous plant system, wehave over-expressed the bael QNS in tobacco as a GFP fusion pro-tein. QNS over-expressing plants have better growth pattern andout-performed WT plants in all the parameters studied. Theenhanced growth parameters, flowering and viable seed settingof T2 transgenic lines is an indicator of the stability and functionalnature of the introduced gene. Significant improvement in variousphotosynthetic parameters like net CO2 uptake rate, photosyn-thetic rate, Ci, leaf conductance, chlorophyll fluorescence parame-ter Fv/Fm and transpiration rate were observed in transgenicplants. Photosynthetic parameters from intact leaves, especially

338 M.S. Resmi et al. / FEBS Letters 589 (2015) 332–341
fluorescence parameters, is a rapid, non-invasive screening test toevaluate the photosynthetic capacity and the vitality of plants [20].The better adaptability and high net photosynthetic rate in turnaffect the carbon allocation and growth rate of the QNS over-expressing transgenic plants.
The QNS over-expressing plants have increased flavonoids, phe-nols and alkaloids, suggesting a possible involvement of QNS inincreasing secondary metabolite content. The bael QNS is reportedto accept a variety of substrates and generate multiple productsin vitro (Resmi et al. [2]). In addition to its natural substrate N-methylanthraniloyl-CoA, QNS also accepts p-coumaroyl-CoA, thestarter CoA for general phenylpropanoid pathway, and producesbenzalacetone. In tobacco, other than the general phenylpropa-noids, there is a report regarding the presence of benzalacetones[21]. Since p-coumaroyl-CoA and malonyl-CoA are common sub-strates for phenylpropanoid and benzalacetone formation (Fig. 1)its demand will be high in tobacco. The situation in transgenictobacco might be that heterologously expressed QNS is unable torecruit its specific substrate, N-methylanthraniloyl-CoA (since itmight be absent) and use alternative substrates that may be avail-able for synthesis. Even though bael QNS has a lower catalytic effi-ciency for benzalacetone formation (as reflected by kcat/Km value),its affinity for p-coumaroyl-CoA was comparable with N-methy-lanthraniloyl-CoA (as reflected by Km value) [2]. Hence the baelQNS may compete with CHSs for p-coumaroyl-CoA substrate. Inorder to meet the continuous demand of CoA substrates in trans-genic plants the activity of upstream genes appeared to beenhanced. This observation was well correlated with the overallup-regulation of PAL, the key gene involved in p-coumaroyl-CoAproduction (Fig. 6).
Altogether, in transgenic plants, there will be an increased accu-mulation of general phenylpropanoid pathway metabolites. This isin agreement with the recent report of Vitis riparia STS over-expres-sion in strawberry, which caused an increased accumulation ofgeneral phenylpropanoid pathway metabolites with the completeabsence of anticipated resveratrol or its derivatives [22]. Also thetransgene expression of two resveratrol synthases in bread wheatfailed to produce resveratrol even though its preferred substrateis available in plenty; in turn produce two novel compounds andshowed increase tolerance toward biotic stress [23]. Similarly, aSorghum bicolour STS, SbSTS1 which is reported to be involved inhost and non-host defense response in sorghum accumulates stil-bene derived compounds in transgenic Arabidopsis, whereas itfailed to produce resveratrol [6].
In addition to the changes in metabolic contents, it was foundthat over-expression of QNS gene in tobacco caused early flower-ing, and thus provided an indicator for further study on the roleof Type III PKS in regulating the flowering time. The observedchange in metabolite content, particularly increase in total flavo-noid content is likely to be the cause of changes in flowering time.The importance of flavonoids in flowering plants are mainly due toits role in providing the floral pigment anthocyanin, as UV protec-tants and as insect repellents [24]. The role of Type III PKSs in floraldevelopment was also reported earlier. Alteration in floral mor-phology were reported in transgenic tobacco plant over-expressinga chalcone synthase gene from Phalaenopsis orchid [25]. The over-expressed plant showed abnormality in pollen tube growth andflower limb. More research in this field should provide a betterunderstanding of the molecular mechanism behind it which mighthelp in the engineering of maturity in agricultural crop plants.
3.2. Stress-induced physiological changes in transgenic QNS plants
Even though there have been extensive research done in eluci-dating the functional role of PKSs in vitro, very few reports areavailable about their physiological role(s) in planta, especially in
relation to abiotic stress adaptation. With the overall increase inphenols and flavonoids in the QNS transgenic, it will be worthwhileto verify whether over-expressing plants have enhanced stressadaptation or not. Transgenic plants showed an increased toler-ance to salinity and drought stress as revealed by leaf disk senes-cence assay, germination percentage, and estimation ofchlorophyll content. The role of type III PKS like CHS and STS instress tolerance has been well reported in plants. STS and CHSexpression are often induced by a variety of stress treatmentincluding biotic and abiotic stresses like elicitor treatment, patho-gen treatment, wounding, jasmonate treatment, UV irradiation,and post harvest wilting procedures [8,26–28]. The potential roleof QNS in the regulation of plant water status was unclear. Butthe total increase in phenols and flavonoids might be the reasonfor the enhanced resistance shown by transgenics. Environmentalstresses, both biotic and abiotic, can lead to increased productionof free radicals and other oxidative species in plants [29,30]. Flavo-noids are considered to be important as anti-oxidants especially instressed plants by acting as reactive oxygen species (ROS) quench-ers. The antioxidant property of flavonoids may either by prevent-ing the generation of ROS or by inhibiting already formed ROS byacting as chelating agents for transition metals like iron and copper[31]. Flavonoids also acts as natural auxin transport regulators inplants [32,33] thereby increasing the total root growth and thusenabling increase in water absorption during stress conditions.
In conclusion, our finding revealed that, over-expression of baelQNS in a non-rutacean member like tobacco resulted in an overallincrease in metabolite flux toward normal phenylpropanoid path-way thereby increasing total phenolics and flavonoids. This mayindirectly confer enhanced stress tolerance on transgenic plants.Although the exact mechanism of action of QNS in conferring stresstolerance remains unclear, the results provide direct evidence thatthe altered expression of QNS can significantly improve plantgrowth, can modify reproductive phenotype and can increase planttolerance to various abiotic stresses.
4. Materials and methods
4.1. Plant material and in vitro culture conditions
Surface sterilized seeds of axenic plants of tobacco (N. tabacumvar. petita hybrida) were germinated under aseptic conditions onsolid MS medium (pH 5.8). The incubation condition maintainedfor germination was 25 �C with a 12 h photoperiod. The plantletswere sub-cultured after every fourth week to maintain continuoussource of explants for transformation. Leaf discs of approximately8 mm � 8 mm size dimension from 20 d old seedlings were usedfor plant transformation.
4.2. Generation of QNS-GFP fusion constructs and planttransformation
The binary vector pMDC85 [34] was used to generate the QNSexpression construct for tobacco transformation. The 1195 nucleo-tide open reading frame (ORF) of the QNS was amplified bypolymerase chain reaction (PCR) using the forward primer 50-ATGGTAACCATGGAGGAGATTAGA-30 and reverse primer, 50-TCAAGCTTCGATGGGGACACTGCG-30. The resulting PCR fragmentwas TA cloned into pCR�8/GW/TOPO entry vector (Invitrogen,USA), allowing the addition of attL1 and attL2 sites on the leftand right of the insert. The construct were subsequently clonedinto the binary Gateway destination vector pMDC85 having com-patible attR1 and attR2 sites using Gateway LR clonase enzymemix technology (Invitrogen, USA). The destination vector, pMDC85allows the expression of the cDNA under the control of the dual35SCaMV promoter and the C-terminus of QNS was fused to the

M.S. Resmi et al. / FEBS Letters 589 (2015) 332–341 339
N-terminus of GFP. The resulting binary vector, pMDC85-QNS-GFPor an empty vector alone were introduced into Agrobacterium tum-efaciens strain EHA105 using freeze thaw method [35].
The Agrobacterium harbouring pMDC85-QNS-GFP oran emptyvector were used for leaf disc transformation of transform N. taba-cum var. Petita hybrid by the standard transformation protocol[36]. The transformants grown on hygromycin (25 mg/L) mediumwere selected for further studies. The seeds (T0 seeds) were col-lected from mature plants and germinated on hygromycin contain-ing medium for raising T1 seedlings. One month old transgenictobacco plants grown on hygromycin resistant medium weretransferred to greenhouse in pots containing vermiculate andfinally to earthern pots filled with soil, compost, and sand (1:1:1).
Three T2 transgenic plants (TG1, TG4 and TG5) were selected andused for the transgene expression analysis and further experi-ments. Untransformed wild-type (WT) and empty vector-trans-formed plants did not show any differences in all experiments.Therefore, only data from WT plants are presented in figures.
4.3. PCR, RT- PCR and Western blotting
A total of 100 mg of fresh leaves from wild-type (WT) and T2
homozygous transgenic tobacco plants (TG1, TG4 and TG5) wereused for DNA extraction using GenElute Plant Genomic DNA Mini-prep kit (Sigma, USA) and the target gene QNS was amplified usinggene specific primers. To assay the expression of QNS in T2 lines,quantitative real-time PCR analysis was carried out using cDNAsprepared from the above mentioned samples. The endogenous con-trol used to normalize variance in the quantity of RNA and theamount of cDNA was elongation factor 1 a (ef1a) gene. Real-timePCR was performed on an optical 96-well plate with an ABI PRISM7900HT Fast real-time PCR system (Applied Biosystems) using theprimer pair 50-TGCACATCTGCAGGCGTCGA-30 (forward primer)and 50-ACGGTGGCGCCAGCATAACA-30 (reverse primer) for QNSand 50-CCGTTCTCATCATTGACTCCACC-30 (forward primer) and 50-ACCAAGGGTGAAAGCAAGCAAGG-30 (reverse primer) for ef1a. Eachreaction contained 2.5 lL 2X SYBR Green Master mix reagent(Applied Biosystems, USA), 1.0 lL cDNA sample and 0.2 mM of eachgene-specific primers in final volume of 25 lL using the thermalcycles as follows: 50 �C for 2 min, 95 �C for 10 min; followed by40 cycles of 95 �C for 15 s and 60 �C for 1 min. For PAL gene expres-sion RT-PCR was carried out with ef1a as endogenous control asconditions mentioned above. For the expression of PAL gene, primerpair 50- CGAGGCTGCTGCCATTATGG-30 (forward primer) and 50-CATCTTGGTTGTGTTGCTCCG-30 (reverse primer) were used. Threeindependent experiments, each one in triplicates, were carriedout in each case of RT-PCR experiments and relative gene expres-sion was calculated by the equation 2�ddCt.
For Western blot, the total protein was isolated from both WTand T2 transgenic plants by TCA-acetone method [37]. Abouttwenty micrograms of total protein form both plants were sepa-rated by electrophoresis on 12.5% SDS–PAGE and transferred ontoa nitrocellulose membrane. The membranes were blocked with 5%milk powder and incubated with a GFP specific monoclonal anti-body (Sigma, India) for 3 h at a 1:5000 dilution. After three timeswash to remove unbound antibody, the primary antibody boundwith GFP-tagged protein was detected with a horseradish peroxi-dase-conjugated anti-mouse IgG secondary antibody using the3,30-diaminobenzidine (DAB) assay.
4.4. Determination of plant growth
WT plants as well as T2 lines were analyzed at regular intervals(15th, 30th and 45th d) to assess growth parameters like root length,number of roots, shoots length, number of shoots etc. Dry weight ofsamples were determined after overnight drying in an oven at 40 �C.
4.5. Transgenic plant material and stress treatments
For stress treatments, WT and T2 generation transgenic seeds ofthree independent lines (TG1, TG4 and TG5) were surface sterilizedwith 70% ethanol and sown on hygromycin containing 1/2 MSmedium supplemented with 250 mM NaCl (salt stress) or on dif-ferent concentrations of mannitol ranging from 100 to 500 mM(drought stress). They were incubated at 16 h light/8 h darknessat 24 �C in the growth chamber. The germination percentages weremeasured after 15 d of sowing. Several growth parameters likeshoot length, root length, leaf area and plant dry weight were mea-sured at 4 weeks after salinity (250 mM NaCl) or drought (200 mMmannitol) stress treatment. Shoot and root length was measuredon meter scale. Leaf area was measured by a leaf area meter (Sys-tronics, India). For physiological assessment, the wild-type and T2
transgenic plants (TG1, TG4 and TG5) were grown in growth cham-ber (16 h light/8 h darkness at 24 �C). These plants were then sub-jected to salinity and water deficit stresses, and 4 weeks afterstress initiation, data were recorded for relative water content(RWC) and chlorophyll. The RWC were determined as describedby Goel et al. [38] using the formula, RWC (%) = (FW � DW)/(TW � DW) � 100.
4.6. Leaf disk assay
Leaf disk senescence assay were carried out on WT and T2 gen-eration transgenic seeds of TG1, TG4 and TG5 plants to assess itsstress tolerance as described by Vivek et al. [39]. In brief, leaf disksof 1.0 cm diameter were excised from healthy and fully expandedtobacco leaves of similar age from transgenic and WT plant (45 dold). The disks were floated in a 6 ml solution of 250 mM NaCl or200 mM mannitol or water (experimental control) for 96 h andthen used for measuring chlorophyll a and b spectrophotometri-cally after extraction in 80% acetone [40]. The treatment wascarried out in continuous white light at 25 ± 2 �C.
4.7. Determination of photosynthetic parameters
Gas exchange measurements were done on intact mature leavesof plants using a Portable Photosynthesis System (LI-6400XT, Li-COR, U.S.A.). All the photosynthetic measurements were made ata leaf temperature of 30 ± 2.0 �C and at a constant CO2 concentra-tion of 400 lmol mol�1 using a CO2 injector (LI-6400-01, Li-COR,U.S.A.). For light response curve, the light intensity was varied from20 to 1800 lmol quanta m�2 s�1 with CO2 assimilation valuesbeing logged for each light. Chlorophyll fluorescence measure-ments were made following standard technique [41]. The maxi-mum potential photochemical efficiency defined as the ratio ofvariable to maximum fluorescence emitted by chlorophyll (Fv/Fm) was estimated using a portable chlorophyll fluorometerPAM-2100 (Heinz Walz, Germany). The plants were dark adaptedfor 20 min prior to measurement. Maximal fluorescence underlight exposure (Fm’) was obtained by imposing 1s saturating flashto the leaf in order to reduce the entire PS II reaction centre afterattaining steady state fluorescence (Ft). Minimal fluorescenceimmediately after light exposure (Fo0) was determined by impos-ing dark while a far red light was simultaneously switched on tooxidize PS II rapidly by drawing electrons from PS II to PS I.
4.8. Total estimation of flavonoids, alkaloids and phenol content intransgenic tobacco
For phytochemical analysis, quercetin, 4-hydroxy 1-methylquinolone and kaempferol were purchased form Sigma–Aldrich,India. Alkaloid content was determined gravimetrically. Three tofour grams of WT and transgenic leaves were treated three times
340 M.S. Resmi et al. / FEBS Letters 589 (2015) 332–341
with 5 N HCl and the combined filtrate was concentrated and madeup to 100 ml with 5 N HCL. After centrifugation the supernatantwas collected and treated with chloroform four times to extractthe acidic solution. The pH of acidic layer was adjusted to9.0 ± 0.5 with ammonia solution and again treated with chloroformfour times. The chloroform layer was washed with water and thenpassed through anhydrous sodium sulfate. After complete evapora-tion of the chloroform, the residue was kept in an oven maintainedat 60 �C until a constant weight is obtained. The weight of totalalkaloid was then determined by following formula.
Weight of the residue obtainedWeight of sample taken
� 100
¼ % w=w of Total alkaloids:
For the estimation of total phenols, the method described by[42] was modified. Aliquots of methanol containing 0.6 mg sampleextract were mixed with diluted Folin–Ciocalteu reagent andsodium carbonate solution (7.5% w/v) in a ratio of 1:5:4 and keptin the dark for 30 min. The absorbance of the mixture was mea-sured at 750 nm. A calibration curve was established with differentconcentration of tannic acid for estimating the total phenolic con-tent in the samples. Concentration of total phenolic was expressedas mg of tannic acid equivalent (TAE)/g DW.
Flavonoid content was determined by HPLC. For sample prepa-ration, three grams of powdered WT and transgenic leaf sampleswere extracted two times with 15 ml of methanol for 20 min each.Then the filtrate was combined, concentrated and made up to10 ml with methanol. For standard, 1 mg/ml of quercetin was pre-pared in methanol. The samples were eluted in a Phenomenex-Luna 5l C-18(2) (250 � 4.60 mm, 5 lm) column in gradient modewith mobile phase A as acetonitrile and mobile phase B consistingof water and phosphoric acid (100:0.1 v/v). The UV detectionwavelength was set at 370 nm (the maximum absorption wave-length of quercetin). The flow rate was 1.5 ml/min and the columntemperature was maintained at 25 �C. 4-hydroxy 1-methyl quino-lone was also determined by HPLC using the same methoddescribed for flavonoid quantitation and chromatogram was mea-sured at 290 nm.
4.9. Statistical analysis
Three independent experiments, each one in triplicates, werecarried out in each case and representative data were shown. Stu-dent’s t-test was used to analyze all the data presented as themean ± S.E. (n = 3) to compare the obtained parameters from trans-genic and WT plants under normal or stress conditions. A P value of0.0001 was considered to be statistically significant.
Author contributions
Planned experiments: E.V.S., M.S.R. performed the experiments:M.S.R. analyzed the data: E.V.S., M.S.R., P.J.V. contributed reagents/materials/analysis tools: E.V.S. wrote the manuscript: E.V.S., M.S.R.,P.J.V.
Acknowledgements
This work was supported by Department of Science andTechnology, New Delhi, India. M. S. Resmi received a research fel-lowship from Council of Scientific and Industrial Research (NewDelhi, India).
We thank Dr. R. Krishnakumar and Dr. K. V. Sumesh, RubberResearch Institute of India, Kottayam, Kerala for providing facilitiesand technical support in measuring photosynthetic parameters.
References
[1] Flores-Sanchez, I.J. and Verpoorte, R. (2009) Plant polyketide synthases: afascinating group of enzymes. Plant Physiol. Biochem. 47, 167–174, http://dx.doi.org/10.1016/j.plaphy.2008.11.005. pii:S0981-9428(08)00214-3.
[2] Resmi, M.S., Verma, P., Gokhale, R.S. and Soniya, E.V. (2013) Identification andcharacterization of a type III polyketide synthase involved in quinolonealkaloid biosynthesis from Aegle marmelos Correa. J. Biol. Chem. 288, 7271–7281, http://dx.doi.org/10.1074/jbc.M112.429886. pii:M112.429886.
[3] Jez, J.M., Bowman, M.E. and Noel, J.P. (2002) Expanding the biosyntheticrepertoire of plant type III polyketide synthases by altering starter moleculespecificity. Proc. Natl. Acad. Sci. U.S.A. 99, 5319–5324. doi:10.1073/pnas.08259049999/8/5319 [pii].
[4] Austin, M.B. and Noel, J.P. (2003) The chalcone synthase superfamily of type IIIpolyketide synthases. Nat. Prod. Rep. 20, 79–110.
[5] Dao, T.T., Linthorst, H.J. and Verpoorte, R. (2011) Chalcone synthase and itsfunctions in plant resistance. Phytochem. Rev. 10, 397–412. doi:10.1007/s11101-011-9211-79211 [pii].
[6] Yu, C.K., Springob, K., Schmidt, J., Nicholson, R.L., Chu, I.K., Yip, W.K. and Lo, C.(2005) A stilbene synthase gene (SbSTS1) is involved in host and nonhostdefense responses in sorghum. Plant Physiol. 138, 393–401. doi:pp.105.059337 [pii]10.1104/pp.105.059337.
[7] Wolf, L., Rizzini, L., Stracke, R., Ulm, R. and Rensing, S.A. (2010) The molecularand physiological responses of Physcomitrella patens to ultraviolet-B radiation.Plant Physiol. 153, 1123–1134. doi:10.1104/pp.110.154658 pp.110.154658[pii].
[8] Vannozzi, A., Dry, I.B., Fasoli, M., Zenoni, S. and Lucchin, M. (2012) Genome-wide analysis of the grapevine stilbene synthase multigenic family: genomicorganization and expression profiles upon biotic and abiotic stresses. BMCPlant Biol. 12, 130. doi:10.1186/1471-2229-12-1301471-2229-12-130 [pii].
[9] Xu, W., Yu, Y., Ding, J., Hua, Z. and Wang, Y. (2010) Characterization of a novelstilbene synthase promoter involved in pathogen- and stress-inducibleexpression from Chinese wild Vitis pseudoreticulata. Planta 231, 475–487,http://dx.doi.org/10.1007/s00425-009-1062-8.
[10] Zuk, M., Kulma, A., Dyminska, L., Szoltysek, K., Prescha, A., Hanuza, J. andSzopa, J. (2011) Flavonoid engineering of flax potentiate its biotechnologicalapplication. BMC Biotechnol. 11, 10. doi:10.1186/1472-6750-11-101472-6750-11-10 [pii].
[11] Lukaszewicz, M., Matysiak-Kata, I., Skala, J., Fecka, I., Cisowski, W. and Szopa, J.(2004) Antioxidant capacity manipulation in transgenic potato tuber bychanges in phenolic compounds content. J. Agric. Food Chem. 52, 1526–1533,http://dx.doi.org/10.1021/jf034482k.
[12] Rahnama, H., Razi, Z., Dadgar, M.N. and Hasanloo, T. (2013) Enhancedproduction of flavonolignans in hairy root cultures of Silybium marianum byover-expression of chalcone synthase gene. J. Plant Biochem. Biotechnol. 22,138–143.
[13] Wang, C.K., Chen, P.Y., Wang, H.M. and To, K.Y. (2006) Cosuppression oftobacco chalcone synthase using Petunia chalcone synthase construct resultsin white flowers. Bot. Stud. 47, 71–82.
[14] Hain, R., Reif, H.J., Krause, E., Langebartels, R., Kindl, H., Vornam, B., Wiese, W.,Schmelzer, E., Schreier, P.H., Stocker, R.H., et al. (1993) Disease resistanceresults from foreign phytoalexin expression in a novel plant. Nature 361, 153–156, http://dx.doi.org/10.1038/361153a0.
[15] Hipskind, J.D. and Paiva, N.L. (2000) Constitutive accumulation of aresveratrol-glucoside in transgenic alfalfa increases resistance to Phomamedicaginis. Mol. Plant Microbe. Interact. 13, 551–562, http://dx.doi.org/10.1094/MPMI.2000.13.5.551.
[16] Thomzik, J.E., Stenzel, K., Stocker, R., Schreier, P.H., Hain, R. and Stahl, D.J.(1997) Synthesis of a grapevine phytoalexin in transgenic tomatoes(Lycopersicon esculentum Mill.) conditions resistance against Phytophthorainfestans. Physiol. Mol. Plant Pathol. 51, 265–278.
[17] Venkatesh, P., Shantala, B., Jagetia, G.C., Rao, K.K. and Baliga, M.S. (2007)Modulation of doxorubicin-induced genotoxicity by Aegle marmelos in mousebone marrow: a micronucleus study. Integr. Cancer Ther. 6, 42–53. doi:6/1/42[pii]10.1177/1534735406298302.
[18] Michael, J.P. (2008) Quinoline, quinazoline and acridone alkaloids. Nat. Prod.Rep. 25, 166–187, http://dx.doi.org/10.1039/b612168n.
[19] Kacperska, A. (1993) Water potential alteration – a prerequisite or a triggeringstimulus for the development of freezing tolerance in overwinteringherbaceous plants? in: Advances in Plant Cold Hardiness (Li, PH. andChristerson, L., Eds.), pp. 73–91, CRC Press, Boca Raton.
[20] Strasser, R.J., Sivastava, A. and Tsimilli-Michae, M. (2002) The fluorescencetransient as a tool to characterize and screen photosynthetic samples in:Probing Photosynthesis: Mechanism, Regulation and Adaptation (Mohanty, P.,Yunus, U. and Pathre, M., Eds.), pp. 443–480, Taylor and Francis, London.
[21] Borejsza-Wysocki, W. and Hrazdina, G. (1996) Aromatic polyketide synthases(purification, characterization, and antibody development to benzalacetonesynthase from raspberry fruits). Plant Physiol. 110, 791–799. doi:110/3/791[pii].
[22] Hanhineva, K., Kokko, H., Siljanen, H., Rogachev, I., Aharoni, A. and Karenlampi,S.O. (2009) Stilbene synthase gene transfer caused alterations in thephenylpropanoid metabolism of transgenic strawberry (Fragaria x ananassa).J. Exp. Bot. 60, 2093–2106. doi:10.1093/jxb/erp085erp085 [pii].
[23] Serazetdinova, L., Oldach, K.H. and Lorz, H. (2005) Expression of transgenicstilbene synthases in wheat causes the accumulation of unknown stilbene

M.S. Resmi et al. / FEBS Letters 589 (2015) 332–341 341
derivatives with antifungal activity. J. Plant Physiol. 162, 985–1002.doi:S0176-1617(05)00011-8 [pii]10.1016/j.jplph.2004.11.005.
[24] Falcone Ferreyra, M.L., Rius, S.P. and Casati, P. (2012) Flavonoids: biosynthesis,biological functions, and biotechnological applications. Front. Plant Sci. 3, 222,http://dx.doi.org/10.3389/fpls.2012.00222.
[25] Han, Y., Ming, F., Wang, J.W., Ye, M. and Shen, D. (2005) A novel chalconesynthase gene from Phalaenopsis orchid that alters floral morphology intransgenic tobacco plants. Plant Mol. Biol. Rep. 23, 193–194.
[26] Preisig-Muller, R., Schwekendiek, A., Brehm, I., Reif, H.J. and Kindl, H. (1999)Characterization of a pine multigene family containing elicitor-responsivestilbene synthase genes. Plant Mol. Biol. 39, 221–229.
[27] Richard, S., Lapointe, G., Rutledge, R.G. and Seguin, A. (2000) Induction ofchalcone synthase expression in white spruce by wounding and jasmonate.Plant Cell Physiol. 41, 982–987.
[28] Versari, A., Parpinello, G.P., Tornielli, G.B., Ferrarini, R. and Giulivo, C. (2001)Stilbene compounds and stilbene synthase expression during ripening,wilting, and UV treatment in grape cv. Corvina. J. Agric. Food Chem. 49,5531–5536. doi:jf010672o [pii].
[29] Apel, K. and Hirt, H. (2004) Reactive oxygen species: metabolism, oxidativestress, and signal transduction. Annu. Rev. Plant Biol. 55, 373–399.doi:10.1146/annurev.arplant.55.031903.141701.
[30] Torres, M.A. and Dangl, J.L. (2005) Functions of the respiratory burst oxidase inbiotic interactions, abiotic stress and development. Curr. Opin. Plant Biol. 8,397–403. doi:S1369-5266(05)00075-0 [pii]10.1016/j.pbi.2005.05.014.
[31] Gill, S.S. and Tuteja, N. (2010) Reactive oxygen species and antioxidantmachinery in abiotic stress tolerance in crop plants. Plant Physiol. Biochem.48, 909–930. doi:10.1016/j.plaphy.2010.08.016S0981-9428(10)00179-8 [pii].
[32] Hassan, S. and Mathesius, U. (2012) The role of flavonoids in root-rhizospheresignalling: opportunities and challenges for improving plant–microbeinteractions. J. Exp. Bot. 63, 3429–3444. doi:10.1093/jxb/err430err430 [pii].
[33] Laffont, C., Blanchet, S., Lapierre, C., Brocard, L., Ratet, P., Crespi, M., Mathesius,U. and Frugier, F. (2010) The compact root architecture1 gene regulates
lignification, flavonoid production, and polar auxin transport in Medicagotruncatula. Plant Physiol. 153, 1597–1607. doi:10.1104/pp.110.156620pp.110.156620 [pii].
[34] Curtis, M.D. and Grossniklaus, U. (2003) A gateway cloning vector set for high-throughput functional analysis of genes in planta. Plant Physiol. 133, 462–469.doi:10.1104/pp.103.027979133/2/462 [pii].
[35] An, G., Ebert, P., Mitra, A. and Ha, S. (1988) Binary vectors in: Plant MolecularBiology Manual (Gelvin, S.B. and Schilperoort, R.A., Eds.), Kluwer, Drodrecht.pp. A3/1–A3/19.
[36] Horsch, R.B., Fry, J.E., Hoffmann, N.L., Eichholtz, D., Rogers, S.G. and Fraley, R.T.(1985) A simple and general method for transferring genes into plants. Science227, 1229–1231.
[37] Méchin, V., Damerval, C. and Zivy, M. (2007) Total protein extraction withTCA-acetone. Methods Mol. Biol. 355, 1–8.
[38] Goel, D., Singh, A.K., Yadav, V., Babbar, S.B. and Bansal, K.C. (2010)Overexpression of osmotin gene confers tolerance to salt and droughtstresses in transgenic tomato (Solanum lycopersicum L.). Protoplasma 245,133–141, http://dx.doi.org/10.1007/s00709-010-0158-0.
[39] Vivek, P.J., Tuteja, N. and Soniya, E.V. (2013) CDPK1 from ginger promotessalinity and drought stress tolerance without yield penalty by improvinggrowth and photosynthesis in Nicotiana tabacum. PLoS ONE 8, e76392.doi:10.1371/journal.pone.0076392PONE-D-13-13927 [pii].
[40] Lichtenthaler, H.K. (1987) Chlorophylls and carotenoids: pigments ofphotosynthetic biomembranes. Methods Enzymol. 148, 350–366.
[41] Schreiber, U., Klughammer, C. and Neubauer, C. (1988) Measuring P700absorbance changes around 830 nm with a new type of pulse modulationsystem. Z. Naturforsch. 43, 686–698.
[42] Kahkonen, M.P., Hopia, A.I., Vuorela, H.J., Rauha, J.P., Pihlaja, K., Kujala, T.S. andHeinonen, M. (1999) Antioxidant activity of plant extracts containing phenoliccompounds. J. Agric. Food Chem. 47, 3954–3962. doi:jf990146l [pii].