outlook on asian lng - siew
TRANSCRIPT
(C) 2016 IEEJ, All rights reserved
Outlook on Asian LNG- Market Dynamics and Pricing -
Yukari YamashitaThe Institute of Energy Economics, Japan (IEEJ)
27 October 2016Singapore International Energy Week 2016
Think tank Roundtable A
Asia/WorldEnergyOutlook2016
(C) 2016 IEEJ, All rights reserved
Introduction
Findings from “Asia/ World Energy Outlook 2016”
Energy Situation in Asia
Scenario Study: Supply Disruption of Oil and Gas
Climate Change Measures
Today’s Discussion Points
2
(C) 2016 IEEJ, All rights reserved
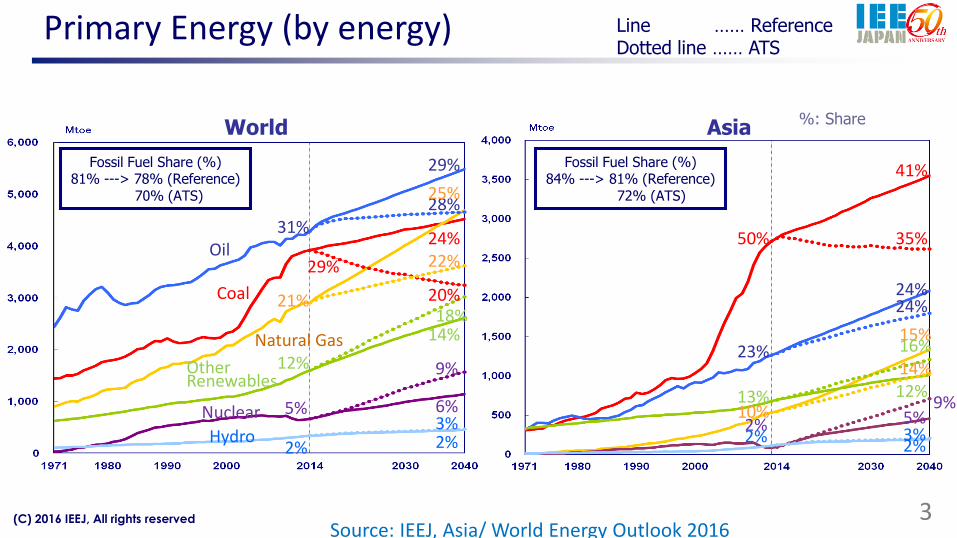
Primary Energy (by energy) Line …… ReferenceDotted line …… ATS
World Asia
Oil
Coal
Natural Gas
OtherRenewables
Nuclear
Hydro
31%
%: Share
29%
28%
23%
24%24%
50%
41%
35%24%
20%
29%
21%
25%
22%
10%
15%
14%12%
14%
9%
13% 12%
16%
5% 6%
18%
2% 5%9%
2%2%2% 2%
3%
Fossil Fuel Share (%)81% ---> 78% (Reference)
70% (ATS)
Fossil Fuel Share (%)84% ---> 81% (Reference)
72% (ATS)
3
3%
Source: IEEJ, Asia/ World Energy Outlook 2016

(C) 2016 IEEJ, All rights reserved
Huge Improvement in Energy Intensity
4
Annual Growth Rate (World:2014-2040) GDP and Primary Energy Demand
0.0
2.0
4.0
6.0
8.0
2000 2010 2020 2030 2040
GDP
Energy
Y2000=1.0
OECD2.9%
0.9%
1.2%
2.8%
1.2%
2.2%
0.0%
0.5%
1.0%
1.5%
2.0%
2.5%
3.0%
GDP Population Energy
ー: Y2000-2014
0.0
2.0
4.0
6.0
8.0
2000 2010 2020 2030 2040
GDP
Energy
Y2000=1.0
non OECD
Source: IEEJ, Asia/ World Energy Outlook 2016
(C) 2016 IEEJ, All rights reserved
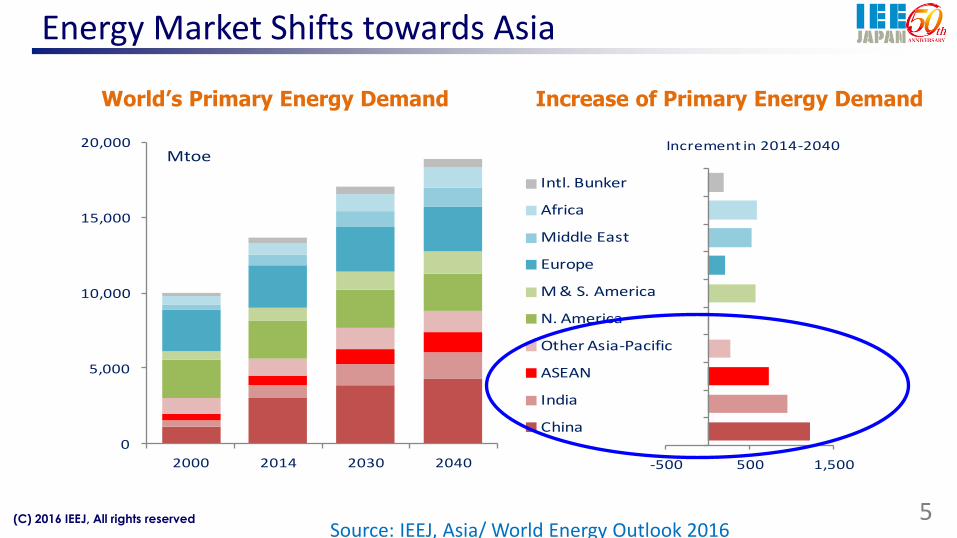
Energy Market Shifts towards Asia
5
World’s Primary Energy Demand Increase of Primary Energy Demand
-500 500 1,500
Increment in 2014-2040
0
5,000
10,000
15,000
20,000
2000 2014 2030 2040
Intl. Bunker
Africa
Middle East
Europe
M & S. America
N. America
Other Asia-Pacific
ASEAN
India
China
Mtoe
Source: IEEJ, Asia/ World Energy Outlook 2016
(C) 2016 IEEJ, All rights reserved
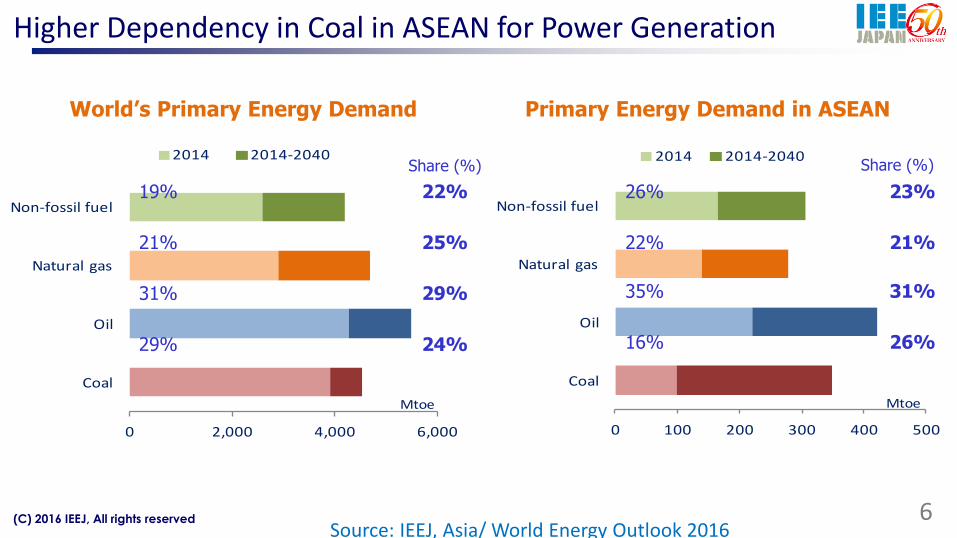
0 2,000 4,000 6,000
Coal
Oil
Natural gas
Non-fossil fuel
2014 2014-2040
Mtoe
0 100 200 300 400 500
Coal
Oil
Natural gas
Non-fossil fuel
2014 2014-2040
Mtoe
Higher Dependency in Coal in ASEAN for Power Generation
6
Primary Energy Demand in ASEANWorld’s Primary Energy Demand
22%
25%
29%
24%
19%
21%
31%
29%
23%
21%
31%
26%
26%
22%
35%
16%
Share (%) Share (%)
Source: IEEJ, Asia/ World Energy Outlook 2016
(C) 2016 IEEJ, All rights reserved
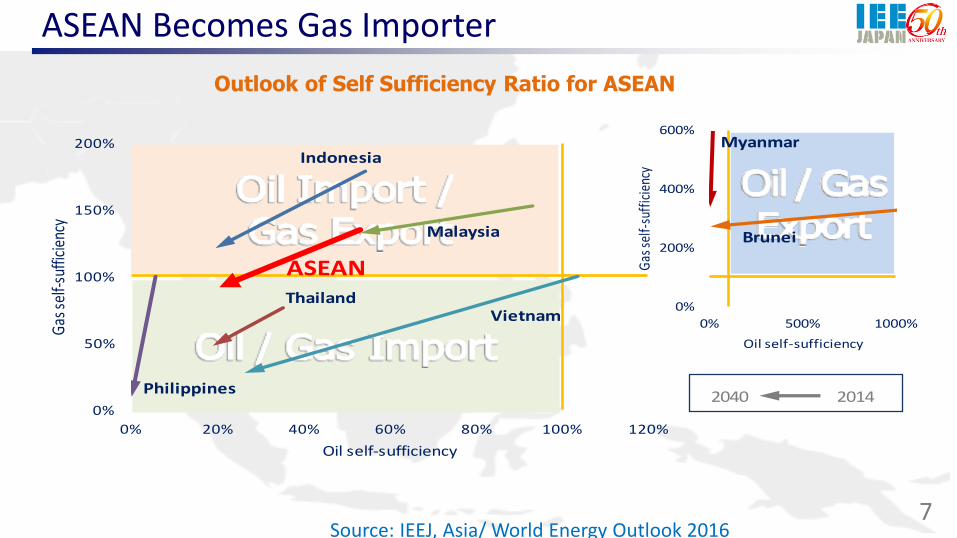
ASEAN Becomes Gas Importer
Outlook of Self Sufficiency Ratio for ASEAN
7
201420400%
50%
100%
150%
200%
0% 20% 40% 60% 80% 100% 120%
Gas
self-
suffi
cien
cy
Oil self-sufficiency
Indonesia
Malaysia
VietnamThailand
Philippines
ASEAN
0%
200%
400%
600%
0% 500% 1000%
Gas
self-
suff
icie
ncy
Oil self-sufficiency
Brunei
Myanmar
Source: IEEJ, Asia/ World Energy Outlook 2016
(C) 2016 IEEJ, All rights reserved
Supply Disruption of Oil and Gas
Asia/WorldEnergyOutlook 2016
(C) 2016 IEEJ, All rights reserved
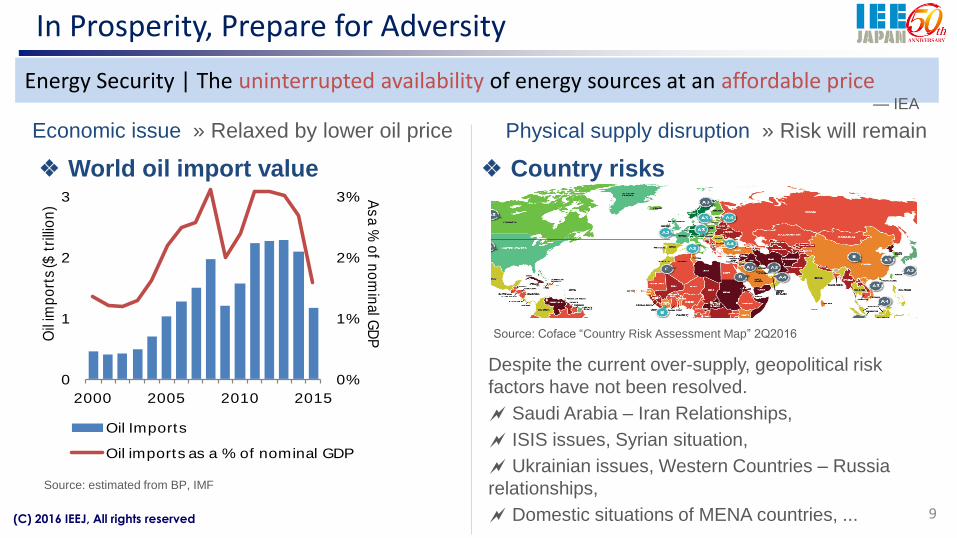
0%
1%
2%
3%
0
1
2
3
2000 2005 2010 2015
As a
% o
f no
min
al G
DPO
il im
po
rts
($ t
rilli
on
)
Oil Imports
Oil imports as a % of nominal GDP
Despite the current over-supply, geopolitical risk
factors have not been resolved.
Saudi Arabia – Iran Relationships,
ISIS issues, Syrian situation,
Ukrainian issues, Western Countries – Russia
relationships,
Domestic situations of MENA countries, ...
In Prosperity, Prepare for Adversity
Energy Security | The uninterrupted availability of energy sources at an affordable price
9
Economic issue » Relaxed by lower oil price Physical supply disruption » Risk will remain
Source: Coface “Country Risk Assessment Map” 2Q2016
❖ World oil import value ❖ Country risks
— IEA
Source: estimated from BP, IMF
(C) 2016 IEEJ, All rights reserved
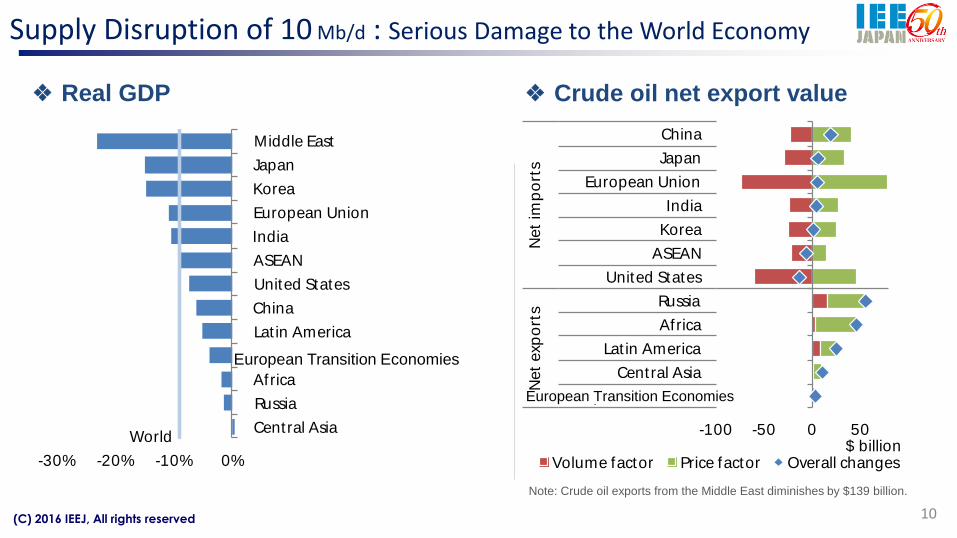
Supply Disruption of 10 Mb/d : Serious Damage to the World Economy
10
❖ Real GDP ❖ Crude oil net export value
Note: Crude oil exports from the Middle East diminishes by $139 billion.
World
-30% -20% -10% 0%
Central Asia
Russia
Africa
European t ransit ion …
Lat in America
China
United States
ASEAN
India
European Union
Korea
Japan
Middle East
-100 -50 0 50
European t ransit ion …
Central Asia
Lat in America
Africa
Russia
United States
ASEAN
Korea
India
European Union
Japan
China
Net
exp
ort
sN
et
imp
ort
s
$ billionVolume factor Price factor Overall changes
European Transition Economies
European Transition Economies
(C) 2016 IEEJ, All rights reserved
World
-10% 0%
China
Russia
United States
Lat in America
Africa
India
ASEAN
European Union
Japan
Korea
Central Asia
Middle East
European …
World
-20% -10% 0%
China
United States
Lat in America
India
Africa
ASEAN
Korea
Japan
European Union
Middle East
Central Asia
Russia
European …
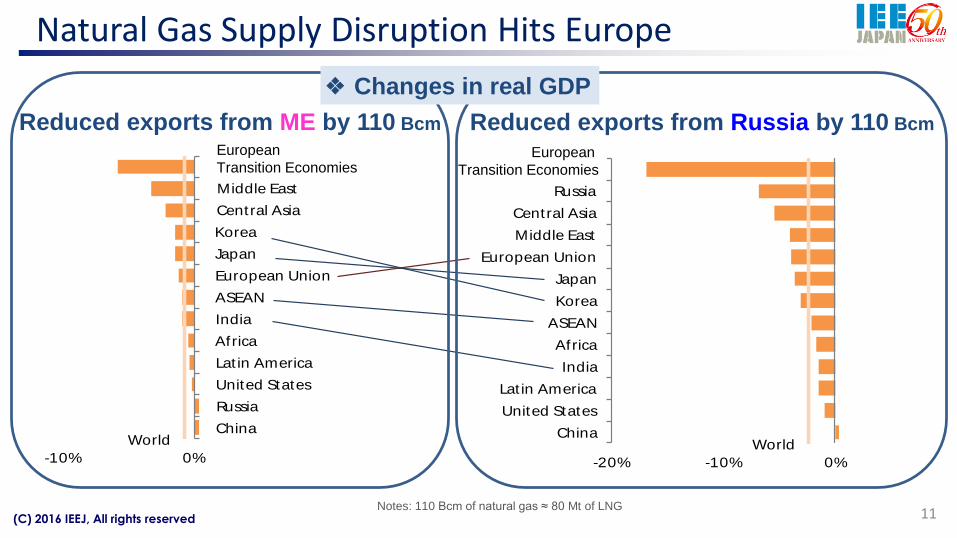
Natural Gas Supply Disruption Hits Europe
11
Reduced exports from ME by 110 Bcm Reduced exports from Russia by 110 Bcm
Notes: 110 Bcm of natural gas ≈ 80 Mt of LNG
European
Transition EconomiesEuropean
Transition Economies
❖ Changes in real GDP
(C) 2016 IEEJ, All rights reserved
Climate Change Measures |
Paris Agreement, Advanced Technologies Case, Hydrogen
Asia/WorldEnergyOutlook 2016
(C) 2016 IEEJ, All rights reserved
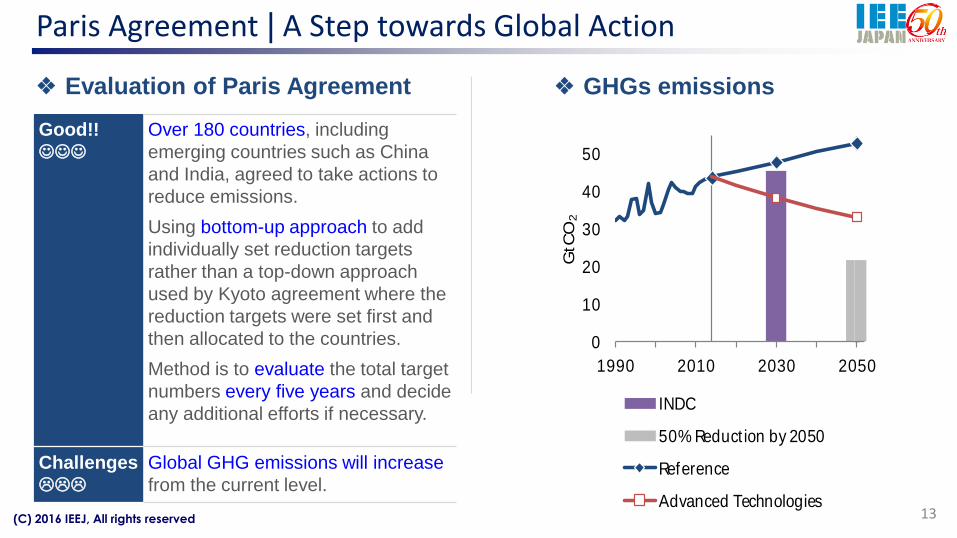
Paris Agreement | A Step towards Global Action
13
❖ Evaluation of Paris Agreement ❖ GHGs emissions
Good!!
Over 180 countries, including
emerging countries such as China
and India, agreed to take actions to
reduce emissions.
Using bottom-up approach to add
individually set reduction targets
rather than a top-down approach
used by Kyoto agreement where the
reduction targets were set first and
then allocated to the countries.
Method is to evaluate the total target
numbers every five years and decide
any additional efforts if necessary.
Challenges
Global GHG emissions will increase
from the current level.
0
10
20
30
40
50
1990 2010 2030 2050
GtC
O2
INDC
50% Reduct ion by 2050
Reference
Advanced Technologies
(C) 2016 IEEJ, All rights reserved
Rule for Ultra Long-term: Reduce the Total Cost
14
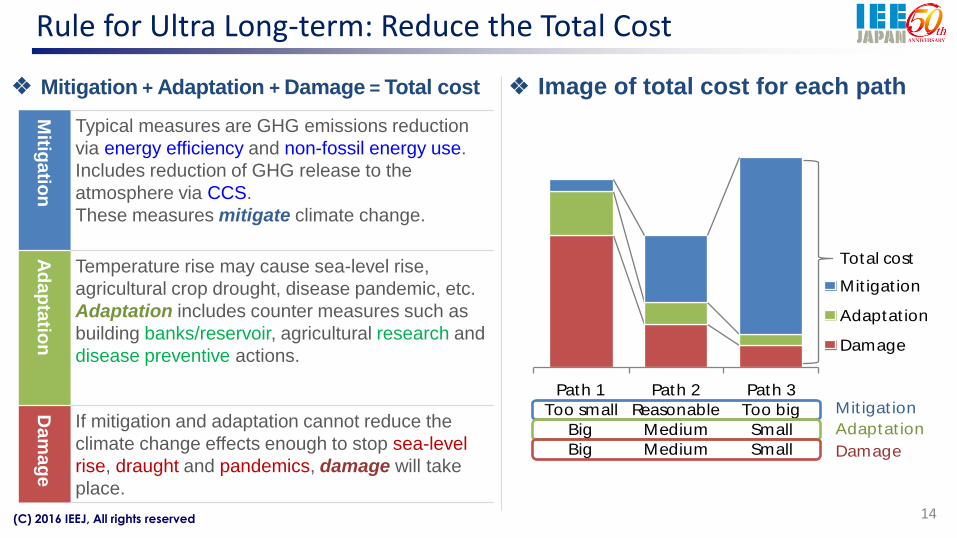
❖ Mitigation + Adaptation + Damage = Total cost ❖ Image of total cost for each path
Mitig
atio
n
Typical measures are GHG emissions reduction
via energy efficiency and non-fossil energy use.
Includes reduction of GHG release to the
atmosphere via CCS.
These measures mitigate climate change.
Ad
ap
tatio
n
Temperature rise may cause sea-level rise,
agricultural crop drought, disease pandemic, etc.
Adaptation includes counter measures such as
building banks/reservoir, agricultural research and
disease preventive actions.
Da
ma
ge
If mitigation and adaptation cannot reduce the
climate change effects enough to stop sea-level
rise, draught and pandemics, damage will take
place.
Path 1
Too small
Big
Big
Path 2
Reasonable
Medium
Medium
Path 3
Too big
Small
Small
Mit igat ion
Adaptat ion
Damage
Total cost
Mit igat ion
Adaptat ion
Damage
(C) 2016 IEEJ, All rights reserved
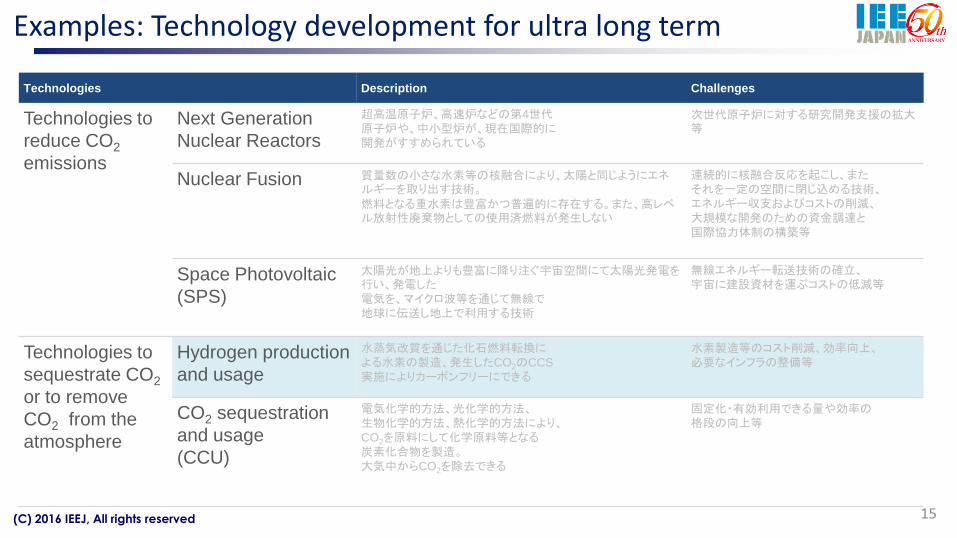
Examples: Technology development for ultra long term
15
Technologies Description Challenges
Technologies to
reduce CO2
emissions
Next Generation
Nuclear Reactors
超高温原子炉、高速炉などの第4世代原子炉や、中小型炉が、現在国際的に開発がすすめられている
次世代原子炉に対する研究開発支援の拡大等
Nuclear Fusion 質量数の小さな水素等の核融合により、太陽と同じようにエネルギーを取り出す技術。燃料となる重水素は豊富かつ普遍的に存在する。また、高レベル放射性廃棄物としての使用済燃料が発生しない
連続的に核融合反応を起こし、またそれを一定の空間に閉じ込める技術、エネルギー収支およびコストの削減、大規模な開発のための資金調達と国際協力体制の構築等
Space Photovoltaic
(SPS)
太陽光が地上よりも豊富に降り注ぐ宇宙空間にて太陽光発電を行い、発電した電気を、マイクロ波等を通じて無線で地球に伝送し地上で利用する技術
無線エネルギー転送技術の確立、宇宙に建設資材を運ぶコストの低減等
Technologies to
sequestrate CO2
or to remove
CO2 from the
atmosphere
Hydrogen production
and usage
水蒸気改質を通じた化石燃料転換による水素の製造、発生したCO2のCCS
実施によりカーボンフリーにできる
水素製造等のコスト削減、効率向上、必要なインフラの整備等
CO2 sequestration
and usage
(CCU)
電気化学的方法、光化学的方法、生物化学的方法、熱化学的方法により、CO2を原料にして化学原料等となる炭素化合物を製造。大気中からCO2を除去できる
固定化・有効利用できる量や効率の格段の向上等
(C) 2016 IEEJ, All rights reserved
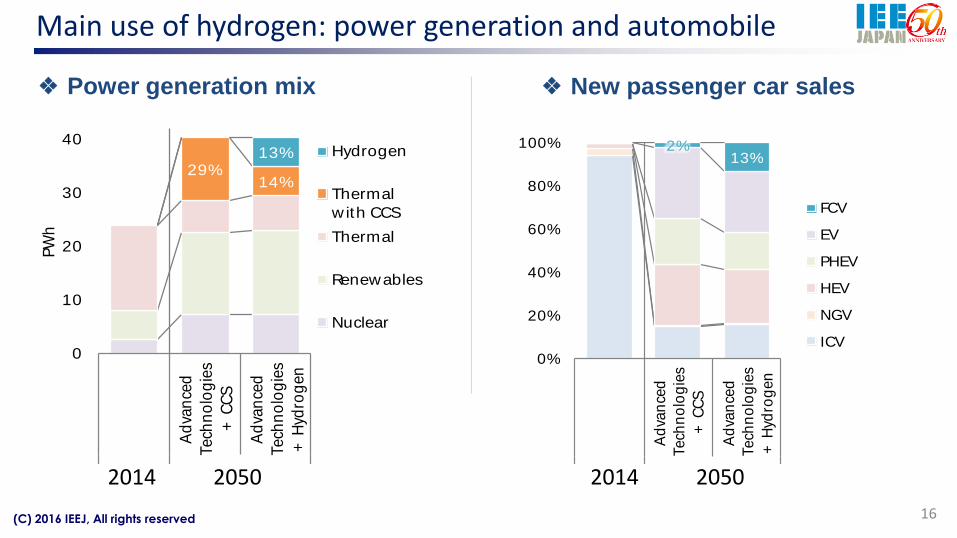
Main use of hydrogen: power generation and automobile
16
❖ Power generation mix ❖ New passenger car sales
29%14%
13%
0
10
20
30
40
Ad
van
ced
Tech
no
log
ies
+ C
CS
Ad
van
ced
Tech
no
log
ies
+ H
ydro
gen
PW
h
Hydrogen
Thermal
w ith CCS
Thermal
Renewables
Nuclear
2%13%
0%
20%
40%
60%
80%
100%
Ad
van
ced
Tech
no
log
ies
+ C
CS
Ad
van
ced
Tech
no
log
ies
+ H
ydro
gen
FCV
EV
PHEV
HEV
NGV
ICV
2014 2050 2014 2050
(C) 2016 IEEJ, All rights reserved
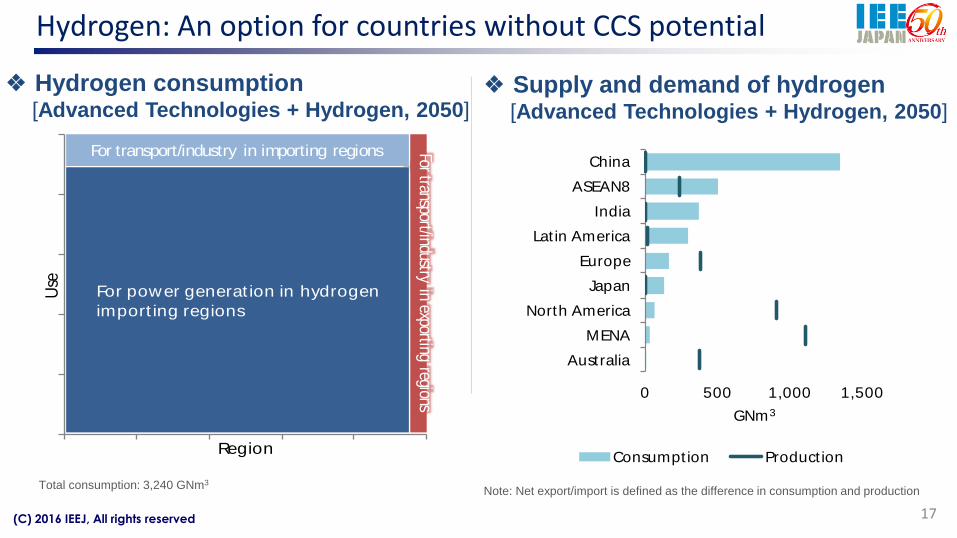
Use
Region
For power generat ion in hydrogen
import ing regions
For transport/industry in importing regions For transport/industry in exporting regions 0 500 1,000 1,500
Australia
MENA
North America
Japan
Europe
Lat in America
India
ASEAN8
China
GNm3
Consumpt ion Product ion
Hydrogen: An option for countries without CCS potential
17
❖ Supply and demand of hydrogen[Advanced Technologies + Hydrogen, 2050]
❖ Hydrogen consumption[Advanced Technologies + Hydrogen, 2050]
Note: Net export/import is defined as the difference in consumption and productionTotal consumption: 3,240 GNm3
(C) 2016 IEEJ, All rights reserved
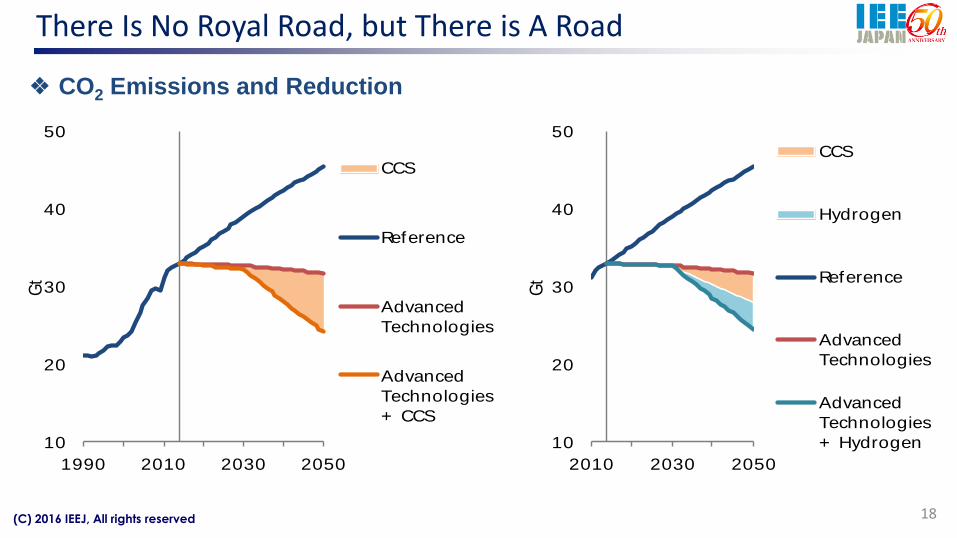
There Is No Royal Road, but There is A Road
18
❖ CO2 Emissions and Reduction
10
20
30
40
50
1990 2010 2030 2050
Gt
CCS
Reference
Advanced
Technologies
Advanced
Technologies
+ CCS
10
20
30
40
50
2010 2030 2050
Gt
CCS
Hydrogen
Reference
Advanced
Technologies
Advanced
Technologies
+ Hydrogen

(C) 2016 IEEJ, All rights reserved
IEEJ’s Asia/World Energy Outlook 2016Will be available at the site below:
http://eneken.ieej.or.jp/en/whatsnew/424.html
Asia/WorldEnergyOutlook2016
(C) 2016 IEEJ, All rights reserved
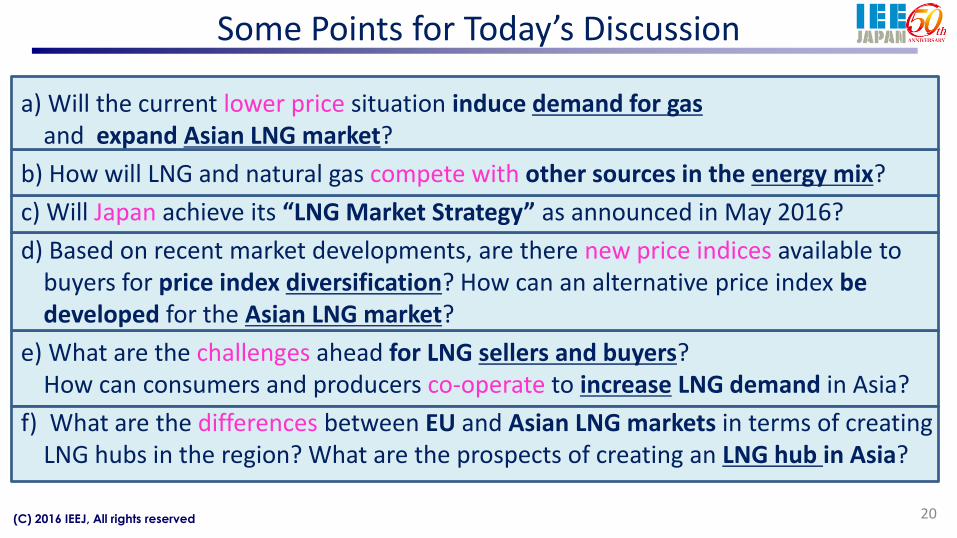
a) Will the current lower price situation induce demand for gasand expand Asian LNG market?
b) How will LNG and natural gas compete with other sources in the energy mix?
c) Will Japan achieve its “LNG Market Strategy” as announced in May 2016?
d) Based on recent market developments, are there new price indices available to buyers for price index diversification? How can an alternative price index be developed for the Asian LNG market?
e) What are the challenges ahead for LNG sellers and buyers? How can consumers and producers co-operate to increase LNG demand in Asia?
f) What are the differences between EU and Asian LNG markets in terms of creating LNG hubs in the region? What are the prospects of creating an LNG hub in Asia?
Some Points for Today’s Discussion
20
(C) 2016 IEEJ, All rights reserved
a) Will the current lower price situation induce demand for gasand expand Asian LNG market?
b) How will LNG and natural gas compete with other sources in the energy mix?
c) Will Japan achieve its “LNG Market Strategy” as announced in May 2016?
d) Based on recent market developments, are there new price indices available to buyers for price index diversification? How can an alternative price index be developed for the Asian LNG market?
e) What are the challenges ahead for LNG sellers and buyers? How can consumers and producers co-operate to increase LNG demand in Asia?
f) What are the differences between EU and Asian LNG markets in terms of creating LNG hubs in the region? What are the prospects of creating an LNG hub in Asia?
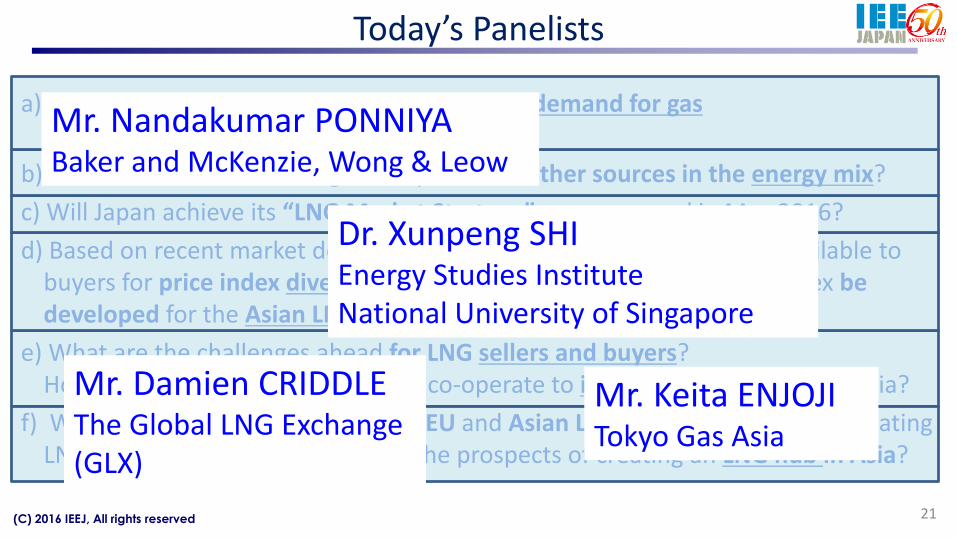
Today’s Panelists
21
Mr. Nandakumar PONNIYA Baker and McKenzie, Wong & Leow
Mr. Damien CRIDDLE The Global LNG Exchange (GLX)
Mr. Keita ENJOJITokyo Gas Asia
Dr. Xunpeng SHIEnergy Studies Institute National University of Singapore
(C) 2016 IEEJ, All rights reserved
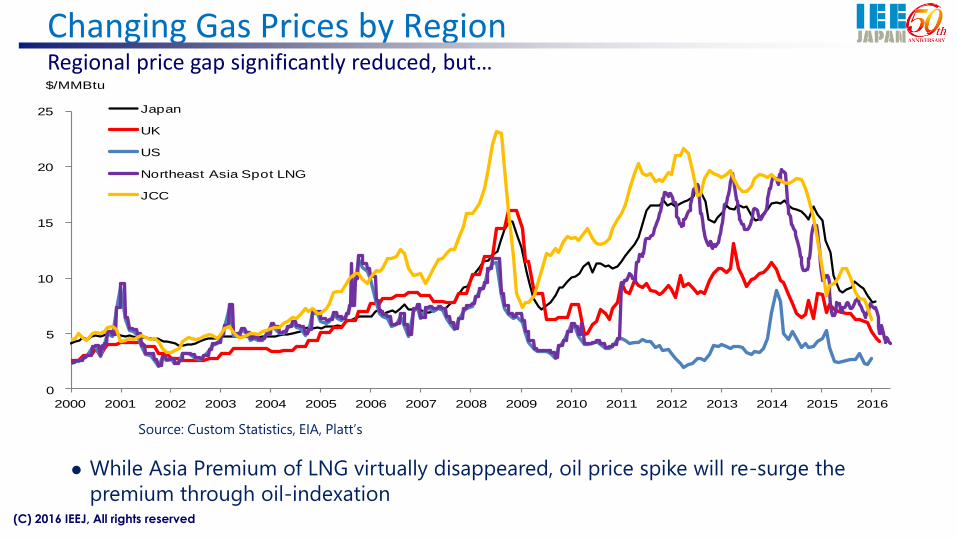
Changing Gas Prices by RegionRegional price gap significantly reduced, but…
0
5
10
15
20
25
2000 2001 2002 2003 2004 2005 2006 2007 2008 2009 2010 2011 2012 2013 2014 2015 2016
Japan
UK
US
Northeast Asia Spot LNG
JCC
$/MMBtu
Source: Custom Statistics, EIA, Platt’s
While Asia Premium of LNG virtually disappeared, oil price spike will re-surge the
premium through oil-indexation
(C) 2016 IEEJ, All rights reserved
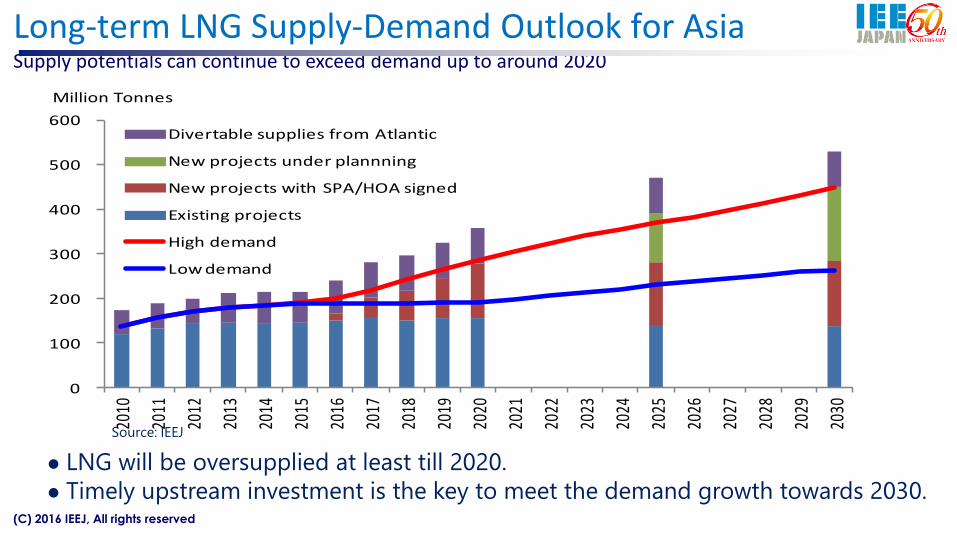
Long-term LNG Supply-Demand Outlook for AsiaSupply potentials can continue to exceed demand up to around 2020
Source: IEEJ
LNG will be oversupplied at least till 2020.
Timely upstream investment is the key to meet the demand growth towards 2030.
0
100
200
300
400
500
600 20
10
2011
2012
2013
2014
2015
2016
2017
2018
2019
2020
2021
2022
2023
2024
2025
2026
2027
2028
2029
2030
Divertable supplies from Atlantic
New projects under plannning
New projects with SPA/HOA signed
Existing projects
High demand
Low demand
Million Tonnes
(C) 2016 IEEJ, All rights reserved
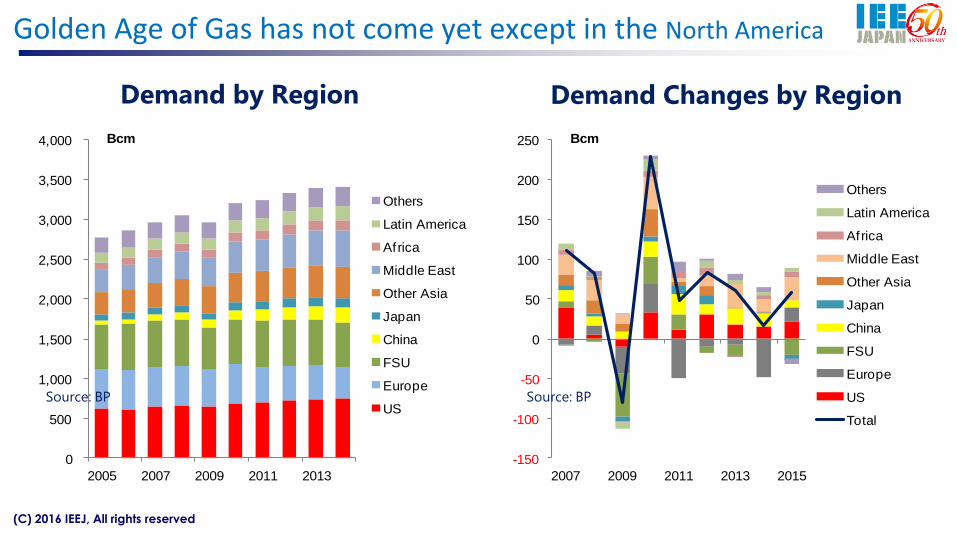
Golden Age of Gas has not come yet except in the North America
Demand by Region Demand Changes by Region
0
500
1,000
1,500
2,000
2,500
3,000
3,500
4,000
2005 2007 2009 2011 2013
Bcm
Others
Latin America
Africa
Middle East
Other Asia
Japan
China
FSU
Europe
US
-150
-100
-50
0
50
100
150
200
250
2007 2009 2011 2013 2015
Bcm
Others
Latin America
Africa
Middle East
Other Asia
Japan
China
FSU
Europe
US
Total
Source: BP Source: BP
(C) 2016 IEEJ, All rights reserved
0
100
200
300
400
500
600
2000
2004
2008
2012
2016
2020
2024
2028
2032
2036
2040
Others
Nuclear
Natural Gas
Oil
Coal
mtoe
0
20
40
60
80
100
120
140
160
2000
2004
2008
2012
2016
2020
2024
2028
2032
2036
2040
Domestic and others
Industry
Power Generation
bcmFukushima
Accident Fukushima
Accident
Nuclear
Restart Nuclear
Restart
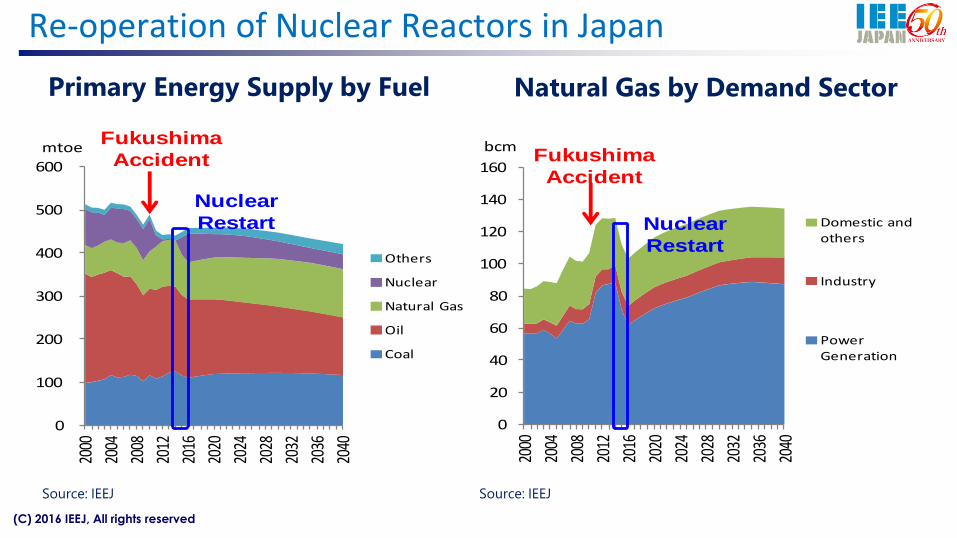
Re-operation of Nuclear Reactors in Japan
Primary Energy Supply by Fuel Natural Gas by Demand Sector
Source: IEEJ Source: IEEJ
(C) 2016 IEEJ, All rights reserved
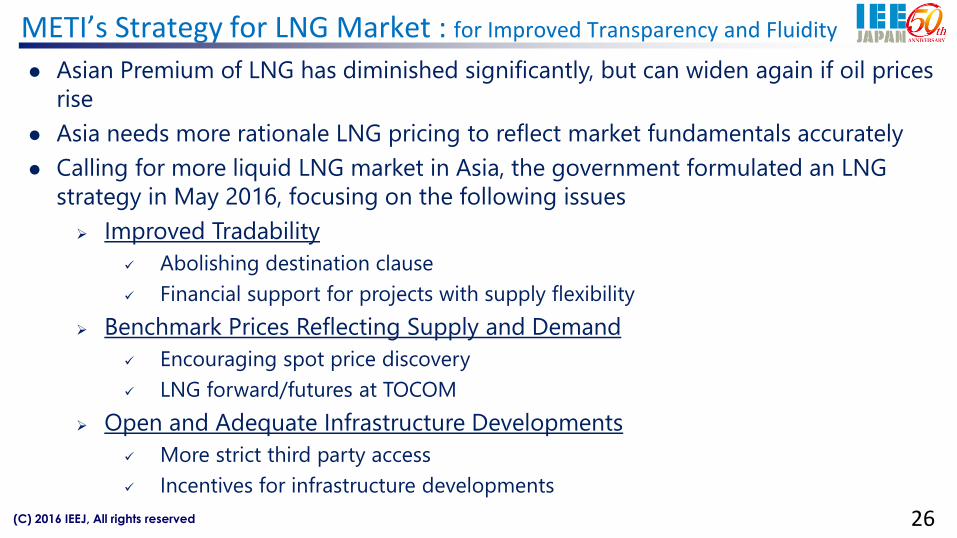
METI’s Strategy for LNG Market : for Improved Transparency and Fluidity
Asian Premium of LNG has diminished significantly, but can widen again if oil prices
rise
Asia needs more rationale LNG pricing to reflect market fundamentals accurately
Calling for more liquid LNG market in Asia, the government formulated an LNG
strategy in May 2016, focusing on the following issues
Improved Tradability
Abolishing destination clause
Financial support for projects with supply flexibility
Benchmark Prices Reflecting Supply and Demand
Encouraging spot price discovery
LNG forward/futures at TOCOM
Open and Adequate Infrastructure Developments
More strict third party access
Incentives for infrastructure developments
26
(C) 2016 IEEJ, All rights reserved
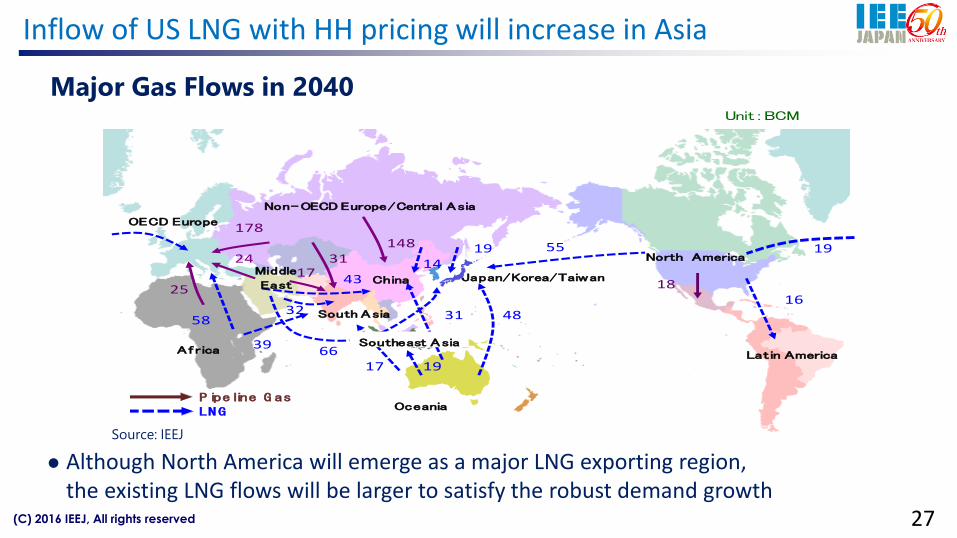
Inflow of US LNG with HH pricing will increase in Asia
19
Unit:BCM
55
31 4832
25
148178
58
19
1731
16
24 1443
66
North America
Latin America
Non-OECD Europe/Central Asia
Japan/Korea/TaiwanChina
Oceania
South Asia
Middle
East
Af rica
OECD Europe
39
18
1917
Southeast Asia
Pipeline G as
LNG
Source: IEEJ
Major Gas Flows in 2040
Although North America will emerge as a major LNG exporting region,the existing LNG flows will be larger to satisfy the robust demand growth
27
(C) 2016 IEEJ, All rights reserved
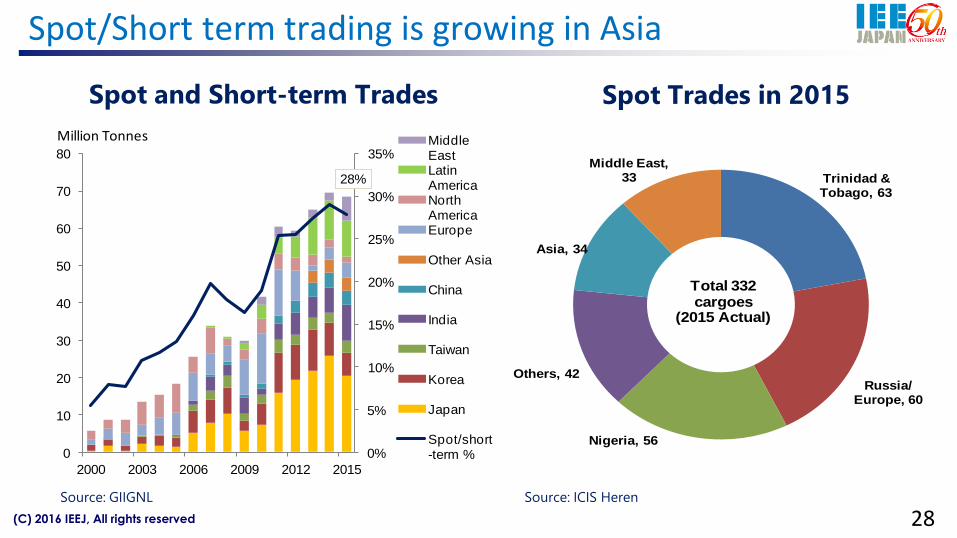
Spot/Short term trading is growing in Asia
Spot and Short-term Trades Spot Trades in 2015
Trinidad & Tobago, 63
Russia/Europe, 60
Nigeria, 56
Others, 42
Asia, 34
Middle East, 33
Total 332 cargoes
(2015 Actual)
28%
0%
5%
10%
15%
20%
25%
30%
35%
0
10
20
30
40
50
60
70
80
2000 2003 2006 2009 2012 2015
Middle EastLatin AmericaNorth AmericaEurope
Other Asia
China
India
Taiwan
Korea
Japan
Spot/short-term %
Million Tonnes
Source: GIIGNL Source: ICIS Heren
28
(C) 2016 IEEJ, All rights reserved
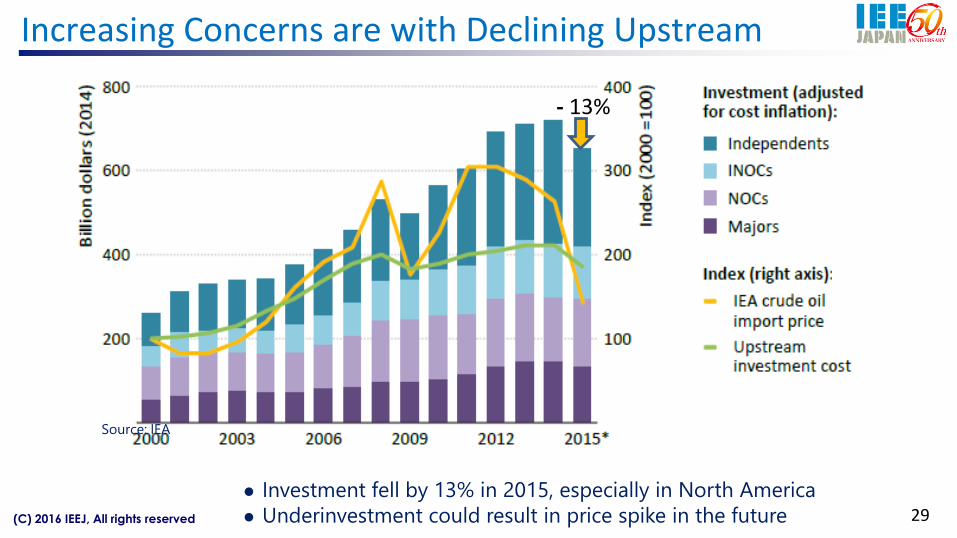
Increasing Concerns are with Declining Upstream
Source: IEA
Investment fell by 13% in 2015, especially in North America
Underinvestment could result in price spike in the future 29
- 13%
(C) 2016 IEEJ, All rights reserved
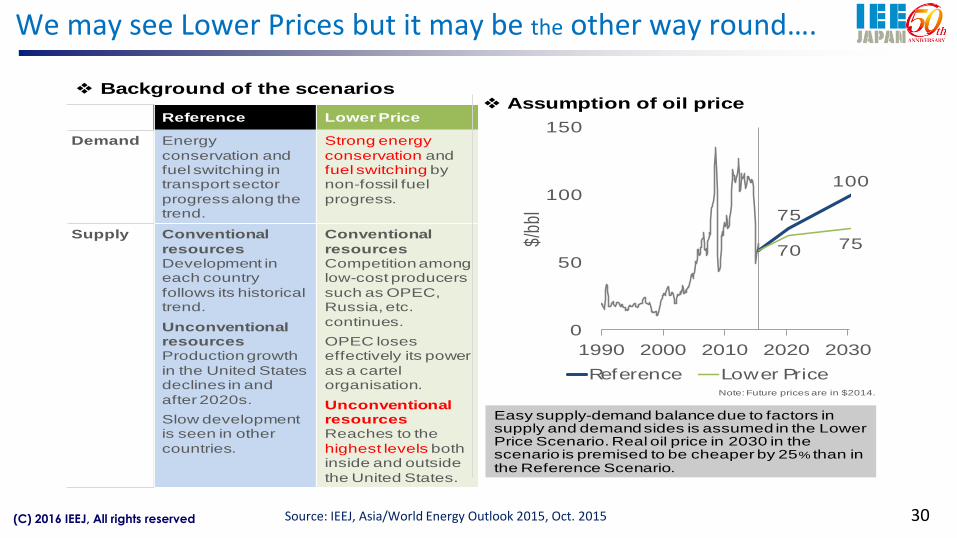
We may see Lower Prices but it may be the other way round….
Easy supply-demand balance due to factors in supply and demand sides is assumed in the Lower Price Scenario. Real oil price in 2030 in the scenario is premised to be cheaper by 25% than in the Reference Scenario.
❖ Background of the scenarios❖Assumption of oil price
Reference Lower Price
Demand Energy
conservation and fuel switching in transport sector
progress along the trend.
Strong energy
conservation and fuel switching by non-fossil fuel
progress.
Supply Conventional
resourcesDevelopment in each country
follows its historical trend.
Unconventional resourcesProduction growth
in the United States declines in and
after 2020s.
Slow development is seen in other
countries.
Conventional
resourcesCompetition among low-cost producers
such as OPEC, Russia, etc.
continues.
OPEC loses effectively its power
as a cartel organisation.
Unconventional resourcesReaches to the
highest levels both inside and outside
the United States.
Note: Future prices are in $2014.
75
100
70 75
0
50
100
150
1990 2000 2010 2020 2030
$/bb
l
Reference Lower Price
Source: IEEJ, Asia/World Energy Outlook 2015, Oct. 2015 30
(C) 2016 IEEJ, All rights reserved
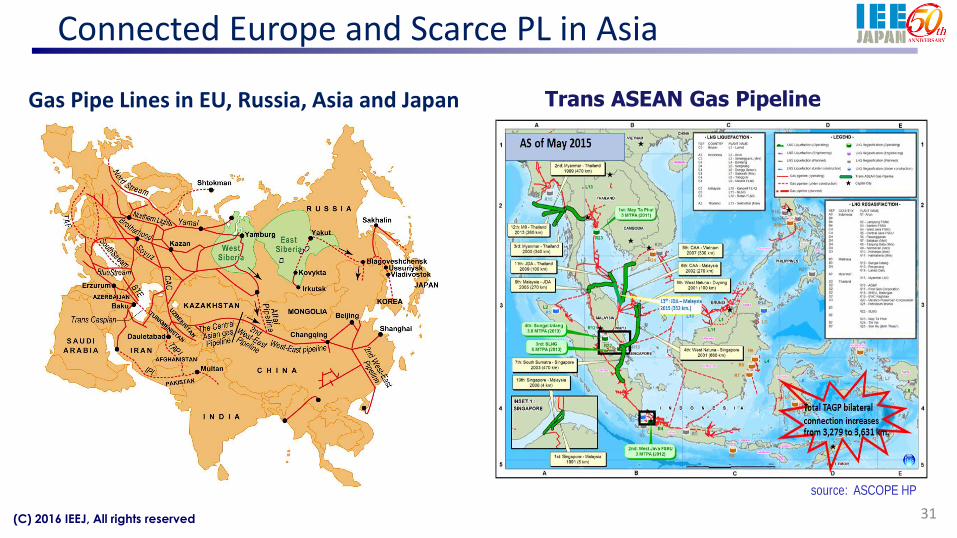
Connected Europe and Scarce PL in Asia
31
source: ASCOPE HP
Gas Pipe Lines in EU, Russia, Asia and Japan Trans ASEAN Gas Pipeline