outlines - rutgers
TRANSCRIPT

Rutgers CS334
1
CS334: Digital Imaging and Multimedia
Image Histograms
Ahmed Elgammal Dept. of Computer Science
Rutgers University
Image Histograms Histograms are used to depict image statistics in an easily interpreted
visual format Useful during image capturing: now already in digital cameras Used to improve the visual appearance of an image Can also be used to determine what type of processing has been
applied to an image.

Rutgers CS334
2
Image histogram: describes the frequency of the intensity values that occur in an image
Rutgers CS334
3
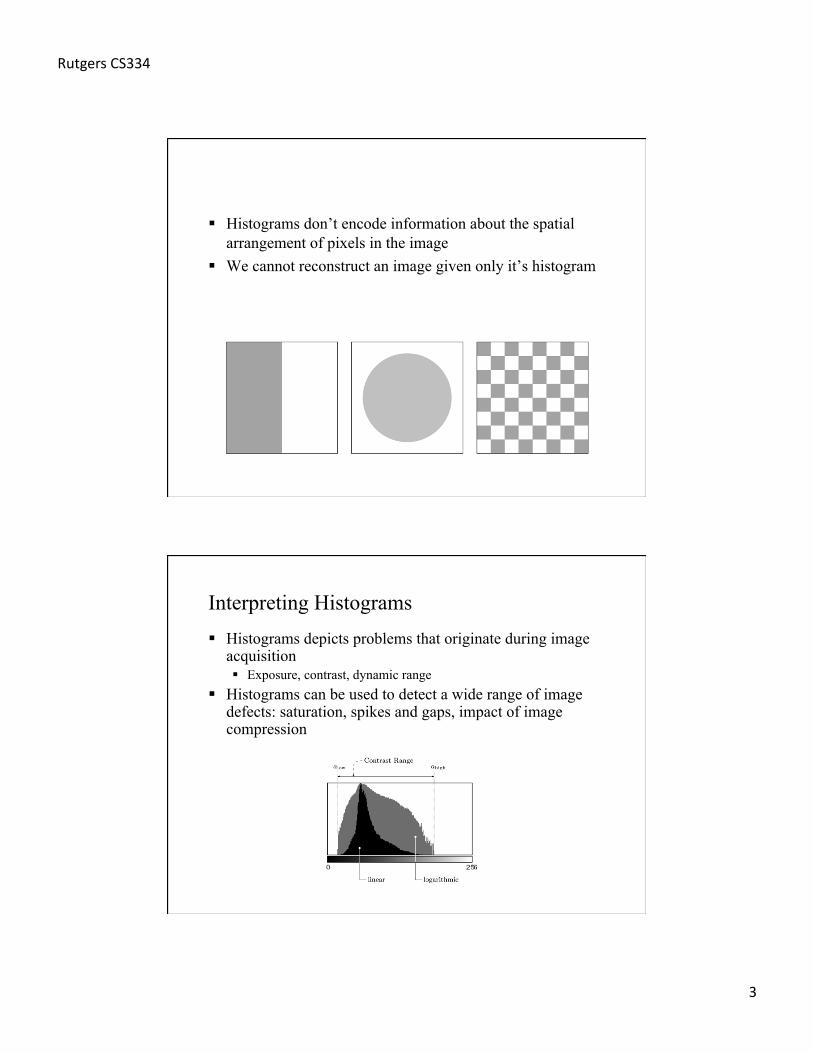
Histograms don’t encode information about the spatial arrangement of pixels in the image
We cannot reconstruct an image given only it’s histogram
Interpreting Histograms Histograms depicts problems that originate during image
acquisition Exposure, contrast, dynamic range
Histograms can be used to detect a wide range of image defects: saturation, spikes and gaps, impact of image compression

Rutgers CS334
4
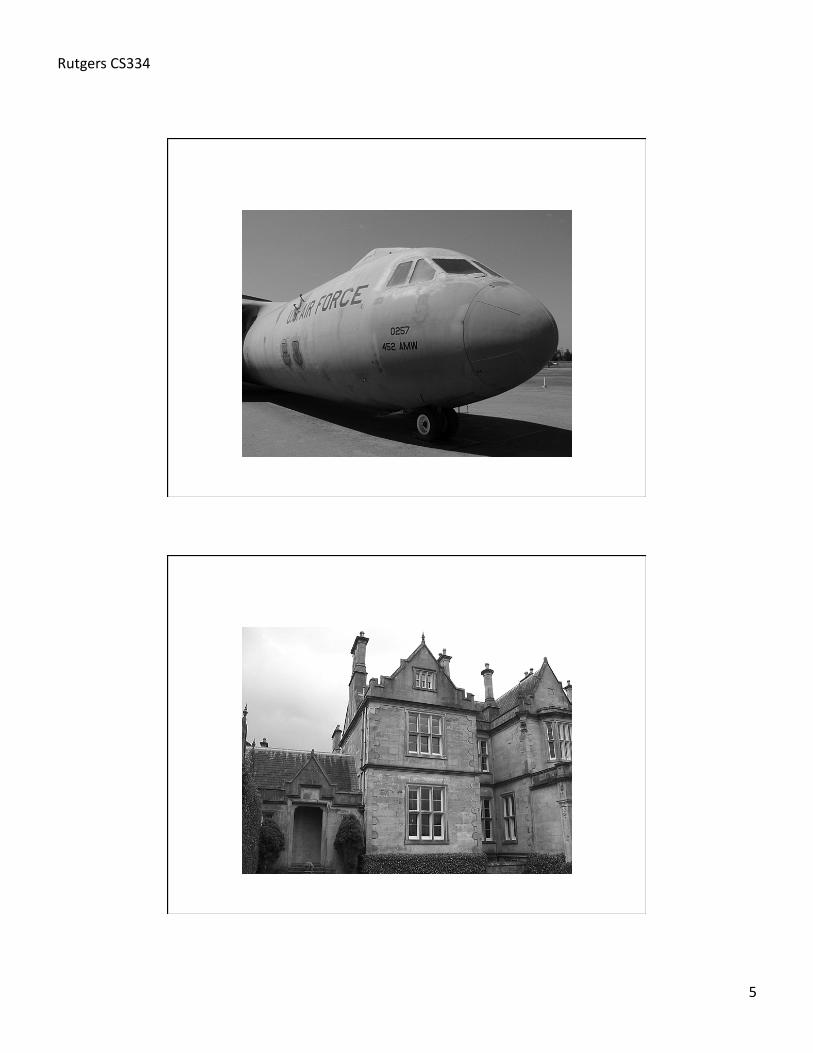
Histograms and Exposure
Rutgers CS334
5

Rutgers CS334
6
Histogram and Contrast
Contrast: the range of intensity values effectively used within an image, low contrast, normal contrast, high contrast
Dynamic Range
Dynamic Range: the number of distinct pixel value in an image

Rutgers CS334
7
Detecting Image Defects There is no ideal or optimal histogram shape. It depends on the image
and on the application Image Defects:
Saturation: the illumination values lying outside of the sensor’s range are mapped to its maximum or minimum values: spike at the tails
Spikes and Gaps in manipulated images. Why? Impact of image compression
Histograms show the impacts of image compression
Ex: in GIF compression, the dynamic range is reduced to only few intensities (quantization)
Rutgers CS334
8
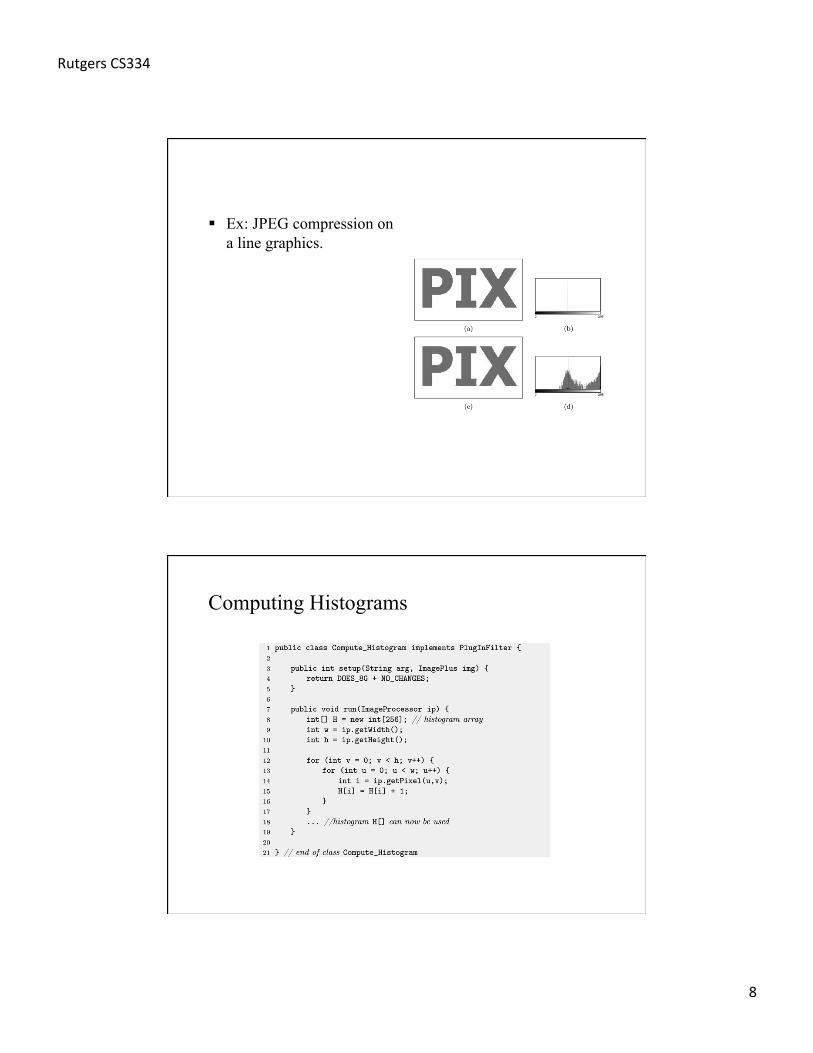
Ex: JPEG compression on a line graphics.
Computing Histograms

Rutgers CS334
9
Histograms of images with more than 8 bits: Binning
B: number of bins
Ex: B=256 for 14 bit image
K=16384, bin width = 64
Color Image Histograms

Rutgers CS334
10
Color Image Histograms
For color images, two kind of histograms: Intensity histogram Individual Color Channel Histograms
Both provides useful information about lighting, contrast, dynamic range and saturation effects for individual color components
They provide no information about the actual color distribution!
Cumulative Histograms