outeniqua - agriculture · outeniqua. navorsingsplaas research farm. 2016. ... het die afgelope...
TRANSCRIPT

1
OUTENIQUANavorsingsplaas
Research Farm
2016Inligtingsdag|Information day
Milk production from planted pastures Melkproduksie vanaf aangeplante weidings

2
Designed by: Western Cape Department of AgricultureResearch Technology Development Services

3
Contents
Information day Programme 1
Voorwoord 2
Presenters 3
Maize silage: What can still improve?R. Meeske 5
Variety choices and Elite Evaluation TrialsSigrun Ammann 8
The evaluation of annual ryegrass varieties in the southern Cape: 2014 to 2015J van der Colf 15
Pasture dry matter yield of perennial ryegrass and ryegrass hybrids in the southern CapeJanke van der Colf, Sigrun B Ammann, Lethukuthula B. Zulu, Maria M. Lombard 21
The production potential and botanical composition of kikuyu over-sown with temperate grass/legume mixtures using different planting methodsJ van der Colf 28
What do we know about forage chicory (Cichorium intybus) and plantain (Plantago lanceolata)?Sigrun Ammann 43
Is carbon tax a reality for dairy farmers?Josef van Wyngaard, Robin Meeske and Lourens Erasmus 47
How to reduce on-farm enteric methane productionJosef van Wyngaard and Robin Meeske 52
The effect of substituting maize grain with apple pomace in a concentrate on the production of Jersey cows grazing kikuyu-ryegrass pasture in summerL. Steyn, R. Meeske & C.W. Cruywagen 59
Essential oil as feed-additive for Jersey cows grazing ryegrass pastureZanmari Moller1 Prof Robin Meeske & Prof C.W. Cruywagen 64
Contents

1For more information contact Hennie Gerber or Machelle Zeelie at 044 8033723/7
INFORMATION DAY: OUTENIQUA RESEARCH FARM
MILK PRODUCTION FROM PLANTED PASTURE
Programme Director: Dr Ilse Trautmann (Chief Director: Research and Technology Development Services)
08:00-08:50 Registration and viewing of exhibits
08:50-09:00 Scripture reading and prayer
09:00-09:05 Welcoming: Dr Ilse Trautmann
09:05-09:20 Maize silage: What can still improve? Robin Meeske
09:20-09:40 Variety choices and Elite Evaluation trials Sigrun Ammann
09:40-10:00 The production potential of annual and perennial temperate grass varieties
Janke van der Colf
10:00-10:15 Kikuyu over-sown with temperate grasses and legumes: basic principles and production
Janke van der Colf
10:15-10:30 What do we know about forage chicory (Cichorium intybus) and plantain (Plantago lanceolata)?
Sigrun Ammann
10:30–11:00 Tea
11:00-11:15 Is carbon tax a reality for dairy farmers? Josef van Wyngaard
11:15-11:30 How to reduce on farm enteric methane production Josef van Wyngaard
11:30-11:45 Replacing maize grain with dried apple pomace Lobke Steyn
11:45-12:00 Essential oil as feed-additive for Jersey cows grazing ryegrass pasture
Zanmari Moller
12:00-12:10 Concluding remarks : Nelius van Greunen
12:10-13:00 Visit Research Projects: Cultivar evaluation, Nitrogen application studies, Methane measurement and mitigation, Apple pomace study.
13:00 Lunch
Wednesday, 19 October 2016Presented by Directorates of Plant and Animal Sciences,
Western Cape Department of Agriculture, Outeniqua Research Farm, George

2
VOORWOORD
Die landbousektor en sy mense, hetsy insetverskaffers, boere, plaaswerkers en ander rolspelers in die landbou-waardeketting, het die afgelope jaar onder verskeie uitdagings gebuk gegaan waaronder die droogte, verhoogde insetpryse, laer inkomste, wisselkoers skommelinge, en dan ook die moontlike afgradering van SA se kredietgradering.
Teen hierdie agtergrond het die woorde “beter, vinniger en slimmer” bly opkom, gepaardgaande met die soeke na meer effektiewe tegnologie en inligting om verhoogde produksie te verseker. In hierdie opsig is die Wes-Kaapse Departement van Landbou meer as ooit voorheen oortuig dat sy voorpunt navorsing, goeie navorsingsinfrastruktuur, verhoogde navorsingsuitsette en die toegewyde bediening van ons sektor met voorpunt-tegnologie en inligting onderhou en ook uitgebrei moet word.
Die Outeniqua inligtingsdag is een van ons vlagskip tegnologie-oordrag geleenthede en ons spesialis navorsers, navorsers en jong wetenskaplikes poog jaarliks om die nuutste en mees toepaslike navorsingsresultate met ons boere en ander rolspelers in die Suid-Kaap te deel in ‘n poging om ons boere te verseker van hulle wenplek in die internasionale en nasionale markplek en volhoubaarheid op plaasvlak.
Ons weiding- en suiwelnavorsingspan is van die bestes in die land en dit is daarom vir ons ‘n besonderse eer en trots om hierdie span met sy wye kundigheid aan die suiwelbedryf in die Suid-Kaap te bied om saam as vennote bedryfsprobleme aan te spreek en volhoubare oplossings te soek. Ons nuwe generasie navorsers en navorsingstegnici word ook op Outeniqua opgelei om seker te maak dat die navorsingsprogramme met die nodige kundigheid voortgesit kan word.
Ons wil die hoop uitspreek dat ons Outeniqua, en ook ons ander navorsingspanne, deel van u suksesvolle boerdery sal wees om saam met u ‘n volhoubare toekoms te verseker.
Dr. Ilse Trautmann
HOOFDIREKTEUR: NAVORSING EN TEGNOLOGIE ONTWIKKELINGSDIENSTE, DEPARTEMENT LANDBOU WES-KAAP

3
Dr. Ilse TrautmannChief Director: Research and Technology Development ServicesDepartment of AgricultureWestern Cape [email protected]
Contact details
Prof. Robin MeeskeSpecialist Scientist: Animal ScienceDirectorate: Animal SciencesDepartment of AgricultureWestern Cape GovernmentTel: 044-803 3708, Cell no: 082 908 [email protected]
Ms. Sigrun AmmannScientist: Pastures Directorate Plant SciencesDepartment of AgricultureWestern Cape GovernmentTel: 044-803 3726; Cell no 082 775 [email protected]
Ms. Janke van der ColfScientist: Pastures SystemsDirectorate Plant SciencesDepartment of AgricultureWestern Cape GovernmentTel: 044-803 3716; Cell no: 082 774 [email protected]

4
Ms. Zanmari MöllerTrader / Animal NutritionistAlphaAlfaTel 053 861 3697, Cell no: 072 767 6018 [email protected] Agric, University of Stellenbosch
Ms. Lobke SteynPhD Student Researcher, University of StellenboschDirectorate: Animal SciencesDepartment of AgricultureWestern Cape Government Tel: 044-803 [email protected]
Mr. Josef van WyngaardPhd Student Researcher, University of PretoriaDirectorate: Animal SciencesDepartment of AgricultureWestern Cape Government Cell no: 082 336 [email protected]

5
Maize silage: What can still improve?R. Meeske
Western Cape Department of Agriculture, Outeniqua Research Farm, P.O. Box 249, George, 6530.
Introduction
Maize silage is used on many dairy farms in the Southern and Eastern Cape as
supplement to overcome pasture shortages during winter. The dry matter production of whole crop maize under irrigation can be as high as 20 to 30 ton DM/ha over a period of 4 months. This is substantially higher than the 15 to 18 ton DM/ha/year produced from kikuyu/ryegrass pasture under irrigation. Whole crop maize is easy to ensile as it has low protein content (7-9%) and high levels of sugar or water soluble carbohydrates (WSC 10-12% on a DM basis). The sugars are utilized by lactic acid bacteria to produce lactic acid. This lowers the pH rapidly to 4 within 2 days and the silage is preserved. Well preserved silage can be stored for many years if the bunker is well sealed and oxygen and/or water do not enter the silo. Whole crop maize should be ensiled at the ½ to ¾ milk stage or when the dry matter content is 35%. The chop length should be 8-12mm and all maize kernels should be broken.
Maize silage should be compacted at 750 kg/m3 to limit air penetration. The silage bunker should be covered and sealed well with plastic to keep air and water out. When maize silage is exposed to air, it often is unstable and gets hot. This rise in temperature is caused by growth of yeast and mould that utilise lactic acid and sugars under aerobic conditions. Maize silage may heat rapidly when exposed to air as it contains high levels of lactic acid and residual sugars. The basics of ensiling are well known to farmers and silage contractors and maize is not difficult to ensile. The question is, how well is maize silage preserved on farms and what improvements can be made. During 2015 the Santam/Veeplaas silage competition 45 maize silage bunkers were sampled and evaluated. The aim of this paper is to present results of the silage competition and to highlight possible improvements.

6
Silage evaluation
Maize silage was collected from 45 silage bunkers in different areas of South Africa. At each bunker material was sampled by taking three core samples with a 110 mm silage corer in the middle of the bunker, spaced 1 m apart. Each core sample was taken at three depths: 0-10 cm, 10-20 cm and 20-40 cm (Three core samples at 3 depths=9 samples). Compaction of the different layers was determined using the weight and volume of each core sample. The three core samples were pooled for each depth and a representative sample was taken, sealed in a plastic bag, kept cool and later frozen pending analysis. The dry matter (DM), pH and ash content of all silage samples were determined. A representative sample of 300 g
from the 20-40 cm pooled sample was loosely placed in a 2 litre plastic container with several holes on its sides to determine aerobic stability. This silage sample was exposed to air for 5 days and then frozen. Thereafter the DM, pH and ash content was determined to estimate organic matter (OM) losses. The DM, pH, ash, total digestible nutrients (TDN), crude protein (CP), starch, neutral detergent fibre (NDF), lactic acid, acetic acid, propionic acid and butyric acid of each pooled silage sample taken at 20-40 cm in the bunker was determined. The chop length of silage was recorded by measuring particle length of 10 chopped maize stems using a ruler.
Results and Discussion
The average, minimum and maximum values of the composition, compaction, aerobic stability and organic matter losses are presented in Table 1
Table 1. Composition (on DM basis), chop length, compaction, organic matter losses and aerobic stability of maize silage (n=45) as sampled during the 2015 Santam/Veeplaas silage competition.
*STD = Standard deviation; **OM = Organic matter
Parameter Average STD* Minimum Maximum
DM% 32.2 4.8 21.8 46.3 Total digestible nutrients (TDN) % 69.3 6.1 36.3 75.6 Crude protein % 9.3 1.6 7.1 14.6 Neutral detergent fibre (NDF) % 44.0 5.5 35 66 Starch % 24.1 7.7 3.5 36.1 Ash % 6.2 4.0 3.9 29.8 Ca% 0.26 0.11 0.10 0.50 P% 0.23 0.04 0.17 0.38 Mg% 0.18 0.05 0.12 0.37 S% 0.13 0.02 0.11 0.20 Lactic acid% 4.92 1.68 2.10 9.60 Acetic acid % 3.86 1.80 0.93 8.15 Propionic acid % 0.27 0.17 0.05 0.84 Butyric acid% 0.02 0.13 0 0.90 pH in 0-10 cm layer 4.51 1.09 3.67 8.33 pH in 10-20 cm layer 3.96 0.22 3.66 4.74 pH in 20-40 cm layer 3.85 0.21 3.55 4.77 pH after 5 days aerobic exposure 5.58 1.41 3.55 8.48 Compaction kg/m3 of 0-10 cm layer 433 121 238 703 Compaction kg/m3 of 10-20 cm layer 705 132 444 1015 Compaction kg/m3 of 20-40 cm layer 726 106 408 933 OM**loss in 0-10cm layer % 14.5 21.4 0 90.4 OM loss in 10-20cm layer % 9.6 15.1 0 68.0 OM loss after 5 days aerobic exposure % 12.6 11.4 0 58.3 Chop length mm 9.7 2.3 5.3 15.0

7
The compaction of maize silage was slightly below 750 kg/m3 but compaction in some bunkers was as low as 408kg/m3. This will increase the risk of air penetration, growth of yeast and mould and spoilage of silage. Compaction of the top layer (0-10cm)in the bunker is of great concern as it was as low as 238kg/m3 while the best compaction was 703kg/m3. Poor compaction in the top layer coincided with high organic matter losses and a high pH. The average OM loss in the top 10 cm layer was 14.5% while the highest organic matter loss was 90.4%. The best maize silage bunker had no OM losses in the top 10cm of the bunker. Farmers must ensure that the top layer of the bunker is also well compacted to prevent substantial losses. Proper sealing of the bunker and ensuring that plastic is weighed down is crucial to prevent air penetration in the bunker.
The aerobic stability of maize silage can still be improved. The average OM loss in silages exposed to air for five days was 12.6%. The most stable maize silage had no organic matter loss after 5 days of aerobic exposure, while 58.3% of organic matter was lost in the least stable silage. The average pH of silage increased from 3.85 before aerobic exposure to 5.58 after 5 days of
exposure to air. The pH of the most stable silage did not increase while pH of the least stable silage increased to 8.48.
Maize silage was chopped according to the recommended 8-12mm on most farms but the chop length was too short on some farms. This reduces the effective fibre content of the maize silage and may result in acidosis, lower milk fat content and reduced milk production when a high percentage of the cow’s diet consists of maize silage.
Conclusions
Maize silage can still be improved by ensiling at 35% DM, increasing compaction especially of the top layer and better sealing of the bunker. The aerobic stability of maize silage is a major challenge on many farms and can still be improved.
The average DM content of maize silage was within the optimal range of 30-35% but the minimum DM was very low at 21.8%. Ensiling whole crop maize at a DM below 25% will result in 10-15% reduction in potential DM yield, less grain, reduced starch content, higher NDF and crude protein content, lower energy value and less palatable silage. Effluent will seep out of the bunker increasing OM losses with 5-10%. The average energy value of maize silage was high at 69.3 % TDN as was expected. The starch content of some maize silage was low indicating limited grain filling. The ash content of maize silage should not be above 8-10%. Higher levels of ash indicate substantial loss of organic matter. Well preserved maize silage should have a pH of 4 or lower and contain no butyric acid. Acetic acid will inhibit growth of yeast and mould but high levels (>4%) may reduce palatability of silage.
Maize silage with a dry matter content below 25% results in a 10-15% reduction in yield per hectare.

8
Variety choices and Elite Evaluation TrialsSigrun Ammann
Western Cape Department of Agriculture, Outeniqua Research Farm, P.O. Box 249, George, 6530.
Most pasture species consist from many varieties that have been bred in different locations around the world and have specific traits that define the yielding capacity, flowering behaviour and various other characteristics that varieties are bred for. The pasture genus
that has received by far the most plant breeding efforts worldwide is Lolium (Ryegrass). In South Africa there are thus also many different varieties available on the market. The SA Variety List of June 2015 lists 75 Lolium multiflorum (Westerwolds and Italian), 27 L. perenne (Perennial ryegrass) and nine L. x hybridum (Hybrid ryegrass) varieties (DAFF 2015). This is a vast number of varieties for farmers to choose from. Even for species such as Festuca arundinacea (Tall Fescue) and Dactylis glomerata (Cocksfoot) there are an increasing number of varieties available.
Types as a function of flowering behaviour
Taking ryegrass as an example, it is important to understand the different types that this genus consists of. Ryegrass is considered a continuum from very early flowering Westerwolds varieties on the one end through to very late flowering perennial ryegrass at the other extreme. The diagram below gives a schematic representation of the various types of ryegrass forming the continuum of the genus Lolium.
Figure 1: Lolium types as a function of flowering behaviour

9
Flowering behaviour and vegetative tillering ability after flowering determine the duration or persistence of a variety. Westerwolds ryegrass varieties are true annuals, have no induction requirements for flowering and do not produce vegetative tillers after flowering meaning their growth duration ends at flowering. Very early flowering annual ryegrass will thus only last approximately six months, while facultative Italian ryegrass varieties which will have varying extents of induction requirements and last eight to 10 months depending on the variety. Long duration Italian ryegrass varieties tend to be obligate in terms of cold requirements for flowering and can last at least 12 to 13 months but may last longer depending on climate and grazing management. Hybrid ryegrass is a cross between Italian and perennial ryegrass backcrossed either to Italian or to perennial which will determine the growth behaviour and persistence, as well as the appearance.
Perennial ryegrass has obligatory and large induction requirements meaning it requires the most number of cold days of all the different ryegrass types but it also depends to some extent on the origin i.e. the latitude (Aamlid et al. 2000). In ryegrass vernalization is generally considered to take place below 6°C although it varies slightly depending again on the origin of the variety (Cooper 1960, Heide 1994, Aamlid et al 2000). The implications of different flowering behaviour is not only the differences in persistence or growth duration but for perennial ryegrass it also means that there may be years where the induction requirements are not met and no or very limited flowering will take place. This has advantages in terms of forage quality since flowering is linked to increased fibre content and decreased forage quality (Lowe et al 1999, Sinclair et al 2006). This can be the case in areas where winter temperatures are mild and have few frost-days.
Flowering behaviour also affects seasonal yield distribution as the reproductive stage is normally associated with higher herbage production.
Species such as tall fescue also consist of different types and varieties within those types e.g. Continental tall fescue varieties are summer active while the Mediterranean types are winter active and have very different production patterns.
Ploidy in ryegrass
In addition to flowering behaviour and persistence differences, there are also ploidy differences with varieties being either diploid or tetraploid.Table 1: Differences between diploid and tetraploid ryegrass
Diploid Chromosome number: 14
Tetraploid Chromosome number: 28
Narrow leaves Wide leaves, darker green colour Higher Lower
Higher moisture content (lower DM content) Thousand Seed Weight (TSW): approx. 2g TSW: approx. 4g – higher sowing rate required More easily overgrazed
High sugar and high dry matter ryegrass
There are varieties that have been bred for a higher water soluble carbohydrate (WSC) content to improve the WSC:CP ratio. There are also varieties that have additionally been bred for a higher dry matter content i.e. to contain less water and positively affect intake.

10
Impacts of pasture plant breeding: the use of modern varieties
The varieties available on the market range from “old” to very modern or recent releases, and from cheap to expensive. These are choices farmers have to take into account when purchasing varieties for their pastures. For this purpose it is interesting to look at results of the “best” versus the “worst” varieties in terms of dry matter yield. The same can be considered for disease susceptibility.
Table 2: Dry matter yield differences between best and worst performing variety in trials at ARC-Cedara to illustrate the impact of variety choice.
The results from table 2 above give an indication of the differences in genetic potential that exists between varieties for DM yield. It also shows that it is not only about old versus new varieties but also about new varieties that are poorly adapted to our climate being mainly temperature. The inputs required for a ryegrass pasture such as establishment costs, fertilizer, irrigation, etc are the same irrespective of variety. Higher producing varieties will thus have an improved nitrogen use efficiency and water use efficiency, producing more forage with the same inputs.
Examples
Italian ryegrass (6 years data) based on genetic potential of the varieties
Cost of N per kg dry matter (c/kg DM) Best variety 42 c/kg DM Worst variety 58 c/kg DM 38% more expensive
Perennial ryegrass (average of 4 years data of the first year of production) Dry matter yield (t/DM ha) Best variety 16.5 t/DM ha 3.4 t/DM ha more = 340 t on a 100ha pasture Worst variety 13 t/DM ha
Year of the trial Best – Worst (t DM ha-1)
Comments
1998/99 3.3 New vs very old variety 2000/01 2.5 New vs an old variety 2001-03 (34 months) 7.7 New vs very old variety 2002-04 (30 months) 11.0 New vs new poorly adapted 2003 (1st year) 5.5 New vs new poorly adapted 2005 (1st year) 3.9 New vs new poorly adapted 2008 (1st year) 5.0 New vs new poorly adapted 2008-09 (2nd year) 7.1 New vs new poorly adapted 2008-10 (3rd year) 8.5 New vs new poorly adapted 2010 (1st year) 3.9 New vs n ew poorly adapted o n shallow medium
2012 (1st year) 5.1 New vs n ew poorly adapted

11
Pasture plant breeding has made much progress in the last 30 years. Varieties are not only bred for dry matter yield but also for other traits that can improve productivity of both the plant and the animal. Examples of other traits varieties are bred for:
• Forage quality e.g. sugar content, dry matter content, digestibility, NDF content (improved animal performance)• Disease resistance (leaf diseases affect forage quality and yield)• Flowering characteristics (affects forage quality and growth duration/persistence)• Superior root system• Seed yield (economic delivery of varieties to the market)• Water use efficiency (WUE) ( also through increased yield per unit of water)• Nitrogen use efficiency (NUE) (also through increased yield per unit of nitrogen)
Below is an example of results from the ARC Cedara breeding programme showing the yield improvements as a result of breeding over time starting in 1975 with var. Midmar through to 2012 (Ammann et al 2015). The graph below is for total yield but a large focus is also on seasonal yield such winter growth activity or summer growth where there has also been significant improvement. Likewise there have been improvements for forage quality (WSC, DM content etc.) and disease resistance (crown rust).
Figure 2: Lolium multiflorum breeding programme at ARC Cedara showing mean total herbage dry matter yield in relation to year of release (Ammann et al 2015)
Adaptation to the local environment and climate
This is very relevant for perennial ryegrass for which the optimum temperature range for growth is 18 to 20ºC. Some varieties can tolerate slightly higher temperatures depending on origin. Generally above 28ºC photosynthetic activity is negatively affected and constrained. Night temperatures above 18ºC have been shown to be very detrimental to sugar reserves in the plant (Donaghy and Fulkerson 1998). Slack et al (2000) showed that the difference in yield between a day/night temperature of 18/13ºC and 24/19ºC was a yield loss of 44%.

12
This shows the impact temperature has on productivity. The graphs below show a selection of summer temperatures at Outeniqua Research Farm for recent years (ARC Agromet). If the upper limit for minimum temperature is taken as 18ºC beyond which there is an exponential loss of carbohydrate reserves (Slack et al 2000), then it is clear that there are extended periods where the minimum temperatures are limiting to growth of perennial ryegrass. In 2010/11 there was a period of 5 weeks where the minimum temperature was mostly above 18ºC. In the most recent summer of 2015/16 there were also extensive periods where the minimum temperature was above optimum. The maximum temperature also reached levels above the desirable range but on fewer occasions than the minimum temperature and for a shorter duration.
Figure 3: Minimum and maximum temperature for Outeniqua Research Farm from Nov 2010 to Mar 2011 showing the minimum and maximum temperature limits for perennial ryegrass. (ARC Agromet)
Figure 4: Minimum and maximum temperature for Outeniqua Research Farm from Nov 2014 to Mar 2015 showing the minimum and maximum temperature limits for perennial ryegrass. (ARC Agromet)

13
Figure 5: Minimum and maximum temperature for Outeniqua Research Farm from Nov 2015 to Mar 2016 showing the minimum and maximum temperature limits for perennial ryegrass. (ARC Agromet)
These temperature data show that an important constraint to perennial ryegrass production at Outeniqua could well be the high minimum temperatures experienced for extended periods during the summer months which reduce the carbohydrate reserves and limit production and persistence.
The extent to which perennial ryegrass varieties are affected will depend on the variety and its origin and breeding and the specific climatic conditions of each year. It is thus important to test varieties under local conditions over a number of years and base the choice of variety on local data.
Elite Evaluation trials
The Elite Evaluation trials will be an important tool for data of various traits for the modern varieties, evaluating yield, disease resistance, flowering behaviour, persistence and forage quality. These data will assist in choosing varieties adapted to southern hemisphere climatic conditions and more specifically the southern Cape. The characterization of additional traits over and above yield will in future also assist in choosing varieties for pasture mixtures based on complementarity and avoiding competition as far as possible in mixed swards or optimizing forage quality in mixed swards.

14
References
Aamlid TS, Heide OM and Bielt B. 2000. Primary and secondary induction requirements for flowering of contrasting European varieties of Lolium perenne. Annals of Botany 86: 1087 - 1095
Ammann SB, Smith A, Goodenough DCW. 2015. Pasture plant breeding in South Africa: Lessons from the past and future needs. Grassland Society of Southern Africa Congress 50, Pietermaritzburg July 2015.
ARC-ISCW Agrometeorology, Arcadia, Pretoria, [email protected]
Cooper JP. 1960. Short-day and low-temperature induction in Lolium. Annals of Botany 24: 232 – 246
Donaghy DJ and Fulkerson WJ. 1998. Priority for allocation of water-soluble carbohydrate reserves during regrowth of Lolium perenne. Grass and Forage Science, 53, 211 – 218
Heide OM. 1994. Control of flowering and reproduction in temperate grasses. New Phytologist 128: 347 – 362
Slack K, Fulkerson WJ and Scott JM. 2000. Regrowth of prairie grass (Bromus willdenowii Kunth) and perennial ryegrass (Lolium perenne L.) in response to temperature and defoliation. Crop and Pasture Science 51:555 - 561

15
The evaluation of annual ryegrass varieties in the southern Cape: 2014 to 2015
J van der ColfWestern Cape Department of Agriculture, Outeniqua Research Farm, P.O. Box 249,
George, 6530.
Introduction
Pasture based dairy production in the southern Cape is often based on perennial pasture species such as kikuyu (Pennisetum clandestinum), perennial ryegrass (Lolium perenne) or lucerne (Medicago sativa). One of the main challenges when these species make up the
primary pasture base within a pasture system, is the mutually low growth rates during winter. In order to bridge pasture shortages during the critical winter months, producers establish annual Italian (Lolium multiflorum var. italicum) and Westerwolds ryegrass (L. multiflorum var. westerwoldicum) either as pure swards, mixtures or over-sown it into perennial pastures. The production potential and seasonal growth of annual ryegrass varieties is affected by climate and may not follow the same pattern of production as in other regions. The large number of annual ryegrass varieties commercially available necessitates continuous evaluation to assist producers in selecting the most suitable variety based on dry matter (DM) production and the specific requirements within a fodder flow program. The aim of this study was to determine the monthly growth rate and total annual DM production of commercially available L. multiflorum varieties.
Materials and methods
This paper will discuss the results from two studies conducted during 2014 and 2015. Both studies were carried out according to the same protocol, although not all varieties were included in both studies. The studies were carried out on the Outeniqua Research Farm near George in the Western Cape in the form of small plot cutting trials under irrigation. Tetraploid varieties were sown at a 20 kg/ha and diploids at 20 kg/ha into cultivated soil during March 2014 and March 2015. Dry matter yield (kg DM/ha) was determined by harvesting plots to a height of 50 mm at an approximate interval of 28 days or when the growing points of grasses where being over-shadowed. Treatments were terminated when they failed to recover after a harvest. Plots received 50 kg N ha-1 after each harvest.
Results and discussion
Year 2014
The monthly growth rate of annual ryegrass varieties evaluated during 2014 is shown in Table 1. The mean monthly growth rate varied between 8 and 44 kg DM/ha/day and was affected by month and variety. The Westerwolds ryegrass variety Fantastic maintained a growth rate that was highest or similar to the highest from May to September. This variety is thus ideally suited to pasture systems that require a strict annual characterised by high winter production. From September to December the Italian ryegrass varieties Elvis, Barmultra, Udine and Sukari, as well as the Intermediate ryegrass Super T maintained a growth rate that was highest or similar to the highest. These varieties thus display the potential to remain productive into the spring and early summer and would be suited where an annual ryegrass with a longer growth duration is required.

16
The total annual DM production of the annual ryegrass varieties evaluated during 2014 is shown in Figure 1. The total annual DM production varied between 3.44 and 7.79 t DM/ha. The Italian ryegrass variety Elvis had a similar total annual DM production to the Italian ryegrass varieties Tabu, Enhancer, Supreme Q, Sukari, Udine, Barmultra and Barmultima; the Westerwolds ryegrass varieities Lolan and Hogan and the intermediate type Super T, but higher than the rest. Varieties that sustained high winter and spring growth rates while remaining productive from May to December also obtained a high total annual dry matter production. Varieites that only remained productive until October tended to have a lower total annual DM production.
Year 2015
The monthly growth rate of annual ryegrass varieties evaluated during 2015 is shown in Table 2. The mean monthly growth rate varied between 3 and 65 kg DM/ha/day and was affected by month and variety. The hybrid ryegrass variety Shogun and the Italian ryegrass varieties Sukari and Agriboost maintained a high growth rate from May to August, indicating a good winter growth activity for these varieties. The monthly growth rates of Sukari and Barmultra were highest or similar to the highest during all months in Spring, while Shogun and Sukari maintained high growth rates throughout summer. The hybrid ryegrass Shogun, ryegrass mixture Voyager55 and Italian ryegrass varieties Sukari, Barmultra, Inducer, Yolande, Thumpa, Asset, Elvis and Tetraprime managed to persist into the second winter.
The total annual DM production of the annual ryegrass varieties evaluated during 2015 is shown in Figure 2. The hybrid ryegrass variety Shogun had a similar total DM yield to the Italian ryegrass varieties Sukari and Barmultra II, but higher than the rest of the annual ryegrass varieties. All these cultivars had superior winter production and an extended growth period compared to the rest. Sukari, a long-duration Italian ryegrass, had a similar yield to Barmultra II, Yolande and Inducer, but significantly higher than the rest of the Italian ryegrass varieties. The total annual yield of the Westerwolds ryegrass cultivar Hogan was similar to Performer, Zoom, Lolan and Bullet, but significantly higher than the other Westerwolds ryegrass varieties.
Conclusions
In terms of total annual DM yield the best performing varieties in both studies had a long growth duration and good winter growth activity. In terms of good winter activity and growth duration, the Italian ryegrass varieties Sukari and Barmultra performed well during both the 2014 and 2015 study. Both characteristics, namely growth duration and winter activity, are a recent combination in Italian ryegrass breeding, since they were mostly inversely related, which is commonly seen in older varieties and varieties originating from climatic zones with cold winters where winter dormancy is desirable. However, for southern hemisphere conditions and especially in purely pasture based systems, winter growth activity is an important attribute.

17
Tabl
e 1.
The
mon
thly
gro
wth
rate
(kg
DM
/ha
/da
y)of
ann
ual r
yegr
ass v
arie
ties e
valu
ate
d d
urin
g 20
14.
Aut
umn
Win
ter
Sprin
gSu
mm
erVa
riety
Spec
ies
Ploi
dy15
May
12 J
une
16 J
uly
18 A
ug17
Sep
27 O
ct26
Nov
23 D
ecEl
vis
Italia
n ry
egra
ssTe
trapl
oid
24.7
bcde
f19
.6ab
c17
.9a
22.3
bcde
33.0
ab40
.2ab
43.1
a21
.0ab
c
Barm
ultra
Italia
n ry
egra
ssTe
trapl
oid
25.5
bcd
18.3
abcd
e13
.2ab
cde
19.2
cde
28.7
abcd
e44
.3a
40.7
ab26
.8a
Supe
r TIn
term
edia
teTe
trapl
oid
22.0
bcde
f19
.2ab
cd12
.5bc
de19
.3cd
e31
.7ab
c40
.4ab
38.9
abc
21.0
abc
Tabu
Italia
n ry
egra
ssD
iplo
id25
.0bc
def
16.2
bcde
fghi
j13
.5ab
cde
19.2
cde
27.3
abcd
ef38
.9ab
c31
.1cd
19.1
abcd
e
Udin
eIta
lian
ryeg
rass
Tetra
ploi
d20
.5cd
ef17
.5ab
cdef
gh11
.6de
13.4
e29
.0ab
cd41
.2ab
38.4
abc
23.2
ab
Hoga
nW
este
rwol
ds r
yegr
ass
Tetra
ploi
d27
.1ab
cde
17.2
abcd
efgh
i15
.0ab
cd16
.8cd
e25
.1ab
cdef
33.5
abcd
33.3
bcd
21.3
abc
Suka
riIta
lian
ryeg
rass
Dip
loid
20.4
cdef
20.0
ab15
.0ab
cd18
.4cd
e24
.4ab
cdef
33.4
abcd
35.7
abc
21.5
abc
Barm
ultim
aIta
lian
ryeg
rass
Tetra
ploi
d23
.6bc
def
15.9
cdef
ghij
11.4
de16
.7cd
e26
.4ab
cdef
29.2
cdef
38.0
abc
17.4
bcde
Supr
eme
QIta
lian
ryeg
rass
Dip
loid
23.3
bcde
f17
.0bc
defg
hi13
.3ab
cde
18.4
cde
27.5
abcd
ef32
.5bc
de25
.2de
f17
.4bc
de
Lola
nW
este
rwol
ds r
yegr
ass
Tetra
ploi
d24
.4bc
def
17.8
abcd
efg
11.1
de18
.7cd
e28
.6ab
cde
26.3
defg
21.2
efg
19.8
abcd
Enha
ncer
Italia
n ry
egra
ssD
iplo
id25
.2bc
de18
.5ab
cde
12.6
bcde
16.9
cde
25.3
abcd
ef29
.2cd
ef20
.1ef
g15
.9bc
de
Fant
astic
Wes
terw
old
s rye
gras
sD
iplo
id31
.6ab
21.1
a17
.1ab
30.8
ab33
.9a
19.2
fghi
--
Jean
neIta
lian
ryeg
rass
Tetra
ploi
d22
.2bc
def
15.6
defg
hij
12.3
cde
12.5
e17
.0f
28.8
cdef
36.4
abc
16.5
bcde
Sust
aine
rIta
lian
ryeg
rass
Dip
loid
26.5
abcd
e18
.0ab
cdef
12.6
bcde
14.8
cde
26.1
abcd
ef26
.2de
fg17
.2fg
13.2
cde
Zoom
Wes
terw
old
s rye
gras
sTe
trapl
oid
19.6
cdef
13.7
hij
13.1
abcd
e18
.3cd
e20
.5cd
ef26
.1de
fg26
.7de
16.9
bcde
Ass
etIta
lian
ryeg
rass
Dip
loid
20.9
cdef
15.9
cdef
ghij
12.6
bcde
13.7
de18
.6de
f22
.4ef
gh32
.0cd
17.9
bcde
Soni
kIta
lian
ryeg
rass
Dip
loid
18.6
def
12.8
j11
.3de
19.2
cde
21.6
cdef
21.3
fgh
31.3
cd19
.1ab
cde
Max
imus
Wes
terw
old
s rye
gras
sTe
trapl
oid
29.0
abc
17.4
abcd
efgh
11.9
de17
.2cd
e28
.9ab
cd25
.4de
fg12
.8g
-Su
rge
Italia
n ry
egra
ssD
iplo
id21
.7bc
def
16.9
bcde
fghi
14.9
abcd
18.8
cde
20.8
cdef
20.3
fghi
26.0
de11
.1e
Voya
ger5
5M
ixtu
reTe
trapl
oid
22.5
bcde
f14
.4fg
hij
11.9
de16
.2cd
e22
.5bc
def
20.5
fgh
25.8
de16
.0bc
de
Mac
h1W
este
rwol
ds r
yegr
ass
Tetra
ploi
d21
.3cd
ef14
.9ef
ghij
10.9
de15
.2cd
e21
.7cd
ef26
.1de
fg16
.2g
15.3
bcde
Tetra
star
Wes
terw
old
s rye
gras
sTe
trapl
oid
35.8
a15
.9cd
efgh
ij14
.1ab
cde
23.6
bcd
29.8
abcd
7.96
j-
-Da
rgo
Italia
n ry
egra
ssD
iplo
id25
.8bc
def
18.2
abcd
ef16
.8ab
c34
.0a
28.0
abcd
ef11
.7hi
j-
-A
dren
alin
Wes
terw
old
s rye
gras
sTe
trapl
oid
20.4
cdef
16.5
bcde
fghi
j13
.6ab
cde
15.1
cde
23.5
abcd
ef22
.7de
fg18
.3ef
g-
Riva
lW
este
rwol
ds r
yegr
ass
Tetra
ploi
d28
.1ab
cd17
.0bc
defg
hi13
.4ab
cde
24.6
abc
28.7
abcd
e11
.8hi
j-
-C
apta
inW
este
rwol
ds r
yegr
ass
Tetra
ploi
d15
.1f
13.4
ij14
.2ab
cde
21.5
bcde
26.7
abcd
ef22
.8de
fg16
.5g
-En
erga
Wes
terw
old
s rye
gras
sTe
trapl
oid
20.5
cdef
13.9
ghij
11.3
de17
.9cd
e20
.8cd
ef20
.2fg
hi16
.8fg
-Ji
vet
Wes
terw
old
s rye
gras
sTe
trapl
oid
18.3
def
14.4
fghi
j9.
84e
12.6
e17
.6ef
17.2
ghij
15.3
g12
.2de
Voya
ger 1
0W
este
rwol
ds r
yegr
ass
Tetra
ploi
d17
.3ef
15.6
defg
hij
11.3
de18
.1cd
e21
.4cd
ef9.
47ij
--
LSD
(0.0
5)9.
953
3.87
4.79
710
.102
11.2
7610
.947
8.49
28.
697
ab
c…M
eans
with
no
com
mon
sup
ersc
ript d
iffer
sign
ifica
ntly
(Hig
hest
and
sim
ilar t
o th
e hi
ghes
t gro
wth
rate
s with
in a
mon
th h
ighl
ight
ed in
ora
nge)
LSD
(0.0
5) c
ompa
res w
ithin
mon
ths o
ver t
rea
tmen
ts

18
Figu
re 1
.The
tota
l ann
ual D
M p
rod
uctio
n (t
DM
/ha
) of a
nnua
l rye
gras
s va
rietie
s ev
alua
ted
dur
ing
2014
. (So
lid b
ars
indi
cate
hig
hest
a
nd si
mila
r to
the
high
est t
ota
l ann
ual D
M y
ield
. LSD
(0.0
5) c
omp
are
s ove
r tre
atm
ents
, erro
r ba
rs in
dica
te S
EM).
7.8
7.7
7.2
6.8
6.8
6.8
6.6
6.3
6.2
6.0
5.9
5.8
5.8
5.7
5.5
5.4
5.4
5.4
5.4
5.4
5.1
5.0
5.0
4.8
4.7
4.7
4.5
4.2
3.4
012345678910 Total annual DM yield (t DM/ha)
Annu
al ry
egra
ss v
arie
ty
LSD
(0.0
5) =
1.9
0
I
talia
n ry
egra
ss
W
este
rwol
ds ry
egra
ss
Inte
rmed
iate
Mix
ture

19
Tabl
e 2.
The
mon
thly
gro
wth
rate
(kg
DM
/ha
/da
y) o
f ann
ual r
yegr
assv
arie
ties e
valu
ate
d d
urin
g 20
15.
Aut
umn
Win
ter
Sprin
gSu
mm
erA
utum
nW
inte
rVa
riety
S/P
12-M
ay09
-Jun
07-J
ul11
-Aug
08-S
ep07
-Oct
05-N
ov07
-Dec
05-J
an04
-Feb
15-M
ar26
-Apr
02-J
unSh
ogun
H38
.8ab
38.9
abcd
17.4
abcd
e35
.6ab
cde
42.1
abc
47.1
defg
50.5
bcde
f23
.6ab
c20
.1a
19.1
ab25
.4ab
32.6
a32
.9a
Suka
riID
32.4
abcd
ef40
.6ab
c18
.7ab
c37
.8ab
c45
.6a
57.6
abc
51.1
abcd
ef26
.2a
16.5
abc
12.8
bc17
.1cd
30.5
a33
.3a
Barm
ultra
IT31
.6ab
cdef
32.8
def
10.5
fg28
.0cd
ef38
.3ab
cd64
.7a
57.8
ab23
.1ab
cd18
.2ab
14.5
abc
22.5
abc
30.0
a28
.2ab
c
Indu
cer
ID36
.4ab
cd37
.3bc
de10
.9fg
21.2
f28
.5de
55.2
bcd
54.8
abcd
19.0
defg
18.1a
b12
.7bc
19.6
bcd
25.1
ab29
.4ab
Yola
nde
ID30
.8bc
def
40.1
abc
14.4
abcd
efg
29.9
bcde
f39
.2ab
cd54
.8bc
d52
.1ab
cde
19.4
cdef
g17
.4ab
c13
.7ab
c13
.1d
24.4
ab28
.0ab
c
Thum
paIT
24.8
ef29
.9fg
12.2
efg
31.5
bcde
f38
.4ab
cd50
.1cd
ef39
.8gh
ij21
.4bc
de17
.8ab
c24
.4a
28.1
a22
.8ab
23.7
c
Ass
etID
31.4
bcde
f33
.6cd
ef12
.0ef
g28
.8cd
ef35
.3ab
cd47
.5de
f49
.5bc
def
15.9
g17
.0ab
c10
.9bc
17.9
cd24
.2ab
28.8
abc
Elvi
sIT
25.0
def
33.9
cdef
13.8
bcde
fg22
.6f
28.5
de60
.5ab
60.0
a20
.7bc
def
14.0
abcd
e7.
48c
19.6
bcd
23.3
ab27
.2bc
Voy
age
r 55
Mix
28.2
bcde
f36
.1bc
def
14.7
abcd
efg
30.2
bcde
f35
.6ab
cde
43.9
fg52
.6ab
cde
20.8
bcde
18.0
ab8.
06c
17.2
cd19
.1b
26.7
bc
Tetra
prim
eIT
22.9
f32
.7de
f9.
05g
22.0
f32
.7ab
cde
45.5
efg
44.4
efgh
16.3
fg14
.9ab
cde
7.87
c20
.4bc
24.0
ab31
.1ab
Agr
iboo
stID
32.0
abcd
ef41
.8ab
17.5
abcd
e33
.9ab
cde
37.5
abcd
48.1
def
45.8
defg
26.5
a15
.0ab
cd
Hoga
nW
T37
.2ab
c37
.2bc
de14
.5ab
cdef
g28
.5cd
ef31
.5bc
de48
.8cd
ef55
.5ab
c24
.1ab
13.1
bcde
f
Supe
rcha
rge
IT26
.6cd
ef40
.1ab
c19
.9a
42.3
a41
.2ab
cd44
.9fg
35.2
ijkl
19.3
cdef
g13
.4bc
def
Supr
eme
QID
30.7
bcde
f39
.3ab
cd17
.3ab
cde
33.8
abcd
e36
.9ab
cd46
.4de
fg42
.9fg
hi21
.6bc
de9.
98de
fgh
Perfo
rmer
IT30
.7bc
def
39.0
abcd
10.4
fg25
.4ef
33.8
abcd
e61
.1ab
42.5
fghi
3.9a
b7.
22fg
hi
Enha
ncer
ID43
.0a
42.4
ab13
.3cd
efg
31.4
bcde
f34
.0ab
cdee
29.1
i40
.3gh
i19
.4cd
efg
8.78
efgh
i
Bulle
tW
T28
.6bc
def
31.1
efg
14.2
abcd
efg
28.9
cdef
38.6
abcd
54.5
bcde
52.2
abcd
e18
.9de
fg6.
34gh
i
Jean
IT29
.4bc
def
30.7
efg
8.91
g23
.2f
30.5
cde
57.5
abc
56.5
abc
21.2
bcde
11.7
cdef
g
Zoom
WT
37.2
abc
33.6
cdef
9.28
g29
.4bc
def
31.1
cde
43.8
fg48
.2cd
efg
17.8
efg
5.11
hi
Tabu
ID8.
97g
24.5
g18
.5ab
cd39
.5ab
44.8
ab47
.8de
f55
.3ab
c22
.2ab
cde
15.6
abcd
Lola
nW
T34
.3ab
cdef
36.7
bcde
f13
.7bc
defg
29.6
bcde
f33
.2ab
cde
38.3
gh35
.4hi
jkl18
.4ef
g6.
05gh
i
Bars
pect
ra II
WT
26.7
cdef
30.7
efg
16.2
abcd
ef31
.3bc
def
35.6
abcd
e30
.4hi
36.4
hijk
16.1
g2.
88i
Jive
tW
T23
.9f
32.2
def
12.7
defg
27.2
def
32.4
abcd
e34
.2hi
31.0
jklm
18.4
efg
3.71
i
Big
Boss
WT
35.9
abcd
e41
.2ab
12.2
efg
36.5
abcd
33.8
abcd
e14
.4j
26.7
lm
Voy
age
r 10
WD
28.9
bcde
f45
.7a
19.4
ab39
.4ab
30.7
cde
11.6
j24
.1m
Brea
kout
ID32
.5ab
cdef
39.3
abcd
15.4
abcd
ef28
.6cd
ef29
.2cd
e18
.1j
28.4
klm
Tetra
star
WT
35.6
abcd
e38
.3bc
d14
.2ab
cdef
g26
.2ef
23.6
e16
.7j
24.4
m
LSD
(0.0
5)11
.479
7.14
075.
9468
10.3
5213
.273
9.04
319.
1181
4.42
836.
1676
6.76
246.
762
10.1
465.
267
S/P
= Sp
ecie
s/Pl
oidy
: W
= W
este
rwol
ds
I= It
alia
nH
= hy
brid
D =
Dip
loid
T =
Tetra
ploi
dab
c Mea
ns w
ith n
o co
mm
on su
pers
crip
t diff
ered
sign
ifica
ntly
(Hig
hest
and
sim
ilar t
o th
e hi
ghes
t gro
wth
rate
s with
in a
mon
th h
ighl
ight
ed in
ora
nge)
LSD
(0.0
5) c
ompa
res w
ithin
col
umn

20
Figu
re 2
.The
tota
l ann
ual D
M p
rod
uctio
n (t
DM
/ha
) of a
nnua
l rye
gras
s va
rietie
s ev
alua
ted
dur
ing
2015
. (So
lid b
ars
indi
cate
hig
hest
a
nd si
mila
r to
the
high
est t
ota
l ann
ual D
M y
ield
. LSD
(0.0
5) c
omp
are
s ove
r tre
atm
ents
, erro
r ba
rs in
dica
te S
EM).
13.8
13
.4
12.9
12
.1
12.0
11
.7
11.5
11
.3
11.2
10
.5
9.2
9.1
8.6
8.6
8.5
8.3
8.3
8.3
8.1
8.0
7.7
6.9
6.5
6.3
6.2
5.9
5.8
0246810121416 Total annual DM yield (t DM/ha)
Annu
al ry
egra
ss v
arie
ty
Italia
nry
egra
ss
W
este
rwol
ds ry
egra
ss
Hybr
id ry
egra
ss
M
ixtu
re
LSD
= 1
.458

21
Pasture dry matter yield of perennial ryegrass and ryegrass hybrids in the southern CapeJanke van der Colf, Sigrun B Ammann, Lethukuthula B. Zulu, Maria M. Lombard
Western Cape Department of Agriculture, Outeniqua Research Farm, P.O. Box 249, George, 6530.
Introduction
Perennial ryegrass (Lolium perenne) is an important pasture species in fodder flow programmes in the southern Cape, either as pure swards, in pasture mixtures or over-sown into kikuyu pasture. There are currently a number of perennial ryegrass, hybrid ryegrass and Festulolium (L. multiflorum x L. perenne; L. perenne x Festuca pratensis) cultivars available in South Africa. Both
the hybrid ryegrass varieties and Festuloliums have a predominant perennial ryegrass component. In order to determine the best adapted and highest producing variety to utilise in pasture systems, it is important that these varieties be evaluated on a regular basis and over a sufficient number of years to take climatic variations into account. The aim of this study was to evaluate the production potential and persistence of 24 perennial ryegrass, hybrid ryegrass and loloid Festuloliums varieties.
Materials and methods
The study was carried out on the Outeniqua Research Farm near George in South Africa, with the trial design a randomised block design in an irrigated small plot cutting trial. Pre-establishment fertilizer was applied to raise the soil nutrient levels to soil analysis recommendations. The trial was established during April 2014. Treatments were cut to a residual height of 50 mm approximately every 28 days or when the majority of treatments were at canopy closure to determine dry matter (DM) production and growth rate. Nitrogen (N) was applied after each cut at a rate of 50 kg N/ha. The species, ploidy and seeding rate of the varieties evaluated during the study are listed in Table 1.
Results and discussion
The monthly growth rate for perennial ryegrass and perennial ryegrass hybrids during year 1 and year 2 is shown in Table 2 and Table 3, respectively. The hybrid ryegrass variety Shogun was the only variety that maintained a growth rate that was the highest or similar to the highest within all months during year 1 and year 2. The perennial ryegrass varieties Arrow, Base One 50 and Halo maintained the highest or similar to the monthly highest growth rates for all but one month during year 1. All varieties showed seasonal variation in growth rates, with lowest growth rates occurring during winter and summer.
The total seasonal DM production of perennial ryegrass and ryegrass hybrids during year 1 and year 2 are shown in Table 4. The perennial ryegrass cultivars One50 and Halo, and the hybrid ryegrasses Shogun and Acrobat, were the only cultivars that maintained a higher yield from winter to autumn during year 1 compared to the remaining cultivars. Shogun and Base were the only varieties that

22
maintained highest and similar to the highest seasonal production during all seasons in year 2. The total annual DM production of perennial ryegrass and ryegrass hybrids during year 1 and year 2 is shown in Figure 1 and Figure 2, respectively. The hybrid ryegrass variety Shogun and perennial ryegrass varieties Base, One50, Halo, Banquet and Acrobat were the only varieties that had the highest (P<0.05) and similar (P>0.05) to the highest annual DM production during year 1 and year 2. All treatments showed in decline n total annual DM yield from year 1 to year 2.
Conclusions
The most important challenge with perennial ryegrass and related species, is the yield reduction in the second year, particularly during winter. It is thus important to identify varieties that best maintain a relatively good yielding capacity into the second winter. The perennial ryegrass varieties Base, One50, Halo, Banquet, Acrobat and hybrid ryegrass variety Shogun met these criteria during the study. Results clearly illustrate that perennial ryegrass requires reinforcement during year two to maintain production.
Table 1. The species, ploidy and seeding rate perennial ryegrass, ryegrass hybrid and Festulolium varieties evaluated.
Table 1. The species, ploidy and seeding rate perennial ryegrass, ryegrass hybrid and Festulolium varieties evaluated.
Variety Scientific name Common name Ploidy Seeding rate (kg/ha)
Trojan L. perenne Perennial ryegrass Diploid 20Arrow L. perenne Perennial ryegrass Diploid 20One50 L. perenne Perennial ryegrass Diploid 20Prospect L. perenne Perennial ryegrass Diploid 20Bronsyn L. perenne Perennial ryegrass Diploid 20Victoca L. perenne Perennial ryegrass Diploid 20Wintass II L. perenne Perennial ryegrass Diploid 20Indiana L. perenne Perennial ryegrass Diploid 20Billabong L. perenne Perennial ryegrass Diploid 20Mezo L. perenne Perennial ryegrass Diploid 20Halo L. perenne Perennial ryegrass Tetraploid 25Base L. perenne Perennial ryegrass Tetraploid 25Calibra L. perenne Perennial ryegrass Tetraploid 25Power L. perenne Perennial ryegrass Tetraploid 25Optimum L. perenne Perennial ryegrass Tetraploid 25Degree L. perenne Perennial ryegrass Tetraploid 25Shogun L. perenne x L. multiflorum Hybrid ryegrass Tetraploid 25Banquet I L. perenne x L. multiflorum Hybrid ryegrass Tetraploid 25Acrobat L. perenne x L. multiflorum Hybrid ryegrass Tetraploid 25Storm L. perenne x L. multiflorum Hybrid ryegrass Tetraploid 25Matrix xFestulolium loliaceum Festulolium 20Ultra xFestulolium loliaceum Festulolium 20Helix xFestulolium loliaceum Festulolium 20

23
Tabl
e 2.
The
mon
thly
gro
wth
ra
te (
kg D
M/h
a/d
ay)
of
per
enni
al r
yegr
ass
, ry
egra
ss h
ybrid
and
Fes
tulo
lium
va
rietie
s d
urin
g ye
ar
1 (2
014
to 2
015)
.
Varie
tyW
inte
r 1Sp
ring
1Su
mm
er 1
Aut
umn
102
Jun
14
03 J
ul 1
46
Aug
14
11 S
ep 1
422
Oct
14
25 N
ov 1
422
Dec
14
26 J
an 1
524
Feb
15
7 A
pr 1
520
May
15
Shog
un23
.7a
bc
15.5
a31
.5a
44.6
ab
cdef
44.9
ab
56.4
a34
.4a
23.2
ab
c15
.5a
11.1
ab
20.5
ab
cd
Arro
w19
.3c
11.5
ab
cde
25.9
ab
cd52
.2a
43.7
ab
c52
.2a
b27
.0a
bcd
ef25
.6a
13.9
ab
cd9.
92a
b23
.8a
Base
22.1
ab
c14
.2a
b30
.2a
b44
.0a
bcd
ef46
.1a
b52
.5a
b31
.0a
b25
.0a
15.1
ab
c9.
46a
b15
.6b
cdef
g
One
5020
.5b
c11
.9a
bcd
e27
.4a
bc
49.2
ab
c43
.0a
bc
51.2
ab
c28
.0a
bc
21.9
ab
cd15
.4a
b9.
48a
b18
.7a
bcd
ef
Halo
23.2
ab
c12
.1a
bcd
28.5
ab
c46
.2a
bcd
42.0
ab
cd53
.0a
b23
.2b
cdef
gh20
.2a
bcd
13.2
ab
cde
11.2
ab
19.0
ab
cdef
Banq
uet I
20.9
bc
9.79
bcd
ef24
.5a
bcd
e40
.8cd
ef40
.0a
bcd
ef52
.1a
b30
.2a
bc
25.6
a14
.4a
bc
12.6
a20
.9a
b
Acr
obat
25.0
ab
10.6
ab
cdef
25.8
ab
cd51
.1a
b47
.6a
38.4
cdef
29.4
ab
c17
.0b
cde
9.66
ab
cde
9.79
ab
20.2
ab
cde
Degr
ee21
.4a
bc
9.31
bcd
ef19
.6cd
e45
.8a
bcd
41.6
ab
cd51
.1a
bc
26.6
ab
cdef
19.5
ab
cd11
.1a
bcd
e13
.2a
23.6
a
Ultra
22.8
ab
c9.
71b
cdef
20.1
cde
37.7
def
40.7
ab
cde
49.9
ab
c27
.1a
bcd
e23
.8a
b12
.7a
bcd
e7.
28b
18.1
ab
cdef
g
Troj
an22
.5a
bc
12.2
ab
cd21
.1b
cde
43.0
ab
cdef
43.3
ab
c47
.3a
bcd
23.7
bcd
efg
15.9
cde
12.6
ab
cde
10.9
ab
17.6
ab
cdef
g
Mez
o21
.4a
bc
8.51
cdef
22.5
ab
cde
41.8
bcd
ef38
.4a
bcd
efg
52.7
ab
23.9
bcd
efg
24.4
ab
11.6
ab
cde
8.92
ab
13.0
efg
Helix
22.4
ab
c12
.2a
bcd
27.1
ab
c43
.1a
bcd
ef38
.9a
bcd
ef46
.6a
bcd
24.5
bcd
efg
20.7
ab
cd10
.2a
bcd
e7.
40b
11.6
fg
Billa
bong
19.6
c9.
02cd
ef25
.1a
bcd
e43
.6a
bcd
ef36
.9b
cdef
g40
.5b
cde
24.4
bcd
efg
17.1
bcd
e9.
96a
bcd
e9.
42a
b20
.7a
bc
Opt
imum
20.6
bc
10.1
bcd
ef23
.0a
bcd
e40
.0cd
ef40
.8a
bcd
e43
.0a
bcd
25.1
bcd
efg
14.7
def
7.32
e10
.1a
b16
.7a
bcd
efg
Pros
pect
23.0
ab
c9.
33b
cdef
20.4
cde
38.7
def
32.4
def
g45
.6a
bcd
27.4
ab
cde
19.0
ab
cd14
.3a
bc
7.00
b13
.2d
efg
Stor
m21
.8a
bc
6.98
ef17
.0d
e36
.2ef
33.7
cdef
g47
.5a
bcd
27.8
ab
cd20
.3a
bcd
8.91
cde
9.78
ab
17.2
ab
cdef
g
Mat
rix22
.2a
bc
10.2
bcd
ef27
.1a
bc
44.0
ab
cdef
31.9
def
g39
.7b
cdef
22.9
cdef
gh16
.6b
cde
10.7
ab
cde
6.42
b13
.1cd
efg
Bron
syn
19.8
c10
.1b
cdef
23.2
ab
cde
39.2
def
30.0
fg43
.9a
bcd
19.0
fgh
21.0
ab
cd13
.3a
bcd
e8.
90a
b14
.6b
cdef
g
Pow
er21
.2b
c8.
04d
ef16
.1e
38.3
def
41.6
ab
cd27
.3ef
g19
.6ef
gh19
.7a
bcd
9.87
ab
cde
10.2
ab
16.6
ab
cdef
g
Indi
ana
22.7
ab
c7.
40d
ef16
.8d
e38
.6d
ef35
.6b
cdef
g38
.4cd
ef19
.8d
efgh
15.1
def
9.19
bcd
e6.
53b
13.0
def
g
Win
tass
II20
.2b
c7.
01ef
21.0
bcd
e37
.9d
ef33
.3cd
efg
34.2
def
g17
.5gh
10.6
ef7.
52d
e6.
65b
15.3
bcd
efg
Vict
oca
21.8
ab
c5.
92f
17.5
de
42.1
bcd
ef32
.0d
efg
28.8
efg
15.4
h9.
98ef
12.3
ab
cde
6.69
b14
.4b
cdef
g
Cal
ibra
19.6
c9.
78b
cdef
21.4
bcd
e35
.7f
28.0
g26
.1fg
17.2
gh7.
97f
10.0
ab
cde
7.04
b10
.7g
Band
ito26
.2a
13.3
ab
c30
.4a
b45
.1a
bcd
e30
.7ef
g21
.3g
--
--
-LS
D (0
.05)
4.93
45.
042
9.46
19.
369
10.5
1713
.625
7.99
37.
798
6.35
04.
919
7.42
5ab
c Mea
ns w
ith n
o co
mm
on su
pers
crip
t diff
ered
sign
ifica
ntly
(Hig
hest
and
sim
ilar t
o th
e hi
ghes
t gro
wth
rate
with
in m
onth
is in
dica
ted
in o
rang
e(P
<0.0
5)).
LSD
(0.0
5) c
omp
ares
with
in m
onth

24
Tabl
e 3.
The
mon
thly
gro
wth
rate
(tD
M/h
a/d
ay)
ofp
eren
nial
ryeg
rass
, rye
gra
ss h
ybrid
and
Fes
tulo
lium
var
ietie
s d
urin
g ye
ar 2
(201
5 to
201
6).
Varie
tyW
inte
rSp
ring
Sum
mer
Aut
umn
23 J
un /
6 A
ug 1
514
Sep
15
13 O
ct 1
519
Nov
15
17 D
ec 1
513
Jan
16
10 M
ar 1
625
Apr
16
27 M
ay 1
6Sh
ogun
17.5
ab
29.3
a47
.0a
bc
41.0
ab
cd35
.7a
15.9
a14
.0a
41.1
ab
cde
38.4
gh
Base
14.2
ab
cde
17.4
bcd
e44
.2a
bcd
e43
.4a
bc
31.8
ab
cd13
.6a
b13
.4a
45.2
a45
.8b
cde
Arro
w16
.9a
bc
22.6
ab
42.9
bcd
ef37
.0b
cdef
26.2
cde
11.2
bcd
efgh
6.13
efg
41.2
ab
cde
44.7
bcd
ef
One
5019
.5a
23.1
ab
36.6
cdef
ghi
35.9
cdef
32.4
ab
c10
.8b
cdef
gh8.
60b
cdef
34.9
bcd
ef46
.6a
bcd
Halo
16.2
ab
cd16
.2b
cde
39.6
cdef
gh39
.2a
bcd
30.5
ab
cd11
.2b
cdef
gh11
.7a
bc
38.2
ab
cdef
47.3
ab
cd
Banq
uet I
12.6
ab
cde
17.6
bcd
e33
.9ef
ghi
39.8
ab
cd34
.9a
b12
.5b
cd13
.1a
39.7
ab
cdef
48.7
ab
c
Acr
obat
10.2
bcd
e19
.4b
cd51
.6a
b44
.9a
b27
.8b
cde
13.2
ab
c10
.3a
bcd
e44
.1a
b45
.7b
cde
Degr
ee9.
37b
cde
15.2
bcd
e54
.0a
45.9
a28
.8a
bcd
12.3
bcd
e11
.6a
bcd
31.9
ef39
.1fg
h
Ultra
12.4
ab
cde
13.9
bcd
e34
.4d
efgh
i34
.4d
ef32
.2a
bcd
9.08
h14
.4a
42.7
ab
c44
.8b
cdef
Troj
an13
.4a
bcd
e14
.1b
cde
40.9
bcd
efg
41.5
ab
cd27
.8b
cde
11.9
bcd
efg
4.73
fg33
.9cd
ef51
.9a
Mez
o10
.9a
bcd
e9.
74e
28.2
i34
.1d
ef31
.4a
bcd
10.3
def
gh8.
30b
cdef
g40
.6a
bcd
e50
.3a
b
Helix
10.4
bcd
e16
.3b
cde
31.7
ghi
31.0
ef29
.0a
bcd
9.50
efgh
8.40
bcd
efg
35.8
ab
cdef
41.7
def
gh
Billa
bong
12.8
ab
cde
19.8
bc
39.1
cdef
ghi
36.9
bcd
ef27
.0cd
e9.
52ef
gh6.
30ef
g32
.9d
ef50
.0a
b
Opt
imum
12.1
ab
cde
18.3
bcd
e38
.7cd
efgh
i37
.6b
cdef
30.6
ab
cd8.
64h
7.33
cdef
g39
.9a
bcd
ef43
.8cd
efgh
Pros
pect
12.4
ab
cde
14.3
bcd
e32
.6fg
hi33
.6d
ef33
.9a
bc
12.3
bcd
ef12
.5a
b39
.7a
bcd
ef41
.3d
efgh
Stor
m8.
34cd
e16
.2b
cde
46.5
ab
c43
.2a
bc
31.6
ab
cd9.
18gh
6.77
efg
38.8
ab
cdef
38.0
h
Mat
rix14
.4a
bcd
e17
.0b
cde
28.7
hi29
.7f
31.3
ab
cd10
.7cd
efgh
7.87
cdef
g41
.8a
bcd
44.3
bcd
efg
Bron
syn
11.3
ab
cde
18.6
bcd
e40
.1cd
efg
39.4
ab
cde
30.5
ab
cd10
.7cd
efgh
8.60
bcd
ef39
.3a
bcd
ef46
.6a
bcd
Pow
er7.
63d
e12
.5cd
e45
.1a
bcd
38.3
ab
cde
28.6
ab
cde
8.60
h7.
20d
efg
36.8
ab
cdef
43.0
cdef
gh
Indi
ana
10.2
bcd
e11
.6cd
e39
.8cd
efg
41.4
ab
cd35
.4a
b11
.1b
cdef
gh8.
43b
cdef
g37
.5a
bcd
ef43
.5cd
efgh
Win
tass
II8.
65b
cde
10.2
de
28.2
i39
.0a
bcd
e20
.8e
9.42
fgh
5.67
fg33
.9cd
ef45
.2b
cde
Vict
oca
7.94
cde
12.5
cde
37.9
cdef
ghi
37.6
ab
cdef
24.4
de
8.76
h5.
53fg
31.9
ef42
.9cd
efgh
Cal
ibra
6.00
e11
.5cd
e35
.4d
efgh
i37
.3b
cdef
28.5
ab
cde
8.40
h4.
07g
31.0
f39
.8ef
gh
9.05
49.
221
10.9
78.
339
7.81
62.
840
4.44
29.
539
6.05
5ab
c Mea
ns w
ith n
o co
mm
on su
pers
crip
t diff
ered
sign
ifica
ntly
(Hig
hest
and
sim
ilar t
o th
e hi
ghes
t gro
wth
rate
with
in m
onth
is in
dica
ted
in o
rang
e(P
<0.0
5)).
LSD
(0.0
5) c
omp
ares
with
in m
onth

25
Tabl
e 4.
The
tota
l ann
ual s
easo
nal D
M p
rodu
ctio
n (t
DM
/ha
)of
per
enni
al ry
egra
ss, r
yegr
ass
hyb
rid a
nd F
estu
loliu
m v
arie
ties
dur
ing
yea
r 1 a
nd y
ear 2
.
Varie
tyYe
ar 1
Year
2W
inte
r Sp
ring
Sum
mer
A
utum
n W
inte
r Sp
ring
Sum
mer
A
utum
n Sh
ogun
3.04
a5.
36a
b2.
19a
1.35
ab
c1.
33a
b4.
02a
2.23
a3.
12a
bcd
e
Arro
w2.
46b
cde
5.45
a2.
03a
bc
1.44
ab
1.22
ab
c3.
49a
bcd
e1.
38fg
h3.
33a
bc
Base
2.86
ab
5.26
ab
c2.
15a
b1.
07b
cdef
1.04
ab
cde
3.57
ab
cd2.
02a
bc
3.54
a
One
502.
59a
bcd
e5.
28a
bc
1.97
ab
c1.
20a
bcd
ef1.
45a
3.29
bcd
efg
1.69
bcd
ef3.
10a
bcd
e
Halo
2.80
ab
c5.
19a
bcd
1.71
ab
cde
1.29
ab
cd1.
19a
bc
3.24
bcd
efgh
1.82
ab
cde
3.27
ab
cd
Banq
uet I
2.45
bcd
e4.
88a
bcd
ef2.
13a
b1.
43a
b0.
92b
cdef
g3.
15d
efgh
2.06
ab
3.38
ab
c
Acr
obat
2.78
ab
c5.
10a
bcd
e1.
67a
bcd
e1.
28a
bcd
0.74
def
gh3.
92a
b1.
72b
cdef
3.49
ab
Degr
ee2.
31cd
e5.
09a
bcd
e1.
72a
bcd
e1.
57a
0.67
def
gh3.
86a
bc
1.80
bcd
e2.
72e
Ultra
2.42
bcd
e4.
72a
bcd
efg
1.93
ab
cd1.
08b
cdef
0.89
bcd
efg
2.81
fghi
1.97
ab
cd3.
40a
bc
Troj
an2.
52b
cde
4.93
ab
cdef
1.56
cdef
g1.
22a
bcd
e0.
99b
cdef
3.27
bcd
efgh
1.37
fgh
3.22
ab
cd
Mez
o2.
38b
cde
4.87
ab
cdef
1.83
ab
cde
0.93
cdef
0.78
cdef
gh2.
46i
1.63
cdef
g3.
48a
b
Helix
2.71
ab
cd4.
731a
bcd
efg
1.68
ab
cde
0.81
ef0.
77cd
efgh
2.70
fghi
1.55
efgh
2.98
cde
Billa
bong
2.37
bcd
e4.
46b
cdef
gh1.
55cd
efg
1.28
ab
cd0.
94b
cdef
g3.
27b
cdef
gh1.
37fg
h3.
11a
bcd
e
Opt
imum
2.39
bcd
e4.
58a
bcd
efgh
1.40
def
g1.
14a
bcd
ef0.
88b
cdef
g3.
23cd
efgh
1.
51ef
gh3.
24a
bcd
Pros
pect
2.43
bcd
e4.
27d
efgh
i1.
82a
bcd
e0.
86d
ef0.
91cd
efg
2.75
fghi
1.99
ab
cd3.
15a
bcd
e
Stor
m2.
17e
4.30
cdef
gh1.
72a
bcd
e1.
15a
bcd
ef0.
59ef
gh3.
58a
bcd
1.52
efgh
3.00
cde
Mat
rix2.
64a
bcd
e4.
24d
efgh
i1.
51cd
efg
0.84
def
1.07
ab
cd2.
60hi
1.61
def
g3.
34a
bc
Bron
syn
2.35
bcd
e4.
13ef
ghi
1.63
bcd
ef1.
00b
cdef
0.83
cdef
gh3.
34b
cdef
1.63
cdef
g3.
30a
bc
Pow
er2.
13e
4.02
fghi
1.51
cdef
g1.
14a
bcd
ef0.
53gh
3.21
cdef
gh1.
44ef
gh3.
07b
cde
Indi
ana
2.23
de
4.16
efgh
i1.
33ef
g0.
84d
ef0.
74d
efgh
3.14
def
ghi
1.77
bcd
ef3.
12a
bcd
e
Win
tass
II2.
20d
e3.
89gh
i1.
06g
0.94
cdef
0.61
efgh
2.66
ghi
1.16
h3.
01cd
e
Vict
oca
2.15
e3.
80gh
i1.
12fg
0.90
cdef
0.56
fgh
2.98
def
ghi
1.23
gh2.
84d
e
Cal
ibra
2.27
de
3.32
i1.
03g
0.76
f0.
43h
2.86
efgh
i1.
26gh
2.70
e
Band
ito2
3.10
a3.
61hi
0.51
60.
974
0.54
60.
452.
820.
452
0.68
00.
249
0.45
5ab
c Mea
ns w
ith n
o co
mm
on su
pers
crip
t diff
ered
sign
ifica
ntly
(Hig
hest
and
sim
ilar t
o th
e hi
ghes
t DM
pro
duct
ion
with
in se
ason
is in
dica
ted
in o
rang
e(P<
0.05
)).
LSD
(0.0
5) c
omp
ares
with
in se
ason

26
Figu
re 1
.The
tota
l ann
ual d
ry m
atte
r pro
duc
tion
of p
eren
nial
ryeg
rass
and
ryeg
rass
hyb
rids d
urin
g ye
ar 1
. Red
ba
rs in
dica
te h
ighe
st
and
sim
ilar t
o th
e hi
ghes
t yie
lds (
P<0.
05).
11.9
11
.4
11.3
11
.0
11.0
10
.9
10.8
10
.7
10.2
10
.2
10.0
9.
9 9.
7 9.
5 9.
4 9.
3 9.
2 9.
1 8.
8 8.
6 8.
1 8.
0 7.
4 6.
7 02468101214 Total annul DM yield (t DM/ha)
Varie
ty
LSD
(0.0
5) =
1.8
75

27
Figu
re 2
.The
tota
l ann
ual d
ry m
atte
r pro
duc
tion
of p
eren
nial
ryeg
rass
and
ryeg
rass
hyb
rids d
urin
g ye
ar 2
. Red
ba
rs in
dica
te h
ighe
st
and
sim
ilar t
o th
e hi
ghes
t yie
lds (
P<0.
05).
10.7
10
.2
9.4
9.5
9.5
9.5
9.9
9.1
9.1
8.9
8.3
8.0
8.7
8.9
8.8
8.7
8.6
9.1
8.3
8.8
7.4
7.6
7.2
024681012 Total annual DM yield (t DM/ha)
Varie
ty
LSD
(0.0
5) =
1.2
26

28
The production potential and botanical composition of kikuyu over-sown with temperate grass/legume
mixtures using different planting methodsJ van der Colf
Western Cape Department of Agriculture, Outeniqua Research Farm, P.O. Box 249, George, 6530.
Introduction
Kikuyu is a pasture species that is well adapted to the main milk producing areas in the Western Cape Province of South Africa (Botha 2003). Although kikuyu is capable of supporting high stocking rates and milk production per hectare when fertilised, it is not the ideal pasture species. These include low forage quality and as result low milk production per cow, the
presence of anti-quality factors and the seasonal variation in dry matter production (Colman and Kaiser 1974, Reeves 1997, Marais 2001, Botha 2003). The strategic incorporation of various temperate grasses and legume species, over-sown during autumn, has been found to be an economical forage based way to improve the seasonal dry matter production, forage quality and milk production potential of kikuyu based pasture systems (Botha 2003, Fulkerson et al. 1993a, Van der Colf 2011). The preferred species to include in a kikuyu based system will be based on factors such as fertiliser costs, the milk price, ease of management and most recently the availability of natural resources such as water (Botha et al. 2008a).
To date kikuyu-ryegrass pastures have been favoured over kikuyu-clover pastures in the main milk producing areas of the Western Cape due to the fact that these systems are easy to manage, require fewer field operations to establish and have a high seasonal DM production potential (Davison et al. 1997a, Botha et al. 2008a). Such kikuyu-ryegrass systems can maintain pasture production rates (DM intake basis) of between 15 and 18 t DM/ha/annum and achieve milk production rates of approximately 30 000 kg FCM/ha (Van der Colf 2011). However, due to the high fertilisation (500 kg N ha-1 annum-1) and irrigation requirements of kikuyu-ryegrass pastures, the sustainability of such systems in the future is questionable. In order to maintain the ecological and economic sustainability of these pasture systems they will have to be adapted to ensure that they remain as productive as possible with as few inputs as feasible but with sufficient diversification, resilience and profitability to ensure financial viability of the farmer (Scott et al. 2000). Species that are better adapted to the climatic conditions of the Southern Cape, which could reduce fertilizer and irrigation inputs and are still capable of successfully growing and competing within a kikuyu based pasture, will need to be evaluated (Van der Colf 2011).
The inclusion of legumes and perennial grasses is the most likely base by which to streamline pasture systems so as to increase long-term survival and sustainability (Cransberg and McFarlane 1994). Perennial legumes such as white clover hold the potential to fix nitrogen, provide high quality feed for livestock (Brock and Hay 2001) and decrease the reliance on expensive nitrogen fertilisation (Graham and Vance 2003, Neal et al. 2009). One of the main concerns with including clovers in kikuyu pastures is the lower seasonal DM production and resultant lower grazing capacity of such systems compared to kikuyu-grass systems (Botha et al 2008a). The inclusion of a temperate grass species in a mixture with clovers is thus recommended.
29
Although perennial ryegrass-clover mixtures have been successfully established into existing kikuyu pastures (Botha 2003), the persistence of perennial ryegrass, whether sown as in pure swards or into kikuyu pastures, has been shown to be relatively poor in sub-tropical climates (Nie et al. 2008, Botha et al. 2008c, Van der Colf 2011). Furthermore, the recent concern over the impacts that climatic variability can have on plant production under climate change due to natural extremes such as storms and floods and inter-annual and decadal variation, has highlighted the need to include alternative crops that are better adapted to these conditions by means of more appropriate thermal time and vernalization requirements and increased resistance to heat shock and drought (Stige et al. 2006, Tubiello et al. 2007). With the recent occurrences of agricultural droughts in the Southern Cape (Botha 2011a) and the increasing pressure on agriculture to improve the water use efficiency of irrigation (Rosegrant et al. 2005), have also necessitated the identification of alternative species for milk production. Cocksfoot (Dactylis glomerata) and Tall Fescue (Festuca arundinacea) are two likely species that could fulfil this role due to their higher resistance to drought and higher persistence over years compared to perennial ryegrass (Gibson and Newman 2001, Nie et al. 2004). Although it is clear that alternative systems, based on the inclusion of more drought tolerant grass species and legumes, will have to be developed, limited information is available on the methods to over-sow these species, the pasture production potential and persistence of such mixtures. The aim of this study was to evaluate various methods to establish grass/legume mixtures into kikuyu.
Materials and methods
The study was carried out on existing kikuyu pasture under permanent irrigation on the Outeniqua Research Farm in the Western Cape Province of South Africa. The study consisted of a randomized block design with three blocks that acted as replicates and to which treatments were randomly allocated.
The pasture treatments are described in terms of abbreviation, common name, scientific name and seeding rate in Table 1.
Table 1: Treatment abbreviation, common name, scientific name and seeding rate of pasture treatments.
Mixture Abbreviation Common name Scientific name Seeding rate (kg ha-1)
Cocksfoot mixture C
Kikuyu Cocksfoot White clover Red clover
Pennisetum clandestinum Dactylis glomerata Trifolium repens Trifolium pratense
Existing pasture 10 4 4
Tall fescue mixture F
Kikuyu Tall fescue White clover Red clover
Pennisetum clandestinum Festuca arundinacea Trifolium repens Trifolium pratense
Existing pasture 10 4 4
Perennial ryegrass mixture
P
Kikuyu Perennial ryegrass White clover Red clover
Pennisetum clandestinum Lolium perenne Trifolium repens Trifolium pratense
Existing pasture 10 4 4
Kikuyu Italian ryegrass White clover Red clover
Pennisetum clandestinum Lolium multiflorum Trifolium repens Trifolium pratense
Existing pasture 10 4 4
Italian ryegrass mixture
I

30
The establishment methods used during the study were aimed at including techniques based on herbicidal and mechanical control of kikuyu. A detailed description of the three establishment methods is given in Table 2. Paraquat was applied to the plots allocated to this treatment 14 days prior to the any tillage/mechanical actions at a rate of 5 L ha-1. It is recommended that temperate species be over-sown into kikuyu on an annual basis in order to maintain maximum returns from fertilizer and irrigation inputs on such pastures (Goodchild et al. 1982). In current kikuyu systems, perennial ryegrass is over-sown on an annual basis due to poor persistence (Botha et al. 2008, Van der Colf 2011). As result, pastures were over-sown using only a planter and mower during year 2 and year 3.
Table 2: Treatment abbreviation, herbicide treatment, cultivation and description of establish-ment method to be used during the trial
Treatment Treatment abbreviation
Establishment method
Planter P 1. Graze to 50 mm 2. Mulch to ground level 3. Plant with Aitchison seeder 4. Roll with teff roller
Rotavator R 1. Graze to 50 mm 2. Mulch to ground level 3. Rotavate to 120 mm 4. Roll with teff roller 5. Broadcast seed 6. Roll with teff roller
Planter and paraquat PP 1. Spray with 5 L/ha paraquat 2. Graze to 50 mm 3. Spray with paraquat (5 L ha-1) 4. Mulch to ground level 5. Plant with Aitchison seeder 6. Roll with teff roller
Irrigation was scheduled using tensiometer readings placed at a depth of 150 mm. Irrigation commenced at a tensiometer reading of –25 kPa (Botha 2002). Soil samples were taken before the commencement of pasture establishment to a depth of 100 mm. Fertiliser was applied according to soil analysis results to raise soil P level (citric acid method) to 35 mg kg-1, K level to 80 mg/kg and the pH (KCl) to 5.5 (Beyers 1973). Pastures received a once-off nitrogen dressing of 50 kg N ha-1 during winter in year 2.
Dry matter yield (kg DM/ha) was determined every 28 days by cutting four 0.25 m2 quadrats to a height of 50 mm per plot before and after grazing. Samples were dried at 60ºC for 72 hours, DM content was determined and the yield estimated as kg DM/ha. Botanical composition was determined on a seasonal basis from grab samples. Pastures were grazed by lactating Jersey cows when pasture were deemed ready for grazing (between 28 and 35 days), with grazing management aimed maintaining a post grazing height of approximately 50 mm above ground level.

31
Results and discussion
Seasonal dry matter yield
The total seasonal DM yield ( t DM/ha) of the four species mixtures over-sown using different establishment methods is shown in Table 3. Seasonal yield was affected by species mixture, establishment method and the season itself. The only treatment that maintained the highest and similar to the highest seasonal DM yield throughout all seasons during the three year period was the perennial ryegrass mixture established using the planter method. During year 2 and year 3 the seasonal yield of all treatments was lowest during winter, while during year 1 it was lowest during winter and autumn. The relatively low seasonal yield during particularly winter in year 3 (as low as 0.58 t DM/ha), is of concern due to the impact it can have on the fodder flow within such a pasture system. The highest and similar to the highest seasonal yields occurred during summer in year 1 and spring and/or summer during year 2 and year 3. This is in agreement with the findings reported by van der Colf et al. (2015) for kikuyu-ryegrass systems, where winter production tended to be lower than during spring, summer and autumn.
Total annual dry matter yield
The total annual DM yield the different species mixtures over-sown using different establishment methods is shown in Table 4. When comparing within the different mixtures over-sown into kikuyu during year 1, establishment method did not affect the total annual DM yield of the perennial ryegrass, Italian ryegrass or Fescue mixtures during the three year trial period. The only mixture where establishment method affected total annual DM yield was when cocksfoot was over-sown into kikuyu, with the planter+paraquat method resulting in a higher annual DM yield during year 1 and year 2, than when a planter or rotavator was utilised. However, by year 3, all establishment methods resulted in a similar total annual DM yield for the cocksfoot mixture.
Total annual DM yield compared within each establishment method was only affected by species mixture when utilising a planter, with the perennial ryegrass mixture having a higher total DM yield than the fescue mixture during year 1 and year 3, and a higher yield than all other mixtures during year 2. This is associated with this treatment’s potential to maintain high seasonal DM yields throughout all seasons during all three years. Perennial ryegrass established with a planter and cocksfoot established with a planter+paraquat were the only treatments that maintained the highest or similar to the highest DM yield within all three years. All treatments, however, showed a decline in total annual yield from year 1 to year 3. With the exception of perennial ryegrass established using the planter or planter+paraquat method and the cocksfoot mixture established using the planter+paraquat method, all treatments had a total annual DM yield below 10 t DM/ha during year 3. Total annual DM yield thus appears to be affected by an interaction between species mixture over-sown and the method used to establish it into the kikuyu pasture base.
Botanical composition
Clover content
The seasonal clover content (%) of the species mixtures over-sown into kikuyu using different establishment methods during the trial period is shown in Table 5. Clover content was affected by species mixture and the establishment method used.
It has been recommended that a clover content of above 30% of the botanical composition during winter and up to 50% during spring (Botha et al. 2008a) (Kemp et al. 2000) be maintained to ensure a beneficial effect on pasture production. During year 1 the only treatment that achieved a clover content of >30% during winter was the fescue treatment established using the rotavator during year 1, while a clover content of above 50% during summer of year 1 was only obtained from the cocksfoot, fescue and Italian ryegrass established with the rotavator, and the cocksfoot and Italian ryegrass mixtures established using the planter+paraquat method. All treatments tended

32
to have a low clover content during winter compared to other seasons during year 1. During year 2, all treatments had a clover content below 30% during the winter and 50% during the summer. During year 3 the contribution of clover had declined below 35% irrespective of the species over-sown or the method used to establish it during year 1. It is thus unlikely that the legume content made a significant enough contribution to nitrogen supply within the system to support high pasture production rates.
The reason for the poor clover establishment, particularly where cultivation and herbicide had been used is not fully understood. It has however, been noted that clovers are often at a disadvantage during the seedling stage since the pest and disease load under no-tillage systems is sometimes higher and covers are more at risk to pest damage under these circumstances than grasses (Laidlaw and Teuber 2001, Bartholomew 2005).
One of the greatest challenges to establishing clover seedlings is the competition from grasses, either companion grasses or the existing kikuyu. For example, white clover sown in autumn will tend to germinate more rapidly than ryegrass, but subsequent development and growth is low compared to ryegrass (Brock & Hay, 2001). The competitive effect of rapidly germinating and growing seedlings, especially those of ryegrass, must be considered when attempting to establish a legume-grass pasture (Moot, Scott, Roy, & Nicholls, 2000), while the competition from kikuyu should be reduced by any means possible. This could be the potential reason why the Fescue mixture established using the rotavator was the only treatment that had the highest or similar to the highest clover content from winter to summer during year 1 and from winter to autumn during year 2.
The poor persistence of the clover over the trial period is also of concern. It has been noted that the successful establishment and maintenance of white clover in kikuyu pastures is often problematic, primarily due to the competition form vigorous growing kikuyu during the summer (Fulkerson and Reeves 1996, Botha 2012), while established/ sown white clover has been found to decline in kikuyu pasture during year 2 and year 3 (Fulkerson and Reeves 1996). It is this speculated that the increasing competition from established grasses from year 2 onwards during the three year trial period (when pastures where over-sown by only using a no-till planter) may also not have been sufficient to re-enforce the clover component over years.
Sown grass content
The seasonal sown grass content (%) of the species mixtures over-sown into kikuyu using different establishment methods during the trial period is shown in Table 6. As kikuyu is dormant during winter, pasture production during this period is primarily dependant on the temperate component within the pasture. During winter year of 1 the only treatments that achieved a sown grass content above 50% were the Italian ryegrass mixture established using the rotavator or paraquat+planter and perennial ryegrass established using the rotavator or planter. However, during winter of year 2 all treatments except perennial ryegrass established with a planter or paraquat+planter and fescue established with a rotavator had a sown grass content above 50%. This is in agreement with findings that although cocksfoot and Tall Fescue show lower seedling emergence, survival and growth when over-sown into an existing sward, increases in production from these species often occur at a later stage (Hume and Chapman 1993), with their contribution to the sward often increasing during later years (Charles et al. 1992). Further studies, aimed at developing management strategies that may improve the establishment success of these species should be evaluated (for example planting dates and grazing management). It should also be noted that treatments where the sown grass component was low during winter and spring (such as Cocksfoot/planter, Fescue/rotavator and Cocksfoot/planter) compared to other treatments, tended to have a higher clover content.
The highest and similar the highest sown grass content across seasons and treatments occurred during winter and spring during all three years. The treatments that had the highest or similar to highest sown grass content during both winter and spring during all three years were the perennial ryegrass mixture established using the rotavator and the Italian ryegrass mixture using the rotavor or planter+paraquat method. However, during year 2 and year 3 the cocksfoot mixture established

33
using the rotavator or planter+paraquat method also achieved the highest or similar to the highest seasonal sown grass content during winter and spring. The lowest sown grass content in the majority of treatments during all three years occurred during autumn, illustrating the decline in the temperate sown grass content that is typically seen in kikuyu based pastures in the region, and highlighting the need to over-sow these temperate species on an annual basis.
Kikuyu content
The seasonal kikuyu content (%) of the species mixtures over-sown using different establishment methods during the trial period is shown in Table 7. During year 1 and year 2 all treatments had a similar seasonal kikuyu content during winter and spring. The highest and similar to the highest kikuyu content during all three years occurred during autumn for the following treatments:• Year 1: perennial ryegrass established with the planter; cocksfoot established using the
planter+paraquat method.• Year 2: Italian and perennial ryegrass established using the planter and planter+paraquat
methods; perennial ryegrass established using the rotavator.• Year 3: All ryegrass treatments (mixtures and establishment methods); fescue established using
the rotavator.• During year 1 all treatments showed an increase in the kikuyu content from winter to spring except for cocksfoot and Italian ryegrass established with the rotavator. The kikuyu content of these two treatments remained below 15% throughout year 1. The Italian ryegrass and perennial ryegrass mixtures over-sown using a planter, as well as the Italian ryegrass mixture over-sown using the planter+paraquat method were the only treatments that had the highest and similar to the highest kikuyu content during all seasons in year 2. The higher kikuyu component of these treatments during summer and autumn is likely associated with the decline in the sown grass (ryegrass) component (Table 6) during the same period. With the exception of the Fescue/planter, Italian ryegrass/rotavator and Fescue/planter+paraquat treatments, the kikuyu content of all other treatments increased from spring to autumn. This increase in the kikuyu component was also associated with a decrease in the sown grass component.
Other species
The seasonal other species (%) of the species mixtures over-sown using different establishment methods during the trial period is shown in Table 8. This component consisted primarily other naturalised grasses such as of Bromus catharticus, Paspalum notatum and Eragrostis plana. The highest “other” content during year 1 occurred during winter for the fescue mixture established using the planter+paraquat method, with a similar content for fescue and cocksfoot established using the planter and cocksfoot established using the rotavator. These treatments tended to have a lower sown grass content during the same period. During year 1 the “other” content of the Cocksfoot/planter, Fescue/planter and Fescue/paraquat+planter treatments were highest or similar to the highest within all seasons. During year two a similar trend was apparent for the Fescue/rotavator, Italian ryegrass/rotavator and Fescue/paraquat+planter method, while during year 3 it only occurred for the Fescue/planter treatment. It thus appears that where the competition from the sown species was lowered (Fescue treatments) or where cultivation occurred, it resulted in a higher contribution of volunteer grass species.

34
Conclusions
Alternative kikuyu based systems, based on over-sowing the kikuyu with temperate perennial grasses and legumes could hold potential for dairy production systems in the region. These systems are, however, complex in terms of changes and interactions between pasture production and botanical composition. Where grass competition during the establishment period was lower, either due to the companion grass itself (Tall fescue or cocksfoot) or the establishment method (cultivation or herbicide), clover content was higher. However, these treatments also tended to have lower DM yields during the first year and had a higher content of voluntary grasses (“other”). However, all treatments tended to show a decline in clover content and pasture dry matter yield potential over years. Management strategies that can either improve the production potential or clover component in these pasture systems thus need to be developed.
References
Bartholomew P. 2005. Comparison of Conventional and Minimal Tillage for Low-Input Pasture Improvement. Plant management Network September 2005.
Beyers C. 1973. Bemesting van aangeplante weidings. Winterreen spesiale uitgawe, 5:64-59.
Botha P. 2002. Die gebruik van vogspanningmeters vir besproeiing-skeduleering by weidings. Weidingskursusbundel Inligtingsbundel 2002 (pp. 141-149). George, Western Cape: Department of Agriculture: Western Cape.
Botha PR. 2003. Die produksie potensiaal van oorgesaaide kikuyu weiding in die gematigde kusgebied van die Suid-Kaap. PhD Thesis, University of the Free State, South Africa.
Botha PR, Meeske R, Snyman HA. 2008a. Kikuyu over-sown with ryegrass and clover: dry matter production, botanical composition and nutritional value. African Journal of Range and Forage Science 25: 93-101.
Botha PR, Meeske R, Snyman HA. 2008b. Kikuyu over-sown with ryegrass and clover: grazing capacity, milk production and milk composition. African Journal of Range and Forage Science 25: 103-110.Botha PR, Gerber HS, Zulu B. 2008c. Die seisoenale droëmateriaalproduksie van Kropaargras, Swenkgras en verskillende meer-en eenjarige raaigrasspesies. Proceedings of Outeniqua Research Farm Information Day 2008. Western Cape Department of Agriculture, South Africa.
Botha PR. 2011. Kikuyu over-sown with different ryegrass species or clover: Recent research. Outeniqua Pasture Course 2011 Book. Department of Agriculture: Western Cape.
Botha PR. 2012. Factors affecting the persistence and production potential of kikuyu (Pennisetum clandestinum) over-sown with different ryegrass and clover species in the southern cape of South Africa. Information Brochure: Factors affecting the persistence and production potential of leguems in grass-legume pastures. Department of Agriculture: Western Cape. 16 January 2012.
Brock J, Hay M. 2001. White clover performance in sown pastures: A biological/ecological perspective. Proceedings of the New Zealand Grassland Association 63 (pp. 73-83). New Zealand Grassland Association.
Charles G, Blair G, Andrews A. 1992. The effects of sowing time, sowing technique and grazing on tall fescue establishment. Australian journal of Experimental Agriculture 32:627-632.
Colman RL, Kaiser AG. 1974. The effect of stocking rate on milk production from kikuyu grass pastures fertilised with nitrogen. Australian Journal of Experimental Agriculture and Animal Husbandry 14: 155-160.

35
Cransberg L, & McFarlane D. (1994). Can perennial pastures provide the basis for sustainable farming system in southern Australia. New Zealand Journal of Agricultural Research 37: 287-294.
Davison TM, Frampton PJ, Orr WN, Silver BA, Martin P, McLachlan B. 1997a. An evaluation of kikuyu-clover pastures as a dairy production system 1. Pasture and diet. Tropical Grasslands 31: 1-14
Fulkerson WJ, Reeves M. 1996. Management and productivity of white clover in a kikuyu grass sward in subtropical Australia. Proceedings of the New Zealand Grassland Association (pp. 199-201). New Zealand Grassland Association.
Fulkerson WJ, Lowe KJ, Ayres JF, Launders TT. 1993a. Northern dairy feedbase 2001 3. Winter pastures and crops. Tropical Grasslands 27: 162-179.
Gibson D, Newman J. 2001. Festuca arundinacea Schreber (F. elatior L. ssp. arundinacea (Schreber) Hackel). Journal of Ecology, 89:304-324.
Goodchild IK, Thurbon PN, Sinnick R, Shepherd R. 1982. Effect of land preparation and nitrogen fertilizer on the yield and quality of temperate species introduced into tropical grass sward during autumn. Australian Journal of Experimental Agriculture and Animal Husbandry 22: 88-94.
Graham P, Vance C. 2003. Legumes: Importance and constraints to greater use. Plant Physiology 131: 972-877.
Hume DE, Chapman DF. Oversowing of five grass species and white clover on Taupo hill country pumice soil. New Zealand Journal of Agricultural Research 36:309-322.
Laidlaw A, Teuber N. 2001. Temperate forage-legume mixtures: advances and perspectives. Proceedings of the International Grasslands Organization Congress XIX. Soa Paulo, Brazil: International Grassland Organization.
Marais JP. 2001. Factors affecting the nutritive value of kikuyu grass (Pennisetum clandestinum) -a review. Tropical Grasslands 35: 65-84.
Moot D, Scott W, Roy A, Nicholls A. 2000. Base temperature and thermal time requirements for germination and emergence of temperate pasture species. New Zealand Journal of Agricultural Research 43:15-25.
Neal J, Fulkerson W, Lawrie R, Barchia M. 2009. Difference in yield and persistence among perennial forages used by the dairy industry under optimum and deficit irrigation. Crop and Pasture Science, 60:1071-1087.
Nie Z, Chapman D, Tharmaraj J, Clements R. 2004. Effects of pasture mixture, management, and environments on the persistence of dairy pastures in south-west Victoria 2. Plant population density and persistence. Australian Journal of Agricultural Research 55:637-643.
Nie Z, Miller S, Moore G, Hackney B, Boschma S, Reed KFM, Mitchell M, Albertsen TO, Clark S, Craig AD, Kearney G, Li GD, Dear BS. 2008. Field evaluation of perennial grasses and herbs in southern Australia 2. Persistence, root characteristics and summer activity. Australian Journal of Experimental Agriculture, 48:424-435.
Reeves M. 1997. Milk production from kikuyu. PhD Thesis, University of Sydney, Australia.

36
Stige L, Stave J, Chan K, Cianelli L, Pettorellie N, Glantz M, Herren H, Stenseth NC. 2006. The effect of climate variation on agro-pastoral production in Africa. Proceedings of the National Academy of Sciences of the United States of America 108:8049-8058.
Tubiello F, Soussana J, Howden S. 2007. Crop and pasture response to climate change. Proceedings of the national academy of sciences of the United States of America 104: 19686-19690.
Scott J, Lodge G, McCormick L. 2000. Economics of increasing the persistence of sown pastures: costs, stocking rate and cashflow. Australian Journal of Experimental Agriculture 40:313-323.
Van der Colf 2011. The production potential of Kikuyu (Pennisetum clandestinum) pastures over-sown with ryegrass (Lolium spp.). MSc Dissertation: University of Pretoria, South Africa.

37
Tabl
e 3.
The
tota
l sea
sona
l DM
yie
ld (t
DM
/ha
) of k
ikuy
u ov
er-s
own
with
gra
ss/le
gum
e us
ing
diff
eren
t met
hod
s.
Trea
tmen
tYe
ar 1
Year
2Ye
ar 3
ME
Win
ter
Sprin
g Su
mm
erA
utum
nW
inte
r Sp
ring
Sum
mer
A
utum
n W
inte
r Sp
ring
Sum
mer
A
utum
nC
P2.
07fg
h3.
86c
6.23
b2.
41d
efgh
1.58
rst
2.92
klm
nop
4.37
cdef
gh2.
74m
nop
q0.
58o
3.83
ab
3.44
ab
cd1.
75hi
jkl
FP
1.76
h2.
67cd
efgh
6.36
b2.
66cd
efgh
1.17
t2.
84lm
nop
q4.
93a
bc
3.11
jklm
no0.
74m
no3.
28a
bcd
2.92
cde
1.48
hijk
lmno
PP
2.62
cdef
gh3.
48cd
ef7.
00a
b3.
43cd
ef2.
37op
qrs
4.67
bcd
ef5.
39a
b3.
79ef
ghijk
l1.
15hi
jklm
no3.
84a
b4.
05a
2.05
efgh
IP
2.47
cdef
gh3.
31cd
efg
6.98
ab
2.79
cdef
gh2.
03p
qrs
t3.
50hi
jklm
n4.
75a
bcd
e3.
34ijk
lmno
0.94
klm
no3.
27a
bcd
2.76
def
g1.
98fg
hi
CR
2.30
efgh
3.73
cd6.
52b
2.35
def
gh1.
13t
3.68
fghi
jklm
4.35
cdef
ghi
2.53
nop
qr
0.63
no3.
38a
bcd
3.09
bcd
1.80
hijk
FR
1.62
h3.
29cd
efg
6.32
b2.
36d
efgh
1.63
rst
3.35
ijklm
no4.
53b
cdef
g3.
78ef
ghijk
l1.
05jk
lmno
3.30
ab
cd3.
27a
bcd
1.79
hijk
l
PR
2.42
def
gh3.
49cd
ef7.
21a
b2.
28ef
gh1.
44st
2.93
klm
nop
4.35
cdef
ghi
3.32
jklm
no1.
13ijk
lmno
3.33
ab
cd3.
02b
cd1.
57hi
jklm
IR
2.48
cdef
gh3.
26cd
efg
6.24
b1.
98gh
1.69
rst
3.48
hijk
lmn
4.85
ab
cd3.
33jk
lmno
1.07
ijklm
no3.
20a
bcd
3.36
ab
cd1.
96fg
hi
CPP
2.49
cdef
gh3.
88c
8.23
a2.
96cd
efgh
1.86
qrs
t3.
50hi
jklm
n5.
75a
3.86
def
ghijk
1.05
jklm
no3.
55a
bcd
3.61
ab
cd2.
04ef
gh
FPP
2.07
fgh
3.74
cd7.
55a
b2.
67cd
efgh
1.40
st3.
67fg
hijk
lm4.
54b
cdef
g3.
33jk
lmno
0.75
mno
2.85
def
3.36
ab
cd1.
50hi
jklm
n
PPP
3.00
cdef
gh3.
90c
6.41
b2.
64cd
efgh
1.55
rst
4.02
cdef
ghij
4.39
bcd
efgh
3.58
ghijk
lm1.
42hi
jklm
no3.
86a
b3.
77a
b1.
58hi
jklm
IPP
3.26
cdef
g3.
51cd
e7.
13a
b2.
52cd
efg
1.86
qrs
t3.
78ef
ghijk
l4.
53b
cdef
g2.
96kl
mno
p0.
89lm
no3.
38a
bcd
3.57
ab
cd1.
87gh
ij
LSD
(0.0
5)1.
428
1.01
30.
901
ab
c…M
eans
with
no
com
mon
sup
ersc
ript d
iffer
sign
ifica
ntly
LSD
(0.0
5) c
ompa
res o
ver s
easo
ns a
nd tr
eatm
ents
with
in y
ears
M: M
ixtu
reC
= C
ocks
foot
/clo
ver
F =
Tall
Fesc
ue/c
love
rI=
Ital
ian
ryeg
rass
/clo
ver
P=Pe
renn
ial r
yegr
ass
/clo
ver
E: E
stab
lishm
ent m
etho
dP
= Pl
ant
erR=
Rot
ava
tor
PP =
Pla
nter
+ p
ara
qua
t

38
Tabl
e 4.
The
tota
l ann
ualD
M y
ield
(t D
M/h
a) o
f kik
uyu
over
-sow
n w
ith g
rass
/legu
me
usin
g d
iffer
ent m
etho
ds.
Trea
tmen
tYe
ar 1
Year
2Ye
ar 3
Tota
lM
EC
P14
.6b
cdef
11.6
ghijk
l9.
60jk
lmn
35.8
ab
c
FP
13.4
cdef
gh12
.1fg
hij
8.42
n33
.9c
PP
16.5
ab
16.2
ab
11.1
hijk
lm43
.8a
IP
15.5
ab
cde
13.6
cdef
gh8.
94m
n38
.1a
bc
CR
14.9
bcd
e11
.7gh
ijk8.
91m
n35
.5b
c
FR
13.6
cdef
gh13
.3d
efgh
9.40
klm
n36
.3a
bc
PR
15.4
ab
cde
12.0
fghi
j9.
05lm
n36
.5a
bc
IR
14.0
bcd
efg
13.3
def
gh9.
59jk
lmn
36.9
ab
c
CPP
17.6
a15
.0a
bcd
e10
.3jk
lmn
42.8
ab
FPP
16.0
ab
c12
.9ef
ghi
8.46
n37
.4a
bc
PPP
16.0
ab
cd13
.5cd
efgh
10.6
ijklm
n40
.1a
bc
IPP
16.4
ab
13.1
efgh
i9.
72jk
lmn
39.3
ab
c
LSD
(0.0
5)2.
607
8.33
4a
bc…
Mea
ns w
ith n
o co
mm
on su
per
scrip
t diff
er si
gnifi
cant
lyLS
D (0
.05)
com
pare
s ove
r yea
rs a
nd tr
eatm
ents
M: M
ixtu
reC
= C
ocks
foot
/clo
ver
F =
Tall
Fesc
ue/c
love
rI=
Ital
ian
ryeg
rass
/clo
ver
P=Pe
renn
ial r
yegr
ass
/clo
ver
E: E
stab
lishm
ent m
etho
dP
= Pl
ant
erR=
Rot
ava
tor
PP =
Pla
nter
+ p
ara
qua
t

39
Tabl
e 5.
The
seas
onal
clo
ver
cont
ent
(%)
of k
ikuy
u ov
er-s
own
with
va
rious
gra
ss-le
gum
e m
ixtu
res
usin
g d
iffer
ent
esta
blish
men
t m
etho
dsd
urin
g ye
ar 1
to y
ear 3
.
Trea
tmen
tYe
ar 1
Year
2Ye
ar 3
ME
Win
ter
Sprin
gSu
mm
er
Aut
umn
Win
ter
Sprin
gSu
mm
er
Aut
umn
Win
ter
Sprin
gSu
mm
er
Aut
umn
CP
17.3
klm
nopq
31.0
efgh
ijkl
41.3
bcde
fghi
28.7
fghi
jkl
3.00
l12
.7fg
hijk
l14
.0fg
hijk
l0.
67l
1.50
j26
.3ab
cde
24.0
abcd
efg
16.0
abcd
efgh
ij
FP
4.67
pq39
.3cd
efgh
ij35
.7de
fghi
jk28
.3fg
hijk
lm5.
00jkl
19.0
cdef
ghi
14.5
efgh
ijkl
2.3l
0.50
j4.
00hi
j23
.0ab
cdef
g9.
33ef
ghij
PP
6.00
pq30
.5ef
ghijk
l39
.0cd
efgh
ij27
.0hi
jklm
n5.
00jkl
19.0
cdef
ghi
28.0
abcd
e8.
00hi
jkl3.
50hi
j29
.5ab
c34
.0a
25.5
abcd
ef
IP
3.00
q28
.7fg
hijk
l44
.7bc
defg
h23
.3ijk
lmno
p7.
00hi
jkl31
.7ab
cd22
.0bc
defg
2.67
l0.
50j
18.0
abcd
efgh
ij30
.7ab
25.5
abcd
ef
CR
11.0
lmno
pq34
.7de
fghi
jk60
.0ab
47.0
bcde
fg12
.7fg
hijk
l12
.3fg
hijk
l12
.0fg
hijk
l2.
67l
0.00
j13
.7bc
defg
hij
17.7
abcd
efgh
ij23
.3ab
cdef
g
FR
31.3
efgh
ijk57
.5ab
c57
.7ab
c33
.3ef
ghijk
18.3
cdef
ghijk
34.0
ab41
.0a
5.00
jkl0.
67j
13.3
bcde
fghi
j13
.0bc
defg
hij
7.00
ghij
PR
7.33
nopq
32.5
efgh
ijk49
.3bc
de40
.7bc
defg
hi12
.3fg
hijk
l20
.3bc
defg
h31
.0ab
cd5.
00jkl
2.67
hij
10.3
efgh
ij17
.3ab
cdef
ghij
6.67
ghij
IR
7.67
nopq
38.3
cdef
ghij
69.7
a54
.3ab
cd7.
00hi
jkl11
.7fg
hijk
l9.
50fg
hijk
l2.
67l
0.67
j14
.3bc
defg
hij
23.7
abcd
efg
20.3
abcd
efgh
i
CPP
16.0
klm
nopq
32.5
efgh
ijk47
.5bc
def
32.5
efgh
ijk4.
50kl
13.0
fghi
jkl
18.0
cdef
ghij
2.00
l1.
00j
23.5
abcd
efg
12.5
defg
hij
7.50
fghi
j
FPP
8.33
mno
pq47
.3bc
def
50.7
abcd
e35
.3de
fghi
jk9.
33gh
ijkl
23.3
bcde
f18
.50c
defg
hij
2.67
l2.
00j
12.3
cdef
ghij
14.3
bcde
fghi
j2.
33ij
PPP
6.67
opq
26.7
hijkl
mno
45.0
bcde
fgh
40.3
bcde
fghi
13.3
fghi
jkl
22.7
bcde
fg20
.0cd
efgh
3.00
l3.
33hi
j10
.3ef
ghij
20.3
abcd
efgh
i11
.0de
fghi
j
IPP
6.33
pq20
.0jkl
mno
pq57
.3ab
c42
.0bc
defg
hi13
.3fg
hijk
l32
.0ab
c12
.5fg
hijk
l6.
00ijk
l0.
00j
28.7
abcd
23.7
abcd
efg
20.7
abcd
efgh
LSD
(0.0
5)20
.168
13.8
4818
.072
ab
c…M
eans
with
no
com
mon
sup
ersc
ript d
iffer
sign
ifica
ntly
LSD
(0.0
5) c
ompa
res o
ver s
easo
ns a
nd tr
eatm
ents
with
in y
ears
M: M
ixtu
reC
= C
ocks
foot
/clo
ver
F =
Tall
Fesc
ue/c
love
rI=
Ital
ian
ryeg
rass
/clo
ver
P=Pe
renn
ial r
yegr
ass
/clo
ver
E: E
stab
lishm
ent m
etho
dP
= Pl
ant
erR=
Rot
ava
tor
PP =
Pla
nter
+ p
ara
qua
t

40
Tabl
e 6.
The
sea
sona
l sow
n gr
ass
(%) o
f kik
uyu
over
-sow
n w
ith v
ario
us g
rass
-legu
me
mix
ture
s us
ing
diff
eren
t est
ablis
hmen
t met
hod
s d
urin
g ye
ar 1
to y
ear 3
.
Trea
tmen
tYe
ar 1
Year
2Ye
ar 3
ME
Win
ter
Sprin
gSu
mm
er
Aut
umn
Win
ter
Sprin
gSu
mm
er
Aut
umn
Win
ter
Sprin
gSu
mm
er
Aut
umn
CP
5.3l
m13
.0gh
ijklm
12.3
ghijk
lm4.
33lm
54.3
3abc
35.0
cdef
ghi
25.5
efgh
ijk19
.0fg
hijk
52.0
bcde
fgh
25.3
ijklm
nopq
r22
.7jkl
mno
pqr
26.3
hijkl
mno
pqr
FP
27.3
efgh
i13
.3gh
ijklm
1.00
m4.
67lm
71.7
a24
.0fg
hijk
5.50
jk1.
33k
28.0
hijkl
mno
pqr
6.00
qr5.
33r
7.67
pqr
PP
65.0
ab40
.0cd
e17
.0gh
ijklm
6.50
klm
43.0
bcde
fg52
.0ab
cd9.
00ijk
5.50
jk74
.5ab
c60
.0ab
cdef
g31
.5hi
jklm
nopq
13.0
nopq
r
IP
48.7
bcd
59.0
ab12
.7gh
ijklm
7.33
jklm
51.0
abcd
e28
.0de
fghi
j9.
00ijk
1.33
k75
.0ab
c44
.7ef
ghijk
6.33
qr15
.0m
nopq
r
CR
15.0
ghijk
lm20
.0fg
hijk
l24
.3ef
ghijk
18.3
ghijk
lm67
.3ab
52.0
abcd
56.5
abc
60.0
abc
72.0
abcd
62.0
abcd
ef42
.0fg
hijk
l24
.3ijk
lmno
pqr
FR
12.0
ghijk
lm17
.0gh
ijklm
13.0
ghijk
lm17
.0gh
ijklm
17.0
ghijk
25.0
efgh
ijk5.
00jk
16.3
hijk
69.3
abcd
e46
.0ef
ghij
8.67
pqr
21.0
jklm
nopq
r
PR
51.3
abc
51.5
abc
29.3
efgh
16.3
ghijk
lm54
.0ab
cd52
.0ab
cd19
.5fg
hijk
17.0
ghijk
80.7
a51
.67c
defg
h32
.3hi
jklm
nop
19.3
klm
nopq
r
IR
69.0
a54
.0ab
c5.
33lm
6.67
klm
59.7
abc
54.3
abc
12.5
ijk4.
67jk
77.7
ab37
.3fg
hijk
lmn
9.00
pqr
5.33
r
CPP
10.0
ijklm
30.0
defg
5.50
lm11
.0hi
jklm
74.0
a59
.0ab
c24
.5fg
hijk
24.0
fghi
jk59
.0ab
cdef
g48
.5de
fghi
42.5
fghi
jk31
.5hi
jklm
nopq
FPP
6.00
klm
9.33
ijklm
7.00
klm
9.33
ijkm
14.7
hijk
24.3
fghi
jk3.
00jk
13.3
ijk59
.0ab
cdef
g35
.7gh
ijklm
no10
.7op
qr22
.7jkl
mno
pqr
PPP
37.7
cdef
26.0
efgh
ij19
.7fg
hijk
lm11
.7gh
ijklm
25.3
efgh
ijk44
.7bc
def
9.50
ijk11
.7ijk
42.0
fghi
jkl
39.7
fghi
jklm
8.67
pqr
16.3
lmno
pqr
IPP
65.0
ab68
.3a
5.00
lm11
.0hi
jklm
54.0
abcd
39.7
cdef
gh8.
00jk
3.67
jk75
.0ab
c39
.3fg
hijk
lm8.
00pq
r6.
00qr
LSD
(0.0
518
.739
26.2
4825
.765
ab
c…M
eans
with
no
com
mon
sup
ersc
ript d
iffer
sign
ifica
ntly
LSD
(0.0
5) c
ompa
res o
ver s
easo
ns a
nd tr
eatm
ents
with
in y
ears
M: M
ixtu
reC
= C
ocks
foot
/clo
ver
F =
Tall
Fesc
ue/c
love
rI=
Ital
ian
ryeg
rass
/clo
ver
P=Pe
renn
ial r
yegr
ass
/clo
ver
E: E
stab
lishm
ent m
etho
dP
= Pl
ant
erR=
Rot
ava
tor
PP =
Pla
nter
+ p
ara
qua
t

41
Tabl
e 7.
The
seas
onal
kik
uyu
cont
ent
(%)
of k
ikuy
u ov
er-s
own
with
va
rious
gra
ss-le
gum
e m
ixtu
res
usin
g d
iffer
ent
esta
blish
men
t m
etho
ds d
urin
g ye
ar 1
to y
ear 3
.
Trea
tmen
tYe
ar 1
Year
2Ye
ar 3
ME
Win
ter
Sprin
gSu
mm
er
Aut
umn
Win
ter
Sprin
gSu
mm
er
Aut
umn
Win
ter
Sprin
gSu
mm
er
Aut
umn
CP
3.63
kl2.
43kl
15.4
efgh
ijkl
29.4
bcde
23.0
fghi
jklm
n4.
97kl
mn
16.6
hijkl
mn
35.8
cdef
ghi
11.4
hijkl
mn
2.17
n13
.0hi
ijklm
n29
.1cd
efgh
ijk
FP
0.33
l2.
03kl
21.6
cdef
ghij
22.9
cdef
ghi
4.00
lmn
6.80
jklm
n19
.3gh
ijklm
n33
.5cd
efgh
ij17
.4ef
ghijk
lmn
5.70
jklm
n23
.2de
fghi
jklm
n19
.6ef
ghijk
lmn
PP
0.90
l1.
75l
22.7
cdef
ghi
55.9
a28
.8fg
hijk
lm16
.6hi
jklm
n46
.2bc
defg
80.7
a4.
65lm
n3.
15n
25.1
cdef
ghijk
lmn
55.5
ab
IP
4.47
jkl1.
80l
25.1
cdef
gh37
.2bc
28.1
fghi
jklm
11.1
ijklm
n40
.6bc
defg
h65
.4ab
15.6
fghi
jklm
n4.
20lm
n29
.5cd
efgh
ijk49
.1ab
c
CR
1.37
l0.
43l
5.33
ijkl
14.8
ghijk
l0.
43n
7.07
jklm
n6.
15kl
mn
12.4
ijklm
n2.
20n
5.20
klm
n10
.7hi
jklm
n30
.0cd
efgh
ij
FR
0.90
l1.
20l
8.40
hijkl
22.4
cdef
ghi
7.80
jklm
n13
.6ijk
lmn
11.9
ijklm
n27
.3fg
hijk
lmn
4.00
mn
6.40
ijklm
n30
.4cd
efgh
i39
.7ab
cdef
g
PR
0.23
l0
l9.
43gh
ijkl
26.9
bcde
fg3.
87lm
n5.
63kl
mn
11.7
ijklm
n55
.8ab
cde
2.13
n1.
77n
31.3
bcde
fgh
45.1
abcd
IR
0l
0l
5.40
ijkl
11.4
fghi
jkl
1.67
mn
7.17
jklm
n19
.9gh
ijklm
n49
.4bc
def
4.57
lmn
13.8
hijkl
mn
15.5
ghijk
lmn
28.5
cdef
ghijk
l
CPP
0.15
l0.
95l
27.6
bcde
f44
.0ab
8.15
jklm
n6.
90jkl
mn
30.1
efgh
ijkl
49.4
bcde
f33
.3bc
defg
h10
.7hi
jklm
n27
.7cd
efgh
ijklm
41.7
abcd
e
FPP
0.90
l0.
30l
15.9
defg
hijkl
25.9
cdef
gh20
.7gh
ijklm
n15
.2hi
jklm
n9.
80ijk
lmn
31.6
defg
hijk
6.85
ijklm
n3.
00n
17.2
fghi
jklm
n24
.8cd
efgh
ijklm
n
PPP
4.33
jkl0
l9.
53gh
ijkl
26.5
bcde
fg7.
53jkl
mn
4.50
lmn
16.9
hijkl
mn
57.2
abcd
9.30
hijkl
mn
10.4
hijkl
mn
12.7
hijkl
mn
40.0
abcd
ef
IPP
0.30
l0.
13l
19.4
defg
hijk
33.2
bcd
7.13
jklm
n6.
87jkl
mn
49.7
bcde
f58
.57a
bc3.
50m
n5.
83jkl
mn
44.1
abcd
60.5
a
LSD
(0.0
5)24
.373
26.9
1424
.373
ab
c…M
eans
with
no
com
mon
sup
ersc
ript d
iffer
sign
ifica
ntly
LSD
(0.0
5) c
ompa
res o
ver s
easo
ns a
nd tr
eatm
ents
with
in y
ears
M: M
ixtu
reC
= C
ocks
foot
/clo
ver
F =
Tall
Fesc
ue/c
love
rI=
Ital
ian
ryeg
rass
/clo
ver
P=Pe
renn
ial r
yegr
ass
/clo
ver
E: E
stab
lishm
ent m
etho
dP
= Pl
ant
erR=
Rot
ava
tor
PP =
Pla
nter
+ p
ara
qua
t

42
Tabl
e 8.
The
seas
onal
oth
er c
onte
nt (
%)
of k
ikuy
u ov
er-s
own
with
var
ious
gra
ss-le
gum
e m
ixtu
res
usin
g d
iffer
ent
esta
blis
hmen
t m
etho
ds d
urin
g ye
ar 1
to y
ear 3
.
Trea
tmen
tYe
ar 1
Year
2Ye
ar 3
ME
Win
ter
Sprin
gSu
mm
er
Aut
umn
Win
ter
Sprin
gSu
mm
er
Aut
umn
Win
ter
Sprin
gSu
mm
er
Aut
umn
CP
73.7
ab
54.0
bcd
ef30
.3ef
ghijk
lmno
37.7
efgh
ijklm
n19
.3kl
mn
46.6
ab
cdef
ghij
43.5
ab
cdef
ghijk
l44
.7a
bcd
efgh
ijk35
.0b
cdef
ghijk
lm46
.7b
cdef
ghi
40.3
bcd
efgh
ijk29
.0cd
efgh
ijklm
FP
67.7
ab
cd45
.7d
efgh
i41
.7ef
ghijk
lm44
.7d
efgh
ij19
.0kl
mn
50.3
ab
cdef
ghi
60.0
ab
62.7
ab
53.5
bcd
83.5
a48
.7b
cdef
g63
.0a
b
PP
28.0
ghijk
lmno
28.0
ghijk
lmno
21.0
ijklm
no10
.5o
23.5
ijklm
n12
.0m
n17
.0lm
n6.
00m
n17
.5ijk
lm6.
50lm
9.50
lm6.
00m
IP
43.7
def
ghijk
10.3
o17
.3lm
no31
.7ef
ghijk
lmno
13.0
mn
29.0
fghi
jklm
n28
.5gh
ijklm
n30
.3d
efgh
ijklm
n9.
00lm
33.0
cdef
ghijk
lm33
.0cd
efgh
ijklm
11.0
klm
CR
72.7
ab
c45
.0d
efgh
ij10
.0o
19.7
jklm
no19
.7jk
lmn
28.0
ghijk
lmn
25.0
hijk
lmn
25.0
hijk
lmn
25.5
def
ghijk
lm19
.0hi
jklm
n29
.7cd
efgh
ijklm
22.3
efgh
ijklm
FR
55.7
bcd
e23
.5hi
jklm
no20
.7ijk
lmno
27.7
ghijk
lmno
57.0
ab
cd27
.3fg
hijk
lmn
42.0
ab
cdef
ghijk
l51
.7a
bcd
efgh
26.3
def
ghijk
lm35
.0b
cdef
ghijk
lm48
.0b
cdef
gh32
.3cd
efgh
ijklm
PR
41.3
efgh
ijklm
16.0
mno
12.0
o16
.0m
no29
.7fg
hijk
lmn
21.7
jklm
n38
.0b
cdef
ghijk
lm22
.0jk
lmn
14.7
klm
35.7
bcd
efgh
ijkl
18.7
hijk
lmn
29.0
cdef
ghijk
lm
IR
23.7
hijk
lmno
7.67
o19
.7jk
lmno
27.3
ghijk
lmno
31.7
cdef
ghijk
lmn
26.3
ghijk
lmn
58.0
ab
c43
.7a
bcd
efgh
ijkl
17.0
jklm
34.7
bcd
efgh
ijklm
51.7
bcd
e45
.3b
cdef
ghij
CPP
73.5
ab
37.0
efgh
ijklm
n19
.5jk
lmno
13.0
no13
.0m
n21
.5jk
lmn
27.5
fghi
jklm
n25
.0hi
jklm
n6.
50lm
17.0
jklm
17.0
jklm
19.5
ghijk
lm
FPP
84.7
a43
.0d
efgh
ijkl
26.3
ghijk
lmno
29.7
fghi
jklm
no55
.7a
bcd
e37
.3b
cdef
ghijk
lm68
.5a
52.7
ab
cdef
g31
.5cd
efgh
ijklm
48.7
bcd
efg
57.7
ab
c50
.0b
cdef
PPP
51.3
bcd
eg47
.3cd
efgh
25.7
ghijk
lmno
21.3
ijklm
no54
.0a
bcd
ef28
.0gh
ijklm
n53
.5a
bcd
ef27
.7fg
hijk
lmn
45.7
bcd
efgh
ij39
.7b
cdef
ghijk
58.0
ab
c33
.0cd
efgh
ijklm
IPP
28.3
fghi
jklm
n11
.0o
18.3
klm
no14
.0no
25.0
hijk
lmn
21.3
jklm
n29
.5fg
hijk
lmn
31.7
cdef
ghijk
lmn
21.5
fghi
jklm
26.3
def
ghijk
lm24
.7d
efgh
ijklm
12.7
klm
LSD
(0.0
5)25
.927
.162
23.3
93
ab
c…M
eans
with
no
com
mon
sup
ersc
ript d
iffer
sign
ifica
ntly
LSD
(0.0
5)co
mpa
res o
ver s
easo
ns a
nd tr
eatm
ents
with
in y
ears
M: M
ixtu
reC
= C
ocks
foot
/clo
ver
F =
Tall
Fesc
ue/c
love
rI=
Ital
ian
ryeg
rass
/clo
ver
P=Pe
renn
ial r
yegr
ass
/clo
ver
E: E
stab
lishm
ent m
etho
dP
= Pl
ant
erR=
Rot
ava
tor
PP =
Pla
nter
+ p
ara
qua
t

43
What do we know about forage chicory (Cichorium intybus) and plantain (Plantago lanceolata)?
Sigrun AmmannWestern Cape Department of Agriculture, Outeniqua Research Farm, P.O. Box 249,
George, 6530.
Forage chicory (Cichorium intybus) and plantain (Plantago lanceolata), fall into the category of new technology that farmers have adopted even though there is no local research on these species yet. They are also species that have for a while been known by pasture scientist to have
a potential role for the summer and autumn and should thus be evaluated. Their deep root system is also an advantage that not many pasture species that are currently used in our dairy pastures possess.
Origin of chicory (Cichorium intybus) and plantain (Plantago lanceolata)
Chicory belongs to the Asteraceae (daisy) family with its origin in Europe, central and western Asia and North Africa (Agfact 2000; Koch et al 1999) and according to Li and Kemp (2005) also America. It has been cultivated for many centuries as a food and feed source, as a vegetable, the root as a coffee substitute, as a source of fructose and for medicinal purposes (Agfact 2000; Koch et al 1999; to Li and Kemp 2005; Moloney and Milne 1993).
According to Feedipedia (FAO 2012-2015) plantain or ribwort has its origin in Europe and central Asia. It has become a cosmopolitan and naturalized plant in tropical and southern Africa, Madagascar, Australia, New Zealand, Canada, South America and West Indies. In the USA it is classified as a noxious weed.
Plantain also known as narrow leaf plantain or ribgrass according to Stewart (1996) has a long history of being used in Europe as a minor forage plant and has occurred naturally in many pastures. In his paper Stewart (1996) recommends that forage herbs such as plantain are investigated as a possibility to be used as a component of pastures.

44
Morphology and ecophysiology
Chicory has broad prostrate leaves in the formation of a rosette which then become more upright in the warmers growing season (Li and Kemp 2005; Stewart et al 2014). During the first growing season the plant is single-crowned but becomes multi-crowned during the second growing season. The plant has a deep taproot (Li and Kemp 2005, Stewart et al 2014). The leaves have short stalks and according to Agfact (2000) the plants become multi-crowned when they are grazed. Chicory requires a period of vernalization to change from vegetative to reproductive (AgFacts 2000; Lee et al 2015a; Li and Kemp 2005). Demeulermeester and De Proft (1999) report the minimum vernalization requirement to be 4°C for three weeks. However this may not be the case for all varieties. According to Li and Kemp (2005) from bolting initiation to first flowers takes between 400 and 1030 growing degree days with a base temperature of 5ºC. The flowers colour is blue or pale pink (Stewart et al 2014). There is thus variability between genotypes. Chicory has 850 000 seeds/kg and should be planted at a shallow depth of 10 to 12mm (Stewart et al 2014). Chicory requires a soil temperature above 12ºC for good germination and the first grazing should only be after seven true leaves have developed (Agricom 2015).
Plantain is a stemless perennial plant with a thick rhizome and fibrous roots. The leaves are also in a rosette form which is very dense and the leaves are lanceolate in shape. The inflorescence is a short spike with white flowers producing small dark brown seeds that are mucilaginous when wet (FAO Feedipedia 2012-2015). The weedy type of plantain has a prostrate growth habit while the bred varieties have from a semi-erect to very erect growth habit, with larger leaves and less winter dormancy (Stewart 1996). Plantain has 500 000 seeds/kg and requires a shallow sowing depth of less than 10 to 12mm (Stewart et al 2014; Agricom 2012).
Both chicory and plantain are drought tolerant as research by Langworthy et al (2015) and Cave et al (2013) has shown. Langworthy et al (2015) showed how chicory has the ability to recover after combined heat and moisture stress which caused perennial ryegrass to die. Chicory has a high photochemical efficiency in the PSII photosystem. Cave et al (2013) showed that both chicory and plantain have the ability of compensatory growth after severe moisture stress with plantain yielding more than chicory under both optimal and stress conditions.
Chicory contains compounds known as sesquiterpene lactones which can taint milk but also acts as an insect defence in the plants (Lee et al 2015; Rumball et al 2003). Two of these compounds are lactucin and lactucopicrin. In the breeding of the variety “Choice” these two compounds were deliberately reduced (Rumball et al 2003). The same was done for the variety “Grouse” (Lee et al 2015a).
Pasture management, production and agronomics
Lee et al (2015a) have done extensive work on management strategies for chicory and plantain. The first harvest for chicory should be done when seven fully developed leaves are present and for plantain six fully developed leaves. Thereafter maximum dry matter production can be achieved by harvesting at specified extended leaf heights. For chicory this is between 350 and 550mm while plantain leaves should be at 450mm. In the second year after vernalization there is more stem production which reduces the forage quality. The grazing management should thus try to reduce the stem production. The chicory and plantain should then be grazed at a leaf extension length of 350mm. These leaf lengths and associated grazing intervals take carbohydrate reserve replenishment into account. The research by Lee et al (2015b) found that pre-defoliation carbohydrate reserves levels are replenished at different rates in the roots and the shoots and can also be quantified in growing degree days. Taking the carbohydrate reserve replenishment into account, chicory should not be grazed before 21 days after defoliation or 310 growing degree days and plantain 35 days or 532 growing degree days. I chicory and plantain the primary storage organ for carbohydrate reserves are the root while in grasses it is the stubble and the plant base.

45
Chicory and plantain both need nitrogen fertilization for good growth (Li and Kemp 2005; Stewart 1996). Total N recovery in chicory was found to be 80% over the season (Li and Kemp 2005), which is probably assisted by the deep root system. N fertilization will vary also depending on whether there is a legume in the mixture.
Persistence of chicory and plantain will depend on the grazing management and also on the variety. Almeseged et al (2003) investigated grazing management and persistence of chicory and also the related productivity. The authors found the plant density declining in all treatments except the treatment where the chicory was grazed for a week and rested for five weeks. The plant density did not decline but the productivity did decline. Continuous grazing caused the largest population decline. The work also found the lifespan of a chicory plant cohort to be three years.
According to the management guidelines given in AgFact (2000), the plant density of a pure chicory stand should be 50 to 60 plants m-2 and if the density falls below 20 plants m-2 the pasture would need to be re-established.
Pests and diseases
Various publications refer to insect pests and root diseases such as sclerotinia (AgFact 2000). The pests would probably vary depending on what pests are present. A common pests named by AgFact (2000) is slugs, especially in early spring growth.
Animal performance
Various animal performance data is mentioned in the review by Li and Kemp (2005). Sheep, deer and cattle are reported to have had greater liveweight gains on chicory than o perennial ryegrass/clover pastures. Milk production is also better on chicory than on grass/clover pastures but the limitation is the amount of chicory that a milking cow can consume without tainting the milk.In the publication by Minneé et al (2012), the ME values were 12.5MJ/kg DM for chicory, 11.5 for plantain and 10.5 for perennial ryegrass. The CP % was 20.6 for chicory, 20.4 for plantain and 18.8 for perennial ryegrass in their grazing experiment. The organic matter digestibility was also found to be highest in chicory and lowest in the perennial ryegrass.
Plant Breeding and varieties
For chicory plant breeding has focussed on lowering the sesquiterpene lactones (Lee et al 2015a; Rumball et al (2003) resulting in the varieties Grouse and Choice. Plant breeding also also focussed on improved cool season productivity for the varieties Grasslands Puna and Choice (Lee et al 2015a). Other varieties are Chico and Puna II.For plantain the plant breeding has focussed on more erect leaves, larger or longer leaves, improved winter and summer growth (Stewart 1996). Varieties of plantain are Grasslands Lancelot, Ceres Tonic and Lacerta.
Chicory and plantain field trials
Trials will commence at Outeniqua Research Farm on varieties and mixtures and in future also characterize the flowering behaviour of different varieties and pest and disease tolerance if necessary. Planting dates will be an important consideration and is linked to the vernalization requirements and flowering. Other important questions are how these forage herbs can fit into local pasture systems and if the forage quality will be as high as reported in other countries.

46
References
AgFact P2.5.40. 2000. Chicory. New South Wales Primary Industries Agriculture. www.dpi.nsw.gov.au/agriculture
Agricom 2012. Chicory Guide for Dairy Farms. www.agricom.co.nz
Agricom 2015. Herb and Legume Guide. www.agricom.co.nz
Almeseged Y, Kemp DR, King GW, Michalk DL, Goodacre M. 2003. The influence of grazing management on the competitiveness, persistence and productivity of chicory (Cichorium intybus L.). Australian Journal of experimental Agriculture 43: 127 – 133.
Cave LM, Kemp PD, Kenyon PR, Morris ST. 2013. Plantain (Plantago lanceolata) outperforms chicory (Cichorium intybus) under moisture stress in a glasshouse. Proceedings of the 22nd International Grassland Congress 139 -140.
Demeulemeester MAC and De Proft MP (1999) In vivo and in vitro flowering response of chicory (Cichorium intybus L.): influence of plant age and vernalization. Plant Cell Reports 9: 781–785.FAO 2012-2015. Feedipedia Animal Feed Resource Information System. www.feedipedia.org/node.114
Koch K, Andersson R, Rydberg I, Åman P. 1999. Influence of harvest date on inulin chain length distribution and sugar profile for six chicory (Cichorium intybus L.) cultivars. Journal of the Science of Food and Agriculture 79: 1503 – 1506.
Langworthy A, Pembleton K, Rawnsley R, Harrison M, Lane P, Henry D, Corkrey R. 2015. Chicory (Cichorium intybus L.) can beat the heat during summer drought in southeast Australian dairying regions. Proceedings of the 17th ASA Conference, 20 – 24 September 2015, Hobart, Australia. www.agronomy2015.com.au.
Lee JM, Hemmingson NR, Minneé EMK, Clark CEF. 2015. Management strategies for chicory (Cichorium intybus) and plantain (Plantago lanceolata): impact on dry matter yield, nutritive characteristics and plant density. Crop and Pasture science 66: 168 – 183.
Lee JM, Minneé EMK, Clark CEF. 2015. Patterns of non-structural carbohydrate and nitrogen reserves in chicory (Cichorium intybus L.) and plantain (Plantago lanceolata L.) during regrowth in summer. Crop and Pasture Science 66: 1071 – 1078.
Li G, Kemp PD. 2005. Forage chicory (Cichorium intybus L.): A review of its agronomy and animal production. Advances in Agronomy 88: 187 – 222.
Minneé EMK, Clark CEF, McAllister TB, Hutchinson KJ, Lee JM. 2012. Chicory and plantain as feeds for dairy cows in late lactation. Proceedings of the 5th Australian Dairy Science Symposium. 13 – 15 November 2012, Melbourne, Australia.
Moloney SC and Milne GD. 1993. Establishment and management of Grasslands Puna chicory used as a specialist high quality forage herb. Proceedings of the New Zealand Grassland Association 55: 113 – 118.
Rumball W, Keogh RG, Miller JE, Claydon RB. 2003. ‘Choice” chicory (Cichorium intybus L.) New Zealand Journal of Agricultural Research 46: 49 – 51.
Stewart AV. 1996. Plantain (Plantago lanceolata) – a potential pasture species. Proceedings of the New Zealand Grassland Association 58: 77 – 86.
Stewart A, Kerr G, Lissaman W, Rowarth J. 2014. Pasture and Forage Plants of New Zealand. Grassland research and Practice Series no. 8. Fourth edition.

47
Is carbon tax a reality for dairy farmers?Josef van Wyngaard1, Robin Meeske2 and Lourens Erasmus1
1Department of Animal and Wildlife Science, University of Pretoria, Private Bag X20, Hatfield, 00282Western Cape Department of Agriculture, Outeniqua Research Farm, P.O. Box 249, George, 6530
Introduction
Global warming or climate change per se transforms and threatens current and
future global natural resources. This paper gives an overview on greenhouse gasses (GHG) as global warming instigators and builds-up to the proposed South African carbon tax. Methane emissions from dairy cattle are the main focus throughout the paper. Questions such as ‘What is the methane output of a cow?’, ‘Are cows blameable for global warming?’ and ‘Is carbon
tax a reality for dairy farmers?’ are addressed. The need for a carbon tax is explained and, unfortunately, also why it might not be enough. The aim of this paper is to address inaccurate information with regards to cattle and methane emissions and to prepare the farmer for the upcoming carbon tax. A follow-up paper focuses on on-farm enteric methane mitigation strategies and how it benefits the farmer.
Greenhouse gasses
Gasses that capture or trap heat in the atmosphere are called GHGs – they keep the surface of the Earth warm by slowing the rate at which energy escapes to space. This is a natural phenomenon that has been present for millions of years. The release of natural emissions of GHG have always equalled the natural sequestration (process by which carbon dioxide is removed from the atmosphere and held in solid or liquid form) such as when plants take in carbon dioxide (CO2) during photosynthesis and release it back into the atmosphere during plant senescence. Why the sudden concern? Due to industrialisation, GHG concentrations exceeded the natural levels in the atmosphere. The atmospheric lifetime of these gasses is at least 50 years and longer. We reached the point
where greenhouse gasses are building up beyond the Earth’s threshold to sequestrate them naturally and, therefore, physically creating a hot box effect termed “global warming”. Naturally occurring GHGs with a direct global warming effect consist of CO2, methane (CH4) and nitrous oxide (N2O). Fluorinated gasses (hydrofluorocarbons, perfluorocarbons, sulphur hexafluoride, and nitrogen trifluoride) are synthetic, potent GHGs that are typically emitted in smaller quantities from a variety of industrial processes (IPCC, 2006). There are several other gasses that have an indirect effect on global warming by influencing the formation or destruction of GHGs, however this will not be discussed in detail.

48
Understanding global warming potential
The effect of a GHG on global warming is dependent on the following:
• Concentration in the atmosphere• How long it stays in the atmosphere (lifetime)• Ability to absorb energy (radiative forcing capacity)
Some gases are more effective than others and for each GHG, a Global Warming Potential (GWP) has been calculated to compare apples with apples. A GWP compares the radiative forcing capacity of a tonne of a GHG over a given period of time (e.g., 100 years) to a tonne of CO2 (IPCC, 2006) – hence CO2-equivalent (CO2e). Gases with a higher GWP absorb more energy, per tonne, than gases with a lower GWP, and thus contribute more to global warming. Global warming potential provides a collective unit of measure, which allows adding up of emission estimates of different gasses and allowing comparisons across sectors and gasses
for example inventory purposes. The latest GWP for CH4 and N2O are available in Table 1. The GWP of CO2 is exactly 1 (since it is the baseline unit to which all other GHGs are compared) and the atmospheric lifetime of CO2 is predicted to be very long (still not quantified). Nitrous oxide seems like a far more potent GHG than CH4, however the concentration of CH4 in the atmosphere is 5.6 times more than that of N2O making it a fair contender. Furthermore CH4 is shorter lived in the atmosphere than N2O (12.4 vs. 121 years), therefore the mitigation of CH4 will result in a quicker change.
Table 1: Global warming potential and atmospheric lifetime of methane and nitrous oxide since 2001. The cells in grey represent the latest values to be used.
1IPCC AR3 (2001)2Forster et al., 2007 (IPCC AR4)3 Myhre et al., 2013 (IPCC AR5)
Main sources of greenhouse gasses and more specifically methane emissions
Carbon dioxide: enters the atmosphere through burning fossil fuels (coal, natural gas, and oil), sol-id waste, trees and wood products, and also as a result of certain chemical reactions (e.g., man-ufacture of cement). Carbon dioxide is removed from the atmosphere (or sequestered) when it is absorbed by plants as part of the biological carbon cycle.
Nitrous oxide: is emitted during agricultural and industrial activities, as well as during combustion of fossil fuels and solid waste.
Methane: is emitted during the production and transport of coal, natural gas, and oil. Methane emissions also result from ruminal fermentation (livestock) and other agricultural practices and by the decay of organic waste in landfills. Enteric CH4 (ruminants) constitute the single most important source of anthropogenic (human-induced) CH4 emissions, representing 18% of global CH4 emis-sions, 31% of human-induced CH4 emissions and 60% of agricultural CH4 emissions (Figure 1). This emphasises the need for CH4 abatement.
Greenhouse gas Global Warming
(over a 100 year period)
20011 20072 20133 20011 20072 20133
Methane (CH4) 12 12 12.4 23 25 34 Nitrous oxide (N2O) 114 114 121 296 298 298

49
Figure 1: Global methane emission sources subdivided into natural, agricultural and other anthropogenic (human-induced) sectors (adapted from Knapp et al., 2014).
The cow, methane emissions and the car
According to Du Toit et al. (2013), the dairy sector in South Africa was responsible for 9.8% (130 giga gram) of the total methane emissions produced from the South African livestock sector in 2010, which is substantial enough to be concerned. Dairy cows fed forage based diets can produce between 250 and 600 grams of enteric CH4 emissions per day dependent on dry matter intake (Charmley et al., 2016). To put this in perspective, a single dairy cow emits approximately the same amount of CH4 emitted by an average passenger car driving 40 km per day (EPA, 2014). This just emphasises the need for CH4 mitigation strategies in the dairy sector.
Why the need for a carbon tax
Because the Earth’s climate may be near tipping point, the need to act is increasingly pressing. Responding quickly with CH4 reductions would lessen the likelihood of irreversibly crossing such tipping points into a new climatic state. Only with the recognition of the urgency of this issue and the political will to commit resources to comprehensively mitigate both CO2 and non-CO2 GHG emissions will meaningful progress be made on climate change. One solution is the implementation of carbon tax. The purpose of a carbon tax, seen too often as a way to increase the tax base, is intended more to send the necessary price signals to change consumer behaviours and stimulate investor appetite to shift towards low carbon options. The ultimate goal is to develop a carbon tax system that can account for GHG emissions and removal. This is not an easy task to initiate and even more difficult to maintain due to citizen protests, horrendous amount of related administration and quantifying accurate GHG emission estimations within industries. The Australian Government is an example of this – they were one of the first countries to implement carbon tax and one of the first countries to remove their carbon tax. It is understandable that industries that contribute to fossil
Wastewater 5%
Landfills 6%
Biomass burning
2%
Fossil fuels 15%
Other agriculture
4%
Manure 2% Enteric
fermentation 18%
Rice 6%
Termites and other
arthropods 4%
Oceans, lakes & rivers
7%
Wetlands 31%
Agriculture 30% Other anthropogenic 28%
Anthropogenic 58%
Natural 42%
Enteric CH4 represents:= 18% of global CH4
= 31% of anthropogenic CH4
= 60% of agricultural CH4
Figure 1: Global methane emission sources subdivided into natural, agricultural and other anthropogenic (human-induced) sectors (adapted from Knapp et al., 2014).
The cow, methane emissions and the car
According to Du Toit et al. (2013), the dairy sector in South Africa was responsible for 9.8% (130 giga gram) of the total methane emissions produced from the South African livestock sector in 2010, which is substantial enough to be concerned. Dairy cows fed forage based diets can produce between 250 and 600 grams of enteric CH4 emissions per day dependent on dry matter intake (Charmley et al., 2016). To put this in perspective, a single dairy cow emits approximately the same amount of CH4 emitted by an average passenger car driving 40 km per day (EPA, 2014). This just emphasises the need for CH4 mitigation strategies in the dairy sector.
Why the need for a carbon tax
Because the Earth’s climate may be near tipping point, the need to act is increasingly pressing. Responding quickly with CH4 reductions would lessen the likelihood of irreversibly crossing such tipping points into a new climatic state. Only with the recognition of the urgency of this issue and the political will to commit resources to comprehensively mitigate both CO2 and non-CO2 GHG emissions will meaningful progress be made on climate change. One solution is the implementation of carbon tax. The purpose of a carbon tax, seen too often as a way to increase the tax base, is intended more to send the necessary price signals to change consumer behaviours and stimulate investor appetite to shift towards low carbon options. The ultimate goal is to develop a carbon tax system that can
account for GHG emissions and removal. This is not an easy task to initiate and even more difficult to maintain due to citizen protests, horrendous amount of related administration and quantifying accurate GHG emission estimations within industries. The Australian Government is an example of this – they were one of the first countries to implement carbon tax and one of the first countries to remove their carbon tax. It is understandable that industries that contribute to fossil fuels and landfills should be carbon taxed because they are usually highly profitable and quantifying their CO2e emissions is fairly accurate. Whereas, additional taxation on the agricultural sector with small profit margins can be devastating.

50
The proposed South African Carbon Tax
The South African carbon tax policy is scheduled to come into effect on 01 January 2017 as indicated in the draft bill (Strategic Plan 2016-2020. Measurement, Reporting and Verification: AFOLU Sector, Department of Environmental Affairs, Pretoria). Recognising the importance of reducing CO2e emissions and foreseeing the benefits that a low carbon economy can bring, the South African government has committed to GHG emissions reductions of 34% by 2020 and 42% by 2025 as outlined in the National Climate Change Response Paper (DEA, 2011) and the National Development Plan. In summary, the key points of the design features of the carbon tax include (quoted: Meissner, 2016):
A basic 60% tax-free threshold during the first phase of the carbon tax, from 2017 to 2020;
- An additional 10% tax-free allowance for process emissions; - An additional tax-free allowance for trade exposed sectors of up to 10%; - Recognition for early actions and/or efforts to reduce emissions that beat the industry average in the form of a tax-free allowance of up to 5%; - A carbon offsets tax-free allowance of 5 to 10%; - In recognition of the role of carbon budgets, to provide for an additional 5% tax-free allowance for companies participating in phase 1 (2016 - 2020) of the carbon budgeting system.
The following website can be visited for more detail: http://www.thecarbonreport.co.za/the-proposed-south-african-carbon-tax/?gclid=CIr4i9DCtM8CFdU_GwodkaUKLg
The initial marginal carbon tax rate will be R120 per ton of CO2e. Taking into account the thresholds mentioned above, the effective carbon tax rate is much lower and ranges between R6 and R48 per ton of CO2e. The combined effect of all of the above tax-free thresholds will be capped at 95%. The carbon tax applies to all the sectors and activities except the agricultural sector (in particular land use and land use change) and waste sectors, which will be exempt during the first implementation phase (up to 2020) due to methodological challenges. There are still several shortcomings in the proposed carbon tax, especially in the agricultural sector, that will need to be addressed (Meissner, 2016).
Conclusion
The topic ‘Climate change’ is globally in the spotlight. The sustainability of natural resources has been brought into question. Carbon tax has been adopted by several countries with the purpose to shift industries toward low carbon options and in return lowering their annual GHG emissions. The South African agricultural carbon tax is scheduled for end of 2020 and farmers should adopt mitigation strategies in time. Some strategies are already in place such as no or minimum tillage practices and planting of trees and shrubs. The costs associated with mitigation strategies can be seen as tax relief.

51
References
Charmley, E., Williams, S.R.O., Moate, P.J., Hegarty, R.S., Herd, R.M., Oddy, V.H., Reyenga, P., Staunton, K.M., Anderson, A. and Hannah, M.C., 2016. A universal equation to predict methane production of forage-fed cattle in Australia. Anim. Prod. Sci. 56: 169–180.
Department of Environmental Affairs (DEA), 2011. Notice757 White Paper on the National Climate Change Response, DEA Pretoria.
Du Toit, C.J.L, Meissner, H.H. and van Niekerk, W.A., 2013. Direct methane and nitrous oxide emissions of South African dairy and beef cattle. S. Afr. J. Anim. Sci. 43: 320–339.
Forster, P., V. Ramaswamy, P. Artaxo, T. Berntsen, R. Betts, D.W. Fahey, J. Haywood, J. Lean, D.C. Lowe, G. Myhre, J. Nganga, R. Prinn, G. Raga, M. Schulz and R. Van Dorland, 2007: Changes in Atmospheric Constituents and in Radiative Forcing. In: Climate Change 2007: The Physical Science Basis. Contribution of Working Group I to the Fourth Assessment Report of the Intergovernmental Panel on Climate Change [Solomon, S., D. Qin, M. Manning, Z. Chen, M. Marquis, K.B. Averyt, M.Tignor and H.L. Miller (eds.)]. Cambridge University Press, Cambridge, United Kingdom and New York, NY, USA.
Intergovernmental Panel on Climate Change (IPCC). (2001). Climate Change 2001: The Scientific Basis. Contribution of Working Group I to the Third Assessment Report of the Intergovernmental Panel on Climate Change, Houghton, J.T., Y. Ding, D.J. Griggs, M. Noguer, P.J. van der Linden, X. Dai, K. Maskell, and C.A. Johnson (eds.), Cambridge University Press, Cambridge, United Kingdom and New York, NY, USA.
Intergovernmental Panel on Climate Change (IPCC), 2006. Chapter 10. Emissions from livestock and manure management. In: Guidelines for national greenhouse inventories. Vol. 4. Agriculture, forestry and other land use. IPCC, Geneva, Switzerland. p. 10.1–10.87.
Meissner, H.H., 2016. Memorandum to AGRI SA. Topic: Greenhouse Gas (GHG) emissions and proposed taxation by the Department of Environmental Affairs (DEA) to support mitigation targets. July 2016.
Myhre, G., D. Shindell, F.M. Bréon, W. Collins, J. Fuglestvedt, J. Huang, D. Koch, J.F. Lamarque, D. Lee, B. Mendoza, T. Nakajima, A. Robock, G. Stephens, T. Takemura and H. Zhang, 2013. Anthropogenic and Natural Radiative Forcing. In: Climate Change 2013: The Physical Science Basis. Contribution of Working Group I to the Fifth Assessment Report of the Intergovernmental Panel on Climate Change [Stocker, T.F., D. Qin, G.K. Plattner, M. Tignor, S.K. Allen, J. Boschung, A. Nauels, Y. Xia, V. Bex and P.M. Midgley (eds.)]. Cambridge University Press, Cambridge, United Kingdom and New York, NY, USA.
United States Environmental Protection Agency (EDA), 2014. Greenhouse Gas Emissions from a Typical Passenger Vehicle. Office of Transportation and Air Quality, EPA-420-F-14-040a.

52
How to reduce on-farm enteric methane productionJosef van Wyngaard1, Robin Meeske2
1Department of Animal and Wildlife Science, University of Pretoria, Private Bag X20, Hatfield, 00282Western Cape Department of Agriculture, Outeniqua Research Farm, P.O. Box 249, George, 6530
Introduction
Globally, the livestock sector is responsible for approximately 14.5% of all human-induced greenhouse gas (GHG) emissions of which approximately 44% is in the form of methane (CH4; Gerber et al., 2013). Methane is a potent GHG with 34 times the greenhouse potential
of carbon dioxide (Myhre et al., 2013). It is well known that GHG accumulates in the ozone layer which brings forth climate changes and global warming. The ripple effect includes the increased risk for drought, fire and floods and heat-related diseases. The sustainability of current farming enterprises has been brought into question. Furthermore, it is scheduled that agricultural carbon tax will be implemented in South Africa by the end of 2020. The aim of this paper is to promote early adoption of methane mitigation strategies by dairy farmers, therefore enhancing dairy cow production efficiency, optimising resources, lowering the on-farm carbon footprint and exempting future agricultural carbon tax.
Understanding the formation of enteric methane gas
Methane gas, in ruminants, is produced mainly from microbial fermentation of hydrolysed dietary carbohydrates (HDC; cellulose, hemi-cellulose, pectin, glucose and starch) in the rumen and emitted primarily by eructation (burping). Rectal emissions account for only 2 to 3% of the total CH4 emissions in dairy cows (Muñoz et al., 2012).The primary substrates for ruminal methanogenesis (formation of CH4 – Equation 5 below) are hydrogen and carbon dioxide (CO2). Most of the hydrogen produced during the fermentation of HDC, much of which is generated during the conversion of sugars to volatile fatty acids, ends up in CH4 (Bhatta et al., 2007). The multiple-step pathways of this conversion process are summarized in the following equations (Hungate, 1966; Czerkawski, 1986; Moss et al., 2000):
[1] Glucose → 2 pyruvate + 4H (carbohydrate metabolism);[2] Pyruvate + H2O → acetate + CO2 + 2H;[3] Pyruvate + 4H → propionate + H2O;[4] 2 acetate + 4H → butyrate + 2H2O;[5] CO2 + 8H → CH4 + 2H2O (methanogenesis).
The formation of propionate serves as a hydrogen sink in ruminal fermentation (Equation 3). Therefore, a greater proportion of propionate and/or a lower acetate:propionate ratio in ruminal fluid could indicate a lower availability of metabolic hydrogen for methanogenesis that forms CH4. Propionate production can be stimulated by diets containing relative high starch contents. As such, any nutritional intervention that causes a shift in favour of propionate production (or decreasing acetate production – Equation 2) will be accompanied by a reduction in methane production per unit of feed fermented (Knapp et al., 2014).

53
Why should the dairy industry be concerned about methane emissions?
It is well known what effect greenhouse gasses (GHG), such as methane emissions, have on climate change and global warming. Nevertheless, why should the dairy industry in any country be concerned about methane emissions?
1. Enteric CH4 (ruminants) constitute the single most important source of human-induced CH4 emissions, representing 18% of global CH4 emissions, 31% of human-induced CH4 emissions and 60% of agricultural CH4 emissions (Knapp et al., 2014).2. Retailers and consumers in both domestic and international markets are more and more concerned about the contribution of GHG emissions to the carbon footprint of foods. We as milk producers do not want to be labelled as an industry doing nothing towards the lowering of GHG. Unfortunately, uninformed consumers do have the power to plummet sales. 3. Methane gas account for up to a 12% (some say up to 15%) loss in gross energy intake (Johnson & Johnson, 1995). A cow with a high methane output is an inefficient cow, resulting in a system with high inputs and low outputs.4. Enteric and manure methane comprise more than 40% of the GHG emissions associated with fluid milk production in the United States (Thoma et al., 2013). A comparable value to what we can expect in South Africa.5. Methane and nitrous oxide is cheaper to mitigate than CO2 (Gerber et al., 2013).6. Methane mitigation approaches can be economically advantageous as well as environmentally beneficial. 7. Furthermore, lowering on-farm methane emissions could lead to future agricultural carbon tax exemptions.
Methane mitigation strategies in broad
Enteric CH4 per unit of energy corrected milk (ECM) (example: g of CH4/ kg of ECM) is the preferred unit of measurement for CH4 production for two reasons, 1) dairy farmers will not be willing to implement CH4 mitigation strategies at the cost of milk production and 2) food security is important, agriculture must focus on production efficiency to provide an adequate food supply.
Methane mitigation strategies can be broadly classified into three main categories (adapted from Hristov et al., 2013 and Knapp et al., 2014):
1. Nutrition, feeds and feeding management (5 – 15% reduction in enteric CH4/ECM emissions): high quality feeds can increase animal productivity and feed efficiency. Nutritional mitigation of CH4 production is founded on three basic approaches: a. Ingredient selection to alter volatile fatty acid patterns – certain feeds can enhance propionate or decrease acetate production (Equations 2 and 3), decreasing hydrogen that would be converted to CH4. b. Increased digestibility and ruminal passage rate (particle size and feed processing). – increased dry matter intake alter microbial populations and VFA production patterns and shift some digestion to the intestines. c. High quality diets to increase milk production per cow, which will dilute the CH4 cost.

54
2. Feed additives or rumen modifiers (an overall conservative average of 5% reduction in enteric CH4/ECM emissions, however some feed additives, like nitrate, can reduce enteric CH4/ECM emissions by up to 50%): feeding additives that directly or indirectly inhibit methanogenesis or using biological control aimed at reducing CH4 producing organisms. Mitigation strategies in this category can be subdivided into the following:
a. Inhibitors – impractical on farm level. b. Electron receptors – recommended mitigation strategy (nitrate reduces CH4 production by up to 50% with a long-term persistency). c. Ionophores – effect is inconsistent (monensin). d. Plant bioactive compounds – excess compound and/or limiting protein supply results in reduced digestion and production (tannins, saponins, and essential oils). e. Exogenous enzymes – no direct effect on CH4 production. f. Direct-fed microbials – lacking convincing animal data to support exciting in vitro results (yeast-based products). g. Defaunation – no practical defaunating agents tested comprehensively in vivo. h. Manipulation of rumen archaea and bacteria – vaccines proved unsuccessful needs to be further tested and verified. i. Dietary lipids: vegetable oils – depresses dry matter intake when fed in excess. j. Dietary lipids: by-products – can impair rumen function due to the presence of monounsaturated fatty acids.
3. Genetics and other management approaches (9 – 19% reduction in enteric CH4/ECM emissions): improving nutrient utilization, increasing feed efficiency and decreasing CH4 per unit of product (meat or milk). If annual production of milk remains constant, total CH4 emissions will be decreased and fewer cows are needed to produce the same amount of milk.
Feed additives and feeding management strategies for CH4 emission mitigation that have been tested are summarised in Table 1. Nitrate is the only feed additive that demonstrated sustained methane reduction without compromising milk production in dairy cows (Knapp et al., 2014). The success of nitrate as methane mitigation agent has been emphasized in the literature review. It is also evident that there is a complete lack of dairy grazing studies implementing nitrate supplementation as methane mitigation strategy. The use of nitrate as supplement, however, does come with its own challenges, which can be overcome by following a strict protocol in preventing nitrate poisoning. Care should be taken not to exceed recommended total diet nitrate intake levels and animals should be adapted in 25% increments weekly (four weeks) to avoid toxicity. Nitrate is present in pasture and spikes after nitrogen fertilisation and when plants wilt. As such, grazing animals do have a higher tolerance to nitrate poisoning when compared to animals fed total mixed rations. This emphasizes the importance of accounting for the basal diet nitrate levels and not to put animals on pasture before 21 days after nitrogen fertilisation. The maximum daily intake level is 21 g of nitrate/ kg of dry matter intake or 0.7 g of nitrate/ kg of body weight for pregnant dairy cows.
By combining CH4 mitigation strategies from each of the main CH4 mitigation categories may result in an additive effect in the reduction in enteric CH4/ECM emissions. However, the cost of the strategy and animal health should not be overlooked.

55
Tabl
e 1:
Feed
ad
diti
ves a
nd fe
edin
g m
ana
gem
ent s
trate
gies
for m
etha
ne (C
H4)
em
issio
n m
itiga
tion
(ad
ap
ted
from
Hris
tov
et a
l., 2
013)
Cate
gory
Po
tent
ial C
H 4
miti
gatio
n ef
fect
1 Lo
ng-t
erm
effe
ct
esta
blis
hed
Effe
ctiv
e2 En
viro
nmen
tally
safe
or
safe
to th
e an
imal
Re
com
men
ded
Inhi
bito
rs
Br
omoc
hlor
omet
hane
and
2-b
rom
o-et
hane
sulfo
nate
Hi
gh
?3 Ye
s N
o N
o
Ch
loro
form
Hi
gh
No
Yes
No
No
Cycl
odex
trin
Lo
w
No
Yes
No
No
3-ni
troo
xypr
opan
ol
Med
ium
?
Yes
? ?
Elec
tron
rece
ptor
s
Fum
aric
and
mal
ic a
cids
N
o ef
fect
to H
igh
? ?
Yes
No?
N
itroe
than
e Lo
w
No
Yes?
N
o N
o
N
itrat
e Hi
gh
Yes
Yes
Yes,
if fe
d at
safe
leve
ls Ye
s?
Iono
phor
es
Low
N
o?
Yes?
Ye
s?
Yes?
Pl
ant b
ioac
tive
com
poun
ds
Ta
nnin
s (co
nden
sed)
Lo
w
No?
Ye
s Ye
s Ye
s?
Sapo
nins
Lo
w?
No
? Ye
s N
o?
Esse
ntia
l oils
Lo
w?
No
? Ye
s N
o Ex
ogen
ous e
nzym
es
No
effe
ct to
Low
N
o N
o?
Yes?
N
o?
Defa
unat
ion
Low
N
o ?
Yes
No
Man
ipul
atio
n of
rum
en m
icro
bes
Low
? N
o ?
Yes?
Ye
s?
Diet
ary
lipid
s M
ediu
m
No?
Ye
s Ye
s Ye
s?
Incl
usio
n of
con
cent
rate
Lo
w to
Med
ium
Ye
s Ye
s Ye
s Ye
s?
Impr
ovin
g fo
rage
qua
lity
Low
to M
ediu
m
Yes
Yes
Yes
Yes
Gra
zing
man
agem
ent
Low
Ye
s Ye
s?
Yes
Yes?
Fe
ed p
roce
ssin
g Lo
w
Yes
Yes
Yes
Yes
Mix
ed ra
tions
and
feed
ing
freq
uenc
y ?
? ?
Yes
? Pr
ecis
ion
feed
ing
and
feed
ana
lysi
s Lo
w to
Med
ium
Ye
s Ye
s?
Yes
Yes
1H
igh,
≥30
% m
itiga
ting
effe
ct; M
ediu
m, 1
0 to
30%
miti
gatin
g ef
fect
; Low
, ≤10
% m
itiga
ting
effe
ct2
Det
erm
ined
on
the
ba
sis o
f CH
4m
itiga
tion
pot
entia
l, ef
fect
on
feed
inta
ke (n
o ne
gativ
e ef
fect
is b
enef
icia
l), a
nd/o
r effe
ct o
n a
nim
al p
rod
uctiv
ity (n
o ne
gativ
e ef
fect
or i
mp
rove
men
t is b
enef
icia
l)3
? =
unce
rtain
ty d
ue to
lim
ited
rese
arc
h or
lack
of d
ata
,inc
onsis
tent
or v
aria
ble
resu
lts, o
r la
ck (o
r ins
uffic
ient
) da
ta o
n p
ersis
tenc
y of
the
effe
ct

56
Methane research at Outeniqua Research Farm
In the literature CH4 mitigation studies were exclusively performed on total mixed rations. Little has been done on pasture-based dairy research with the focus on enteric CH4 mitigation. Researchers at Outeniqua gained the capacity to measure CH4 emissions from individual grazing cows without affecting their normal cow behaviour (SF6 tracer gas technique). Methane mitigation strategies implemented at Outeniqua included feeding management (increasing dairy concentrate feeding level) and feeding a feed additive/rumen modifier (nitrate) during late summer (kikuyu pasture) and early spring (ryegrass pasture).
Feeding management methane mitigation strategy – concentrate feeding level:
With the aim to develop a baseline for methane emissions from cows in the temperate coastal area, cows were fed 0, 4 and 8 kg of dairy concentrate/cow per day. The pasture base was predominated by perennial ryegrass. Results indicated that cows fed 8 kg of dairy concentrate tended to produce 30% less CH4/ kg of ECM than cows on zero concentrate and 25% less CH4/ kg of ECM than cows fed 4 kg of concentrate (Figure 1).
Figure 1: Methane emissions (g/d) and methane production (g/kg of milk yield (MY) and g/kg of energy corrected milk (ECM)) of Jersey cows fed either 0, 4 or 8 kg of dairy concentrate per day grazing perennial ryegrass during early spring
The concentrate feeding mitigation strategy proofed to be effective in reducing CH4 production due to the increase in animal efficiency. This strategy is also easy and safe to adopt on farm level. However, the increase in feed cost should be taken into consideration when implementing this strategy. Each dairy farm will have its own concentrate feeding level sweet-spot taking into account the available resources and fodder flow regime. The following preliminary methane prediction model was developed from the study’s results for on-farm use:
Methane per ECM (g/kg) = 67.8 – (0.619 x milk yield kg/d) – (16.09 x milk lactose %) + (9.58 x milk protein %)
Energy corrected milk equation for back-calculation of CH4 emissions (g/day):
ECM (g/kg) = ECM = milk yield kg/d x ((0.384 x milk fat %) + (0.223 x milk protein %) + (0.199 x milk lactose %) – 0.108)/3.1
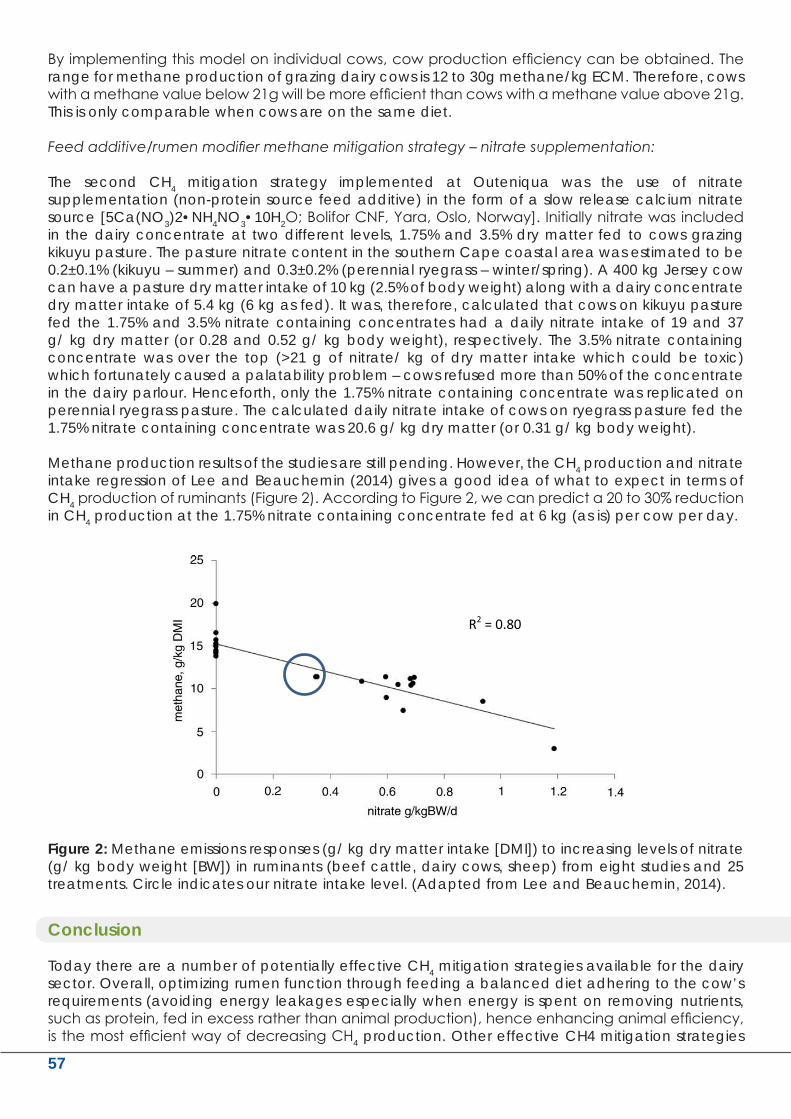
57
By implementing this model on individual cows, cow production efficiency can be obtained. The range for methane production of grazing dairy cows is 12 to 30g methane/kg ECM. Therefore, cows with a methane value below 21g will be more efficient than cows with a methane value above 21g. This is only comparable when cows are on the same diet.
Feed additive/rumen modifier methane mitigation strategy – nitrate supplementation:
The second CH4 mitigation strategy implemented at Outeniqua was the use of nitrate supplementation (non-protein source feed additive) in the form of a slow release calcium nitrate source [5Ca(NO3)2•NH4NO3•10H2O; Bolifor CNF, Yara, Oslo, Norway]. Initially nitrate was included in the dairy concentrate at two different levels, 1.75% and 3.5% dry matter fed to cows grazing kikuyu pasture. The pasture nitrate content in the southern Cape coastal area was estimated to be 0.2±0.1% (kikuyu – summer) and 0.3±0.2% (perennial ryegrass – winter/spring). A 400 kg Jersey cow can have a pasture dry matter intake of 10 kg (2.5% of body weight) along with a dairy concentrate dry matter intake of 5.4 kg (6 kg as fed). It was, therefore, calculated that cows on kikuyu pasture fed the 1.75% and 3.5% nitrate containing concentrates had a daily nitrate intake of 19 and 37 g/ kg dry matter (or 0.28 and 0.52 g/ kg body weight), respectively. The 3.5% nitrate containing concentrate was over the top (>21 g of nitrate/ kg of dry matter intake which could be toxic) which fortunately caused a palatability problem – cows refused more than 50% of the concentrate in the dairy parlour. Henceforth, only the 1.75% nitrate containing concentrate was replicated on perennial ryegrass pasture. The calculated daily nitrate intake of cows on ryegrass pasture fed the 1.75% nitrate containing concentrate was 20.6 g/ kg dry matter (or 0.31 g/ kg body weight).
Methane production results of the studies are still pending. However, the CH4 production and nitrate intake regression of Lee and Beauchemin (2014) gives a good idea of what to expect in terms of CH4 production of ruminants (Figure 2). According to Figure 2, we can predict a 20 to 30% reduction in CH4 production at the 1.75% nitrate containing concentrate fed at 6 kg (as is) per cow per day.
ECM (g/kg) = ECM = milk yield kg/d x ((0.384 x milk fat %) + (0.223 x milk protein %) + (0.199 x milk lactose %) – 0.108)/3.1
By implementing this model on individual cows, cow production efficiency can be obtained. The range for methane production of grazing dairy cows is 12 to 30 g methane/kg ECM. Therefore, cows with a methane value below 21 g will be more efficient than cows with a methane value above 21 g. This is only comparable when cows are on the same diet.
Feed additive/rumen modifier methane mitigation strategy – nitrate supplementation:
The second CH4 mitigation strategy implemented at Outeniqua was the use of nitrate supplementation (non-protein source feed additive) in the form of a slow release calcium nitrate source [5Ca(NO3)2·NH4NO3·10H2O; Bolifor CNF, Yara, Oslo, Norway]. Initially nitrate was included in the dairy concentrate at two different levels, 1.75% and 3.5% dry matter fed to cows grazing kikuyu pasture. The pasture nitrate content in the southern Cape coastal area was estimated to be 0.2±0.1% (kikuyu – summer) and 0.3±0.2% (perennial ryegrass – winter/spring). A 400 kg Jersey cow can have a pasture dry matter intake of 10 kg (2.5% of body weight) along with a dairy concentrate dry matter intake of 5.4 kg (6 kg as fed). It was, therefore, calculated that cows on kikuyu pasture fed the 1.75% and 3.5% nitrate containing concentrates had a daily nitrate intake of 19 and 37 g/ kg dry matter (or 0.28 and 0.52 g/ kg body weight), respectively. The 3.5% nitrate containing concentrate was over the top (>21 g of nitrate/ kg of dry matter intake which could be toxic) which fortunately caused a palatability problem – cows refused more than 50% of the concentrate in the dairy parlour. Henceforth, only the 1.75% nitrate containing concentrate was replicated on perennial ryegrass pasture. The calculated daily nitrate intake of cows on ryegrass pasture fed the 1.75% nitrate containing concentrate was 20.6 g/ kg dry matter (or 0.31 g/ kg body weight).
Methane production results of the studies are still pending. However, the CH4 production and nitrate intake regression of Lee and Beauchemin (2014) gives a good idea of what to expect in terms of CH4 production of ruminants (Figure 2). According to Figure 2, we can predict a 20 to 30% reduction in CH4 production at the 1.75% nitrate containing concentrate fed at 6 kg (as is) per cow per day.
Figure 2: Methane emissions responses (g/ kg dry matter intake [DMI]) to increasing levels of nitrate (g/ kg body weight [BW]) in ruminants (beef cattle, dairy cows, sheep) from eight studies and 25 treatments. Circle indicates our nitrate intake level. (Adapted from Lee and Beauchemin, 2014).
R2 = 0.80
Figure 2: Methane emissions responses (g/ kg dry matter intake [DMI]) to increasing levels of nitrate (g/ kg body weight [BW]) in ruminants (beef cattle, dairy cows, sheep) from eight studies and 25 treatments. Circle indicates our nitrate intake level. (Adapted from Lee and Beauchemin, 2014).
Conclusion
Today there are a number of potentially effective CH4 mitigation strategies available for the dairy sector. Overall, optimizing rumen function through feeding a balanced diet adhering to the cow’s requirements (avoiding energy leakages especially when energy is spent on removing nutrients, such as protein, fed in excess rather than animal production), hence enhancing animal efficiency, is the most efficient way of decreasing CH4 production. Other effective CH4 mitigation strategies

58
include lipid and dairy concentrate supplementation, feed processing (enhancing the overall efficiency of dietary nutrient), and certain feed additives such as nitrates and tannins. Additives can be toxic to animals when fed in excess. The presence of nitrate in pasture (tannins only in trefoil) emphasizes the importance of accounting for the basal diet when including these additives in the dairy concentrate. Farmers should follow a strict adaptation protocol to further avoid toxicity. A reduction of 20 to 30% in CH4 production can be confidently achieved when increasing the dairy concentrate feeding level or by supplementing nitrate. This can result in exempting the future agricultural carbon tax.
References
Bhatta, R., Enishi, O. and Kurihara M., 2007. Measurement of methane production from ruminants. Asian-Aust. J. Anim. Sci. 8: 1305–1318.
Czerkawski, J.W., 1986. An Introduction to Rumen Studies. Pergamon Press, Oxford, UK.
Gerber, P.J., Steinfeld, H., Henderson, B., Mottet, A., Opio, C., Dijkman, J., Falcucci, A., and Tempio, G., 2013. Tackling Climate Change through Livestock: A Global Assessment of Emissions and Mitigation Opportunities. Food and Agriculture Organization of the United Nations (FAO), Rome, Italy.
Hristov, A. N., J. Oh, C. Lee, R. Meinen, F. Montes, T. Ott, J. Firkins, A. Rotz, C. Dell, A. Adesogan, W. Yang, J. Tricarico, E. Kebreab, G. Waghorn, J. Dijkstra, and S. Oosting, 2013. Mitigation of greenhouse gas emissions in livestock production: A review of technical options for non-CO2 emissions. P.J. Gerber, B. Henderson, and H.P.S. Makkar, ed. FAO Animal Production and Health Paper No. 177. Food and Agriculture Organization of the United Nations (FAO), Rome, Italy.
Hungate, R.E., 1966. The Rumen and its Microbes. Academic Press, New York, NY.
Johnson, K.A. and Johnson, D.E., 1995. Methane emissions from cattle. J. Anim. Sci. 73: 2483–2492.Knapp, J.R., Laur, G.L., Vadas, P.A., Weiss, W.P. and Tricarico, J.M., 2014. Invited review: Enteric methane in dairy cattle production: Quantifying the opportunities and impact of reducing emissions. J. Dairy Sci. 97: 3231–3261.
Lee, C., and K.A. Beauchemin, 2014. A review of feeding supplementary nitrate to ruminant animals: Nitrate toxicity, methane emissions, and production performance. Can. J. Anim. Sci. 94: 557–570.
Moss, A.R., Jouany, J.P. and Newbold, J., 2000. Methane production by ruminants: Its contribution to global warming. Ann. Zootech. 49: 231–253.
Muñoz, C., T. Yan, D.A. Wills, S. Murray, and A.W. Gordon, 2012. Comparison of the sulfur hexafluoride tracer and respiration chamber techniques for estimating methane emissions and correction for rectum methane output from dairy cows. J. Dairy Sci. 95: 3139–3148.
Myhre, G., D. Shindell, F.-M. Bréon, W. Collins, J. Fuglestvedt, J. Huang, D. Koch, J.F. Lamarque, D. Lee, B. Mendoza, T. Nakajima, A. Robock, G. Stephens, T. Takemura and H. Zhang, 2013. Anthropogenic and Natural Radiative Forcing. In: Climate Change 2013: The Physical Science Basis. Contribution of Working Group I to the Fifth Assessment Report of the Intergovernmental Panel on Climate Change [Stocker, T.F., D. Qin, G.K. Plattner, M. Tignor, S.K. Allen, J. Boschung, A. Nauels, Y. Xia, V. Bex and P.M. Midgley (eds.)]. Cambridge University Press, Cambridge, United Kingdom and New York, NY, USA.
Thoma, G., Popp, J., Nutter, D., Shonnard, D., Ulrich, R., Matlock, M., Kim, D.S., Neiderman, Z., Kemper, N., East, C. and Adom, F., 2013. Greenhouse gas emissions from milk production and consumption in the United States: A cradle-to-grave life cycle assessment circa 2008. Int. Dairy J. 31(Suppl.1): S3–S14.

59
The effect of substituting maize grain with apple pomace in a concentrate on the production of Jersey
cows grazing kikuyu-ryegrass pasture in summerL. Steyn1#, R. Meeske2 & C.W. Cruywagen1
1Stellenbosch University, Private Bag X1, Matieland, 7602 2Western Cape Department of Agriculture, P.O. Box 249, George, 6530
#Corresponding author: [email protected]
Introduction
Kikuyu pasture, over-sown with perennial ryegrass is a common pasture used for grazing systems in the southern Cape of
South Africa. During the summer months the kikuyu component is most prevalent. The high fibre content of kikuyu coupled with sub-optimal rumen pH parameters of cows on pasture due to high levels of maize intake lowers the digestibility of the pasture (Mertens, 1996; NRC, 2001). Carbohydrates can be broken up into three main fractions, namely pectin, sugar and starch, each fraction with its own unique fermentation pattern and each influencing the digestion of roughage differently (Allen & Knowlton, 1995; Mertens, 1996). The fermentation of pectin and sugars does not produce lactic acid and due in most part to this fact it has been established that pectin and sugars do not have such a severe crippling effect on rumen pH as compared to
starch (Bampidis & Robinson, 2006; Hindrichsen et al., 2006). Pectin also results in a higher level of acetate production and could cause an advantageous increase in the fat content of milk (Hutton, 1987; Mertens, 1996; NRC, 2001). A rumen with a less severe drop in pH post-concentrate feeding and a more constant daily rumen pH will increase the activity of rumen microorganisms, improving digestibility of pasture, thereby potentially increasing overall efficiency. Apple pomace, a by-product of the apple industry, contains high levels of pectin and is a good feed source for the investigation of the effect of alternative carbohydrate fractions on milk production. The aim of this study was to determine the effect of replacing maize with apple pomace in a concentrate feed fed to Jersey cows grazing kikuyu pasture on milk production and composition.
Materials and Methods
Location and general management. The trial was conducted during summer and early autumn of 2016 (March - May) on the Outeniqua Research Farm, situated in the Western Cape province of South Africa (22º 25’ 16” E and 33º 58’ 38” S). The mean minimum and maximum temperatures and total rainfall during the study period were 11.9°C, 23.2°C and 108.2 mm, respectively. The study area (8.5 ha) consisted out of a permanently maintained kikuyu pasture (Pennisetum clandestinum) and was characterised by a Witfontein soil form (Swanepoel et al. 2013).Perennial ryegrass (Lolium perenne, cv. Bealy) was seeded into the kikuyu base at a rate of 20 kg/ha using an Aitcheson seeder in April of the previous year. Kikuyu was the predominant
pasture available to cows (42%) with the rest of the pasture consisting of 26% perennial ryegrass, 7% legume and 26% other grasses (cocksfoot, weeds etc.). Individual paddocks were fertilised with 42 kg (Nitrogen) N/ha using limestone ammonium nitrate (280g N/kg) post-grazing.

60
Experimental design. The study consisted out of four treatments. Treatments where defined according to the level of maize replaced by apple pomace (Table 1); No apple pomace (No AP; 0% AP and 75% maize), Low apple pomace (Low AP; 25% AP and 50% maize), Medium apple pomace (Medium AP; 50% AP and 25% Maize) and High apple pomace (High AP; 75% AP and 0% maize).
Table 1 Ingredient composition of the four concentrate supplements used in the study.
* No AP – 0% AP and 75% maize; Low AP – 25% AP and 50% maize; Medium AP – 50% AP and 25% Maize; High AP – 75% AP and 0% maize.** Premix – 4 mg/kg Cu; 10 mg/kg Mn; 20 mg/kg Zn; 0.34 mg/kg I; 0.2 mg/kg Co; 0.06 mg/kg Se; 6 x 10⁶ IU vitamin A; 1 x 10⁶ IU vitamin D3; 8 x 10³ IU vitamin E.
Seventy two multiparous, lactating Jersey cows were blocked according to milk yield (16.1 ± 2.1 kg), days in milk (114 ± 46 days) and lactation number (3.8 ± 1.5). Cows within blocks were randomly allocated to one of four treatments. Cows received 6 kg as is/day of the allocated concentrate in the milking parlour, which was fed during the morning and afternoon milking sessions. Pasture management. A rising plate meter (RPM) was used for the management of pasture. Strip grazing was applied to ensure an estimated pasture intake of 10 kg DM/day per cow. The linear regression equation: Y=76.8*H–287, where Y = kg DM yield and H = RPM reading, was used to estimate the DM yield of pasture (Van der Colf, 2011). Pasture was allocated in such a way as to ensure a post-grazing height of 10 – 12 on the RPM. Water was available ab libitum.
Data collection and analyses. Milk yield was measured at every milking session and milk samples were collected every second week. Pasture and concentrate samples were collected on a weekly basis and pooled over two weeks for analysis at a later stage. A pasture regression was also cut on a weekly basis. Live weight and body condition score were also recorded at the commencement and completion of the study. The milk production and composition, live weight (LW) and body condition score (BCS) data were subjected to analysis of variance. A general economic evaluation was done by comparing the price ratio of maize with apple pomace and the resultant increase or decrease in margin above feed cost as the price ratio changes.
Results and Discussion
As the level of maize that was replaced with apple pomace increased the ME content of the concentrate decreased and the level of NDF and ADF increased (Table 2). It is also seen that the in vitro digestibility of the concentrate decreases as the level of apple pomace increases, corresponding to the higher NDF levels. The CP levels were similar for all four treatment concentrates. Replacing maize with apple pomace did not affect milk yield or milk fat content (Table 3). However, there was a decrease in milk fat yield as the level of maize replacement increased, corresponding to a subsequent decrease in 4% fat corrected milk yield as maize was replaced with apple pomace. This was not expected due to the higher NDF content of the High AP concentrate, which would be
Materials and Methods
Location and general management. The trial was conducted during summer and early autumn of
2016 (March - May) on the Outeniqua Research Farm, situated in the Western Cape province of South
Africa (22º 25’ 16” E and 33º 58’ 38” S). The mean minimum and maximum temperatures and total
rainfall during the study period were 11.9°C, 23.2°C and 108.2 mm, respectively. The study area (8.5
ha) consisted out of a permanently maintained kikuyu pasture (Pennisetum clandestinum) and was
characterised by a Witfontein soil form (Swanepoel et al. 2013). Perennial ryegrass (Lolium perenne,
cv. Bealy) was seeded into the kikuyu base at a rate of 20 kg/ha using an Aitcheson seeder in April of
the previous year. Kikuyu was the predominant pasture available to cows (42%) with the rest of the
pasture consisting of 26% perennial ryegrass, 7% legume and 26% other grasses (cocksfoot, weeds
etc.). Individual paddocks were fertilised with 42 kg N/ha using limestone ammonium nitrate (280g
N/kg) post-grazing.
Experimental design. The study consisted out of four treatments. Treatments where defined
according to the level of maize replaced by apple pomace (Table 1); No apple pomace (No AP; 0% AP
and 75% maize), Low apple pomace (Low AP; 25% AP and 50% maize), Medium apple pomace
(Medium AP; 50% AP and 25% Maize) and High apple pomace (High AP; 75% AP and 0% maize).
Table 1 Ingredient composition of the four concentrate supplements used in the study.
Parameter Treatment* No AP Low AP Medium AP High AP
Ground maize 75 50 25 0 Apple pomace 0 25 50 75 Soybean oilcake 12.5 12.5 12.5 12.5 Wheat bran 7.0 4.7 2.4 0 Molasses (liquid) 2.0 4.0 6.0 8.1 Feed lime 2.1 1.9 1.7 1.6 Salt 0.6 0.6 0.6 0.6 Urea 0.3 0.6 0.8 1.1 Premix** 0.1 0.1 0.1 0.1 MgO 0.3 0.3 0.3 0.3 Mono-CaP 0.1 0.3 0.6 0.7 * No AP – 0% AP and 75% maize; Low AP – 25% AP and 50% maize; Medium AP – 50% AP and 25% Maize; High AP – 75% AP and 0% maize. ** Premix – 4 mg/kg Cu; 10 mg/kg Mn; 20 mg/kg Zn; 0.34 mg/kg I; 0.2 mg/kg Co; 0.06 mg/kg Se; 6 x 10⁶ IU vitamin A; 1 x 10⁶ IU vitamin D3; 8 x 10³ IU vitamin E.
Seventy two multiparous, lactating Jersey cows were blocked according to milk yield (16.1 ± 2.1 kg),
days in milk (114 ± 46 days) and lactation number (3.8 ± 1.5). Cows within blocks were randomly

61
expected to increase milk fat content. If the rumen environment was not optimal for NDF digestion, the expected increase in acetate production and subsequent increased milk fat content could be hindered, offering a possible explanation. Treatment did not have any effect on milk protein content, milk protein yield or MUN content, corresponding to the similar CP levels of the four different experimental concentrates.
Table 2 Chemical composition (g/kg DM) of the four concentrate supplements used in the study as well as the AP used in the concentrate and the pasture that was grazed (n = 6).
* DM – Dry matter; OM – Organic matter; CP – Crude protein; EE – Ether extract; NFC – Non-fibrous carbohydrates; NDF – Neutral detergent fibre; ADF – Acid detergent fibre; IVOMD – In vitro organic matter degradability; GE – Gross energy; ME – Metabolisable energy.** No AP – 0% AP and 75% maize; Low AP – 25% AP and 50% maize; Medium AP – 50% AP and 25% Maize; High AP – 75% AP and 0% maize.*** 42% - Kikuyu pasture (Pennisetum clandestinum); 26% Perennial ryegrass (Lolium perenne, cv. Bealey); 7% legume and 26% other grasses (cocksfoot, weeds etc.).
Body weight and BCS increased through the duration of the trial, however there were no differences between treatments. Pasture was allocated daily at 12.2 kg DM/cow; however, actual pasture intake was estimated at 10.5 kg DM/cow using the real time regression (Table 4). The average post grazing height was 11.8 on the RPM, which is indicative of a well grazed pasture. Due to the possible decrease in milk production when high levels of maize is replaced with apple pomace the extent to which maize is replaced and the cost difference between maize and apple pomace should be considered. From Figure 1 it can be seen that if the cost of apple pomace and maize are similar it would be more advantageous economically to rather use only maize with no replacement. However, if the cost of apple pomace is less than 80% that of maize it becomes more economically advantageous to partially replace maize and at apple pomace 60% of the maize price it becomes more economically viable to partially and fully replace maize with apple pomace. This estimation only includes the cost of maize and apple pomace and does not take any other variables, such as additional feed components and pasture DMI, into consideration.
Table 2 Chemical composition (g/kg DM) of the four concentrate supplements used in the study as well as the AP used in the concentrate and the pasture that was grazed (n = 6).
Parameter* Treatment** AP Pasture***
No AP Low AP Medium AP High AP DM 90.0 91.5 91.7 91.7 99.3 15.8 OM 94.6 92.8 93.6 93.8 98.1 89.2 CP 13.5 14.2 14.1 14.1 6.74 19.6 EE 1.8 3.07 3.08 2.84 3.71 2.90 NFC 63.0 58.6 52.6 45.2 43.5 21.7 NDF 16.4 16.9 23.8 31.7 44.2 45.1 ADF 3.6 7.1 15.3 23.5 35.4 22.2 IVOMD 88.5 86.2 83.3 78.4 78.5 65.3 GE (MJ/kg DM) 15.9 16.2 16.9 17.3 20.1 14.9 ME (MJ/kg DM) 11.8 11.7 11.8 11.4 13.2 8.17 Ca 0.79 1.18 1.02 1.00 0.14 0.33 P 0.45 0.58 0.44 0.45 0.15 0.45 Ca: P 1.77 2.04 2.30 2.24 0.93 0.75 Mg 0.35 0.46 0.41 0.38 0.10 0.41 K 0.86 1.04 1.10 1.25 0.65 4.14 * DM – Dry matter; OM – Organic matter; CP – Crude protein; EE – Ether extract; NFC – Non-fibrous carbohydrates; NDF – Neutral detergent fibre; ADF – Acid detergent fibre; IVOMD – In vitro organic matter degradability; GE – Gross energy; ME – Metabolisable energy. ** No AP – 0% AP and 75% maize; Low AP – 25% AP and 50% maize; Medium AP – 50% AP and 25% Maize; High AP – 75% AP and 0% maize. *** 42% - Kikuyu pasture (Pennisetum clandestinum); 26% Perennial ryegrass (Lolium perenne, cv. Bealy); 7% legume and 26% other grasses (cocksfoot, weeds etc.).
Body weight and BCS increased through the duration of the trial, however there were no differences
between treatments. Pasture was allocated daily at 12.2 kg DM/cow; however, actual pasture intake
was estimated at 10.5 kg DM/cow using the real time regression (Table 4). The average post grazing
height was 11.8 on the RPM, which is indicative of a well grazed pasture. Due to the possible decrease
in milk production when high levels of maize is replaced with apple pomace the extent to which maize
is replaced and the cost difference between maize and apple pomace should be considered. From
Figure 1 it can be seen that if the cost of apple pomace and maize are similar it would be more
advantageous economically to rather use only maize with no replacement. However, if the cost of
apple pomace is less than 80% that of maize it becomes more economically advantageous to partially
replace maize and at apple pomace 60% of the maize price it becomes more economically viable to
partially and fully replace maize with apple pomace. This estimation only includes the cost of maize
and apple pomace and does not take any other variables, such as additional feed components and
pasture DMI, into consideration.

62
Table 3 Mean milk yield, milk composition and BW and BCS change of cows receiving one of four concentrate supplements (n =18).
a,b Difference in superscript indicates significance at P < 0.05.* FCM – Fat corrected milk; SCC – Somatic cell count; MUN – Milk urea nitrogen; BW – Body weight; ADG – Average daily gain; BCS – Body condition score.** No AP – 0% AP and 75% maize; Low AP – 25% AP and 50% maize; Medium AP – 50% AP and 25% Maize; High AP – 75% AP and 0% maize.
Table 4 The pre- and post-grazing RPM height (mean ± SD), pasture yield, pasture allowance and pasture intake determined using the seasonal linear regression.
* RPM – Rising plate meter; DM – Dry matter.** Y=76.8*H–287, where Y=kg DM yield and H=RPM reading (Van der Colf, 2011).*** Y=68.9*H–286, where Y=kg DM yield and H=RPM reading.
Table 3 Mean milk yield, milk composition and BW and BCS change of cows receiving one of four concentrate supplements (n =18). Parameter* Treatment** SEM P-value
No AP Low AP Medium AP High AP Production (kg/cow) Milk yield 13.6 13.3 13.5 12.8 0.39 0.152 4% FCM yield 16.5a 16.3ab 15.6bc 15.3c 0.30 0.006 Fat yield 0.73a 0.73a 0.68b 0.68b 0.02 0.010 Protein yield 0.52 0.51 0.51 0.50 0.01 0.264 Milk composition Fat (g/kg) 53.9 55.3 51.5 53.6 1.68 0.382 Protein (g/kg) 38.3 38.5 38.0 39.2 0.83 0.754 Lactose (g/kg) 44.1a 45.0b 45.7b 45.5b 0.31 0.001 SCC (x 103 cells/mL) 185 199 128 174 33.5 0.427 MUN (mg/dL) 12.3 12.3 12.2 12.8 0.29 0.422 BW (kg) Before 405 388 395 407 7.33 0.158 Change 11.5 10.4 8.33 2.64 3.68 0.297 BCS (Scale 1 – 5) Before 2.2 2.1 2.1 2.2 0.04 0.330 Change 0.14 0.12 0.10 0.14 0.05 0.900 a,b Difference in superscript indicates significance at P < 0.05. * FCM – Fat corrected milk; SCC – Somatic cell count; MUN – Milk urea nitrogen; BW – Body weight; ADG – Average daily gain; BCS – Body condition score. ** No AP – 0% AP and 75% maize; Low AP – 25% AP and 50% maize; Medium AP – 50% AP and 25% Maize; High AP – 75% AP and 0% maize.
Table 4 The pre- and post-grazing RPM height (mean ± SD), pasture yield, pasture allowance and pasture intake determined using the seasonal linear regression.
Parameter* Pasture values Pre-grazing RPM height 34 ± 4.1 Pasture yield (kg DM/ha)** 2076 ± 280 Pasture allowance (kg DM/cow/day) 12.2 ± 3.03 Post-grazing RPM height 11.8 ± 0.85 Pasture yield (kg DM/ha) 527 ± 58.8 Estimated pasture intake (kg/cow/day)*** 10.5 ± 2.27 * RPM – Rising plate meter; DM – Dry matter. ** Y=76.8*H–287, where Y=kg DM yield and H=RPM reading (Van der Colf, 2011). *** Y=68.9*H–286, where Y=kg DM yield and H=RPM reading.

63
Figure 1 Maize: apple pomace price ratio effect on margin over feed cost, considering no other variables (Maize price assumed at R3000/ton).
Conclusion
Apple pomace is a viable feed source for the partial replacement of maize, however possible
decreases in 4% FCM yield should be considered. There is a probable economic advantage to using
apple pomace if it can be procured at a reasonable price compared to maize; however, this will have
to be re-evaluated per individual farm setup. A preliminary conclusion of this long term study that is
still underway; the partial replacement of maize with apple pomace (33 – 66% replacement rate)
should be considered for Jersey cows grazing kikuyu pasture.
References
Allen, M.S. & Knowlton, F., 1995. Non-structural carbohydrates important for ruminants. Feedstuffs 17: 13-15.
Bampidis, V.A. & Robinson, P.H., 2006. Citrus by-products as ruminant feeds: A review. Anim. Feed Sci, Technol. 128: 175-217.
Hindrichsen, I.K., Wettstein, H.R., Machmuller, A., BachKnudsen, K.E., Madsen, J., Kreuzer, M., 2006. Digestive and metabolic utilisation of dairy cows supplemented with concnetrates characterised by different carbohydrates. Anim. Feed Sci. Technol. 126: 43-61.
Hutton, K., 1987. Citrus pulp in formulated diets. In: Recent Advances in Animal Nutrition Conference Proceedings 9: 297-316.
R -6.00
R -4.00
R -2.00
R -
R 2.00
R 4.00
R 6.00
1 to 1 1 to 0.8 1 to 0.6 1 to 0.4
Inco
me
diffe
renc
e (R
/cow
/day
)
Maize price: Apple pomace price
100% Replacement66% Replacement33% Replacement
Figure 1 Maize: apple pomace price ratio effect on margin over feed cost, considering no other variables (Maize price assumed at R3000/ton).
Conclusion
Apple pomace is a viable feed source for the partial replacement of maize, however possible de-creases in 4% FCM yield should be considered. There is a probable economic advantage to using apple pomace if it can be procured at a reasonable price compared to maize; however, this will have to be re-evaluated per individual farm setup. A preliminary conclusion of this long term study that is still underway; the partial replacement of maize with apple pomace (33 – 66% replacement rate) should be considered for Jersey cows grazing kikuyu pasture.
References
Allen, M.S. & Knowlton, F., 1995. Non-structural carbohydrates important for ruminants. Feedstuffs 17: 13-15.Bampidis, V.A. & Robinson, P.H., 2006. Citrus by-products as ruminant feeds: A review. Anim. Feed Sci, Technol. 128: 175-217.Hindrichsen, I.K., Wettstein, H.R., Machmuller, A., BachKnudsen, K.E., Madsen, J., Kreuzer, M., 2006. Digestive and metabolic utilisation of dairy cows supplemented with concnetrates characterised by different carbohydrates. Anim. Feed Sci. Technol. 126: 43-61.Hutton, K., 1987. Citrus pulp in formulated diets. In: Recent Advances in Animal Nutrition Confer-ence Proceedings 9: 297-316.Mertens, D., 1996. Using fibre and carbohydrate analyses to formulate dairy rations. US Dairy For-age Research Centre, Information Conference with Dairy and Forage Industries: 81-92. NRC, 2001. Nutrient Requirements of Dairy Cattle: Seventh revised edition. Subcommittee on Dairy Cattle Nutrition, Committee on Animal Nutrition and Board on Agriculture and Natural Resources. National Academy Press, Washington, D.C.Swanepoel, P.A., Botha, P.R., du Preez, C.C., Snyman, H.A. 2013. Physical Quality of a Podzolic Soil following 19 years of Irrigated Minimum-till Kikuyu-ryegrass Pasture. Soil and Tillage Research 133: 10-15. http://dx.doi.org/10.1016/j.still.2013.05.008.Van der Colf, J., 2011. The production potential of kikuyu (Pennisetum clandestinum) pastures over-sown with ryegrass (Lolium spp.). MSc thesis, University of Pretoria, South Africa.

64
Essential oil as feed-additive for Jersey cows grazing ryegrass pasture
Zanmari Moller1, Prof Robin Meeske1,2 & Prof C.W. Cruywagen1
1University of Stellenbosch, Department of Animal Science2 Western Cape, Department of Agriculture
Outeniqua Research Farm,
Introduction
Through the years of livestock production, one of the main goals with regards to ruminant nutrition was being able to manipulate the ruminal microbial ecosystem to improve the efficiency of converting animal feeds to edible animal products, fit for human consumption (Kilic et al., 2011). This includes products such as milk, meat and eggs. This manipulation was made
possible by the use of different feed additives such as antibiotics, ionophores, methane inhibitors, yeasts and enzymes (Patra, 2011). Modulating rumen fermentation can lead to enhanced growth, increased milk yield, improvement of daily feed intake, as well as to improved feed efficiency (Patra, 2011). Antibiotics are used at non-therapeutic levels and are commonly included in the diet to increase feed efficiency and to prevent diseases. The use of antibiotics in this manner has, however, been criticized because of the emergence of multi-drug resistant bacteria that may pose a risk to human health (Benchaar et al., 2007). Residues of the chemicals in milk and meat make it unfit for human use. Toxicity problems also resulted for the host ruminant, negatively affecting the microbial population (Patra, 2011). Due to these findings and the consumer wanting to be healthier, the European Union (EU) has banned the use of ionophore antibiotics as feed additives since January 2006 (Regulation 1831/2003/EC) (Nogueira, 2009). This ban has led to nutritionists and microbiologists becoming more interested in bioactive plant factors that can modify the rumen fermentation processes in a natural way (Kilic et al., 2011). According to Shaver (2010), Essential Oils (EO) have been widely used as an alternative to monensin. The use of EO are becoming more popular in animal nutrition as a natural alternative to antibiotics (Kilic et al., 2011). Plants are a natural part of the herbivore diet and these plants contain bioactive compounds which include EO, tannins and saponins. These compounds have antimicrobial properties, making them a natural antibiotic which can improve the feed utilization and health of ruminants (Patra, 2011). For the purpose of this study, we specifically wanted to look at the use of EO in dairy cattle nutrition. In this study we used an essential oil extract from Oregano (Origanum vulgaris). This EO is the most used because of its strong antibacterial properties (Tekippe et al., 2011; Hristov et al., 2013). According to Sivropoulou et al., (1996), the primary active components in oregano EO are carvacrol (75-80%), thymol (1-3%), p-cymene (8%) and -terpinene (2%). Oregano possesses a number of beneficial properties for use in dairy cattle nutrition. These properties include being a broad spectrum bacteria killer, maintaining intestinal stability, have an appetite stimulating effect and present a form of protection against methane gas production (Logeman, 2013).
Materials and methods
Location and general management. The study was performed on the Outeniqua Research Farm situated near George in the Western Cape province of South Africa (33° 58’ 702” S and 22° 25’ 222” E). The study was performed from 15 September 2014 to 21 November 2014. The whole study ran over 67 days, including an adaption period of 14 days (starting on 15 September 2014) and the data collection started on 29 September 2014. The climate of the George area is temperate consisting of moderate temperatures. During the time that this study was conducted, temperatures ranged from a minimum of 11 °C and a maximum of 21 °C on average. The annual rainfall for this region over a 45-year period is 731.45 mm (ARC, 2011). The soil of the specific paddock used consisted of two distinct soil forms. In the northern part of the paddock the soil consists of Escourt form and the southern part that has a slightly downward slope consists of the Witfontein form (Soil Classification Working Group,
γ

65
1991). The 8.55 ha paddock consisted of an established kikuyu (Pennisetum clandestinum) pasture. An annual ryegrass, Italian ryegrass (Lolium multiflorum Lam. var. italicum cv Jeanne), was over-sown into the established kikuyu pasture at a seeding rate of 25 kg/ha during May 2014. A direct drill with no-till planter (2.4 m Aitchison 3116C Seedmatic with 16 rows) was used to establish the seeds. After grazing, pasture was fertilized with 42 kg N/ha applied as limestone ammonium nitrate.
Experimental design. Fifty-four early lactation Jersey cows were blocked, according to days in milk (DIM), 4% fat corrected milk (FCM) and lactation number. Cows within blocks were randomly allocated to one of the three treatments through a complete randomised block design. All cows received a daily concentrate amount of 6 kg DM of concentrate in the milking parlour, fed over two feeding periods. All cows were allocated 10 kg dry matter (DM) of ryegrass pasture, divided into two grazing periods after each milking. Before milking, cows were separated into their respective treatment groups for milking and the consumption of their specific concentrate treatments. Six rumen cannulated cows were used in the rumen study that ran in conjunction with the production study. Two cows were randomly allocated to each of the three treatments in a 3 x 3 Latin square design (three treatments and three periods) thus all the cows were subjected to all three treatments over the experimental period.
Pasture management. The pasture management was done by using a rising plate meter (RPM). We applied strip grazing to the pasture and ensured a daily intake of 10kg DM/cow. A seasonal regression was determined for the kikuyu/ryegrass pasture and it generated the following equation: Y = 83.093*H - 588.78, where ‘Y’ = available DM herbage (kg/ha) and ‘H’ = RPM height reading. This equation was used to estimate the DM yield of the pasture and determine the amount allocated to the cows on a daily basis. A post-grazing height of 10-12 on the RPM was sought after that indicates that the pasture was well utilized. Ad libitum water were available to the cows.
Treatment design. Control (CON; maize based concentrate with no feed additives), an ionophore treatment, (MON; a maize based concentrate with monensin provided a daily dose at 300 mg per cow), and an essential oil treatment (EO; a maize based concentrate with oregano extract provided at a daily dose of 1.15 g per cow.
Measurements. Milk yield was recorded on a daily basis. Composite milk samples were collected per cow on a bi-weekly basis. Pasture and concentrate samples were collected weekly and were pooled on a bi-weekly basis for analysis at a later stage. Live weight (LW) and body condition score (BCS) were determined before and after the study. Ruminal pH over a 72-hour period were determined using a pH logging system. Volatile fatty acids (VFA) concentration and ruminal ammonia-nitrogen (NH3-N) were determined by taking rumen liquor samples at three different times during the day. An in sacco digestibility study was done on dry matter (DM) and neutral detergent fibre (NDF) digestibility, to determine if the feed additives had an effect on the digestibility of ryegrass pasture.
Statistical Analysis. Measurements were analysed by analysis of variance (ANOVA) for a randomised block design consisting of three treatments in 18 blocks, to test for differences between the three treatment effects. The residuals were acceptably normal with homogeneous treatment variances, except in the case of SCC, which were then log (base 10) transformed. For measurements, such as milk production, weight and FCM, that were taken at the start and the end of the trial, covariance analysis was used to test for significant (linear) relationships between the before and after measurements and then for differences between treatment effects. Linear mixed model analysis was applied to the pH profile data over 24h to model the correlation in a repeated measurements analysis (Payne, 2014). The ruminal VFA and NH3-N data were analysed as a replicated 3 x 3 Latin square testing for differences between treatment effects. Treatment means were compared using Tukey’s least significant difference (LSD) test at the 5% level of significance. Data were analysed using the statistical program GenStat® (Payne, 2014).
Results and discussion
As expected, the chemical composition of the three concentrate treatments did not differ from each other, with the only difference being the additive (Table 1). According to the NRC (2001) the

66
NDF value of ryegrass pasture averages at 450 g/kg. This indicates that the NDF value (Table 1) was within the range as stated by the NRC (2001). Acid detergent fibre (ADF) is highly correlated with the digestibility of the plant cell walls. The more mature the plant the higher the ADF and less digestible it will be. The energy digestibility is negatively correlated to the ADF. A low ADF is preferred because that means a higher net energy will be available. The ADF value of 255 g/kg (Table 1) correlates well to the value as stated by the NRC (2001), 250g/kg for ryegrass pastures.
As specified by Stockdale (2000), the post-grazing height on the RPM was within range of an RPM reading of 10 to 12 RPM (Table 2). This indicates well utilized pasture and ensures optimal pasture regrowth and quality.
Table 1: Nutritional composition of the three concentrate treatments and the Kikuyu/ryegrass pasture
1 - DM- dry matter; OM – organic matter; IVOMD – in vitro organic matter digestibility; ME - metabolisable energy (calculated); CP – crude protein; NDF – neutral detergent fibre; ADF – acid detergent fibre; EE – ether extract; Ca – calcium; P – phosphorous; Mg – Magnesium; Ca:P - ratio between calcium and phosphorus 2 - Control – Concentrate containing no feed additive; Monensin – concentrate containing 300mg monensin/cow/d; Oregano – concentrate containing 1,15 g of oregano/cow/d fed a treatment concentrate at 6kg/d (as-is)
Table 2: Ingredient composition of experimental dairy concentrates and premix fed to the three different treatment groups
1-Monensin is 20% active in Rumensin thus a daily inclusion of 1500 mg Rumensin per cow = 300 mg monensin/cow/d2-Oregano oil extract (Dosto500) fed at a daily inclusion of 1.15 g per cow
Table 1: Nutritional composition of the three concentrate treatments and the Kikuyu/ryegrass pasture
1 - DM- dry matter; OM – organic matter; IVOMD – in vi tro organic matter digestibi l i ty; ME -metabol i sable energy (calculated); CP – crude protein; NDF – neutral detergent f ibre; ADF – acid detergent f ibre; EE – ether extract; Ca – calcium; P – phosphorous; Mg – Magnesium; Ca:P - ratio between calcium and phosphorus 2 - Control – Concentrate containing no feed additive; Monensin – concentrate containing 300mg monensin/cow/d; Oregano – concentrate containing 1,15 g of oregano/cow/d fed a treatment concentrate at 6kg/d (as-i s)
Table 2: Ingredient composition of experimental dairy concentrates and premix fed to the three different treatment groups
Ingredient g/kg DM Ingredientg/ton or as stated
PremixControl Monensin1 Oregano2
Maize meal 716 Vitamin A (IU) 9 000 000 9 000 000 9 000 000Hominy Chop 150 Vitamin D3 (IU) 600 000 600 000 600 000Molasses syrup 50 Vitamin E (IU) 12 000 12 000 12000Soja oil cake 50 Cobalt 1.2 1.2 1.2Feed Lime 15 Copper 30 30 30MonoCaP 5 Iron 90 90 90Salt 5 Iodine 2.3 2.3 2.3MgO 3 Magnesium 300 300 300Premix* 6 Manganese 120 120 120ME MJ/kg 12.5 Selenium 0.45 0.45 0.45CP (g/kg) 109.2 Zinc 150 150 150Ca (g/kg) 8.4 Maize meal carrier 4 220 3 972 4 030P (g/kg) 3.8 Additive 0 250 1921-Monensin is 20% active in Rumensin thus a daily inclusion of 1500 mg Rumensin per cow = 300 mg monensin/cow/d2-Oregano oil extract (Dosto500) fed at a daily inclusion of 1.15 g per cow
The daily average milk yield and milk fat content did not differ among treatments (P> 0.05) and were 20.5, 20.3 and 20.4 kg per cow and 4.5, 4.5 and 4.6 % for cows receiving the CON, MON and EO concentrates, respectively (Table 3). These results agree with a study done by Van der Merwe et al. (2001) where Holstein cows allowed to graze a kikuyu/clover pasture were fed a concentrate containing
Nutrient 1 Treatment concentrate2
% DM or as stated Control Monensin Oregano Kikuyu/ryegrass pastureDM 90.0 90.3 90.4 13.5OM 95 95.5 95 88.1IVOMD (%) 92.2 92.5 92.5 82.2ME (MJ/kg) 13.3 13.2 13.2 11.2CP 12.2 12 12.2 24.6NDF 10.5 9.8 9.8 49.4ADF 25.5EE 4.4 4.2 4.7 4.9Ca 0.7 0.7 0.7 0.4P 0.4 0.4 0.4 0.4Mg 0.3 0.3 0.3 0.3Ca:P ratio 1.8:1 1.8:1 1.8:1 1:1

67
The daily average milk yield and milk fat content did not differ among treatments (P > 0.05) and were 20.5, 20.3 and 20.4 kg per cow and 4.5, 4.5 and 4.6 % for cows receiving the CON, MON and EO concentrates, respectively (Table 3). These results agree with a study done by Van der Merwe et al. (2001) where Holstein cows allowed to graze a kikuyu/clover pasture were fed a concentrate containing monensin at a daily inclusion rate of 300 mg monensin per cow at 10 kg/day (as - is). In the current study cows were fed a concentrate at 6 kg per day (as – is) and, as found by Van der Merwe et al. (2001), supplementation of monensin did not have an effect on milk production. With regards to the in vivo effect of EO in dairy cows there is limited information available. However, in previous production studies the overall outcome of EO additives was inconsistent with regards to the production potential of dairy cows (Patra, 2011). In an experiment done by Tekippe et al. (2011), it was reported that milk yield was unaffected by supplementation of dried Origanum vulgare leaves at a daily inclusion rate of 500g per cow to the TMR diet of lactating dairy cows. Milk protein and milk lactose content increased (P < 0.05) for the two additive treatments in comparison to control. The % milk protein was 3.39b, 3.55a and 3.60a, where cows received the CON, MON and EO treatments, respectively. Milk protein content does not readily respond to protein levels in concentrate supplements (Bargo et al., 2003) and thus no differences were expected. However, the milk protein content of cows fed the two feed additives in the current study showed an increase (P < 0.05) in comparison to the control treatment (Table 3). The milk lactose content was higher (P < 0.001) in the two feed additive treatments compared to the control treatment (Table 3). The % for milk lactose were 4.50b, 4.80a and 4.80a, where cows received the CON, MON and EO treatments, respectively. This is contrary to other experiments where no increases found in the lactose content. The lactose component in milk ranges between 4.7 and 4.8% (Gibson, 1989; NRC, 2001). In the current study both feed additives in comparison to control treatment, increased the lactose to the optimal range. A MUN concentration of 13 mg/dl were obtained for all three treatments (Table 3) and is in agreement to the results from various pasture based studies where cows were fed a concentrate supplement (Khalili & Sairanen, 2000; Meeske, et al., 2009; Van Wyngaard, 2013).
Table 3: Mean and standard deviation of the pre- and post-grazing rising plate meter readings (n=89), pasture yields, pasture allowance and pasture intake determined using a single calculated regression (Y = 83.093*H – 588.78)
Parameter Pasture Values
Pre-grazing
RPM1 reading 29.5 ± 4.5
Pasture yield (kg DM/ha) 1861 ± 371
Pasture allowance (kg DM/cow/day) 9.3 ± 1.7
Post-grazing
RPM1 reading 11.3 ± 1.6
Pasture yield (kg DM/ha) 348 ± 132
Pasture removed (kg DM/ha) 1517.2 ± 347.3
Pasture intake (kg DM/cow/day) 7.2 ± 1.4
1-RPM – Rising plate meter; DM – Dry matter± - Mean and standard deviation

68
This indicates that MUN was in the acceptable range for pasture-based systems. The SCC values recorded in the current study (Table 3) are lower than the legal requirement level (< 500 000 cells per mL milk) for human consumption (De Villiers et al., 2000). The low SCC values show that the udders were in a healthy condition. The current study was over a short study period and therefore no significant effect on LW and BCS was recorded (Table 3).
The overall mean over the 24-hour pH profile (Figure 1) measured by the indwelling pH loggers, differed among treatments (Table 4).
requirement level (< 500 000 cells per mL milk) for human consumption (De Villiers et al., 2000). The low SCC values show that the udders were in a healthy condition. The current study was over a short study period and therefore no significant effect on LW and BCS was recorded (Table 3).
The overall mean over the 24-hour pH profile (Figure 1) measured by the indwelling pH loggers, differed among treatments (Table 4).
Figure 1 The mean diurnal rumen pH (indwelling loggers) over a 24-hour period of Jersey cows (n = 6) fed a treatment concentrate at 6 kg/cow/day (as is), which included no feed additive or monensin or oregano, respectively, grazing a kikuyu/ryegrass pasture in spring. Arrows indicate feeding times. Error bars indicate SEM.MON and EO treatments had a higher mean pH when compared to the CON treatment. The higher overall pH may have beneficial effects on rumen fermentation and microbial population. Fibre degrading microbes will be able to work optimally at a higher pH (Hoover, 1986) and have a positive effect on the dry matter degradability (DMd) and neutral detergent fibre degradability (NDFd). There were no differences in total volatile fatty acid concentrations among the three treatments (Table 4). According to Bargo et al. (2003) the mean total VFA concentration usually ranges between 90.3 to 151.4 mM. The total VFA concentration in the current study (Table 4) is well within range suggested by Bargo et al. (2003). With regards to individual VFA, propionate was decreased in the MON treatment when compared to the CON treatment. Propionate is a contributor to milk production (Ishler et al., 1996). Monensin has been reported to increase the propionate concentration in the rumen (Richardson et al., 1978) and therefore an increase was expected on the MON treatment of the current study. However, the results in Table 4 show that there was a decrease (P < 0.05) in propionate when compared to the CON treatment. This decrease in propionate was not anticipated and cannot be readily explained. The ruminal ammonia nitrogen concentration did not differ among treatments. The daily mean rumen ammonia nitrogen concentration falls within the suggested range (8.7 to 32.2 mg/dl) of Bargo et al.(2003). This suggests that the N from the pasture was efficiently utilized in the rumen.
5.20
5.40
5.60
5.80
6.00
6.20
6.40
6.60
6.80
7.00
Rum
inal
pH
Time
Control Monensin Oregano
Figure 1 The mean diurnal rumen pH (indwelling loggers) over a 24-hour period of Jersey cows (n = 6) fed a treatment concentrate at 6 kg/cow/day (as is), which included no feed additive or monensin or oregano, respectively, grazing a kikuyu/ryegrass pasture in spring. Arrows indicate feeding times. Error bars indicate SEM.
MON and EO treatments had a higher mean pH when compared to the CON treatment. The higher overall pH may have beneficial effects on rumen fermentation and microbial population. Fibre degrading microbes will be able to work optimally at a higher pH (Hoover, 1986) and have a positive effect on the dry matter degradability (DMd) and neutral detergent fibre degradability (NDFd). There were no differences in total volatile fatty acid concentrations among the three treatments (Table 4). According to Bargo et al. (2003) the mean total VFA concentration usually ranges between 90.3 to 151.4 mM. The total VFA concentration in the current study (Table 4) is well within range suggested by Bargo et al. (2003). With regards to individual VFA, propionate was decreased in the MON treatment when compared to the CON treatment. Propionate is a contributor to milk production (Ishler et al., 1996). Monensin has been reported to increase the propionate concentration in the rumen (Richardson et al., 1978) and therefore an increase was expected on the MON treatment of the current study. However, the results in Table 4 show that there was a decrease (P < 0.05) in propionate when compared to the CON treatment. This decrease in propionate was not anticipated and cannot be readily explained. The ruminal ammonia nitrogen concentration did not differ among treatments. The daily mean rumen ammonia nitrogen concentration falls within the suggested range (8.7 to 32.2 mg/dl) of Bargo et al. (2003). This suggests that the N from the pasture was efficiently utilized in the rumen.

69
Table 5: Rumen parameters measured, handheld pH meter, and indwelling pH loggers over 72-hour period. Volatile Fatty Acid profile, the ruminal nitrogen concentration and the Dry Matter digestibility (DMd) and Fibre digestibility (NDFd).
1 - DMd- dry matter disappearance; NDFd – neutral detergent fibre disappearance2 - Control – Concentrate containing no feed additive; Monensin – concentrate containing 300 mg monensin/cow/d; Oregano – concentrate containing 1,15 g of oregano/cow/d3 - SEM – standard error of mean a,b means in the same row with different superscripts differ (P<0.05)
Parameter1 Treatment2 SEM3 P-value
pH Control Monensin Oregano
06:00 6.4 6.35 6.53 0.233 0.209
14:00 6.01 6.02 6.11 0.045 0.266
22:00 5.77 5.83 5.75 0.0697 0.686
Mean (Handheld) 6.06 6.07 6.13 0.029 0.228
Mean (pH Loggers) 5.89b 6.03a 6.08a 0.1261 <0.001
Volatile Fatty Acids
Total VFA 117 113 118 1.65 0.116
Acetate (mM) 70.7 68.4 70.9 1.34 0.408
Propionate (mM) 24.5a 22.1b 23.2ab 0.46 0.027
Butyrate (mM) 18 18.3 19.8 0.63 0.162
Valerate (mM) 1.45a 1.31b 1.48a 0.028 0.013
Iso-butyrate (mM) 1.09 1.1 1.18 0.04 0.249
Iso-valerate (mM) 1.33 1.32 1.44 0.072 0.498
Acetate:Propionate ratio 2.94 3.14 3.09 0.097 0.387
Total VFA molar %
Acetate % 60.5 60.8 60.1 0.58 0.694
Propionate % 23.4a 21.1b 22.2ab 0.44 0.027
Butyrate % 17.2 17.5 18.9 0.6 0.162
Valerate % 1.38a 1.25b 1.41a 0.027 0.012
Iso-butyrate % 1.04 1.05 1.13 0.039 0.24
Iso-valerate % 1.27 1.26 1.37 0.0675 0.474
Rumen ammonia nitrogen concentration (mg/dL)
06:00 14.2 13.6 14.5 1.47 0.923
14:00 11.4 13.4 10.5 0.88 0.136
22:00 14.7 14.6 13.8 0.68 0.595
Mean 13.4 13.85 12.9 0.7 0.647

70
The rumen ammonia concentration in the current study was sufficient to maintain rumen activity and microbial fermentation. There were no differences in DM and NDF degradability (DMd and NDFd) on the 6 h incubation period but monensin increased the DMd at 30 h incubation and both monensin and oregano increased NDFd after 30 h incubation. The high DMd values for the additive treatments after the 30-hour incubation correspond to the high IVOMD% value (82.2%) of the ryegrass pasture presented in Table 1. The higher DMd values coincide with the higher milk protein values obtained during the production study (Table 2). The increase in fibre digestibility of the pasture suggests that more nutrients were available for microbial protein synthesis and therefore had a positive effect on milk protein content.
Economic evaluation
The economical evaluation of the current study (Table 5) demonstrated that the two feed additives resulted in an increase in milk price because of the increase in milk composition. Table 6: Economic evaluation
* - South African currency, rand** - Herd = 300 cows which is the average herd size in the southern Cape of South Africa.
The rumen ammonia concentration in the current study was sufficient to maintain rumen activity and microbial fermentation. There were no differences in DM and NDF degradability (DMd and NDFd) on the 6 h incubation period but monensin increased the DMd at 30 h incubation and both monensin and oregano increased NDFd after 30 h incubation. The high DMd values for the additive treatments after the 30-hour incubation correspond to the high IVOMD% value (82.2%) of the ryegrass pasture presented in Table 1. The higher DMd values coincide with the higher milk protein values obtained during the production study (Table 2). The increase in fibredigestibility of the pasture suggests that more nutrients were available for microbial protein synthesis and therefore had a positive effect on milk protein content.
Economic evaluationThe economical evaluation of the current study (Table 5) demonstrated that the two feed additives resulted in an increase in milk price because of the increase in milk composition.
Table 6: Economic evaluation
Parameter Treatment concentrateControl Monensin Oregano
Milk yield (kg/cow per day) 20.5 20.3 20.4Milk fat (g/100g) 4.52 4.47 4.56Milk protein (g/100g) 3.39 3.55 3.6Milk lactose (g/100g) 4.52 4.79 4.83Milk price (R*/L) 4.65 4.77 4.83Milk income (R/cow per day) 95.3 96.83 98.53Milk income (R/herd**per day) 28 598 29 049 29 560Feed price (R/t) 3 740 3 740 3 740Feed additive price (R/t) 0 0 0Feed price (R/cow per day) 22.44 22.44 22.44Feed price (R/herd per day) 6 731 6 731 6 731Pasture price (R/kg) 1.2 1.2 1.2Pasture price (R/cow per day) 12 12 12Pasture price (R/herd per day) 3 600 3 600 3 600Total feed input cost (R/cow per day) 34.44 34.44 34.44Total feed input cost (R/herd per day) 10 330.56 10 330.56 10 330.56Margin over feed cost (R/cow per day) 60.9 62.4 64.1Margin over feed cost (R/herd per day) 18 267 18 719 19 229Margin over feed cost (R/herd per month) 548 008 561 562 576 871Additional income (R/cow per day) 0 1.5 3.2Additional income (R/herd per day) 0 451.8 962.1* - South African currency, rand** - Herd = 300 cows which is the average herd size in the southern Cape of South Africa.
As shown in Table 5 the daily additional income per cow was R1.50 for the monensin treatment and R3.20 for the oregano treatment. If the use of the two additives is to
As shown in Table 5 the daily additional income per cow was R1.50 for the monensin treatment and R3.20 for the oregano treatment. If the use of the two additives is to be considered, care must be taken that the price of the feed additives does not exceed R 1.50 for monensin and R3.20 for the oregano treatment in order to ensure a profit when using these feed additives. It is up to the producer/feed company to calculate the costs involved when an additive is to be considered and make a decision based on the cost evaluation.

71
Conclusion
To conclude the use of monensin and oregano oil extract have shown to be beneficial with re-gards to increasing the milk protein and milk lactose content as well as the NDFd. The average overall pH from the pH profile resulted in the two additive treatments being higher when com-pared to the control treatment. This could be beneficial to rumen fermentation and have a pos-itive effect on the microbial population. As monensin and oregano oil extract showed similar re-sults, oregano oil extract can be considered as an alternative natural feed additive to monensin.
Message to the farmer
Oregano oil extract has increased the protein and lactose content of the milk produced. The fibre degradability have also increased that led to a better utilization of the feed ingested. It can therefore be concluded that Oregano oil extract has the potential to be used as a feed additive in dairy rations. However, more research needs to be done on natural feed additives.
References
ARC, 2011. Agro-Climatology database. The Agricultural Research Council’s Institute for Soil Cli-mate and Water, Department of Agro-Climatology. I.O. van Gent, [email protected], Stellen-bosch.
Bargo, F., Muller, L.D., Kolver, E.S. & Delahoy,J.E., 2003. Invited Review: Production and digestion of supplemented dairy cows on pasture. J. Dairy Sci. 86(1):1-42.
Benchaar, C., Chaves, A.V., Fraser, G.R., Wang, Y., Beauchemin, K.A. & McAllister, T.A., 2007. Effects of EO and their components on in vitro rumen microbial fermentation. Can. J. Anim Sci. p 413-419.
De Villiers, P., Petzer, I.M & Erasmus, L., 2000. Chapter 8: the use of milk recording information as a herd management tool. In: Dairy Herd Improvement in South Africa. ARC- Animal Improvement Institute, Irene, RSA.
Gibson, J.P., 1989. Altering milk composition through genetic selection. J. Dairy Sci. 72:2815-2825.Hoover, W.H., 1986. Chemical factors involved in ruminal fibre digestion. J. Dairy Sci. 69(10): 2755-2766.
Hristov, A.N., Lee, C., Cassidy, T., Heyler, K., Tekippe, J.A., Varga, G.A., Corl, B. & Brand, R.C., 2013. Effect of origanum vulgare L. leaves on rumen fermentation, production, and milk fatty acid com-position in lactating dairy cows. J. Dairy Sci. 96:1189-1202.
Ishler, V., Heinrichs, J. & Varga, G.A., 1996. From feed to milk: understanding rumen function. Exten-sion circular 422. Pennsylvania State University, University Park, PA, pp. 1-27.
Khalili, H. & Sairanen, A., 2000. Effect of concentrates type on rumen fermentation and milk pro-ductions of cows at pasture. Anim. Feed Sci. Technol. 84: 199-212.
Kilic, U., Boga, M., Gorgulu, M., Sahan, Z., 2011. The effects of different compounds in some EO on in vitro gas production. J. Anim. feed Sci. 20:626-636.
Logeman, T. 2013. Oregano proves to be natural bacteria killer. Online. Available: http://www.progressivedairy.com/index.php?option=com_content&view=article&id.html [25 July 2014]
Meeske, R., Cronje, P.C. & Van der Merwe, G.D., 2009. High fibre concentrates for Jersey cows grazing kikuyu/ryegrass pasture. Proc. Annual Information Day at Outeniqua Research Farm. 6 October 2009. Pp. 40-42.

72
Nogueira, P. 2009. EO in dairy cow diets. Dairy Briefs. 2, 8, September.NRC, 2001. Nutrient Requirements of Dairy Cattle, Seventh Rev. Ed. National Academic Press, Washington, D.C., USA.
Patra, A.K., 2011. Effects of EO on rumen fermentation, microbial ecology and ruminant produc-tion. Asian J. Anim. Vet. Adv. 6 (5):416-428.
Payne, R.W. (Ed.) GenStat® for Windows™ 17th Edition Part 2: Statistics, Hemel Hempstead, Hert-fordshire, UK. © 2014 VSN International. Website: http://www.genstat.co.uk/
Richardson, L.F., Potter, E.L., & Cooley, C.O., 1978. Effect of monensin on ruminal protozoa and volatile fatty acids. J. Anim. Sci. 47 (Suppl. 1):45. (Abstr.)
Shaver, R. 2010. Professor of Dairy Science and Extension Dairy Cattle Nutrition at the University of Wisconsin-Madison. Nutrition Plus.
Sivropoulou, A., Papanikolaou, E., Nikolaou, C., Kokkini, S., Lanaras, T. & Arsenakis, M., 1996. Antimi-crobial and cytotoxic activities of Origanum EO. J. Agric. Food Chem. 44:1202–1205.
Soil Classification Working Group, 1991. Soil classification. A taxonomic system for South Africa. Memoirs of natural agricultural resources of South Africa, No 15. Dept. of Agric. Dev., Pretoria. Stockdale, C. R., 2000. Levels of pasture substitution when concentrates are fed to grazing dairy cows in Northern Victoria. Aust. J. Exp. Agric. 40(7): 913-922.
Tekippe, J.A., Hristov, A.N., Heyler, K.S., Cassidy, T.W., Zheljazkov, V.D., Ferreira, J.F.S., Karnati, S.K. & Varga, G.A., 2011. Rumen fermentation and production effects of Origanum vulgare L. Leaves in lactating dairy cows. J. Dairy Sci. 94:5065-5079.
Van der Merwe, B.J., Dugmore, T.J. & Walsh, K.P., 2001. The effect of monensin on milk production, milk urea nitrogen and body condition score of grazing dairy cows. South African Journal of Anim. Sci. 31(1).
Van Wyngaard, J.D.V., 2013. Effect of palm kernel expeller supplementation on production perfor-mance of Jersey cows grazing kikuyu/ryegrass pasture. Master’s Thesis. University of Pretoria, Preto-ria, South Africa.

73
Outeniqua Research Farm | Outeniqua Navorsingsplaas2016 Information day | 2016 Inligtingsdag