outdoor participation report 2013 - the outdoor foundation
TRANSCRIPT

Outdoor Participation Report 2013


The Outdoor Foundation
4909 Pearl East Circle, Suite 200 | Boulder, CO 80301 | 303.444.3353
www.outdoorfoundation.org
Introduction ......................................................................................................... 4
Outdoor Participation ........................................................................................ 7
Active Lifestyles .................................................................................................. 25
Youth .................................................................................................................... 33
Diversity ............................................................................................................... 45
A Detailed Look .................................................................................................. 55
Acknowledgements ............................................................................................ 63
2013 Outdoor Recreation Participation

4 | The Outdoor Foundation www.outdoorfoundation.org
Outdoor recreation is as diverse as America itself. Whether jogging through the streets of the nation’s capital, windsurfing on the coast of the Carolinas, skiing the slopes of the Rocky Mountains, birdwatching along the mighty Mississippi River or participating in a variety of other outdoor opportunities, there is an outdoor activity for everyone.
In 2012, Americans took advantage of the diversity and accessibility of the nation’s outdoor opportunities. Nearly half – 49.4 percent – of all Americans participated in some form of outdoor recreation last year. Although the overall participation rate remained the same as it was in 2011, the number of participants is the highest recorded in this report, thanks to population growth. Nearly 142 million people enjoyed outdoor recreation, up about 800,000 since 2011.
While participation among children and young adults remained steady, participation among adolescents dropped, dragged down by low participation among adolescent girls.
There is vast diversity among outdoor recreation opportunities, but much less diversity among the outdoor participants themselves. Participation among minority populations still lags behind Caucasians. The biggest difference in participation is seen between Caucasian and African American adolescents.
Reconnecting America’s YouthTo ensure healthy, active communities and a future for outdoor conservation, America’s young people must be engaged in outdoor participation. Nationwide efforts to reconnect youth to the outdoors are critical to reaching young people, increasing accessibility of outdoor recreation for all Americans and educating future outdoor enthusiasts about the diversity of the nation’s backyard.
For the seventh year in a row, The Outdoor Foundation® has produced the Outdoor Recreation Participation Report to provide a deeper understanding of American participation in outdoor activities with a focus on youth and diversity. This annual report helps explain the state of outdoor participation for the outdoor industry, federal officials and state and local organizations. With this in-depth information, we can all work together to end America’s inactivity crisis and obesity epidemic and reconnect youth to the outdoors.
Outdoor Recreation: Something for Everyone

The Outdoor Foundation | 5www.outdoorfoundation.org
Key Findings
•Nearly 50 percent of Americans ages six and older participated in outdoor recreation in 2012. That equates to 141.9 million Americans.
•Although the percentage of outdoor participants is the same as it was in 2011, the number of participants grew by about 800,000, thanks to population growth.
•While 13 million Americans started participating in outdoor activities in 2012, 12 million stopped. This is a net gain of one million total outdoor participants and a churn rate of 6.8 percent.
•The number of total outdoor outings increased, reaching an all-time high. Americans took 12.4 billion outdoor excursions in 2012, up from 11.5 billion excursions in 2011.
•Adventure racing grew the most over the past five years. The sport increased participation by 211 percent.
•Stand up paddling had the highest number of new participants in the past year. More than half of stand up paddling participants tried the sport for the first time in 2012.
•Almost one-quarter of all outdoor enthusiasts participate in outdoor activities at least twice per week.
•Running, including jogging and trail running, is the most popular activities among Americans when measured by number of participants and by number of total annual outings.
•The outdoor participation rate among adolescent boys ages 13 to 17 continued to rise in 2012, adding three-percentage points in the past two years.
•Outdoor participation rates declined among adolescent girls. With just over half of adolescent girls participating in outdoor recreation, the participation rate is the lowest recorded since this report began in 2006.
•Youth who do not participate in outdoor activities say they are not interested in the outdoors. For young adults, lack of time is a bigger barrier than lack of interest.
• Introducing outdoor recreation and physical activities early in life has a lasting effect. Among adults who are current outdoor participants, 75 percent had physical education and 42 percent enjoyed outdoor activities in elementary school.
•As seen in previous reports, outdoor participation is highest among Caucasians and lowest among African Americans.
•Although Hispanic Americans have one of the lowest outdoor participation rates, those who do participate go outside as often as Caucasians, who have the highest participation rate.

PAR
tic
iPA
tiO
n
OUtDOOR

www.outdoorfoundation.org The Outdoor Foundation | 7PAR
tic
iPA
tiO
n
40 percent of outdoor participants are from
households with incomes of $75,000 or more.
50 percent of outdoor participants are
self-employed or work part-time or full-time jobs. Only six percent are temporarily unemployed.
Almost one-quarter of outdoor enthusiasts go
on an outdoor excursion at least twice per week.
There was net gain of one million outdoor participants.
Among females ages 16 to 20,
indoor fitness overtakes outdoor recreation as the preferred physical activity, and it remains the most popular form of activity throughout life.
In 2012, nearly 50 percent of
all Americans participat-ed in outdoor recreation, the same participation rate as 2011.
Running, including jogging and trail running, was the
most popular outdoor activity with more than 53 million participants and a participation rate of 19 percent.
50% ofAmericans
Stand up paddling had the highest
percentage of first time participants with 56 percent of participants trying it for the first time.
Stand Up Paddling
OUtDOORPARticiPAtiOn
+1M
49 percent of outdoor participants are married.
In 2012, 70 percent
of outdoor participants were Caucasian.
caucasian

www.outdoorfoundation.org8 | The Outdoor Foundation
Outdoor Participation Over timeIn 2012, nearly half of all Americans participated in outdoor activities. In total, there were 141.9 million outdoor participants, which is 49.4 percent of the US population. Although the percentage of outdoor participants is the same as it was in 2011, the actual number of participants grew by about 800,000, thanks to population growth. The number of total outdoor outings also increased, reaching an all-time high. Americans took a whopping 12.4 billion outdoor excursions in 2012, up from 11.5 billion excursions the year before.
Note: A participant in outdoor recreation is defined as an individual who took part in one or more of 42 outdoor activities at least once during 2012. Measured outdoor activities include adventure racing, backpacking, bicycling (BMX), bicycling (mountain/non-paved surface), bicycling (road/paved surface), birdwatching, boardsailing/wind-surfing, car or backyard camping, RV camping, canoeing, climbing (sport/indoor/boulder), climbing (traditional/ice/mountaineering), fly fishing, freshwater fishing, saltwater fishing, hiking, hunting (rifle), hunting (shotgun), hunting (handgun), hunting (bow), kayak fishing, kayaking (recreational), kayaking (sea/touring), kayaking (white water), rafting, running/jogging, sailing, scuba diving, skateboarding, skiing (alpine/downhill), skiing (cross-country), skiing (freestyle), snorkeling, snowboarding, snowshoeing, stand up paddling, surfing, telemarking (downhill), trail run-ning, triathlon (non-traditional/off road), triathlon (traditional/road), wakeboarding and wildlife viewing.
134.4Million
138.4Million
135.9Million
137.8Million
137.9Million
141.1Million
141.9Million
11.6Billion
11.4Billion
11.2Billion 10.1
Billion10.1
Billion
11.5Billion
48.6%48.9%48.6%50.0%49.1% 49.4% 49.4%
2006 2007 2008 2009 2010 2011 2012
12.4Billion
Total Outdoor Outings
Number of Participants
Participation Rate
Outdoor Participation, 2006 to 2012 All Americans, Ages 6+

Total Participants
2011
New/Returning Participants
2012
LostParticipants
2012
TotalParticipants
2012
-30,000,000
0
30,000,000
60,000,000
90,000,000
120,000,000
150,000,000
{ Churn Rate= 6.8%
Num
ber
of
Par
tici
pan
ts
141M 142M
13M
-12M
Outdoor Participation, 2006 to 2012 All Americans, Ages 6+
The “Leaky Bucket” analysis shows that outdoor activities gained more participants than they lost in 2012. While 13 million Americans started participating in outdoor activities, 12 million stopped. In other words, there was a net gain of one million total participants and a relatively low churn rate of 6.8 percent.

www.outdoorfoundation.org10 | The Outdoor Foundation
0%
20%
40%
60%
80%
100%
Perc
ent
of O
utd
oo
r Pa
rtic
ipan
ts
Participation in Outdoor Activities by DemographicOutdoor Participants, Ages 6+
— 45+
— 25–44
— 18–24
— 13–17
— 6–12
Age
0%
20%
40%
60%
80%
100%
Perc
ent
of O
utd
oo
r Pa
rtic
ipan
ts
HouseholdIncome
— $100,000+
— $75,000 to $99,999
— $50,000 to $74,999
— $25,000 to $49,999
Less than $25,000—
Education
— Post- Graduate
— College Graduate
— 1 to 3 Years College
High School Graduate
1 to 3 Years High School or Less
Not Speci�ed1%
Ethnicity
— Other
Hispanic
— Caucasian
Asian/Paci�c Islander
— African American
33%
11%
33%
12%
9%
13%
18%
24%
18%
13%
27%
70%
23%
15%
23%
25%
13%
7%
7%
5%
A Snapshot of Outdoor EnthusiastsResearch shows that participants in outdoor recreation represent a diverse population by geography, age and income. Understanding demographics is essential to reaching new audiences and inspiring existing enthusiasts.
➎ Pacific Participation Rate: 50% Percent of US Participants: 16%
➊ Mountain Participation Rate: 58% Percent of US Participants: 8%
9
2
6
1
7
5
4 8
3
➊ Pacific Participation Rate: 52% Percent of US Participants: 17%
➋ Mountain Participation Rate: 55% Percent of US Participants: 8%

www.outdoorfoundation.org The Outdoor Foundation | 11
Participation in OutdoorActivities by Gender
Ages 6–12
18.3 MillionParticipants
Ages 13–17
12.8 Million Participants
Ages 18–24
17.3 MillionParticipants
Ages 25–44
46.5 MillionParticipants
Ages 45+
47.0 MillionParticipants
Outdoor Participants, Ages 6+
141.9 Million Participants
53%47%
59%41%
44%56%
55%45%
59%41%
Female 45% Male
55%9
2
6
1
7
5
4 8
3
➌ West South Central Participation Rate: 45% Percent of US Participants: 11%
➍ West North Central Participation Rate: 57% Percent of US Participants: 8%
➎ East North Central Participation Rate: 50% Percent of US Participants: 15%
➏ East South Central Participation Rate: 49% Percent of US Participants: 6%
➐ South Atlantic Participation Rate: 46% Percent of US Participants: 18%
➑ Middle Atlantic Participation Rate: 47% Percent of US Participants: 13%
➒ New England Participation Rate: 51% Percent of US Participants: 5%
➊ Pacific Participation Rate: 52% Percent of US Participants: 17%
➋ Mountain Participation Rate: 55% Percent of US Participants: 8%

12 | The Outdoor Foundation www.outdoorfoundation.org
Marital Status in Outdoor Participants
Single, never married
Living with a domestic partner
Separated
Divorced
Widowed
Married
Married49%
Single29% Living with Domestic Partner
7%
Separated2%
Divorced10%
Widowed3%
Outdoor Participants, Ages 13+
it’s a Family AffairMore than half of all married couples and those living with domestic partners are outdoor participants, suggesting that outdoor activities are family-friendly.

The Outdoor Foundation | 13www.outdoorfoundation.org
trends in Outdoor ParticipationRecently, non-traditional/off road triathlons and adventure racing have experienced significant growth. In the past three years, participation in non-traditional/off road triathlons grew by 116 percent and adventure racing grew by 99 percent. In the past five years, participation in adventure racing was up 211 percent and non-traditional/off road triathlon up by 199 percent.
top Five Biggest Participation Percentage increases in Outdoor Activities Outdoor Participants, Ages 6+
0%
55%
110%
165%
220% 211% 199%174%
136%
90%
Free
styl
e Sk
iing
Tele
mar
king
Tria
thlo
n(T
rad
itio
nal/
Ro
ad)
Tria
thlo
n (N
on-
Trad
itio
nal/
Off-
Ro
ad)
Ad
vent
ure
Rac
ing
in the Past Five Years
Tria
thlo
n(T
rad
itio
nal/
Ro
ad)
Free
styl
eSk
iing
Tele
mar
king
Ad
vent
ure
Rac
ing
Tria
thlo
n(N
on-
Trad
itio
nal/
Off
Ro
ad)
0%
30%
60%
90%
120% 116%99%
87% 82% 81%
in the Past three Years

14 | The Outdoor Foundation www.outdoorfoundation.org
First-time ParticipantsThe percentage of new participants taking part in an outdoor activity can be an indicator of growth. Activities with high percentages of first-time participants in 2012 included stand up paddling, boardsailing/windsurfing and non-traditional and traditional triathlons.
Though a growth indicator, the percentage of new participants in an outdoor activity is dependent on an activity’s size. It can also mean the activity has a high turnover rate — drawing new participants but, at the same time, losing existing participants.
Percentage of First-Time Participants in 2012Outdoor Participants, Ages 6+
0% 10% 20% 30% 40% 50% 60%
Hiking (Day)Fishing (Fresh)
Bicycling (Road)Wildlife Viewing
Running/JoggingCamping (within 1/4 mile from home)
Camping (RV)Skiing (Telemark)
Hunting (Ri�e)Bicycling (Mountain)
Fishing (Salt)Hunting (Shotgun)
BirdwatchingSkiing (Freestyle)
Skiing (Alpine)Snowboarding
Backpacking (Overnight)Canoeing
SnowshoeingSkateboarding
Trail RunningSnorkeling
Hunting (Handgun)Hunting (Bow)
Skiing (Cross-Country)Wakeboarding
Fishing (Fly)Sailing
Bicycling (BMX)Sur�ng
Kayaking (Recreational)Scuba Diving
Climbing (Traditional)Climbing (Sport)
RaftingKayaking (Sea)
Kayaking (White Water)Adventure Racing
Triathlon (Traditionall)Triathlon (Non-Traditional)Boardsailing/Windsur�ng
Stand Up Paddling
Percentage of First-time Participants in 2012 Outdoor Participants, Ages 6+

www.outdoorfoundation.org The Outdoor Foundation | 15
% of First-Time Participants Median Age
Stand Up Paddling 56% 28
Boardsailing/Windsurfing 43% 30
Triathlon (Non-Traditional) 39% 31
Triathlon (Traditional) 38% 30
Adventure Racing 36% 29
Kayaking (White Water) 32% 29
Kayaking (Sea) 30% 32
Rafting 28% 30
Climbing (Sport) 27% 26
Climbing (Traditional) 26% 31
Scuba Diving 26% 29
Kayaking (Recreational) 25% 32
Surfing 23% 27
Bicycling (BMX) 23% 28
Sailing 23% 29
Fishing (Fly) 21% 32
Wakeboarding 20% 26
Skiing (Cross-Country) 19% 27
Hunting (Bow) 18% 27
Hunting (Handgun) 18% 29
Note: Top 20 activities listed.
Median Age of Outdoor Participants Outdoor Participants, Ages 6+
Adult participants in their late 20’s or early 30’s are most likely to try a new outdoor activity. The most popular outdoor activity among first-time participants, stand up paddling, has a median participant age of 28. Boardsailing and windsurfing, the second most popular activities, welcomed young adult participants with the median age of 30.

16 | The Outdoor Foundation www.outdoorfoundation.org
Annual Participant Outings
Perc
ent
of O
utd
oo
r E
nthu
sias
ts
Annual Outings per Outdoor EnthusiastAll Americans, Ages 6+
0%
5%
10%
15%
20%
260+104-25952-10324-5112-234-111-3
10%
18%
13%
19%
16%15%
9%
Annual OutingsSome outdoor participants are very active and get outside often, while others only enjoy the outdoors a few times per year. On the more active side of outdoor participation, 24 percent of participants enjoy outdoor activities at least twice a week. On the less active side, 28 percent of participants get outdoors less than once a month.
Annual Outings per Outdoor EnthusiastAll Americans, Ages 6+

The Outdoor Foundation | 17www.outdoorfoundation.org
1. Running, Jogging and trail Running 87 average outings per runner / 4.6 billion total outings
2. Road Biking, Mountain Biking and BMX 64 average outings per cyclist / 2.7 billion total outings
3. Birdwatching/Wildlife Viewing 46 average outings per viewer / 1.2 billion total outings
4. Freshwater, Saltwater and Fly Fishing 22 average outings per fishing participant / 1.0 billion total outings
5. Hiking 18 average outings per hiker / 603 million total outings
1. Running, Jogging and trail Running 19% of Americans Ages 6+, 53.2 million participants
2. Freshwater, Saltwater and Fly Fishing 16% of Americans Ages 6+, 46.0 million participants
3. Road Biking, Mountain Biking and BMX 15% of Americans Ages 6+, 42.3 million participants
4. car, Backyard and RV camping 13% of Americans Ages 6+ 38.0 million participants
5. Hiking 12% of Americans Ages 6+, 34.5 million participants
Most Popular Outdoor Activities by Participation RateOutdoor Participants, Ages 6+
Favorite Outdoor Activities by Frequency of Participation Outdoor Participants, Ages 6+
Note: Similar activities have been grouped.

18 | The Outdoor Foundation www.outdoorfoundation.org
Outdoor Participation and the EconomyMore than half of outdoor participants are employed, and only six percent are temporarily unemployed. One-quarter of participants are students and do not have jobs yet.
It appears that the economic downturn is still impacting many Americans. Thirty-five percent of outdoor participants and 33 percent of non-participants report that they are cutting back on non-essentials. Only a few Americans report spending more on recreation from 2011 to 2012 or are planning to increase spending in 2013.
Work for Someone Else Full-Time
35%
Other 1% Full-Time Homemaker
and Not Employed 5%
Student and Not Employed
25%
Disabled and Not Employed
3%
Self-Employed 7%
TemporarilyUnemployed
6%
Outdoor Participants, Ages 13+
Participation in OutdoorActivities by Work Status
Work for SomeoneElse Part-Time
8%
Retired and Not Employed
9%
Outdoor Participation by Employment Status

The Outdoor Foundation | 19www.outdoorfoundation.org
current Economic StatusAll Americans, Ages 6+
Outdoor Participants
Non-Outdoor Participants
83%
88%
77%
78%
70%
0% 10% 20% 30% 40% 50%
non-outdoor participant
outdoor participant
None of the above
Buying new home
Concerned about potential job loss
Recent job loss
Cutting back on donations to charities
Increase in household expenses
Increase in medical/healthcare expenses
Earning less
Cutting back on dining/entertainment
Cutting back on non-essentials
35%
30%27%
24%
22%21%
19%21%
15%15%
9%6%
8%
5%2%
37%41%
5%
22%
33%

20 | The Outdoor Foundation www.outdoorfoundation.org
More Than Last Year
Same As Last Year
Less Than Last Year
No Spending
Sports/Recreation Footwear 10% 36% 9% 45%
Sports/Recreation Clothing 9% 34% 9% 48%
Sports/Recreation Equipment 8% 27% 9% 56%
Outdoor Recreation Activities 7% 32% 7% 54%
Sports Outside of School 7% 19% 5% 69%
Gym Memberships/Fees 6% 18% 6% 70%
Team Sports at School 6% 16% 4% 74%
Travel to Take Part in Sports/Recreation 6% 21% 7% 67%
Lessons/Sports Camps 5% 13% 4% 77%
Individual Sports Events 4% 13% 4% 79%
Spending in 2012All Americans, Ages 6+
Planned Spending for 2013All Americans, Ages 6+
More Than Last Year
Same As Last Year
Less ThanLast Year
No Spending
Outdoor Recreation Activities 12% 31% 5% 52%
Sports/Recreation Footwear 12% 38% 7% 43%
Sports/Recreation Clothing 11% 37% 7% 45%
Sports/Recreation Equipment 9% 31% 7% 53%
Travel to Take Part in Sports and Recreation 8% 22% 5% 65%
Gym Memberships/Fees 8% 21% 4% 68%
Team Sports Outside of School 8% 20% 4% 69%
Individual Sports Events 7% 15% 3% 75%
Lessons/Sports Camps 7% 16% 3% 74%
Team Sports at School 7% 17% 3% 73%

The Outdoor Foundation | 21www.outdoorfoundation.org

22 | The Outdoor Foundation www.outdoorfoundation.org
Participation in Outdoor Activities by AgeParticipation in outdoor recreation, team sports and indoor fitness activities vary as individuals age. Gender also plays a role in determining behaviors and participation trends.
Outdoor activities are popular among children, especially among boys ages 11 to 15. Participation rates drop for both males and females from ages 16 to 20. These rates climb back up slightly for females in their early 20’s and males late 20’s before gradually declining throughout life.
Indoor fitness becomes the preferred activity among young women ages 16 to 20 and remains the most popular form of activity. Males, however, favor outdoor activities until they are age 66 and older.
Team sports are the second most popular activity during childhood for both males and females, but that popularity declines sharply during young adulthood and continues to fall throughout life.

The Outdoor Foundation | 23www.outdoorfoundation.org
Indoor Fitness ActivitiesTeam Sports Outdoor Activities
Age
Perc
ent
of F
emal
es
Participation by Age, FemalesAges 6+
0%
10%
20%
30%
40%
50%
60%
70%
80%
66+61-6556-6051-5546-5041-4536-4031-3526-3021-2516-2011-156-10
Age
Perc
ent
of M
ales
Participation by Age, MalesAges 6+
0%
10%
20%
30%
40%
50%
60%
70%
80%
66+61-6556-6051-5546-5041-4536-4031-3526-3021-2516-2011-156-10
Indoor Fitness ActivitiesTeam Sports Outdoor Activities
Participation by Age, FemalesAges 6+
Participation by Age, MalesAges 6+

liFE
StY
lES
ActiVE

www.outdoorfoundation.orgliFE
StY
lES
The Outdoor Foundation | 25
Outdoor participants rate their health at an
average of 7.3 on a one-to-10-point scale.
Outdoor participants ages 18 to 24 use technology
to engage in outdoor recreation the most. Forty-three percent of these participants use Smart phones and 40 percent use iPods or other music players.
Outdoor participants rate their
fitness level at 6.3 on a one-to-10-point scale.
70 percent of outdoor participants see
outdoor activities as a way to get exercise.
Running, including jogging and trail
running, gained 1.7 million participants
from 2011 to 2012.
Gateway activities — fishing,
running, camping, bicycling and hiking — are popular, accessible and often lead to participation in other outdoor activities.
Walking for fitness is the top crossover activity enjoyed
by outdoor participants. More than half of all outdoor participants enjoy walking for fitness.
ActiVEliFEStYlES

A Gateway to a Healthy Active lifestyleFor many Americans, one accessible, popular outdoor activity leads to interest in many more outdoor recreational opportunities. The most popular of these “gateway” activities is running. Various kinds of running gained 1.7 million participants from 2011 to 2012.
2006 2007 2008 2009 2010 2011 2012
Running, Jogging and Trail Running 38,719,000 41,957,000 42,103,000 44,732,000 50,160,000 51,495,000 53,241,000
Freshwater, Saltwater and Fly Fishing 49,696,000 51,836,000 48,206,000 48,046,000 45,394,000 46,178,000 47,049,000
Road Biking, Mountain Biking and BMX 39,688,000 42,126,000 41,548,000 43,264,000 42,347,000 42,970,000 42,336,000
Car, Backyard, and RV Camping 43,123,000 39,836,000 42,396,000 44,034,000 42,301,000 42,548,000 38,049,000
Hiking 29,863,000 29,965,000 32,511,000 32,572,000 32,495,000 34,492,000 34,545,000
Participation in the Gateway ActivitiesAll Americans, Ages 6+
Fitness Perceptions Health Perceptions
6.3 Outdoor participants rate their fitness level at 6.3 on a one-to-10-point scale.
7.3 Outdoor participants rate their health at 7.3 on a one-to-10-point scale.
Self Perception All Americans, Ages 6+
Outdoor participants see themselves as fit and healthy. Out of a 10-point scale, outdoor participants rate their fitness level at a 6.3 and their health at a 7.3.
www.outdoorfoundation.org26 | The Outdoor Foundation

2006 2007 2008 2009 2010 2011 2012
Running, Jogging and Trail Running 38,719,000 41,957,000 42,103,000 44,732,000 50,160,000 51,495,000 53,241,000
Freshwater, Saltwater and Fly Fishing 49,696,000 51,836,000 48,206,000 48,046,000 45,394,000 46,178,000 47,049,000
Road Biking, Mountain Biking and BMX 39,688,000 42,126,000 41,548,000 43,264,000 42,347,000 42,970,000 42,336,000
Car, Backyard, and RV Camping 43,123,000 39,836,000 42,396,000 44,034,000 42,301,000 42,548,000 38,049,000
Hiking 29,863,000 29,965,000 32,511,000 32,572,000 32,495,000 34,492,000 34,545,000
crossover ParticipationAll Americans, Ages 6+
What are the top indoor fitness, team and other activities enjoyed by outdoor participants?
Indoor Fitness
Team
low-impact Aerobics 13%
Stationary cycling (Upright) 13%
Basketball 14%
Billiards/Pool 21%
Dumbbells 21%
Hand Weights 24%
treadmill 25%
Walking for Fitness 53%
Other
Bowling 26%Weight/Resistance Machines 20%
Stretching 20%Elliptical trainer 14%
Barbells 15%
Home Gym Exercise 14%
tennis 10%
Note: Top 20 most popular crossover activities included.
Abdominal Machine/Device 11%
Yoga 13%
Other Exercise to Music 13%
Darts 10%
table tennis 10%
www.outdoorfoundation.org The Outdoor Foundation | 27

What Motivates Americans to Get OutsideMost Americans participate in outdoor activities because getting outside is a good way of getting exercise. The second biggest motivator is spending time with friends and family, reinforcing the fact that outdoor activities are family-friendly.
Get exercise 70%
Be with family/friends 54%
Keep physically fit 51%
Be close to nature 47%
Get away from the usual demands 46%
Observe scenic beauty 46%
Experience excitement/adventure 45%
Enjoy the sounds/smells of nature 44%
Develop my skills/abilities 36%
Be with people who enjoy the same things 32%
Gain a sense of accomplishment 29%
Experience solitude 25%
Develop a sense of self-confidence 24%
Be with people who share my values 19%
It is cool 18%
Talk to new/varied people 12%
Other reason(s) 6%
Why do you participate in outdoor activities?Outdoor Participants, Ages 6+
www.outdoorfoundation.org28 | The Outdoor Foundation

Not interested 37%
Do not have time 26%
Do not have the skills/abilities 21%
Do not have anyone to participate with 18%
Too busy with family responsibilities 17%
It is too expensive 16%
I have a physical-limiting disability 14%
My health is poor 13%
Places for outdoor recreation cost too much 9%
Places for outdoor recreation are too far away 9%
Too busy with other recreation activities 7%
No way to get to venues 4%
Do not have enough information 4%
Places for outdoor recreation are too crowded 3%
Household members have physical disability 3%
Afraid of getting hurt by other people 3%
Places for outdoor recreation are poorly maintained 2%
Afraid of getting hurt by animals 1%
Places for outdoor recreation are over-developed 1%
Venues for outdoor recreation are too polluted 1%
Some other reason(s) 13%
Why Americans Don’t Participate in Outdoor Activities More OftenLack of interest is the number one reason why Americans don’t get outside more often. Thirty-seven percent of non-participants say that they are simply not interested in outdoor activities. Lack of time is the second biggest reason why people stay indoors with 26 percent of non-participants saying they don’t have time to enjoy outdoor recreation.
What keeps you from participating in outdoor activities?Non-Outdoor Participants, Ages 6+

www.outdoorfoundation.org30 | The Outdoor Foundation
Ages 6–12
Ages 13–17
Ages 18–24
Ages 25–44
Ages 45+
iPod/Music Player 13% 38% 40% 30% 14%
Smart phone 6% 21% 43% 39% 17%
Handheld GPS 3% 3% 4% 7% 5%
Laptop Computer 2% 4% 10% 15% 6%
Tablet 2% 2% 5% 9% 3%
Other Technology 2% 1% 2% 2% 4%
Fitness Monitor 1% 3% 5% 6% 5%
Watch-based GPS .2% 1% 3% 4% 2%
None 79% 48% 31% 35% 64%
Use of information technology While Engaging in Outdoor RecreationModern technology has revolutionized the way we find information, communicate with each other and — for outdoor enthusiasts — engage in outdoor recreation.
Outdoor participants ages 18 to 24 use technology to engage in outdoor recreation the most. Forty-three percent of these participants use Smart phones and 40 percent use iPods or other music players. Adults ages 25 to 44 are the second biggest technology users when it comes to outdoor recreation, while young children ages six to 12 use technology the least.
Use of technology by Outdoor Participants
The Outdoor Foundation | 31www.outdoorfoundation.org
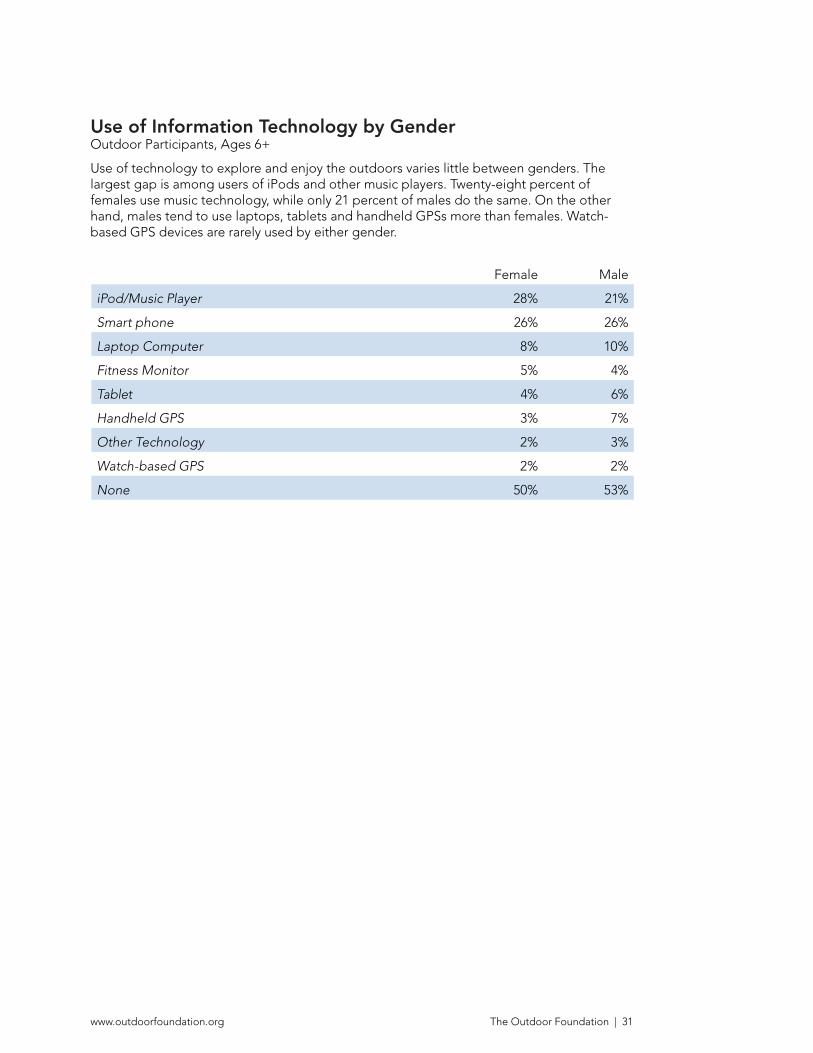
Use of information technology by GenderOutdoor Participants, Ages 6+
Use of technology to explore and enjoy the outdoors varies little between genders. The largest gap is among users of iPods and other music players. Twenty-eight percent of females use music technology, while only 21 percent of males do the same. On the other hand, males tend to use laptops, tablets and handheld GPSs more than females. Watch-based GPS devices are rarely used by either gender.
Female Male
iPod/Music Player 28% 21%
Smart phone 26% 26%
Laptop Computer 8% 10%
Fitness Monitor 5% 4%
Tablet 4% 6%
Handheld GPS 3% 7%
Other Technology 2% 3%
Watch-based GPS 2% 2%
None 50% 53%

YOU
tH

www.outdoorfoundation.org The Outdoor Foundation | 33
Outdoor participation remained
fairly steady from 2011 to 2012; however, participation rates dropped among teens ages 13 to 17 and rose among adults ages 25 to 44. Participation among youth, young adults and adults in the oldest age bracket, ages 45 and over, stayed the same.
Outdoor participation rates among teenage boys ages 13 to 17
continued to rise in 2012, adding three-percentage points since 2010. Participation rates among boys ages six to 12 and among young men ages 18 to 24 slightly decreased.
Youth participants are
motivated to get outside by spending time with family and friends.
While participation rates among teenage boys increased, participation
among teenage girls decreased. With just over half of teenage girls participating in outdoor recreation, the participation rate is the lowest recorded since this report began in 2006.
Y O U t H
Among adults who are current outdoor
participants, more than 75 percent reported having physical education classes between the ages of six and 12. That compares to just 62 percent of non-outdoor participants.
PE
Adults with children in the house
participate in outdoor recreation at a higher rate than adults without children. Adults with children enjoyed outdoor recreation at a rate of 53 percent, while those without children participated at a rate of 44 percent.
Family & Friends
Young adults say they do not have enough
time to participate in outdoor recreation. Youth and adolescents cite lack of interest as the number one reason why they don’t get outdoors more often.

34 | The Outdoor Foundation www.outdoorfoundation.org
Outdoor Participation by AgeOutdoor participation remained fairly steady from 2011 to 2012; however, participation rates dropped among adolescents ages 13 to 17 and rose among adults ages 25 to 44.
Among adolescents, participation dropped to 60 percent, losing the modest two-percentage point gain seen from 2010 to 2012. Despite the decline in participation, adolescents still have a higher participation rate than all of the older age groups. Youth participation remained steady at 63 percent. Despite this stagnation, youth maintain the highest participation rate.
Ages 6-12 Ages 13-17 Ages 18-24 Ages 25-44 Ages 45+
Participation in Outdoor RecreationAll Americans, Ages 6+
20%
30%
40%
50%
60%
70%
80%
Ages 45+Ages 25-44Ages 18-24Ages 13-17Ages 6-12
‘06 ‘07 ‘08 ‘09
37%39% 38% 39%
54%53%54%
48%
55%54%
58%55%
60%61%
64%
69%
62%64%
67%
78%
‘06 ‘07 ‘08 ‘09 ‘06 ‘07 ‘08 ‘09 ‘06 ‘07 ‘08 ‘09 ‘06 ‘07 ‘08 ‘09
20%
30%
40%
50%
60%
70%
80%
Ages 45+Ages 25-44Ages 18-24Ages 13-17Ages 6-12
‘10 ‘11
60%62% 62%63% 63%
‘10 ‘11 ‘10 ‘11 ‘10 ‘11 ‘10 ‘11
61%
56%57% 57% 57%
38%
54% 55%
38% 38%
2012 2012 2012 2012 2012
From 2006-2009
From 2010-2012
Ages 6-12 Ages 13-17 Ages 18-24 Ages 25-44 Ages 45+20%
20%

The Outdoor Foundation | 35www.outdoorfoundation.org
Youth and Young Adult Participation by GenderParticipation in outdoor recreation among adolescent boys ages 13 to 17 continued to rise in 2012, adding three-percentage points since 2010. Unfortunately, participation rates declined among boys ages six to 12 and among young men ages 18 to 24.
While adolescent boys gained outdoor participants, adolescent girls lost participants. With just over half of teenage girls participating in outdoor recreation, the participation rate is the lowest recorded since this report began. On the positive side, the participation rates for girls ages six to 12 and female young adults ages 18 to 24 both rose two-percentage points.
Part
icip
atio
n R
ate
Males’ Participation in Outdoor Recreation, 2006–2012
Females’ Participation in Outdoor Recreation, 2006–2012
Part
icip
atio
n R
ate
0%
20%
40%
60%
80%
Ages 18-24Ages 13-17Ages 6-12
‘06 ‘07 ‘08 ‘09
79%72% 69% 66%
‘10
65%
‘11
67%74% 71%
66% 66%
‘06 ‘07 ‘08 ‘09 ‘10
66%
‘11
68%
60% 64%59% 61%
‘06 ‘07 ‘08 ‘09 ‘10
59%
‘11
60%
0%
20%
40%
60%
80%
Ages 18-24Ages 13-17Ages 6-12
77%
61% 58% 58%54% 55% 54% 54% 51% 52% 50% 48%
‘06 ‘07 ‘08 ‘09 ‘06 ‘07 ‘08 ‘09 ‘06 ‘07 ‘08 ‘09 ‘10
58%
‘10
58%
‘11
55%
‘10
57%
‘11
53%
‘11
54%
2012
66%
2012
69%
58%
2012
60%
2012
51%
2012
56%
2012
Males’ Participation in Outdoor Recreation, 2006-2012
Females’ Participation in Outdoor Recreation, 2006-2012

36 | The Outdoor Foundation www.outdoorfoundation.org
0%
10%
20%
260+104-25952-10324-5112-234-111-3
9%16%
12%19% 17% 19%
8%
Participant Outings
Perc
ent
of
Ent
husi
asts
Annual Outings per Youth ParticipantYouth, Ages 6-17
Outdoor participants ages six to 17 made 2.8 billion outings, an average of 92 outings per youth participant. Although participation rates among this age group slightly decreased, these annual outings are up. Total outings increased by 200,000 and average outings grew by a significant 11 outings per participant.
Profile of Youth Participants
1. Running, Jogging and trail Running 82 average outings per runner / 992 million outings
2. Road Biking, Mountain Biking and BMX 71 average outings per cyclist / 947 million outings
3. Skateboarding 58 average outings per skateboarder / 220 million outings
4. Freshwater, Saltwater and Fly Fishing 16 average outings per fishing participant / 155 million total outings
5. car, Backyard and RV camping 11 average outings per camper / 113 million outings
1. Road, Mountain and BMX Biking 27% of American youth / 13.4 million participants
2. Running, Jogging and trail Running 24% of American youth / 12.1 million participants
3. car, Backyard and RV camping 20% of American youth / 10.2 million participants
4. Freshwater, Saltwater and Fly Fishing 20% of American youth / 9.9 million participants
5. Hiking 12% of American youth / 6.1 million participants
total OutingsAges 6-17
2.8 billion annual outings
92 average outings per participant
Most Popular Outdoor Activities By Participation Rate, Ages 6-17
Favorite Outdoor Activities By Frequency of Participation, Ages 6-17

The Outdoor Foundation | 37www.outdoorfoundation.org
0%
10%
20%
260+104-25952-10324-5112-234-111-3
10%16%
12%18% 18% 16%
11%
Participant Outings
Perc
ent
of
Ent
husi
asts
Annual Outings per Young Adult ParticipantYouth, Ages 18-24
Young adults ages 18 to 24 made 1.9 billion outdoor outings in 2012 for an average of 110 annual outings per participant. Although young adults made nearly one billion fewer total outdoor outings than youth, each participant averaged 18 more annual outings per participant. Young adults who do participate in the outdoors get outside more often than their younger counterparts.
Profile of Young Adult Participants
1. Running, Jogging and trail Running 90 average outings per runner / 935.2 million outings
2. Road Biking, Mountain Biking and BMX 62 average outings per cyclist / 269.4 million outings
3. Freshwater, Saltwater and Fly Fishing 28 average outings per fishing participant / 119.8 million outings
4. Hiking 18 average outings per hiker / 73.2 million outings
5. Skateboarding 62 average outings per skateboarder / 71.9 million outings
1. Running, Jogging and trail Running 36% of young adults / 10.4 million participants
2. Road, Mountain and BMX Biking 15% of young adults / 4.4 million participants
3. Freshwater, Saltwater and Fly Fishing 15% of young adults / 4.3 million participants
4. Hiking 14% of young adults / 4.2 million participants
5. car, Backyard and RV camping 14% of young adults / 4.1 million participants
total OutingsAges 18-24
1.9 billion annual outings
110 average outings per participant
Most Popular Outdoor Activities By Participation Rate, Ages 18-24
Favorite Outdoor Activities By Frequency of Participation, Ages 18-24

38 | The Outdoor Foundation www.outdoorfoundation.org
Getting Youth and Young Adults OutdoorsYouth outdoor participants see outdoor activities as a way to spend time with family and friends. While adolescents are also motivated by enjoying time with loved ones, slightly more participants in this age group cite exercise as their top motivator for outdoor participation. Young adults are also motivated by exercise and much less motivated by family and friends.
Ages 6–12 Ages 13–17 Ages 18–24
Be with family/friends 77% 69% 49%
Get exercise 66% 72% 74%
Experience excitement/adventure 54% 46% 52%
Develop my skills/abilities 51% 51% 43%
It is cool 45% 31% 18%
Be with people who enjoy the same things 41% 45% 25%
Keep physically fit 36% 55% 59%
Be close to nature 32% 30% 44%
Develop a sense of self-confidence 26% 31% 33%
Enjoy the sounds/smells of nature 26% 27% 39%
Observe the scenic beauty 22% 26% 43%
Gain a sense of accomplishment 22% 31% 39%
Get away from the usual demands 18% 34% 49%
Be with people who share my values 14% 22% 17%
Talk to new/varied people 12% 13% 11%
Experience solitude 5% 11% 26%
Other reason(s) 9% 6% 6%
What motivates you to participate in outdoor activities?

The Outdoor Foundation | 39www.outdoorfoundation.org
Ages 6–12 Ages 13–17 Ages 18–24
Not interested 40% 48% 29%
Too expensive 22% 19% 16%
Too busy with other recreation activities 19% 16% 6%
Do not have time 15% 25% 40%
Places for outdoor recreation cost too much 15% 10% 9%
Do not have the skills/abilities 14% 17% 23%
Places for outdoor recreation are too far away 13% 10% 11%
Do not have anyone to participate with 12% 15% 27%
Too busy with family responsibilities 10% 7% 14%
Have no way to get to venues for outdoor recreation 8% 10% 5%
Afraid of getting hurt by other people 4% 2% 4%
Do not have enough information 3% 4% 6%
My health is poor 3% 1% 6%
Places for outdoor recreation are too crowded 3% 3% 4%
Have a physical-limiting disability 2% 2% 3%
Places for outdoor recreation are poorly maintained 2% 1% 4%
Have household members with a physical disability 2% 2% 1%
Venues for outdoor recreation are too polluted 1% 0% 0%
Afraid of getting hurt by animals 1% 0% 2%
Places for outdoor recreation are over-developed 1% 1% 1%
Other reason(s) 18% 16% 15%
Why Youth and Young Adults Don’t Participate in Outdoor Activities More OftenLack of interest is the number one reason why American youth and adolescents do not participate in outdoor activities. Forty percent of youth and 48 percent of adolescents say they are simply not interested in the outdoors. Young adults blame lack of time with 40 percent saying they are too busy to enjoy outdoor recreation.
What keeps you from participating in outdoor activities more?

40 | The Outdoor Foundation www.outdoorfoundation.org
Youth Participation in Sports and Recreation Among current Outdoor EnthusiastsEarly exposure to outdoor activities and other recreation can make a lasting impression. More Americans who were introduced to these activities as children and adolescents grew up to choose an active lifestyle.
Among adults who are current outdoor participants, 75 percent had physical education during elementary school. That compares to just 62 percent of non-outdoor participants. Physical education during adolescence had nearly the same result.
When measuring various activities, an early introduction to the outdoors has the biggest effect on outdoor participation. Forty-two percent of outdoor participants enjoyed outdoor activities during childhood, while only 17 percent of non-outdoor participants were exposed to the outdoors. Outdoor recreation during adolescence had nearly the same impact.
Outdoor Participants
Non- Outdoor
ParticipantsOutdoor
Participants
Non- Outdoor
Participants
PE at School 75% 62% 72% 62%
Outdoor Activities 42% 17% 46% 20%
Team Sports 41% 23% 45% 28%
Cycling 37% 24% 35% 23%
Running/Jogging 25% 13% 39% 19%
Swimming for Fitness 24% 13% 26% 14%
Water Sports 19% 8% 22% 10%
Winter Sports 14% 6% 19% 8%
Racquet Sport 8% 4% 15% 8%
Fitness/Health Club-Based Activities 6% 2% 13% 4%
Golf 5% 2% 10% 5%
None of the Above 10% 28% 10% 27%
Adults at Age 6–12 Adults at Age 13–17
Outdoor Participants
Non- Outdoor
Participants
On a scale of 1 to 5, 5 being the highest, how much did you enjoy physical education classes in school? 3.6 3.3
Adults at Age 6–17

The Outdoor Foundation | 41www.outdoorfoundation.org
0%
10%
20%
30%
40%
50%
60%
Adult Participation Rate in Outdoor Recreation with and without Children Ages 1-17 in HouseholdAll Americans, Ages 18+
44%Outdoor
Participation
53%Outdoor
Participation
54%Outdoor
Participation
54%Outdoor
Participation
52%Outdoor
Participation
Kid(s)
Ages 13-17
in Household
97 Average
Annual
Outings
Kid(s)
Ages 6-12
in Household
81 Average
Annual
Outings
Kid(s)
Ages 1-5
in Household
91 Average
Annual
Outings
Kid(s)
Ages 1-17
in Household
85 Average
Annual
Outings
No Kid(s)
Ages 1-17
in Household
85 Average
Annual
Outings
Participation in Outdoor Recreation Among Adults with Youth in their HouseholdsAdults with children in the household participate in outdoor recreation at a higher rate than adults without children. Again illustrating the family-friendly nature of outdoor activities, adults with children in their household enjoy outdoor recreation at a rate of 53 percent, while adults without children participate at a rate of 44 percent.
Fifty-four percent of people with children ages one to 12 participate in outdoor recreation, but those with younger children ages one to five get outside more often (91 annual outings) than those with older children ages six to 12 (81 annual outings). Adults with adolescent children ages 13 to 17 had a lower rate of participation (52 percent), but they got outside the most often (97 annual outings).
Adult Participation in Outdoor Recreation with and without children in HouseholdAll Americans, Ages 18+

42 | The Outdoor Foundation www.outdoorfoundation.org
Age
Perc
ent
of O
utd
oo
r E
nthu
sias
ts
0%
5%
10%
15%
20%
25%
65+55-6445-5435-4425-3418-2413-176-12
20%
12%13%
17%
14%
11%
7%
5%
Participation in Organized Outdoor OutingsChildren ages six to 12 are the most likely to participate in organized outdoor activities. Twenty percent of children who are outdoor participants reported going on at least one organized outdoor excursion in 2012. Adults ages 65 and over are the least likely to participate in organized outdoor activities.
Participation in Organized Outdoor Activities by Yourself or in a GroupOutdoor Participants. Ages 6+

The Outdoor Foundation | 43www.outdoorfoundation.org

DiV
ER
Sit
Y

www.outdoorfoundation.orgDiV
ER
Sit
Y
The Outdoor Foundation | 45
Partici-pation in outdoor
activities is lowest among African Americans and highest among Caucasians.
Despite lower partici-pation
rates, Hispanic Americans who do enjoy outdoor recreation get out the same amount of times as Caucasian participants.
African Americans
Active DiverseParticipants
DiVERSitY
Biking, running, fishing and camping
are the most popular outdoor activities for all Americans, though each ethnic/racial group participates in each to varying degrees.
When engaging in outdoor recreation,
Smart phones are the most popular form of technology for all ethnicities and iPods or other music players are the second most popular form of technology.
Regardless of ethnic and racial group, Americans are motivated to
get outside to exercise.
All ethnicities and races agree that the number one reason why
they do not participate in outdoor activities more often is because they are not interested.


The Outdoor Foundation | 47www.outdoorfoundation.org
Participation in Outdoor Recreation Among Diverse GroupsAs minority groups make up a larger share of the population and are predicted to become the majority by 2040, engaging diverse populations in outdoor recreation has never been more critical. Unfortunately, minorities still lag behind in outdoor participation.
In 2012, participation in outdoor activities was highest among Caucasians in all age groups and lowest among African Americans. The biggest difference in participation rates was between Caucasian and African American adolescents. While 64 percent of Caucasian adolescents ages 13 to 17 participated in outdoor recreation in 2012, only 46 percent of African Americans in the same age range participated.
Although their participation rate is much lower, those Hispanic Americans who participate in outdoor activities tend to participate the same amount as Caucasians.
African American 39 Caucasian 43
Asian/Pacific Islander 37 Hispanic 43
Average Outings per Outdoor Participant
0%
10%
20%
30%
40%
50%
60%
70%
CaucasianAsian/Paci�c IslanderAfrican AmericanHispanic
6-12
13-1
7
18-2
4
25-4
4
45+
6-12
13-1
7
18-2
4
25-4
4
45+
6-12
13-1
7
18-2
4
25-4
4
45+
6-12
13-1
7
18-2
4
25-4
4
45+
56%53%
49%
54%
37%
54%
46% 45%47%
28%
60%58% 57%
54%
36%
66%64%
60% 60%
40%
Part
icip
atio
n R
ate
Participation in Outdoor RecreationAll Americans by Age and Ethnicity Participation in Outdoor RecreationAll Americans by Age and Ethnicity

48 | The Outdoor Foundation www.outdoorfoundation.org
Most Popular Outdoor Activities Among Diverse GroupsRunning, fishing, biking and camping are among the most popular outdoor activities for all Americans regardless of ethnic or racial affiliation. Although each group participates in these activities at varying rates, running is the favorite form of outdoor recreation for all groups.
1. Running/Jogging and Trail Running 19%
2. Freshwater, Saltwater and Fly Fishing 11%
3. Road Biking, Mountain Biking and BMX 11%
4. Birdwatching/Wildlife Viewing 5%
5. Car, Backyard and RV camping 4%
1. Running/Jogging and Trail Running 24%
2. Road Biking, Mountain Biking and BMX 14%
3. Hiking 13%
4. Car, Backyard and RV Camping 10%
5. Freshwater, Saltwater and Fly Fishing 9%
5. Cross-country, Alpine, Freestyle and Telemark Skiing 8%
1. Running/Jogging and Trail Running 18%
2. Freshwater, Saltwater and Fly Fishing 17%
3. Road Biking, Mountain Biking and BMX 16%
4. Car, Backyard, and RV Camping 16%
5. Hiking 14%
1. Running/Jogging and Trail Running 22%
2. Road Biking, Mountain Biking and BMX 17%
3. Freshwater, Saltwater and Fly Fishing 14%
4. Car, Backyard and RV Camping 11%
5. Hiking 9%
African AmericansAges 6+
Asian/Pacific islandersAges 6+
HispanicsAges 6+
caucasiansAges 6+
The Outdoor Foundation | 49www.outdoorfoundation.org
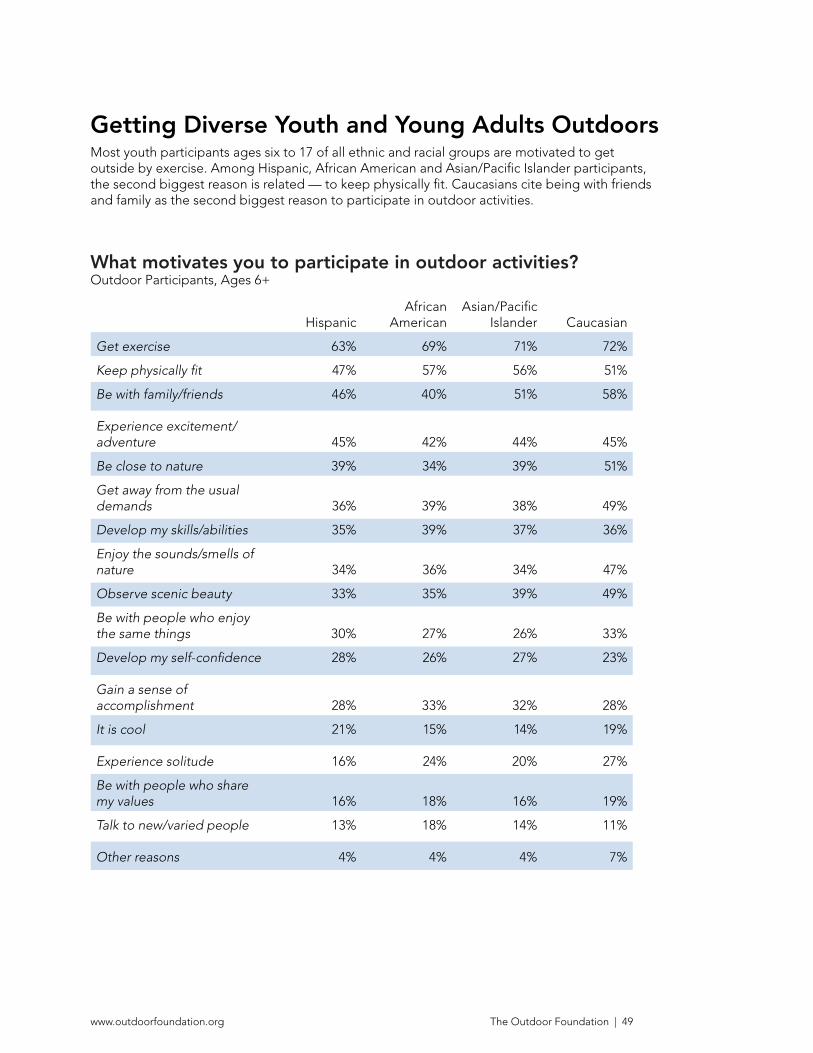
Getting Diverse Youth and Young Adults OutdoorsMost youth participants ages six to 17 of all ethnic and racial groups are motivated to get outside by exercise. Among Hispanic, African American and Asian/Pacific Islander participants, the second biggest reason is related — to keep physically fit. Caucasians cite being with friends and family as the second biggest reason to participate in outdoor activities.
HispanicAfrican
AmericanAsian/Pacific
Islander Caucasian
Get exercise 63% 69% 71% 72%
Keep physically fit 47% 57% 56% 51%
Be with family/friends 46% 40% 51% 58%
Experience excitement/adventure 45% 42% 44% 45%
Be close to nature 39% 34% 39% 51%
Get away from the usual demands 36% 39% 38% 49%
Develop my skills/abilities 35% 39% 37% 36%
Enjoy the sounds/smells of nature 34% 36% 34% 47%
Observe scenic beauty 33% 35% 39% 49%
Be with people who enjoy the same things 30% 27% 26% 33%
Develop my self-confidence 28% 26% 27% 23%
Gain a sense of accomplishment 28% 33% 32% 28%
It is cool 21% 15% 14% 19%
Experience solitude 16% 24% 20% 27%
Be with people who share my values 16% 18% 16% 19%
Talk to new/varied people 13% 18% 14% 11%
Other reasons 4% 4% 4% 7%
What motivates you to participate in outdoor activities?Outdoor Participants, Ages 6+

50 | The Outdoor Foundation www.outdoorfoundation.org
Why Diverse Populations Don’t Participate in Outdoor Activities More OftenAll ethnicities and races agree that the number one reason why they do not participate in outdoor activities more often is because they are not interested. Lack of time is the second biggest reason.
HispanicAfrican
AmericanAsian/Pacific
Islander Caucasian
Not interested 31% 36% 31% 39%
Do not have time 29% 22% 34% 26%
Do not have the skills/abilities 21% 18% 24% 21%
Do not have anyone to participate with 22% 17% 25% 16%
Too busy with family responsibilities 18% 13% 20% 18%
Too expensive 17% 11% 25% 16%
I have a physical-limiting disability 6% 13% 5% 16%
My health is poor 8% 13% 5% 15%
Places for outdoor recreation cost too much 11% 7% 11% 10%
Places for outdoor recreation are too far away 13% 9% 9% 8%
Too busy with other recreation activities 8% 6% 8% 7%
Have no way to get to venues 5% 5% 2% 3%
Do not have enough information 6% 5% 7% 2%
Places for outdoor recreation are too crowded 6% 3% 4% 3%
I have household members with a physical disability 2% 2% 1% 3%
Afraid of getting hurt by other people 2% 3% 2% 3%
Places for outdoor recreation are poorly maintained 3% 3% 2% 1%
Afraid of getting hurt by animals 1% 2% 2% 1%
Places for outdoor recreation are over-developed 2% 0% 1% 1%
Venues for outdoor recreation are too polluted 1% 0% 0% 1%
Some other reason(s) 11% 13% 11% 13%
What keeps you from participating in outdoor activities more?Non-Outdoor Participants, Ages 6+

The Outdoor Foundation | 51www.outdoorfoundation.org
HispanicAfrican
AmericanAsian/Pacific
Islander Caucasian
Not interested 31% 36% 31% 39%
Do not have time 29% 22% 34% 26%
Do not have the skills/abilities 21% 18% 24% 21%
Do not have anyone to participate with 22% 17% 25% 16%
Too busy with family responsibilities 18% 13% 20% 18%
Too expensive 17% 11% 25% 16%
I have a physical-limiting disability 6% 13% 5% 16%
My health is poor 8% 13% 5% 15%
Places for outdoor recreation cost too much 11% 7% 11% 10%
Places for outdoor recreation are too far away 13% 9% 9% 8%
Too busy with other recreation activities 8% 6% 8% 7%
Have no way to get to venues 5% 5% 2% 3%
Do not have enough information 6% 5% 7% 2%
Places for outdoor recreation are too crowded 6% 3% 4% 3%
I have household members with a physical disability 2% 2% 1% 3%
Afraid of getting hurt by other people 2% 3% 2% 3%
Places for outdoor recreation are poorly maintained 3% 3% 2% 1%
Afraid of getting hurt by animals 1% 2% 2% 1%
Places for outdoor recreation are over-developed 2% 0% 1% 1%
Venues for outdoor recreation are too polluted 1% 0% 0% 1%
Some other reason(s) 11% 13% 11% 13%
Use of information technology While Engaging in Outdoor Recreation Among Diverse GroupsWhen engaging in outdoor recreation, Smart phones are the most popular form of technology for all ethnicities and iPods or other music players are the second most popular form of technology. Overall, Hispanic participants report using technology more than any other ethnicity or race.
HispanicAfrican
American
Asian/Pacific
Islander Caucasian
Smart phone 40% 33% 38% 23%
iPod/Music Player 35% 30% 28% 22%
Laptop Computer 18% 16% 14% 6%
Tablet 12% 8% 9% 3%
Fitness Monitor 8% 7% 7% 4%
Handheld GPS 7% 5% 5% 5%
Watch Based GPS 5% 2% 4% 2%
Other Technology 2% 5% 2% 3%
None 34% 37% 39% 56%
How do you use information technology while engaging in outdoor recreation?Outdoor Participants, Ages 6+

52 | The Outdoor Foundation www.outdoorfoundation.org
Outdoor Participants, Ages 6+
Caucasian69%
Hispanic9%
African American
11%Asian/
Paci�c Islander7%
Other4%
Participation in Organized Outdoor OutingsA majority — 69 percent — of the participants who went on at least one organized outdoor excursion in 2012 were Caucasian. Only seven percent were Asian/Pacific Islander.
Participation in Organized Outdoor Activities by Yourself or in a GroupOutdoor Participants. Ages 6+

The Outdoor Foundation | 53www.outdoorfoundation.org

A D
EtA
ilE
D l
OO
K

www.outdoorfoundation.orgA D
EtA
ilE
D l
OO
K
The Outdoor Foundation | 55
A DEtAilEDlOOKThe following pages include full participation data for activities surveyed in the 2013 Outdoor Recreation Participation Report. Data is broken out for outdoor activities by the age groups: youth (ages 6-17), young adults (ages 18-24) and all Americans (ages 6+). A participant is defined as an individual who took part in an activity at least once in 2012.

www.outdoorfoundation.org56 | The Outdoor Foundation
2006
in
000’s
%
of
Pop.
2007
in
000’s
%
of
Pop.
2008
in
000’s
%
of
Pop.
2009
in
000’s
%
of
Pop.
2010
in
000’s
%
of
Pop.
2011
in
000’s
%
of
Pop.
2012
in
000’s
%
of
Pop.
Adventure Racing 203 0.4% 104 0.2% 125 0.3% 147 0.3% 183 0.4% 144 0.3% 362 0.7%
Backpacking 2,435 4.8% 1,786 3.6% 2,067 4.2% 1,849 3.7% 2,228 4.4% 1,778 3.5% 2,219 4.4%
Bicycling (BMX) 1,344 2.7% 935 1.9% 1,045 2.1% 726 1.5% 1,165 2.3% 783 1.5% 940 1.9%
Bicycling (Mountain/Non-Paved Surface) 2,369 4.7% 1,775 3.5% 2,083 4.2% 1,793 3.6% 1,927 3.8% 1,567 3.1% 1,612 3.2%
Bicycling (Road/Paved Surface, Mountain/
Non-Paved Surface, BMX) 17,463 34.8% 15,550 30.9% 14,716 29.6% 14,652 29.3% 13,657 27.1% 13,283 26.2% 13,421 26.5%
Bicycling (Road/Paved Surface) 17,401 34.7% 14,336 28.5% 13,325 26.8% 13,652 27.3% 12,442 24.7% 12,330 24.3% 12,397 24.5%
Birdwatching (More Than 1/4 Mile of
Home/Vehicle) 1,756 3.5% 1,194 2.4% 1,320 2.7% 1,473 2.9% 1,619 3.2% 1,661 3.3% 1,813 3.6%
Boardsailing/Windsurfing 225 0.4% 228 0.5% 236 0.5% 200 0.4% 221 0.4% 109 0.2% 215 0.4%
camping (Within 1/4 Mile of Vehicle/
Home) 12,702 25.3% 9,627 19.1% 9,012 18.1% 9,252 18.5% 8,779 17.4% 9,147 18.0% 8,065 15.9%
camping (Car, Backyard, or RV) 14,662 29.2% 11,730 23.3% 10,887 21.9% 11,443 22.9% 10,933 21.7% 11,540 22.8% 10,159 20.1%
camping (Recreational Vehicle) 5,993 11.9% 4,284 8.5% 3,783 7.6% 4,045 8.1% 3,810 7.6% 3,941 7.8% 3,732 7.4%
canoeing 3,515 7.0% 2,564 5.1% 2,497 5.0% 2,416 4.8% 2,811 5.6% 2,435 4.8% 2,735 5.4%
climbing (Sport/Indoor/Boulder) 2,583 5.1% 1,585 3.2% 1,379 2.8% 1,446 2.9% 1,583 3.1% 1,365 2.7% 1,281 2.5%
climbing (Traditional/Ice/Mountaineering) 470 0.9% 510 1.0% 441 0.9% 282 0.6% 354 0.7% 272 0.5% 436 0.9%
Fishing (Fly, Freshwater/Other or Saltwater) 15,406 30.7% 12,394 24.7% 11,282 22.7% 11,240 22.5% 10,254 20.4% 10,330 20.4% 9,945 19.7%
Fishing (Fly) 1,440 2.9% 711 1.4% 734 1.5% 880 1.8% 834 1.7% 735 1.4% 715 1.4%
Fishing (Freshwater/Other) 14,399 28.7% 10,932 21.7% 9,912 20.0% 9,987 20.0% 8,984 17.8% 9,038 17.8% 8,962 17.7%
Fishing (Saltwater) 2,859 5.7% 2,579 5.1% 2,257 4.5% 2,028 4.1% 1,816 3.6% 1,926 3.8% 1,935 3.8%
Hiking 7,138 14.2% 5,800 11.5% 6,078 12.2% 6,128 12.3% 5,976 11.9% 6,391 12.6% 6,114 12.1%
Hunting (All) 3,832 7.6% 2,088 4.2% 2,138 4.3% 2,225 4.4% 2,236 4.4% 2,296 4.5% 2,294 4.5%
Kayak Fishing n/a n/a n/a n/a n/a n/a n/a n/a 96 0.2% 181 0.4% 220 0.4%
Kayaking (Recreational) 1,189 2.4% 1,056 2.1% 1,227 2.5% 1,199 2.4% 1,152 2.3% 1,388 2.7% 1,743 3.4%
Kayaking (Sea/Touring) 124 0.2% 241 0.5% 178 0.4% 164 0.3% 358 0.7% 228 0.4% 333 0.7%
Kayaking (Whitewater) 244 0.5% 197 0.4% 165 0.3% 312 0.6% 256 0.5% 151 3.2% 432 0.9%
Rafting 1,100 2.2% 993 2.0% 869 1.7% 1,064 2.1% 966 1.9% 750 1.5% 793 1.6%
Running (Running/Jogging or Trail
Running) 13,164 26.2% 11,223 22.3% 9,552 19.2% 10,048 20.1% 11,360 22.6% 11,728 23.1% 12,133 24.0%
Running/Jogging 12,640 25.2% 11,102 22.1% 9,377 18.9% 9,999 20.0% 11,176 22.2% 11,587 22.9% 11,951 23.6%
Sailing 651 1.3% 526 1.0% 603 1.2% 664 1.3% 580 1.2% 382 0.8% 562 1.1%
Scuba Diving 225 0.4% 278 0.6% 323 0.6% 277 0.6% 306 0.6% 243 0.5% 379 0.7%
Skateboarding 8,745 17.4% 5,783 11.5% 5,469 11.0% 4,968 9.9% 4,377 8.7% 3,736 7.4% 3,797 7.5%
Skiing (Alpine/Downhill) n/a n/a 2,236 4.4% 2,417 4.9% 2,350 4.7% 2,442 4.9% 2,348 4.6% 1,879 3.7%
Skiing (Cross-Country) n/a n/a 568 1.1% 628 1.3% 661 1.3% 739 1.5% 635 1.3% 579 1.1%
Snorkeling 1,671 3.3% 1,610 3.2% 1,700 3.4% 1,315 2.6% 1,211 2.4% 1,480 2.9% 1,194 2.4%
Snowboarding n/a n/a 2,396 4.8% 2,267 4.6% 2,370 4.7% 2,561 5.1% 2,025 4.0% 1,676 3.3%
Snowshoeing n/a n/a 400 0.8% 474 1.0% 599 1.2% 615 1.2% 528 1.0% 681 1.3%
Stand Up Paddling n/a n/a n/a n/a n/a n/a n/a n/a 242 0.5% 186 0.4% 290 0.6%
Surfing 451 0.9% 465 0.9% 520 1.0% 589 1.2% 547 1.1% 523 1.0% 715 1.4%
telemarking (Downhill) n/a n/a 172 0.3% 234 0.5% 217 0.4% 286 0.6% 286 0.6% 539 1.1%
trail Running 1,161 2.3% 657 1.3% 618 1.2% 501 1.0% 676 1.3% 689 1.4% 810 1.6%
triathlon (Non-Traditional/Off Road) 58 0.1% 90 0.2% 80 0.2% 155 0.3% 93 0.2% 72 0.1% 221 0.4%
triathlon (Traditional/Road) 65 0.1% 113 0.2% 240 0.5% 136 0.3% 328 0.7% 168 0.3% 415 0.8%
Wakeboarding 1,520 3.0% 1,437 2.9% 1,084 2.2% 1,096 2.2% 1,089 2.2% 1,126 2.2% 998 2.0%
Wildlife Viewing (More Than 1/4 Mile of
Home/Vehicle) 4,519 9.0% 2,967 5.9% 3,213 6.5% 2,775 5.5% 3,035 6.0% 3,351 6.6% 3,197 6.3%
Youth Participation in Outdoor Activities, Ages 6-17

www.outdoorfoundation.org
Youth Participation in Outdoor Activities, Ages 6-17
The Outdoor Foundation | 57
2006
in
000’s
%
of
Pop.
2007
in
000’s
%
of
Pop.
2008
in
000’s
%
of
Pop.
2009
in
000’s
%
of
Pop.
2010
in
000’s
%
of
Pop.
2011
in
000’s
%
of
Pop.
2012
in
000’s
%
of
Pop.
Adventure Racing 123 0.4% 227 0.8% 224 0.8% 217 0.8% 252 0.9% 178 0.6% 419 1.4%
Backpacking 1,026 3.6% 1,262 4.4% 1,132 4.0% 1,358 4.7% 1,296 4.5% 1,065 3.7% 1,070 3.7%
Bicycling (BMX) 308 1.1% 401 1.4% 305 1.1% 266 0.9% 311 1.1% 256 0.9% 231 0.8%
Bicycling (Mountain/Non-Paved Surface) 970 3.4% 1,019 3.6% 776 2.7% 781 2.7% 955 3.3% 776 2.7% 995 3.4%
Bicycling (Road/Paved Surface, Mountain/
Non-Paved Surface, BMX) 2,778 9.8% 3,882 13.7% 3,687 13.0% 3,935 13.7% 4,106 14.2% 4,179 14.0% 4,361 15.0%
Bicycling (Road/Paved Surface) 2,673 9.5% 3,335 11.7% 3,297 11.6% 3,594 12.6% 3,818 13.2% 3,872 13.3% 4,002 13.7%
Birdwatching (More Than 1/4 Mile of
Home/Vehicle) 533 1.9% 670 2.4% 793 2.8% 676 2.4% 669 2.3% 777 2.7% 928 3.2%
Boardsailing/Windsurfing 296 1.0% 269 0.9% 341 1.2% 228 0.8% 385 1.3% 284 1.0% 250 0.9%
camping (Within 1/4 Mile of Vehicle/Home) 4,281 15.1% 3,862 13.6% 3,739 13.2% 4,004 14.0% 3,463 12.0% 3,896 13.4% 3,478 11.9%
camping (Car, Backyard, or RV) 4,312 15.3% 4,606 16.2% 4,483 15.8% 4,724 16.5% 4,020 13.9% 4,859 16.7% 4,071 14.0%
camping (Recreational Vehicle) 1,336 4.7% 1,589 5.6% 1,558 5.5% 1,444 5.0% 1,228 4.3% 1,749 6.0% 1,209 4.1%
canoeing 1,090 3.9% 1,521 5.4% 1,295 4.6% 1,154 4.0% 1,474 5.1% 1,357 4.7% 1,279 4.4%
climbing (Sport/Indoor/Boulder) 993 3.5% 1,054 3.7% 1,002 3.5% 769 2.7% 989 3.4% 856 2.9% 951 3.3%
climbing (Traditional/Ice/Mountaineering) 406 1.4% 510 1.8% 387 1.4% 381 1.3% 431 1.5% 390 1.3% 339 1.2%
Fishing (Fly, Freshwater/Other or Saltwater) 4,473 15.8% 4,809 16.9% 4,382 15.4% 4,337 15.2% 4,287 14.9% 4,647 16.0% 4,328 14.8%
Fishing (Fly) 789 2.8% 695 2.4% 718 2.5% 454 1.6% 643 2.2% 742 2.6% 691 2.4%
Fishing (Freshwater/Other) 4,068 14.4% 4,069 14.3% 3,549 12.5% 3,757 13.1% 3,683 12.8% 3,911 13.5% 3,600 12.4%
Fishing (Saltwater) 1,224 4.3% 1,410 5.0% 1,302 4.6% 1,017 3.6% 1,074 3.7% 1,162 4.0% 1,166 4.0%
Hiking 3,895 13.8% 3,465 12.2% 3,399 12.0% 3,392 11.9% 3,741 13.0% 3,894 13.4% 4,180 14.3%
Hunting (All) 1,791 6.3% 1,707 6.0% 1,522 5.4% 2,025 7.1% 1,686 5.8% 1,796 6.2% 1,809 6.2%
Kayak Fishing n/a n/a n/a n/a n/a n/a n/a n/a 204 0.7% 205 0.7% 165 0.5%
Kayaking (Recreational) 532 1.9% 795 2.8% 889 3.1% 790 2.8% 988 3.4% 1,392 4.8% 1,181 4.1%
Kayaking (Sea/Touring) 251 0.9% 241 0.8% 345 1.2% 221 0.8% 227 0.8% 413 1.4% 323 1.1%
Kayaking (Whitewater) 215 0.8% 223 0.8% 259 0.9% 217 0.8% 342 1.2% 357 1.2% 316 1.1%
Rafting 551 1.9% 789 2.8% 775 2.7% 668 2.3% 674 2.3% 618 2.1% 494 1.7%
Running (Running/Jogging or Trail Running) 7,744 27.4% 8,583 30.2% 8,061 28.4% 8,554 29.9% 9,033 31.3% 9,186 31.6% 10,430 35.8%
Running/Jogging 7,572 26.8% 8,441 29.7% 7,944 27.9% 8,404 29.4% 8,898 30.9% 9,022 31.1% 10,281 35.3%
Sailing 214 0.8% 455 1.6% 595 2.1% 416 1.5% 337 1.2% 498 1.7% 388 1.3%
Scuba Diving 623 2.2% 523 1.8% 570 2.0% 294 1.0% 384 1.3% 275 0.9% 358 1.2%
Skateboarding 970 3.4% 1,377 4.8% 1,011 3.6% 958 3.3% 999 3.5% 955 3.3% 1,153 4.0%
Skiing (Alpine/Downhill) n/a n/a 1,826 6.4% 1,522 5.4% 1,431 5.0% 1,707 5.9% 1,524 5.2% 1,072 3.7%
Skiing (Cross-Country) n/a n/a 452 1.6% 496 1.7% 457 1.6% 586 2.0% 602 2.1% 453 1.6%
Snorkeling 1,251 4.4% 1,168 4.1% 1,144 4.0% 969 3.4% 1,251 4.3% 982 3.4% 985 3.4%
Snowboarding n/a n/a 1,896 6.7% 2,006 7.1% 2,049 7.2% 1,874 6.5% 1,874 6.5% 1,492 5.1%
Snowshoeing n/a n/a 429 1.5% 358 1.3% 383 1.3% 477 1.7% 552 1.9% 451 1.5%
Stand Up Paddling n/a n/a n/a n/a n/a n/a n/a n/a 171 0.6% 281 1.0% 259 0.9%
Surfing 749 2.7% 663 2.3% 590 2.1% 450 1.6% 607 2.1% 434 1.5% 504 1.7%
telemarking (Downhill) n/a n/a 310 1.1% 295 1.0% 269 0.9% 310 1.1% 366 1.3% 343 1.2%
trail Running 1,018 3.6% 796 2.8% 939 3.3% 1,003 3.5% 969 3.4% 1,175 4.0% 1,201 4.1%
triathlon (Non-Traditional/Off Road) 52 0.2% 113 0.4% 198 0.7% 128 0.4% 185 0.6% 97 0.3% 251 0.9%
triathlon (Traditional/Road) 70 0.2% 173 0.6% 266 0.9% 254 0.9% 216 0.7% 236 0.8% 360 1.2%
Wakeboarding 597 2.1% 1,040 3.7% 809 2.8% 794 2.8% 798 2.8% 805 2.8% 680 2.3%
Wildlife Viewing (More Than 1/4 Mile of
Home/Vehicle) 1,460 5.2% 1,587 5.6% 1,859 6.5% 1,501 5.2% 1,351 4.7% 1,799 6.2% 1,679 5.8%
Young Adult Participation in Outdoor Activities, Ages 18-24

www.outdoorfoundation.org58 | The Outdoor Foundation
2006
in
000’s
%
of
Pop.
2007
in
000’s
%
of
Pop.
2008
in
000’s
%
of
Pop.
2009
in
000’s
%
of
Pop.
2010
in
000’s
%
of
Pop.
2011
in
000’s
%
of
Pop.
2012
in
000’s
%
of
Pop.
Adventure Racing 725 0.3% 698 0.3% 920 0.3% 1,089 0.4% 1,339 0.5% 1,065 0.4% 2,170 0.8%
Backpacking (Overnight) 7,067 2.6% 6,637 2.4% 7,867 2.8% 7,647 2.7% 8,349 2.9% 7,095 2.5% 8,771 3.1%
Bicycling (BMX) 1,655 0.6% 1,887 0.7% 1,904 0.7% 1,811 0.6% 2,369 0.8% 1,547 0.5% 2,175 0.8%
Bicycling (Mountain/Non-Paved Surface) 6,751 2.5% 6,892 2.5% 7,592 2.7% 7,142 2.5% 7,161 2.5% 6,816 2.4% 7,714 2.7%
Bicycling (Road/Paved Surface, Mountain/
Non-Paved Surface, BMX) 39,688 14.5% 42,126 15.2% 41,548 14.9% 43,264 15.4% 42,347 14.9% 42,970 15.0% 42,336 14.7%
Bicycling (Road/Paved Surface) 38,457 14.0% 38,940 14.1% 38,114 13.6% 40,140 14.3% 39,320 13.9% 40,348 14.1% 39,232 13.7%
Birdwatching (More Than 1/4 Mile of
Home/Vehicle) 11,070 4.0% 13,476 4.9% 14,399 5.2% 13,294 4.7% 13,339 4.7% 12,794 4.5% 14,275 5.0%
Boardsailing/Windsurfing 938 0.3% 1,118 0.4% 1,307 0.5% 1,128 0.4% 1,617 0.6% 1,151 0.4% 1,593 0.6%
camping (Within 1/4 Mile of Vehicle/
Home) 35,618 13.0% 31,375 11.3% 33,686 12.0% 34,338 12.2% 30,996 10.9% 32,925 11.5% 29,982 10.4%
camping (Car, Backyard, or RV) 43,123 15.7% 39,836 14.4% 42,396 15.2% 44,034 15.6% 39,909 14.1% 42,548 14.9% 38,049 13.3%
camping (Recreational Vehicle) 16,946 6.2% 16,168 5.8% 16,517 5.9% 17,436 6.2% 15,865 5.6% 16,698 5.8% 15,108 5.3%
canoeing 9,154 3.3% 9,797 3.5% 9,935 3.6% 10,058 3.6% 10,553 3.7% 9,787 3.4% 9,839 3.4%
climbing (Sport/Indoor/Boulder) 4,728 1.7% 4,514 1.6% 4,769 1.7% 4,313 1.5% 4,770 1.7% 4,119 1.4% 4,592 1.6%
climbing (Traditional/Ice/Mountaineering) 1,586 0.6% 2,084 0.8% 2,288 0.8% 1,835 0.7% 2,198 0.8% 1,609 0.6% 2,189 0.8%
Fishing (Fly, Freshwater/Other or Saltwater) 49,696 18.3% 51,836 18.7% 48,206 17.2% 48,046 17.0% 45,394 16.0% 46,178 16.2% 47,049 16.4%
Fishing (Fly) 6,071 2.2% 5,756 2.1% 5,941 2.1% 5,568 2.0% 5,478 1.9% 5,683 2.1% 6,012 2.1%
Fishing (Freshwater/Other) 43,100 15.7% 43,859 15.8% 40,331 14.4% 40,961 14.5% 38,860 13.7% 38,868 13.6% 39,135 13.6%
Fishing (Saltwater) 12,466 4.5% 14,437 5.2% 13,804 4.9% 12,303 4.4% 11,809 4.2% 11,983 4.2% 12,017 4.2%
Hiking 29,863 10.9% 29,965 10.8% 32,511 11.6% 32,572 11.6% 32,496 11.5% 34,492 12.1% 34,545 12.0%
Hunting (All) 15,097 5.5% 14,138 5.1% 13,980 5.0% 15,273 5.4% 14,007 4.9% 14,887 5.2% 14,705 5.1%
Kayak Fishing n/a n/a n/a n/a n/a n/a n/a n/a 1,044 0.4% 1,201 0.4% 1,409 0.5%
Kayaking (Recreational) 4,134 1.5% 5,070 1.8% 6,240 2.2% 6,212 2.2% 6,465 2.3% 8,229 2.9% 8,144 2.8%
Kayaking (Sea/Touring) 1,136 0.4% 1,485 0.5% 1,780 0.6% 1,771 0.6% 2,144 0.8% 2,029 0.7% 2,446 0.9%
Kayaking (Whitewater) 828 0.3% 1,207 0.4% 1,242 0.4% 1,369 0.5% 1,842 0.6% 1,546 0.5% 1,878 0.7%
Rafting 3,609 1.3% 4,340 1.6% 4,651 1.7% 4,318 1.5% 4,460 1.6% 3,821 1.3% 3,690 1.3%
Running (Running/Jogging or Trail
Running) 38,719 14.1% 41,957 15.2% 42,103 15.1% 44,732 15.9% 50,159 17.8% 51,495 18.0% 53,214 18.5%
Running/Jogging 38,559 14.1% 41,064 14.8% 41,130 14.7% 43,892 15.6% 49,408 17.4% 50,713 17.7% 52,187 18.2%
Sailing 3,390 1.2% 3,786 1.4% 4,226 1.5% 4,342 1.5% 3,869 1.4% 3,725 1.3% 3,958 1.4%
Scuba Diving 2,965 1.1% 2,965 1.1% 3,216 1.2% 2,723 1.0% 3,153 1.1% 2,579 0.9% 2,982 1.0%
Skateboarding 10,130 3.7% 8,429 3.0% 7,807 2.8% 7,352 2.6% 6,808 2.4% 5,827 2.0% 6,627 2.3%
Skiing (Alpine/Downhill) n/a n/a 10,362 3.7% 10,346 3.7% 10,919 3.9% 11,504 4.1% 10,201 3.6% 8,243 2.9%
Skiing (Cross-Country) n/a n/a 3,530 1.3% 3,848 1.4% 4,157 1.5% 4,530 1.6% 3,641 1.3% 3,307 1.2%
Snorkeling 8,395 3.1% 9,294 3.4% 10,296 3.7% 9,358 3.3% 9,305 3.3% 9,318 3.3% 8,011 2.8%
Snowboarding n/a n/a 6,841 2.5% 7,159 2.6% 7,421 2.6% 8,196 2.9% 7,579 2.7% 7,351 2.6%
Snowshoeing n/a n/a 2,400 0.9% 2,922 1.0% 3,431 1.2% 3,823 1.3% 4,111 1.4% 4,029 1.4%
Stand Up Paddling n/a n/a n/a n/a n/a n/a n/a n/a 1,050 0.4% 1,242 0.4% 1,542 0.5%
Surfing 2,170 0.8% 2,206 0.8% 2,607 0.9% 2,403 0.9% 2,767 1.0% 2,195 0.8% 2,895 1.0%
telemarking (Downhill) n/a n/a 1,173 0.4% 1,435 0.5% 1,482 0.5% 1,821 0.6% 2,099 0.7% 2,766 1.0%
trail Running 4,558 1.7% 4,216 1.5% 4,857 1.7% 4,833 1.7% 5,136 1.8% 5,610 2.0% 6,003 2.1%
triathlon (Non-Traditional/Off Road) 281 0.1% 483 0.2% 602 0.2% 666 0.2% 929 0.3% 709 0.2% 1,442 0.5%
triathlon (Traditional/Road) 640 0.2% 798 0.3% 1,087 0.4% 1,208 0.4% 1,978 0.7% 1,393 0.5% 2,184 0.8%
Wakeboarding 3,046 1.1% 3,521 1.3% 3,544 1.3% 3,577 1.3% 3,645 1.3% 3,389 1.2% 3,348 1.2%
Wildlife Viewing (More Than 1/4 Mile of
Home/Vehicle) 20,294 7.4% 22,974 8.3% 24,113 8.6% 21,291 7.6% 21,025 7.4% 21,964 7.7% 22,999 8.0%
Participation in Outdoor Activities, All Americans Ages 6+

www.outdoorfoundation.org
Participation in Outdoor Activities, All Americans Ages 6+
The Outdoor Foundation | 59
Participation in Other Activities, All Americans Ages 6+2006
in
000’s
%
of
Pop.
2007
in
000’s
%
of
Pop.
2008
in
000’s
%
of
Pop.
2009
in
000’s
%
of
Pop.
2010
in
000’s
%
of
Pop.
2011
in
000’s
%
of
Pop.
2012
in
000’s
%
of
Pop.
indoor Fitness ActivitiesAbdominal Machine/Device 23,656 8.6% 20,426 7.4% 19,917 7.1% 19,465 6.9% 18,491 6.5% 18,950 6.6% 18,864 6.6%
Aerobics (High-Impact) 10,934 4.0% 11,287 4.1% 12,272 4.4% 13,269 4.7% 15,864 5.6% 15,646 5.5% 16,710 5.8%
Aerobics (Low-Impact) 21,952 8.0% 22,397 8.1% 24,168 8.6% 25,685 9.1% 27,177 9.6% 24,723 8.7% 26,690 9.3%
Aerobics (Step) 8,676 3.2% 8,528 3.1% 10,318 3.7% 10,784 3.8% 11,283 4.0% 9,263 3.2% 9,891 3.4%
Aquatic Exercise 9,528 3.5% 9,757 3.5% 9,267 3.3% 8,662 3.1% 9,231 3.3% 8,852 3.1% 9,502 3.3%
calisthenics 7,120 2.6% 8,629 3.1% 9,147 3.3% 9,106 3.2% 9,088 3.2% 8,485 3.0% 10,227 3.6%
cardio Kickboxing 4,952 1.8% 4,812 1.7% 4,997 1.8% 6,002 2.1% 6,571 2.3% 6,404 2.2% 7,047 2.5%
cross-country Ski Machine 4,168 1.5% 3,696 1.3% 3,490 1.2% 3,097 1.1% 3,084 1.1% 2,742 1.0% 2,740 1.0%
Elliptical Motion trainer 24,548 9.0% 23,586 8.5% 25,284 9.0% 26,521 9.4% 28,117 9.9% 31,351 11.0% 25,769 9.0%
Free Weights (Barbells) 28,887 10.5% 25,499 9.2% 26,142 9.4% 27,048 9.6% 27,339 9.6% 26,773 9.4% 26,603 9.3%
Free Weights (Dumbbells) 35,462 12.9% 32,371 11.7% 34,391 12.3% 35,744 12.7% 37,388 13.2% 35,551 12.4% 37,657 13.1%
Free Weights (Hand Weights) 46,627 17.0% 43,821 15.8% 42,997 15.4% 45,934 16.3% 45,922 16.2% 47,965 16.8% 45,164 15.7%
Home Gym Exercise 26,687 9.7% 25,823 9.3% 24,514 8.8% 24,762 8.8% 24,581 8.7% 25,585 9.0% 25,399 8.8%
Other Exercise to Music 21,749 7.9% 22,294 8.1% 21,893 7.8% 22,045 7.8% 22,960 8.1% 24,260 8.5% 25,808 9.0%
Pilates training 10,925 4.0% 9,192 3.3% 8,886 3.2% 8,653 3.1% 8,154 2.9% 8,860 3.1% 8,178 2.8%
Rowing Machine 9,500 3.5% 8,782 3.2% 9,021 3.2% 9,174 3.3% 9,763 3.4% 9,766 3.4% 10,185 3.5%
Stair climbing Machine 14,978 5.5% 13,521 4.9% 14,204 5.1% 13,101 4.7% 13,436 4.7% 13,382 4.7% 12,576 4.4%
Stationary cycling (Recumbent) 11,694 4.3% 10,818 3.9% 11,389 4.1% 11,208 4.0% 11,709 4.1% 12,156 4.3% 11,141 3.9%
Stationary cycling (Group) 6,610 2.4% 6,314 2.3% 6,693 2.4% 6,831 2.4% 8,876 3.1% 8,599 3.0% 8,355 2.9%
Stationary cycling (Upright) 26,954 9.8% 24,531 8.9% 25,304 9.1% 24,528 8.7% 24,627 8.7% 24,190 8.5% 24,486 8.5%
Stretching 32,858 12.0% 36,181 13.1% 36,288 13.0% 36,310 12.9% 35,129 12.4% 34,244 12.0% 37,502 13.1%
Swimming (Fitness/Competition) 18,220 6.6% 18,368 6.6% 19,041 6.8% 17,443 6.2% 17,145 6.0% n/a n/a n/a n/a
Swimming (Fitness) n/a n/a n/a n/a n/a n/a n/a n/a n/a n/a 21,517 7.5% 24,914 8.7%
tai chi n/a n/a n/a n/a 3,424 1.2% 3,205 1.1% 3,180 1.1% 2,769 1.0% 3,637 1.3%
treadmill 52,161 19.0% 50,073 18.1% 49,371 17.7% 51,418 18.3% 53,131 18.7% 53,388 18.7% 48,289 16.8%
Walking for Fitness 101,229 36.9% 108,740 39.3% 111,668 39.9% 110,095 39.1% 114,068 40.2% 111,362 39.0% 116,695 40.6%
Weight/Resistance Machines 43,651 15.9% 39,290 14.2% 38,397 13.7% 39,752 14.1% 38,618 13.6% 40,477 14.2% 37,522 13.1%
Yoga n/a n/a n/a n/a 17,758 6.4% 20,109 7.1% 21,886 7.7% 22,327 7.8% 24,180 8.4%
team SportsBaseball 14,586 5.3% 16,058 5.8% 15,020 5.4% 13,837 4.9% 14,558 5.1% 12,564 4.4% 13,389 4.7%
Basketball 23,680 8.6% 25,961 9.4% 26,254 9.4% 24,007 8.5% 26,304 9.3% 23,275 8.1% 24,141 8.4%
cheerleading 2,931 1.1% 3,279 1.2% 3,104 1.1% 3,036 1.1% 3,232 1.1% 2,865 1.0% 3,622 1.3%
Field Hockey 774 0.3% 1,127 0.4% 1,118 0.4% 1,066 0.4% 1,298 0.5% 996 0.3% 1,478 0.5%
Football (Flag) n/a n/a n/a n/a 7,310 2.6% 6,553 2.3% 6,767 2.4% 5,883 2.1% 5,847 2.0%
Football (Tackle) 8,404 3.1% 7,939 2.9% 7,692 2.8% 6,794 2.4% 6,905 2.4% 5,990 2.1% 6,451 2.2%
Football (Touch) 12,344 4.5% 12,988 4.7% 10,493 3.8% 8,959 3.2% 8,367 2.9% 7,000 2.4% 7,590 2.6%
ice Hockey 1,717 0.6% 1,840 0.7% 1,902 0.7% 2,134 0.8% 2,145 0.8% 2,117 0.7% 2,610 0.9%
lacrosse 871 0.3% 1,058 0.4% 1,127 0.4% 1,197 0.4% 1,648 0.6% 1,353 0.5% 1,860 0.6%
Rugby 514 0.2% 617 0.2% 690 0.2% 750 0.3% 1,130 0.4% 569 0.2% 1,205 0.4%

www.outdoorfoundation.org60 | The Outdoor Foundation
2006
in
000’s
%
of
Pop.
2007
in
000’s
%
of
Pop.
2008
in
000’s
%
of
Pop.
2009
in
000’s
%
of
Pop.
2010
in
000’s
%
of
Pop.
2011
in
000’s
%
of
Pop.
2012
in
000’s
%
of
Pop.
Soccer (Indoor) 4,701 1.7% 4,237 1.5% 4,737 1.7% 4,913 1.7% 4,927 1.7% 4,335 1.5% 4,898 1.7%
Soccer (Outdoor) 13,598 5.0% 13,708 5.0% 14,223 5.1% 13,691 4.9% 14,075 5.0% 13,259 4.6% 12,630 4.4%
Softball (Fast Pitch) 1,759 0.6% 2,345 0.8% 2,316 0.8% 2,636 0.9% 2,389 0.8% 2,411 0.8% 2,838 1.0%
Softball (Slow Pitch) 9,518 3.5% 9,485 3.4% 9,835 3.5% 8,525 3.0% 8,429 3.0% 7,189 2.5% 7,633 2.7%
Swimming (Competition) n/a n/a n/a n/a n/a n/a n/a n/a n/a n/a 2,363 0.8% 2,641 0.9%
track and Field 4,031 1.5% 4,691 1.7% 4,516 1.6% 4,443 1.6% 4,322 1.5% 4,360 1.5% 4,154 1.4%
Volleyball (Beach) 3,315 1.2% 3,878 1.4% 4,171 1.5% 4,476 1.6% 5,028 1.8% 3,874 1.4% 5,136 1.8%
Volleyball (Court) 6,132 2.2% 6,986 2.5% 8,190 2.9% 7,283 2.6% 7,346 2.6% 5,978 2.1% 6,791 2.4%
Volleyball (Grass) 4,372 1.6% 4,940 1.8% 5,086 1.8% 4,853 1.7% 4,574 1.6% 3,847 1.3% 4,328 1.5%
Other ActivitiesArchery 7,215 2.6% 5,950 2.1% 6,409 2.3% 6,326 2.2% 6,319 2.2% 6,623 2.3% 7,722 2.7%
Badminton 5,981 2.2% 7,057 2.5% 7,239 2.6% 7,699 2.7% 7,590 2.7% 6,679 2.3% 7,876 2.7%
Billiards/Pool 47,953 17.5% 51,089 18.5% 49,018 17.5% 43,005 15.3% 39,385 13.9% 34,277 12.0% 35,147 12.2%
Bowling 54,421 19.9% 60,184 21.7% 58,650 21.0% 57,293 20.3% 55,877 19.7% 51,935 18.2% 45,292 15.8%
Boxing 2,040 0.7% 2,279 0.8% 2,358 0.8% 2,932 1.0% n/a n/a n/a n/a 5,190 1.8%
Boxing (for Competition) n/a n/a n/a n/a n/a n/a n/a n/a 855 0.3% 639 0.2% 1,278 0.4%
Boxing (for Fitness) n/a n/a n/a n/a n/a n/a n/a n/a 4,788 1.7% 4,473 1.6% 5,190 1.8%
cardio tennis n/a n/a n/a n/a 830 0.3% 1,177 0.4% 1,503 0.5% 1,083 0.4% 1,442 0.5%
Darts 22,974 8.4% 24,709 8.9% 23,451 8.4% 20,022 7.1% 18,118 6.4% 16,379 5.7% 16,001 5.6%
Golf (9/18-Hole Course) 29,816 10.9% 29,528 10.7% 28,571 10.2% 27,103 9.6% 26,122 9.2% 25,682 9.0% 22,442 7.8%
Gymnastics 3,630 1.3% 4,066 1.5% 3,883 1.4% 4,021 1.4% 4,815 1.7% 4,832 1.7% 5,398 1.9%
Horseback Riding 11,384 4.2% 12,098 4.4% 10,816 3.9% 9,755 3.5% 9,809 3.5% 8,861 3.1% 7,985 2.8%
ice Skating 9,653 3.5% 11,430 4.1% 10,999 3.9% 10,929 3.9% 12,024 4.2% 11,227 3.9% 11,201 3.9%
Jet Skiing 6,918 2.5% 8,055 2.9% 7,815 2.8% 7,724 2.7% 7,753 2.7% 7,395 2.6% 6,597 2.3%
Martial Arts 5,998 2.2% 6,865 2.5% 6,770 2.4% 6,516 2.3% 5,488 1.9% 4,585 1.6% 5,566 1.9%
Martial Arts (for Competition) n/a n/a n/a n/a n/a n/a n/a n/a 910 0.3% 515 0.2% 983 0.3%
Martial Arts (for Fitness) n/a n/a n/a n/a n/a n/a n/a n/a 1,745 0.6% 1,649 0.6% 2,305 0.8%
Paintball 4,547 1.7% 5,476 2.0% 4,857 1.7% 4,552 1.6% 3,655 1.3% 3,557 1.2% 3,499 1.2%
Racquetball 3,559 1.3% 4,229 1.5% 4,993 1.8% 4,575 1.6% 4,630 1.6% 4,084 1.4% 4,055 1.4%
Roller Hockey 1,383 0.5% 1,681 0.6% 1,456 0.5% 1,397 0.5% 1,350 0.5% 1,124 0.4% 1,611 0.6%
Roller Skating (2x2 Wheels) 7,553 2.8% 8,921 3.2% 7,855 2.8% 8,147 2.9% 8,126 2.9% 7,576 2.7% 6,973 2.4%
Roller Skating (Inline Wheels) 12,314 4.5% 10,814 3.9% 9,608 3.4% 8,276 2.9% 7,980 2.8% 6,921 2.4% 6,374 2.2%
Scooter Riding (Non-Motorized) 7,653 2.8% 6,782 2.5% 6,394 2.3% 5,064 1.8% 4,861 1.7% 4,797 1.7% 4,476 1.6%
Shooting (Sport/Clays) 4,062 1.5% 4,115 1.5% 4,282 1.5% 4,182 1.5% 4,399 1.6% 4,193 1.5% 4,896 1.7%
Shooting (Trap/Skeet) 3,013 1.1% 3,376 1.2% 3,669 1.3% 3,368 1.2% 3,610 1.3% 3,295 1.2% 3,886 1.4%
Snowmobiling n/a n/a 4,811 1.7% 4,660 1.7% 4,798 1.7% 5,116 1.8% 4,700 1.6% 2,876 1.0%
Squash 503 0.2% 612 0.2% 706 0.3% 885 0.3% 1,177 0.4% 1,046 0.4% 1,533 0.5%
table tennis 15,091 5.5% 15,955 5.8% 17,201 6.2% 19,301 6.9% 19,446 6.9% 17,676 6.2% 15,971 5.6%
target Shooting (Handgun) 9,995 3.6% 11,736 4.2% 13,365 4.8% 12,473 4.4% 12,497 4.4% 14,778 5.2% 16,059 5.6%
target Shooting (Rifle) 11,803 4.3% 12,436 4.5% 13,102 4.7% 12,730 4.5% 12,544 4.4% 13,520 4.7% 14,186 4.9%
tennis 14,563 5.3% 16,940 6.1% 18,558 6.6% 18,534 6.6% 18,903 6.7% 16,641 5.8% 17,020 5.9%
Ultimate Frisbee 3,698 1.3% 4,038 1.5% 4,879 1.7% 4,392 1.6% 4,749 1.7% 4,986 1.7% 5,276 1.8%
Walking for Fitness 101,229 36.9% 108,740 39.3% 111,668 39.9% 110,095 39.1% 114,068 40.2% 111,362 39.0% 116,695 40.6%
Water Skiing 5,273 1.9% 5,918 2.1% 5,593 2.0% 4,862 1.7% 4,836 1.7% 4,416 1.5% 4,452 1.6%
Wrestling 2,914 1.1% 3,313 1.2% 3,358 1.2% 2,982 1.1% 2,089 0.7% 1,852 0.6% 1,991 0.7%

The Outdoor Foundation | 61www.outdoorfoundation.org
Hunting (all) represents a combination of four individually measured activities, including hunting (rifle), hunting (shotgun), hunting (handgun) and hunting (bow).
For greater accuracy, snow sports participation is measured annually for each winter season. In the preceding tables, 2007 participation represents participation in the 2006/2007 winter season, 2008 participation represents participation in the 2007/2008 winter season, 2009 participation represents participation in the 2008/2009 winter season, 2010 participation represents participation in the 2009/2010 winter season.
GroupingsIn this report, outdoor activities include adventure racing, backpacking, bicycling (BMX), bicycling (mountain/non-paved surface), bicycling (road/paved surface), birdwatching (more than 1/4 mile from home/vehicle), boardsailing/windsurfing, camping (backyard or car, within 1/4 mile of vehicle/home), camping (recreational vehicle), canoeing, climbing (sport/indoor/boulder), climbing (traditional/ice/mountaineering), fishing (fly), fishing (freshwater/other), fishing (saltwater), hiking, hunting (rifle), hunting (shotgun), hunting (handgun), hunting (bow), kayak fishing, kayaking (recreational), kayaking (sea/touring), kayaking (white water), rafting, running/jogging, sailing, scuba diving, skateboarding, skiing (alpine/downhill), skiing (cross-country), snorkeling, snowboarding, snowshoeing, stand up paddling, surfing, telemarking (downhill), trail running, triathlon (non-traditional/off road), triathlon (traditional/road), wakeboarding, wildlife viewing (more than 1/4 mile from home/vehicle).
Team sports include baseball, basketball, cheerleading, ice hockey, field hockey, football (touch), football (tackle), football (flag), lacrosse, rugby, soccer (indoor), soccer (outdoor), softball (regular), softball (fast-pitch), track and field, volleyball (court), volleyball (grass), volleyball (beach).
Indoor fitness activities include aerobics (high impact), aerobics (low impact), aerobics (step), other exercise to music, aquatic exercise, calisthenics, cardio kickboxing, pilates training, stretching, yoga, tai chi, barbells, dumbbells, hand weights, weight/resistance machines, home gym exercise, abdominal machine, rowing machine exercise, stationary cycling (upright bike), stationary cycling (group), stationary cycling (recumbent bike), treadmill exercise, stair-climbing machine exercise, elliptical motion trainer, and cross-country ski machine exercise.
notes

62 | The Outdoor Foundation www.outdoorfoundation.org
MethodDuring January and early February of 2013, a total of 42,363 online interviews were carried out with a nationwide sample of individuals and households from the US Online Panel operated by Synovate/IPSOS. A total of 15,770 individual and 26,593 household surveys were completed. The total panel has over one million members and is maintained to be representative of the US population. Oversampling of ethnic groups took place to boost response from typically under responding groups.
A weighting technique was used to balance the data to reflect the total US population aged six and above. The following variables were used: gender, age, income, household size, region, population density and panel join date. The total population figure used was 287,138,000 people aged 6 and above. The 2013 participation survey sample size of 42,363 completed interviews provides a high degree of statistical accuracy. All surveys are subject to some level of standard error—that is, the degree to which the results might differ from those obtained by a complete census of every person in the US. A sport with a participation rate of five percent has a confidence interval of plus or minus 0.21 percentage points at the 95 percent confidence level. This translates to plus or minus four percent of participants.
The survey methodology changed slightly in 2007 to include household interviews in addition to individual interviews. The two methodologies are comparable and all results are indicative of the state of sports and leisure participation. Caution is recommended, however, in placing undo emphasis on trends extending back to 2006.
Unless otherwise noted, the data in this report was collected during the latest 2013 participation survey, which focused on American participation in the 2012 calendar year. 2006, 2007, 2008, 2009, 2010 and 2011 data noted in the report was collected in previous surveys.
Charts in this report may not always add up to 100 percent exactly. This is a result of rounding errors and the errors do not persist in the unrounded data.
Youth interviews All interviews of children under 13 were carried out following the guidelines set out in the Children’s Online Privacy Protection Act of 1998 (COPPA). No children were contacted directly. The panel is a balanced sample of households with children in each age group, but contact is always made through designated adult panelists. The adult panelist receives the survey invitation on behalf of a specified child, age 6 to 12, and they are asked to complete the survey together. Respondents ages 13 to 17 are contacted in a manner similar to respondents ages 6 to 12, but they are asked to complete the survey themselves.

The Outdoor Foundation | 63www.outdoorfoundation.org
We would like to thank the generous donors of The Outdoor Foundation for their support of our work to connect youth with the outdoors for healthier children, healthier communities and healthier businesses. Visit The Outdoor Foundation online at outdoorfoundation.org for a complete list of donors.
We would also like to thank the members of The Outdoor Foundation Board of Directors:
Chairperson — Fred Clark, CEO, ThuleVice Chairperson — Larry Selzer, President & CEO, The Conservation FundSecretary — Beaver Theodosakis, President, PranaTreasurer — David Kulow, Owner, All Terrain (Rosemont Ventures, Inc.)Past Chairperson — Steve Shuster, Global Brand Manger, W.L. Gore
Carolyn Brodsky, CEO, Sterling Ropes Frank Hugelmeyer, President, Outdoor Industry AssociationDavid Labistour, CEO, Mountain Equipment Co-OpJohn Lacy, EVP Global Product & NA Sales, BurtonSue Rechner, President & CEO, Confluence WatersportsSteve Rendle, President, VF OutdoorMike Moniz, CEO, CircadenceJim Zwiers, President, Outdoor Group, Wolverine World Wide, Inc.
About the Outdoor Foundation The Outdoor Foundation is a not-for-profit 501(c)(3) established by Outdoor Industry Association to inspire and grow future generations of outdoor enthusiasts. Its vision is to be a driving force behind a massive increase in active outdoor recreation in America.
For more information visit www.outdoorfoundation.org.
Acknowledgements

© 2013, All Rights Reserved