outbreak maps: visual discovery in your data maps: visual discovery in your data jeff phillips, data...
TRANSCRIPT

Outbreak Maps: Visual Discovery in Your Data
Jeff Phillips, Data Visualization R&D

SAS: The Power to Know
You can’t do that with GMAP…
If you torture data sufficiently,
it will confess to almost anything.
- F. Menger

Problems Needing Spatial Data Discovery Has an illness appeared in clusters around particular
geographic areas?
Do you have product failures that occur in the same part of the country?
Are you getting more customer complaints at one store location than others?
Do you have asset protection issues in a remote area of your store?

Tips and Tricks for Spatial Data Discovery In many cases, problems are clustered together
geographically for reasons you may not have considered.
Without seeing this information on a map, you may not be aware of a hot spot that needs investigating.
This presentation will demonstrate how to create several types of outbreak maps for better visualization of problems and how to monitor these situations adequately.

Four ways to enhance your data spatially:
1. Choropleth maps specializing in changes and differences using web data.
2. Dot-density maps showing clusters and outbreaks.
3. Maps showing “crumb trails” to discover supply chain or delivery issues.
4. Maps to help solve travel routing to multiple sites.

The power of Data Step!
Add spatial capabilities to your data so it can be utilized geographically.
Some important utility procedures:
PROC GEOCODE
PROC GINSIDE
PROC GPROJECT
PROC IMPORT (local and directly from internet address)
Annotate is your friend. Adding markups to your maps is not that hard.

Choropleth map with custom levels

Choropleth map with custom levels

Choropleth map with custom levels

Using web data
Potentially “live” web data using PROC IMPORT
No need to have local files and get immediate updates.
Code:
filename rawurl url
"http://www.irs.gov/pub/irs-soi/countyinflow&year1&year2..csv"
proxy=‘<put your proxy info here, if necessary>' debug;
proc import out=raw_data datafile=rawurl dbms=csv replace;
getnames=yes;
datarow=2;
run;

Using web data
Auto-loaded annotation macros.
Code: /* Use a helper macro to create an annotate data set for the centroid of the
county of interest */
%annomac;
%maplabel( anno_star, anno_star, anno_star, county, %str(state county), size=5,
font=marker, color=cyan );
/* "Fix" the data set to use the correct marker text and outline it */
data anno_star;
length style $8;
set anno_star;
text='V';
output;
style='markere'; color='black'; output;
run;

Dot-density maps
Add a spatial component to your data:
Match with existing data like zipcode data set
PROC GEOCODE
“Fuzz” the locations using random number generator.
How much fuzz? Based on the scale of your map.
Provide ShiftXY macro.

Start with a small fuzz distance…

…try a little bigger…

…and bigger…
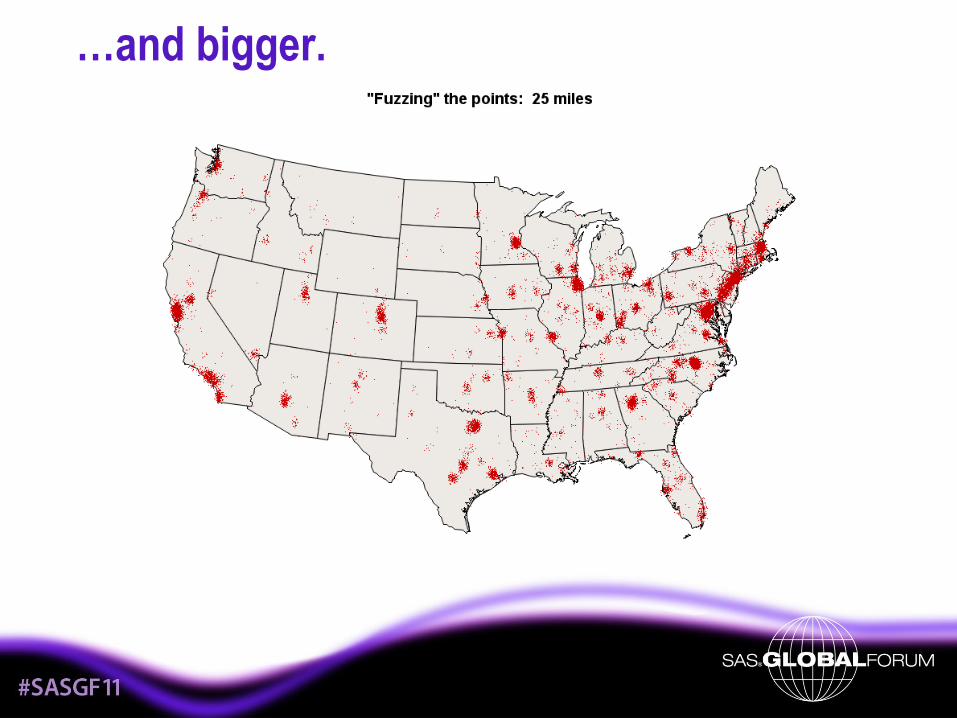
…and bigger.

Don’t go too far…
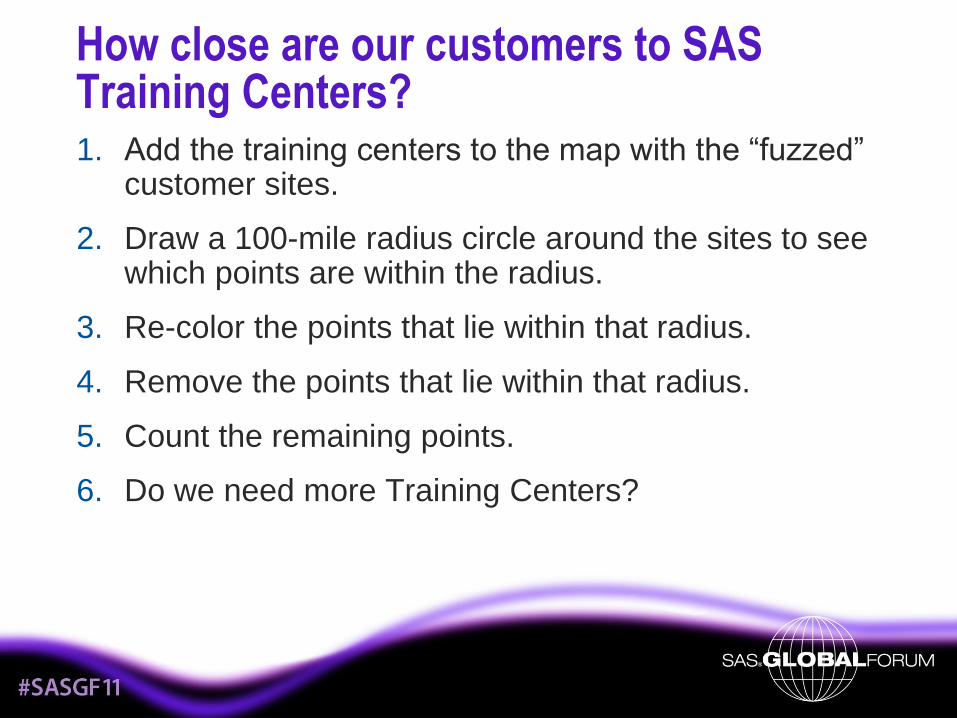
How close are our customers to SAS Training Centers? 1. Add the training centers to the map with the “fuzzed”
customer sites.
2. Draw a 100-mile radius circle around the sites to see which points are within the radius.
3. Re-color the points that lie within that radius.
4. Remove the points that lie within that radius.
5. Count the remaining points.
6. Do we need more Training Centers?

Add the training center points

Draw 100-mile radius circles

Re-color customers within the radius

Only show customers outside the radius

Where to locate the next training center

Add some labels instead of a legend

Non-geographic maps
Take what we’ve learned with “fuzzing” and apply it to a store floorplan.
Multiple ways to view data:
Choropleth
Dot-density
Scenario: Map location of empty packages in a retail establishment.
Empty packages are typically where thieves remove packaging containing “hard tags” or electronic security sensors.

Number of empty packages by bay

Using “fuzzed” dot locations

Only output dots for Electronics Department

Tips and tricks for non-geographic maps
How to get location information for non-geographic maps
Code:
%annomac;
%centroid( store, storec, id );
Reads polygons defined by “id” and returns the centroid of the polygon in the “storec” output data set.
Use the centroid value to “fuzz” the dots.

Routing information for suspect PO

Routing information for all cross-country POs
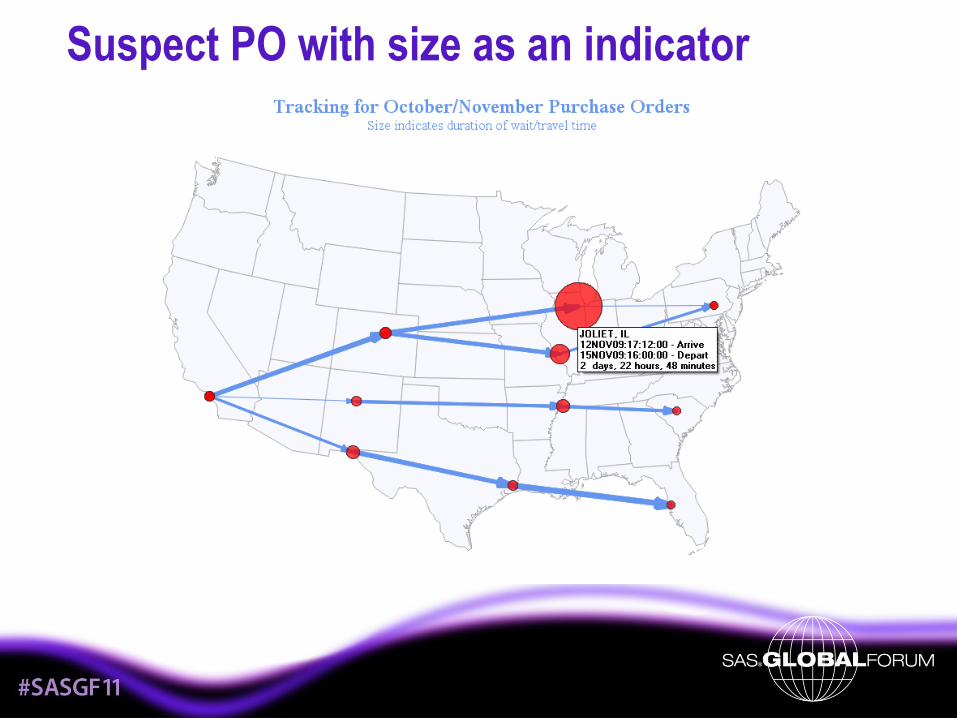
Suspect PO with size as an indicator

Size as a component
Scale the size of the object from min to max
Create macro variables with min/max values
Code:
proc summary data=size_data;
var total_hours;
output out=temp min=min_hours max=max_hours;
run;
data _null_;
set t;
call symput( 'maxwhse', trim(left(put(max_hours, f6.2))) );
call symput( 'minwhse', trim(left(put(min_hours, f6.2))) );
run;

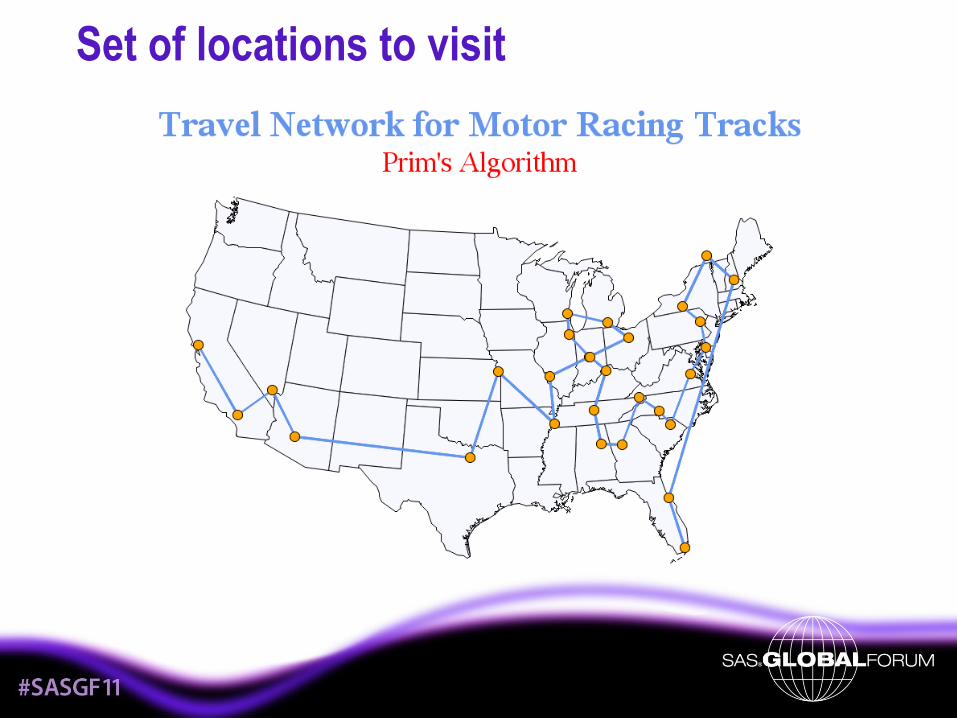
Travel routing
Given a somewhat random list of locations, what is the best way to visit all of them to maximize my travel time?
Prim’s Algorithm (Robert C. Prim) can be used.
In this example, simple distance is used as the “cost” between points.
Use the geodist() data step function to calculate.
Downloaded GPS coordinates used for points.

Set of locations to visit

Prim’s Algorithm
See http://en.wikipedia.com/wiki/Prim’s_Algorithm for a full description.
Start at any point. In our case, the first entry will do. Label this point as A.
Find the next closest point. Label this point as B.
Now process the rest of the list finding the next closest point to either A or B. This new point becomes the next A/B, appropriately.
Keep track of the sequence. Each time an A is changed, decrement the A counter and increment the B counter whenever B changes.
Sort the data by sequence to get the list.
%prim macro available.
Set of locations to visit
