our peer-reviewed guide to global clinical trials...
TRANSCRIPT

YOUR PEER-REVIEWED GUIDE TO GLOBAL CLINICAL TRIALS MANAGEMENT
appliedclinicaltrialsonline.com
1992–2018
ACT
26261992–2018
ACACACACACCCCCCCCCCCCCCCTTTTTTTTTTTTTACT
Year of Service
WASHINGTON REPORT
FDA Initiatives Advance
Orphan Therapies
EU REPORT
Tackling Disease in Europe:
A Study in Contrasts
CLOSING THOUGHT
The Underlying Force in
Alzheimer’s Drug R&D
RISK-BASED MONITORING
RBM VS. SDV:PILOT-STUDY TAKEAWAYS
TRIAL OVERSIGHT
THE BASICS OF CENTRALIZED MONITORING
Volume 27 Number 11 November 2018
2 APPLIED CLINICAL TRIALS appliedclinicaltrialsonline.com November 2018
FROM THE EDITOR
EDITORIAL OFFICES485 Route 1 South, Building F, Second Floor, Iselin, NJ 08830 USA+1 (732) 346-3080 fax: +1 (732) 647-1235, www.appliedclinicaltrialsonline.com
EDITOR-IN-CHIEF Lisa Henderson, [email protected]
MANAGING EDITOR Michael Christel, [email protected]
ASSOCIATE EDITOR Christen Harm, [email protected]
COMMUNITY MANAGER Lisa Higgins, [email protected]
ART DIRECTOR Dan Ward, [email protected]
WASHINGTON EDITOR Jill Wechsler+1 (301) 656-4634 fax: +1 (301) 718-4377
SALES OFFICESGROUP PUBLISHER Todd Baker
485 Route 1 South, Building F, Second Floor, Iselin, NJ 08830 USA
+1 (732) 346-3002. fax: +1 (732) 647-1235, [email protected]
DIRECTOR OF ADVERTISING Wayne K. Blow
UK: +44 1244 629 304 fax: +44 1925 732 798, [email protected]
NATIONAL SALES MANAGER Bill Campbell+1 (847) 283-0129 fax: +1 (847) 282-1456, [email protected]
SALES SUPPORT COORDINATOR Kristi Stevenson+1 (732) 346-3006 fax: +1 (732) 596-0012, [email protected]
ACT CHESTER UK OFFICE: +44 1244 393 100
MARKETING SERVICESAUDIENCE DEVELOPMENT MANAGER,
C.A.S.T. DATA AND LIST INFORMATION Melissa Stillwell(218) 740-6831, [email protected]
PERMISSIONS/INTERNATIONAL LICENSING
Jillyn Frommer+1 (732) 346-3007 fax: +1 (732) 647-1101, [email protected]
REPRINTS Licensing and Reuse of Content: Contact our official partner, Wright’s Media, about available usages, license fees, and award
seal artwork at [email protected] for more information. Please note that Wright’s Media is the only authorized company that we’ve partnered with for Advanstar UBM materials.
SUBSCRIPTIONS +1 (888) 527-7008 (toll-free within USA) +1 (218) 740-6477 (outside USA), [email protected]
BACK OR CURRENT ISSUES +1 (800) 598-6008, +1 (218) 740-6480 (outside USA)
PRODUCTION OFFICESPRODUCTION MANAGER Karen LenzenAdvanstar Communications, 131 W. 1st Street, Duluth, MN 55802 USA+1 (218) 740-6371 fax: +1 (408) 962-1125
APPLIED CLINICAL TRIALS (Print ISSN: 1064-8542, Digital ISSN: 2150-623X) is published 4 times/year in March, June, Sept & Dec by UBM LLC 131 West 1st Street, Duluth,
MN 55802-2065. Subscription rates: $70 for 1 year (4 issues), $120 for 2 years (8 issues) in the United States and possessions; $90 for 1 year, $140 for 2 years in Canada
and Mexico; all other countries $130 for 1 year, $235 for 2 years. Single copies (prepaid only): $23 in the United States and possessions; $28 in all other countries. Add
$6.50 per order for shipping and handling. Periodicals postage paid at Duluth, MN 55806 and additional mailing offices. POSTMASTER: Please send address changes
to APPLIED CLINICAL TRIALS, P.O. Box 6115, Duluth, MN 55806-6115. PUBLICATIONS MAIL AGREEMENT NO. 40612608, Return Undeliverable Canadian Addresses to: IMEX
Global Solutions, P. O. Box 25542, London, ON N6C 6B2, CANADA. Canadian G.S.T. number: R-124213133RT001. Printed in the U.S.A. Digital-only editions will publish 6
times/year in Jan/Feb, April, May, July/Aug, Oct, and Nov.
©2018 UBM. All rights reserved. No part of this publication may be reproduced or transmitted in any form or by any means, electronic or mechanical including by
photocopy, recording, or information storage and retrieval, without permission in writing from the publisher. Authorization to photocopy items for internal/educational or
personal use, or the internal/educational or personal use of specific clients is granted by UBM for libraries and other users registered with the Copyright Clearance Center,
222 Rosewood Dr. Danvers, MA 01923, 978-750-8400 fax 978-646-8700 or visit http://www.copyright.com online. For uses beyond those listed above, please direct your
written request to Permission Dept. fax 732-647-1104 or email: [email protected].
UBM Americas provides certain customer contact data (such as customers’ names, addresses, phone numbers, and e-mail addresses) to third parties who wish to pro-
mote relevant products, services, and other opportunities that may be of interest to you. If you do not want UBM Americas to make your contact information available to
third parties for marketing purposes, simply call toll-free 866-529-2922 between the hours of 7:30 a.m. and 5 p.m. CST and a customer
service representative will assist you in removing your name from UBM Americas’ lists. Outside the U.S., please phone 218-740-6477.
Applied Clinical Trials does not verify any claims or other information appearing in any of the advertisements contained in the
publication, and cannot take responsibility for any losses or other damages incurred by readers in reliance of such content.
To subscribe, call toll-free 888-527-7008. Outside the U.S. call 218-740-6477.
LISA HENDERSON
Editor-in-Chief
Applied Clinical Trials has featured arti-
cles and discussion around the concept
of blockchain (bit.ly/2ANQtpD and bit.
ly/2SNPLzh). But it’s becoming a bit clearer that
blockchain is moving toward definitive uses
quickly in the clinical trials world.
At the recent CBI Interactive Response
Technologies (IRT) 2018 conference, Imran
Shakur, senior manager, clinical supply capabil-
ities for Biogen, and Chad Sklodosky, director,
digital clinical supply chain at Pfizer, presented on the topic “Leverage
Blockchain Technology to Enhance Supply Chain Management.”
Sklodosky described a November 2017 blockchain workshop held at
Pfizer’s Research Technology Center in Cambridge, where over 50 par-
ticipants from various companies discussed 12 use cases, of which two
working groups were advanced.
The one discussed at this conference was the Clinical Supply
Blockchain Working Group, whose long-term vision is to “develop a
fully interoperable, transparent, and auditable platform that enables
investigational product (IP) to be tracked from point of manufacture to
the point of which it is consumed by the patient.” Sklodosky outlined the
working group’s timeline around clinical supply, with the 2023 goal of
having fine-tuned a process that will be scalable to the ecosystem.
The second use case that the group decided to advance was patient
data donation and clinical research, which was not presented at this
conference, but more can be learned from a recent paper issued by
Deloitte and Pfizer (see bit.ly/2OnmVm8).
In this outline, the patient becomes the owner of their data and
chooses where that data is stored and shared in the trusted blockchain
network. As the paper points out, the patient could seek out clinical
research opportunities or donate their data to research efforts. While
CISCRP has conducted many studies on the altruistic reasons people
participate in clinical trials—to help others benefit—this data donation
would surely take that step one further.
Hu-manity.co agrees that data ownership is fundamental, however, it
also believes individuals should be paid for their data. I refer to this news
blurb, bit.ly/2DnpiEo, and this longer article about one of the co-founders,
bit.ly/2zqlD4i. Hu-manity.co is partnering with IBM to use its blockchain
platform as its global consent ledger, whereby people will manage con-
sent, authorization, and commercial use of their personal information.
This information is not limited to medical, health, or research data, but is
definitely a part of co-founder and COO Michael DePalma’s larger posi-
tion, as quoted in the referenced article. He also says in the article “there
is a massive amount of valuable data being generated, but none of the
profits are being filtered back to the people who create the value.”
In the business case use above, data ownership is not the question.
Those that consent into the private clinical supply chain process partici-
pate around the data flow. Interestingly, during Sklodosky’s presentation
he said that blockchain in this case could appear to be doing away with
IRT. However, he explained that IRT is actually blockchain “lite” and ex-
perts in IRT are needed to guide the forward solution.
While the way data is collected and stored in this industry evolves from
legacy to cloud-based systems; integration issues and actionable insights
around data, it’s the data itself that is moving into the center stage.
Blockchain in Research, from Business to Personal
appliedclinicaltrialsonline.com APPLIED CLINICAL TRIALS 3November 2018
CONTENTS
Moe Alsumidaie
Thought Leader and Expert in the Application of Business Analytics Towards Clinical Trials and HealthcareNew York, NY
Kiran Avancha, PhD, RPh
Chief Operating OfficerHonorHealth Research Institute HonorHealthScottsdale, AZ
Townsend N. Barnett, Jr.
Vice President, Global Head of Pre-Clinical and Clinical QAUCB Pharma S.A.Chemin du Foriest, Belgium
Kenny Blades, PhD
Director, Global Project ManagementDOCS InternationalKent, UK
Timothy Callahan, PhD
Chief Scientific OfficerBiomedical SystemsSaint Louis, MO
Anthony J. CostelloChief Executive OfficerMytrus, Inc.San Francisco, CA
Domenico Criscuolo, MD, PhD, FFPM
Chief Executive OfficerGenovaxColleretto Giacosa, Italy
Srini Dagalur, PhD
Specialist Leader, Life Sciences Technology StrategyDeloitteParsippany, NJ
Yakov Datsenko, MD
Senior Clinical Research PhysicianTeam Leader Immunology/RespiratoryBoehringer Ingelheim Pharma GmbH & Co. KGBiberach, Germany
Edward Stewart Geary, MD
Chief Medical Officer & Vice PresidentEisai Co., Ltd.Tokyo, Japan
Ashok K. Ghone, PhD
VP, Global ServicesMakroCareNewark, NJ
Rahlyn Gossen
FounderRebar Interactive New Orleans, LA
Uwe Gudat, MD
Head of Safety, BiosimilarsMerck SeronoGeneva, Switzerland
Michael R. Hamrell, PhD, RAC
PresidentMORIAH ConsultantsHuntington Beach, CA
Erica J. Heath, CIP, MBA
RetiredSan Anselmo, CA
Wayne Kubick
Chief Technology Officer Health Level Seven InternationalChicago, IL
Darshan Kulkarni, PharmD, Esq
Principal AttorneyThe Kulkarni Law FirmPhiladelphia, PA
Jeffrey Litwin, MD
CEOMedAvante-ProPhasePrinceton, NJ
Barrie Nelson
Chief Standards OfficerNurocorAustin, TX
VIcky Parikh, MD, MPH
Executive DirectorMid-Atlantic Medical Research CentersHollywood, MD
Timothy Pratt, PhD, MBA
Senior Principal Medical Research ManagerNAMSAMinneapolis, MN
Johanna Schenk, MD, FFPM
Executive Consultant andCompany OfficerPPH plus GmbH & Co. KGHochheim am Main, Germany
Stephen Senn, PhD
Head of Competence Center for Methodology and StatisticsCRP-SanteStrassen, Luxembourg
Thomas Sudhop, MD
Director and ProfessorFederal Institute for Drugsand Medical DevicesBonn, Germany
EDITORIAL ADVISORY BOARD
The expertise of Editorial Advisory Board mem-bers is essential to the credibility and integrity of Applied Clinical Trials. These clinical trials experts share with the editors the wisdom gained through their experience in many areas of drug develop-ment. EAB members review manuscripts, suggest topics for coverage, and advise the editors on industry issues. All manuscripts must first be submitted to the Editor-in-Chief, Applied Clinical Trials, 485 Route 1 South, Building F, Second Floor, Iselin, NJ 08830 USA.
PEER REVIEWED
14 The Basics of Clinical Trial
Centralized Monitoring
Adam Beauregard, Vadim
Tantsyura, Fernand Labrie
Examining the practicality of implementing CM techniques to drive trial oversight efficiency while saving on-site monitoring resources and costs.
NEWS AND ANALYSIS
4 WASHINGTON REPORT
5 EU REPORT
COMMENTARY
A CLOSING THOUGHT
21 Closer Pharma-Diagnostic
Collaboration is Integral to
Alzheimer’s Drug R&D
Edward I. Ginns, MD, PhD
FEATURED
8 RBM Versus Source Data VerificationPenelope Manasco, MD, Eric Herbel, Sean Bennett, MD, PhD, Michelle
Pallas, Lisa Bedell, Deborah Thompson, Kevin Fielman, PhD, Garrett
Manasco, Charlene Kimmel, Everett Lambeth, Lisa Danzig, MD
Pilot study compares a risk-based monitoring and remote trial management method with traditional on-site SDV for trial oversight.
A P P L I E D C L I N I C A L T R I A L SVOLUME 27, NUMBER 11
GE
TT
YIM
AG
ES
/IM
AG
E S
OU
RC
E

NEWS
4 APPLIED CLINICAL TRIALS appliedclinicaltrialsonline.com November 2018
FDA INITIATIVES ADVANCE ORPHAN THERAPIES
Streamlined clinical trials and continued
patient involvement in product research
continue to advance the development and
market approval of more innovative thera-
pies for rare conditions. FDA has approved
more than 60 orphan indications for new
and existing products this year, building on
80 approvals for 2017, according to a study
from the IQVIA Institute for the National
Organization for Rare Disorders (NORD) (see
bit.ly/2SumlWR). FDA approvals of new treat-
ments are “shattering previous records”
based on continued innovation in research
in this area, observed NORD President Pe-
ter Saltonstall in conjunction with NORD’s
annual Rare Disease Summit in Washington,
D.C. in October.
Important FDA initiatives aim to increase
the use of biomarkers and provide early
advice to sponsors to make clinical trials
more efficient and less costly for developing
targeted therapies, including those for rare
conditions. An important draft guidance
issued in October encourages sponsors to
use “minimal residual disease” (MRD) as a
biomarker in testing drugs or biologics to
treat certain blood cancers (bit.ly/2CQXx63).
This general measure of tumor burden in
clinical trials, observed FDA Commissioner
Scott Gottlieb in announcing the advisory,
has the potential to expedite product devel-
opment by assessing a patient’s response to
treatment or the risk of future relapse. The
policy supports using MRD to enrich clinical
trial populations and define treatment arms,
with an eye to further developing the marker
as a surrogate endpoint.
The agency also finalized a guidance on
identifying treatments that address under-
lying factors that may contribute to disease,
such as rare molecular changes present in
small subsets of patients (bit.ly/2Jrv4Fc).
This advisory aims to help sponsors enroll
in clinical trials those patients with genetic
markers that indicate likely response by pro-
viding information on grouping patients with
different molecular alterations and on strat-
egies for evaluating the benefits and risks
of targeted therapies to treat diseases with
rare molecular alterations.
More support
Sponsors, researchers, and patients can
obtain advice and information through a
new FDA web portal on “developing prod-
ucts for rare diseases,” which aims to pro-
vide a “central home” on FDA regulatory
initiatives and programs in this area (bit.
ly/2PyFUyE). A guidance published earlier
this year, moreover, clarifies FDA’s orphan
drug designation process, which opens the
door for sponsors to gain expedited reviews
and financial support for clinical studies and
other processes (bit.ly/2AA6aAl). To help
shape early R&D programs for therapies
for rare diseases, FDA is encouraging spon-
sors to sign up for pre-investigational new
drug (IND) meetings to discuss studies that
utilize smaller patient pools. Another FDA
guidance spells out what manufacturing
and preclinical data is needed to make such
early meetings useful, and what expedited
programs, standards, and support is avail-
able to researchers seeking to test new
treatments (bit.ly/2yF9UPB).
A broader agency reorganization plan
announced by Gottlieb in July aims to better
coordinate advice and oversight for orphan
drugs by establishing an Office of Clinical
Policy and Programs (OCPP) that supports
cross-cutting clinical programs involving
multiple FDA medical product centers. Un-
der the new structure, OCPP will report to
FDA Deputy Commissioner Rachel Sherman
and include the Office of Orphan Products
Development (OOPD), the Office of Pediatric
Therapeutics, the Office of Combination
Products, and a new Office of Clinical Pol-
icy. OCPP also will oversee an expanded
agency-wide program for patient affairs and
healthcare providers to enhance engage-
ment with these external stakeholders.
FDA officials plan to expand OOPD’s staff
and programs under Janet Maynard, newly
named acting director of the office. And
FDA’s new orphan product council is meet-
ing regularly and assisting in the develop-
ment of additional guidance documents,
reported Sherman at the NORD summit.
These initiatives stop short of establishing
a separate FDA center of excellence for rare
diseases, as sought by patient advocates
in this area. But the planned organizational
changes will mean that the oversight of new
therapies for rare dis-
eases, said Sherman,
“will never become or-
phans” at FDA.
— Jill Wechsler
WASHINGTON REPORT
The FDA recently released the following in-
dustry guidance documents:
10/24/18: Testicular Toxicity: Evaluation During
Drug Development Guidance for Industry
10/15/18: Rare Diseases: Early Drug
Development and the Role of Pre-IND
Meetings Guidance for Industry (draft)
10/15/18: Developing Targeted Therapies
in Low-Frequency Molecular Subsets of
a Disease; Guidance for Industry (draft)
10/15/18: Hematologic Malignancies:
Regulatory Considerations for Use of
Minimal Residual Disease in Develop-
ment of Drug and Biological Products for
Treatment Guidance for Industry (draft)
10/11/18: Impact of Certain Provi-
sions of the Revised Common Rule on
FDA-Regulated Clinical Investigations
9/28/18: Adaptive Design Clinical Tri-
als for Drugs and Biologics (draft)
FDA NOTES

NEWS
appliedclinicaltrialsonline.com APPLIED CLINICAL TRIALS 5November 2018
EUROPE MULLS RIVAL APPROACHES TO TACKLING DISEASE
October offered a striking spectacle of con-
trasts in Europe’s ponderous attempts to
construct a comprehensive policy on health.
On the one hand, the month opened with
calls from a cross-party group of members
of European Parliament (MEPs) seeking ac-
tion from the European Commission in sup-
port of orphan drugs and rare-disease pa-
tients. “What measures has the Commission
taken so far to ensure accurate and timely
diagnosis of rare diseases,” ask the MEPs.
In addition, they pointed out, patient access
to medicines for rare diseases varies widely
across Europe—so what is the Commission
doing to promote the availability of afford-
able medicines to treat rare diseases, they
demanded.
Throughout the month, groups as diverse
as the European Alliance for Personalized
Medicine and the Multistakeholder Paediat-
ric Strategy Forum have been urging vigor-
ous action to promote targeted treatments,
close collaboration on dialogue between
regulators and drug developers, and early
scientific advice—with much of the discus-
sion centered on the emerging plan for co-
ordinated European-level health technology
assessment (HTA).
Conversely, the month was also marked
by a crescendo of concern that health poli-
cymakers may be looking through the wrong
end of the telescope with their traditional
focus on treatment. Right at the start of
October, one of Europe’s biggest annual
health policy gatherings, the Gastein forum,
named for the mountain resort in Austria
where it takes place, heard plenty of calls
for a bigger and better European health pol-
icy—but with an emphasis on wider access
and greater equality, and with a focus on
prevention rather than treatment.
A series of prominent healthcare poli-
cymakers, from World Health Organization
(WHO) Regional Director for Europe Zsu-
zsanna Jakab, to Director of the European
Center for Disease Prevention and Control
Andrea Ammon, underlined what they saw
as the need for a multisectoral, societal, and
integrated response to health. There were
repeated invocations of the United Nations’
Sustainable Development Goals (SDGs), and
calls for Europe to lead by example in the
program’s global ambitions to tackle pov-
erty, inequality, climate, environmental deg-
radation, and injustice.
EU’s Commissioner for Health Vytenis An-
driukaitis has taken as his theme “the impor-
tance of our health-in-all-policies approach.”
He told a WHO meeting in Kazakhstan: “We
need a much stronger focus on health pro-
motion, protection, and disease prevention.”
And Andriukaitis has developed the theme
throughout the month, with speeches en-
dorsing the merits of a broader approach.
The mantra is that the health sector cannot
succeed alone. “We must address all the
risk factors in a more holistic way: obesity
and unhealthy nutrition, lack of exercise, to-
bacco, alcohol abuse, and also wider factors
such as working conditions, unhealthy hous-
ing, and environment pollution” he said.
Andriukaitis followed a similar line at the
G20 Health Ministerial Meeting in Argen-
tina where childhood nutrition was on the
agenda, and at the recent UN high-level
meetings on non-communicable diseases
and tuberculosis.
It is more than just a straw in the wind
that the EU has set up a new steering group
on health promotion and prevention of
non-communicable diseases that is tasked
with identifying priority areas for action and
promoting exchanges of policies and prac-
tices between countries. Nor is it entirely a
coincidence that it has
chosen nutrition and
physical activity as one
of the areas for priority
implementation.
— Peter O’Donnell
EU REPORT
EMA NOTES
GMP INSPECTIONS IN PORTUGAL
The mutual recognition agreement be-
tween the European Union (EU) and the US
to recognize inspections of manufacturing
sites for human medicines conducted in
their respective territories has made fur-
ther progress. In September, the FDA con-
firmed the capability of one additional EU
Member State (Portugal) to carry out good
manufacturing practice (GMP) inspections
at a level equivalent to the US. There are
now a total of 15 member states whose
inspection results the FDA can rely on to
replace their own inspections. Since No-
vember 2017, EU member states and the
European Medicines Agency (EMA) can
rely on inspection results from the FDA to
replace their own inspections.
GENE THERAPY FOR RARE
INHERITED DISORDER
The EMA’s Committee for Medicinal Prod-
ucts for Human Use (CHMP) has recom-
mended granting a marketing authorization
for the gene therapy Luxturna (voretigene
neparvovec) for the treatment of adults
and children suffering from inherited retinal
dystrophy caused by RPE65 gene muta-
tions, a rare genetic disorder which causes
vision loss and usually leads to blindness.
Luxturna is meant for patients with con-
firmed biallelic mutations of the RPE65
gene (i.e., patients who have inherited the
mutation from both parents) and who have
sufficient viable retinal cells.
MIGRAINE GENE THERAPY
CHMP has recommended granting a mar-
keting authorization for Emgality (galcane-
zumab), a monoclonal antibody for the pre-
vention of migraine. Emgality belongs to a
new class of medicines that work by block-
ing the activity of calcitonin gene-related
peptide (CGRP), a molecule that is involved
in migraine attacks.
NEWS
6 APPLIED CLINICAL TRIALS appliedclinicaltrialsonline.com November 2018
EXPERTS LOOK TO UPDATE DIABETES STUDY REQUIREMENTSAn FDA advisory panel agreed last month on the need to streamline and simplify rec-ommendations for studying the risks of car-diovascular events in new treatments for type 2 diabetes, but expressed a range of opinions on what specific changes to make in current requirements. Leading endocri-nologists were split on what assessment is needed to detect any adverse signals of cardiovascular (CV) risk, and whether that involves premarket, postmarket, or both kinds of studies.
The main issue before the FDA Endocri-nologic and Metabolic Drugs Advisory Com-mittee at its October meeting was whether and how to revise a 2008 guidance that requires sponsors to conduct extensive out-comes studies on new antidiabetic thera-pies to ensure no unacceptable increase in
CV risk to patients. In the decade since then, eight extensive and costly cardiovascular outcomes trials (CVOTs) have demonstrated no excess CV problems, and some indicate reduced risk for such problems (see bit.ly/2JvGZBK). This finding has led experts at FDA, academia, and industry to question the continued validity of the diabetes study requirements. Sponsors estimate that CVOT studies cost $200 million to $400 million each, greatly increasing the cost of develop-ment programs for new therapies.
Yet after two days of deliberations, the panel was evenly divided, with a scant ma-jority voting to continue the current CVOT requirement. This group maintained that there is no substitute for randomized CV-OTs, and that registries could not provide sufficient information. Those advocating for change maintained that it no longer is necessary to require outcomes stud-
ies, and that more robust premarket trials can better detect CV risk signals. Overall, there was strong support for a range of modifications to make the development of new diabetes treatments less costly and more efficient. Experts agreed that post-market studies should be required only to further assess signals seen in premarket studies. And Phase II and III trials should be large enough to detect adverse signals and should be enriched to enroll patients with high CV risk.
Analysts have noted a decline in new pro-grams for developing diabetes drugs since the 2008 guidance. FDA is expected to take note of the general consensus on the need to update its policy, most likely by recommend-ing expanded premarket studies and reduc-ing requirements for postmarket CVOT trials.
— Jill Wechsler
REGULATORY
CLINERION MOVES TO NEW HEADQUARTERSThe real-world data solutions company
Clinerion is moving to new offices in Basel,
Switzerland. Following expansion in its busi-
ness, the organization is in the process of
growing its global team. In the six months
leading up to the start of 2019, Clinerion ex-
pects to have added several additional new
positions. Staffing is increasing across areas
such as customer solutions, site and patient
network development, software develop-
ment, data analytics, and marketing.
Clinerion’s new of f ices have nearly
double the floorspace of its old premises,
matching the increased requirements of its
expanding business. Though a new facil-
ity, the company’s headquarters remain in
Basel, where Clinerion analysts will look to
tap into valuable insights from anonymized
patient data throughout the company’s net-
work of hospital and data partners.
“Basel has critical mass in its life sciences
ecosystem and an infrastructure which pro-
motes a strong innovation culture,” says Ian
Rentsch, Clinerion CEO. “Here, we have the
opportunity to interact with leaders of the industry on a close, daily basis.”
NOVOTECH ACQUIRES CNSNovotech, the Asia-Pacific-based CRO, has acquired Australasian CRO Clinical Network Services (CNS) as part of a mutual mission to expand services to biopharma for early phase product development and clinical research through to later phase regional and global trials. Both companies will con-tinue to retain their separate brands and identities.
Novotech has more than 400 staff across Asia-Pacific and business development of-fices in the U.S. CNS has more than 140 staff in Australia, New Zealand, and the U.S.
As part of the deal, clients can access services from both groups, including the CNS BioDesk, which provides early stage product development advice, including tox-icology, CMC and FDA/EMA regulatory con-sulting and interactions; and Novotech’s advanced regional IT infrastructure, to sup-port their clinical research programs. Early phase research in Australasia has seen solid
growth over the last seven years, company
executives said.
ORACLE NABS GOBALTOOracle has entered into an agreement to ac-
quire goBalto, which delivers cloud solutions
for clinical trials by streamlining and auto-
mating the selection and set up of clinical
research sites to conduct studies.
NOVARTIS AND PFIZER COLLABORATE FOR NASHNovartis has struck a clinical development
agreement with big pharma compatriot
Pfizer, which will include a study combin-
ing tropifexor and one or more Pfizer com-
pounds for the treatment of nonalcoholic
steatohepatitis (NASH). The financial details
of the transaction were not disclosed.
NASH is a complex condition with no cur-
rently available treatment options. NASH
presents a high unmet patient need, as it
affects up to 6.5% of the population world-
wide, and is largely asymptomatic.
— Staff and wire reports
NEWS NOTES

On-demand webinar
Aired November 1, 2018
CONTACT US
iqvia.com
For technical questions about this webinar,
please contact Kristen Moore at [email protected]
View now for free!
www.appliedclinicaltrialsonline.com/act_p/Strategies
By 2020 NASH will be the leading cause for liver transplantation
globally. However, stratifying and referring the right patients
for clinical trials is a challenge; we know it is more common
among people with type-2 diabetes and obesity, but that’s not
SUHFLVH�HQRXJK���$QG�VLQFH�WKH�RQO\�GHƓQLWLYH�GLDJQRVWLF�WRRO�IRU�
NASH is a liver biopsy, improved pre-screening is critical. The
clinical complexities in NASH are also compounded by a lack of
understanding of the full trajectory of patients – what are the early
signs? What are the stages? Where do these patients interact with the
system?
All of these challenges are converging to make NASH clinical trials
XQLTXHO\�GLIƓFXOW�WR�GHOLYHU�
But a multi-faceted, data-driven approach early on can change the
status quo. By building the right network model, better education
programs, data-driven recruiting strategies, and more innovative
diagnostic tools, IQVIA is leading the way toward new solutions.
4 Key take-aways:
When you join our webinar, you will walk away with:
• An overview a of the NASH landscape, including recruitment rates
and how predictive analytics can accelerate enrollment
• Strategies to overcome the challenges associated with identifying
undiagnosed NASH patients
• Methods available to enhance the screening process
• An understanding of how and when to develop a network
approach to Real World Data
Co
py
rig
ht
© 2
01
8 IQVIA
. A
ll r
igh
ts r
ese
rve
d.
IDENTIFYING NASH PATIENTS:Solutions and Strategies
Presented by:
Sponsored by:
LEARN MORE ABOUT
PRESENTERS:
Mark DeLegge Senior Medical Director and Strategy Lead IQVIA NASH Center of Excellence Dimitar TonevSenior Medical Director NASH Medical Strategy Lead, Europe
Sarah PhillipsSenior PrincipalRWI, Enterprise Solutions
MODERATOR:
Lisa HendersonEditorial Director, Applied Clinical Trials

8 APPLIED CLINICAL TRIALS appliedclinicaltrialsonline.com November 2018
Five years ago, the FDA and the European Med-
icines Agency (EMA) released final guidance to
change clinical trial oversight methodology from
on-site visits using source data verification (SDV), the
gold standard for more than 30 years, to a risk-based
monitoring (RBM) approach.1,2
Implementing this guidance created two daunting
challenges to reconcile as follows:
• No standard RBM definition or standard way to im-
plement RBM exists; these myriad of definitions
and implementation approaches correspondingly
represent different levels of effectiveness to identify
“errors that matter.”
• No head-to-head comparisons exist that compare
different trial oversight methods.
This lack of scientific data on trial oversight effective-
ness is a critical unmet clinical research need. It affects
more than 100,000 research participants per year and
their healthcare providers.
This article represents a prospective analysis compar-
ing the effectiveness of using traditional SDV versus one
method of RBM (i.e., the MANA Method). We identified
the specific RBM method used herein due to inconsis-
tent RBM definitions and RBM implementation methods,
and the varying levels of effectiveness for all the differ-
ent RBM approaches.
Research methods
PaxVax conducted a Phase IV vaccine trial in approxi-
mately 500 subjects at nine U.S. sites.
The study was conducted using electronic data capture
(EDC). The trial was approved by an institution review board
(IRB) and each subject signed an IRB-approved informed
consent prior to participating. Subjects received one dose
of the study vaccine. Participants collected any changes in
health for nine days in a paper diary aid, and sites entered
the results into the EDC. Each research site maintained its
own informed consents and site regulatory binders.
Site monitors visited the research sites monthly and
spent approximately 72 days on-site conducting SDV of
the trial data. PaxVax’s senior management team (i.e.,
medical monitor; senior director, biostatistics; director
of data management and statistical programming) re-
viewed the data monthly to identify trends or data errors
that would be followed up by the site monitor.
MANA RBM modified its risk-based monitoring and
remote trial management system (i.e., the MANA Method)
to initiate an RBM approach for this study that began after
5.5 months of trial conduct (approximately 500 subjects
already enrolled). To fully implement the MANA Method,
Risk-Based Monitoring Versus Source Data VerificationPenelope Manasco, MD, Eric Herbel, Sean Bennett, MD, PhD, Michelle
Pallas, Lisa Bedell, Deborah Thompson, Kevin Fielman, PhD, Garrett
Manasco, Charlene Kimmel, Everett Lambeth, Lisa Danzig, MD
Pilot study compares a risk-based monitoring and remote trial management method with traditional on-site source data verification for trial oversight.
RISK-BASED MONITORING
RISK-BASED
MONITORING
METHODOLOGY
(Note: MANA RBM’s approach is a patent-pending,
data-driven, scientifically-focused, systematic, re-
mote approach to trial oversight called the MANA
Method. This approach, conducted independently
of the EDC, synthesizes data across data sets and
data sources to conduct review of protocol-spe-
cific high-risk data and processes identified during
a proprietary, risk assessment service. This re-
view focuses on how analysis and safety data are
collected (i.e., process) in addition to the actual
data for analysis. Integrated remote subject review
starts within days of subject visits and includes
rapid trend analysis of site performance to identify
and correct systematic errors quickly.)

appliedclinicaltrialsonline.com APPLIED CLINICAL TRIALS 9November 2018
additional trial oversight and remote document review, in-
cluding informed consents and site regulatory documents,
would also have been implemented and evaluated.
In this pilot study, MANA RBM independently and remotely
reviewed and used the existing trial data available electronically
to determine whether errors and trends could be identified
faster and more comprehensively than using the traditional SDV
method. Analysis of informed consents, regulatory documents,
and source documents were not included in this pilot study be-
cause the documents were not available electronically.
MANA RBM first conducted a proprietary risk assess-
ment service based on the protocol. It then designed
proprietary study-specific reports and data visualizations
to evaluate the high-risk data and processes identified
during the risk assessment. The basic categories included: efficacy
endpoints, safety assessments, investigational product (IP) manage-
ment, and human subjects’ protection.
Trial data was imported from the EDC platform into JReview, hosted
by Integrated Clinical Systems, Inc. MANA RBM designed its proprietary
Subject Profile Analyzing Risk (SPAR) tool to provide an integrated vi-
sualization of the high-risk data for each subject over time and trained
the remote monitors in its use. SPAR configuration is unique for each
trial based on the critical issues identified during the risk assessment.
Additional proprietary, custom reports were also developed to support
protocol-specific analysis of high-risk data and processes and trends.
All review was performed independently of the EDC system and
based on MANA RBM data analytics. Results of the review were cap-
tured in a separate, proprietary MANA RBM Site Tracker Analyzing
Risk database (STAR); MANA RBM developed this tool to conduct
study quality oversight. Subject review was documented in JReview.
MANA RBM conducted review using its remote quality manage-
ment approach as shown in Figure 1. The MANA Method splits the
review process into tiers. Remote site monitors focus on subject
review and high-risk data and process oversight at the subject level.
Central review focuses remote review on trend analysis by evaluat-
ing data across subjects at a single site and across sites.
The pilot study compared SDV versus the MANA Method in the
following areas:
1) Identifying major deviations
2) Queries raised as a result of SDV
3) Identifying trends in data affecting trial conduct and/or results
4) Timing of the subject review
5) Resource use
Results
Risk assessment and development of protocol-specific re-
ports: MANA RBM conducted the risk assessment and implemented
the SPAR within two weeks of uploading the data into JReview.
Additional custom reports were developed over eight weeks. These
reports included customized, cross-database reports and trend anal-
ysis of high-risk data and processes.
Subject review: Once the SPAR was available, reviewers began
reviewing the data immediately. MANA RBM split the subject review.
An experienced monitor reviewed half of the subjects during the first
month and the data reviewer, new to subject review, reviewed the
other half of the subjects during that month. The following month, the
subject reviewers switched subjects to review to allow evaluation of
oversight by remote monitors with different training and experience.
The lead monitor performed quality control (QC) oversight of each of
the remote monitors to provide immediate feedback on items missed
or documentation correction.
Identification of protocol deviations. MANA RBM’s remote site
monitors identified critical deviations using the SPAR and accompa-
nying high-risk reports. The MANA Method identified critical devia-
tions not previously identified by the sponsor’s on-site monitors.
Speed of identification. Using remote methods, the monitoring team
could have identified deviations faster and earlier than using SDV and
on-site visits. Within six weeks, two rounds of review of all critical subject
data were completed and all deviations for critical data were identified.
Categorization of deviations. Differences in classifications of devia-
tions as major or minor were identified between the MANA RBM remote
monitoring team and the on-site monitors. This resulted in challenges
when comparing the total numbers of deviations. These totals were
similar and there were no major deviations discovered by the sponsor’s
on-site monitors that the MANA Method did not also identify remotely.
Source document review: This study was conducted with pa-
per memory aids and transcription by the research sites. Since this
was a pilot study, sites were not asked to convert the paper memory
aids to certified copies, which would have allowed remote review.
To evaluate whether there were findings that the MANA Method
would not have been able to identify without on-site visits or using
eDiaries, MANA RBM reviewed the queries related to subject diaries
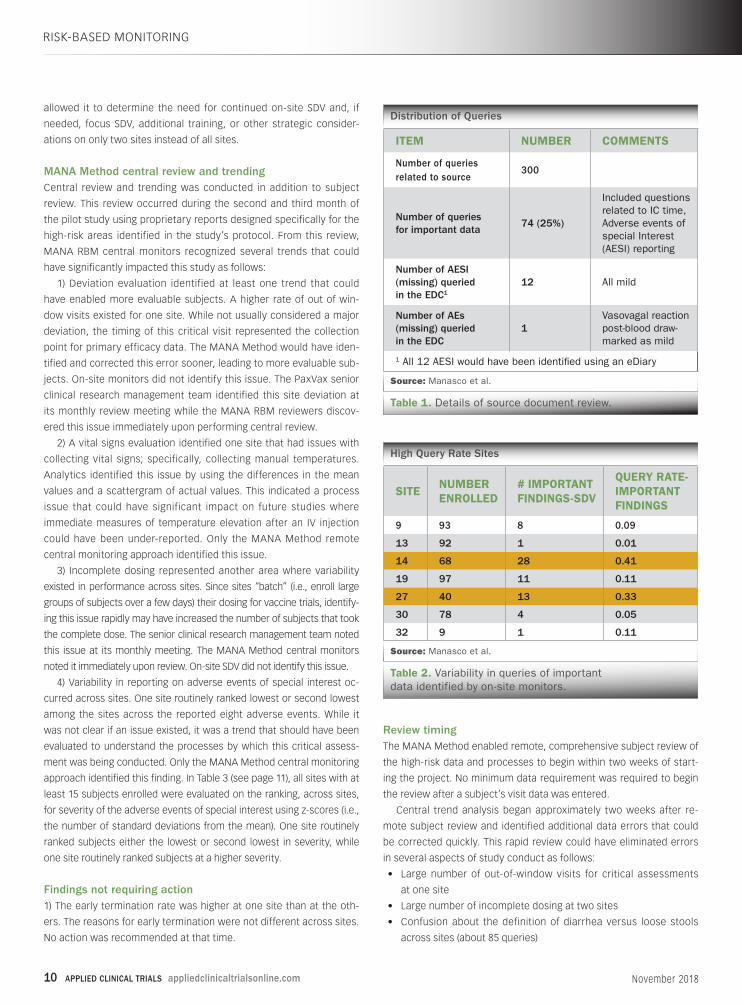
generated from the study. The MANA RBM team identified 300 que-
ries associated with SDV. Table 1 (see page 10) shows the distribution
of the queries and illustrates how remote review would have identi-
fied all critical findings with the use of eSource or certified copies of
the diary aids. Important data is defined as data that would affect
subject safety or analysis of efficacy.
MANA RBM reviewed the important data remotely from source
review query rates and found that two sites had much higher query
rates (i.e., 2-10 times the rates of the other sites), as shown in Table 2
(see page 10). This information, if known to the sponsor, would have
RISK-BASED MONITORING
Remote Quality Management
Source: Manasco et al.
Figure 1. The MANA Method splits the review process into tiers.
10 APPLIED CLINICAL TRIALS appliedclinicaltrialsonline.com November 2018
allowed it to determine the need for continued on-site SDV and, if
needed, focus SDV, additional training, or other strategic consider-
ations on only two sites instead of all sites.
MANA Method central review and trendingCentral review and trending was conducted in addition to subject
review. This review occurred during the second and third month of
the pilot study using proprietary reports designed specifically for the
high-risk areas identified in the study’s protocol. From this review,
MANA RBM central monitors recognized several trends that could
have significantly impacted this study as follows:
1) Deviation evaluation identified at least one trend that could
have enabled more evaluable subjects. A higher rate of out of win-
dow visits existed for one site. While not usually considered a major
deviation, the timing of this critical visit represented the collection
point for primary efficacy data. The MANA Method would have iden-
tified and corrected this error sooner, leading to more evaluable sub-
jects. On-site monitors did not identify this issue. The PaxVax senior
clinical research management team identified this site deviation at
its monthly review meeting while the MANA RBM reviewers discov-
ered this issue immediately upon performing central review.
2) A vital signs evaluation identified one site that had issues with
collecting vital signs; specifically, collecting manual temperatures.
Analytics identified this issue by using the differences in the mean
values and a scattergram of actual values. This indicated a process
issue that could have significant impact on future studies where
immediate measures of temperature elevation after an IV injection
could have been under-reported. Only the MANA Method remote
central monitoring approach identified this issue.
3) Incomplete dosing represented another area where variability
existed in performance across sites. Since sites “batch” (i.e., enroll large
groups of subjects over a few days) their dosing for vaccine trials, identify-
ing this issue rapidly may have increased the number of subjects that took
the complete dose. The senior clinical research management team noted
this issue at its monthly meeting. The MANA Method central monitors
noted it immediately upon review. On-site SDV did not identify this issue.
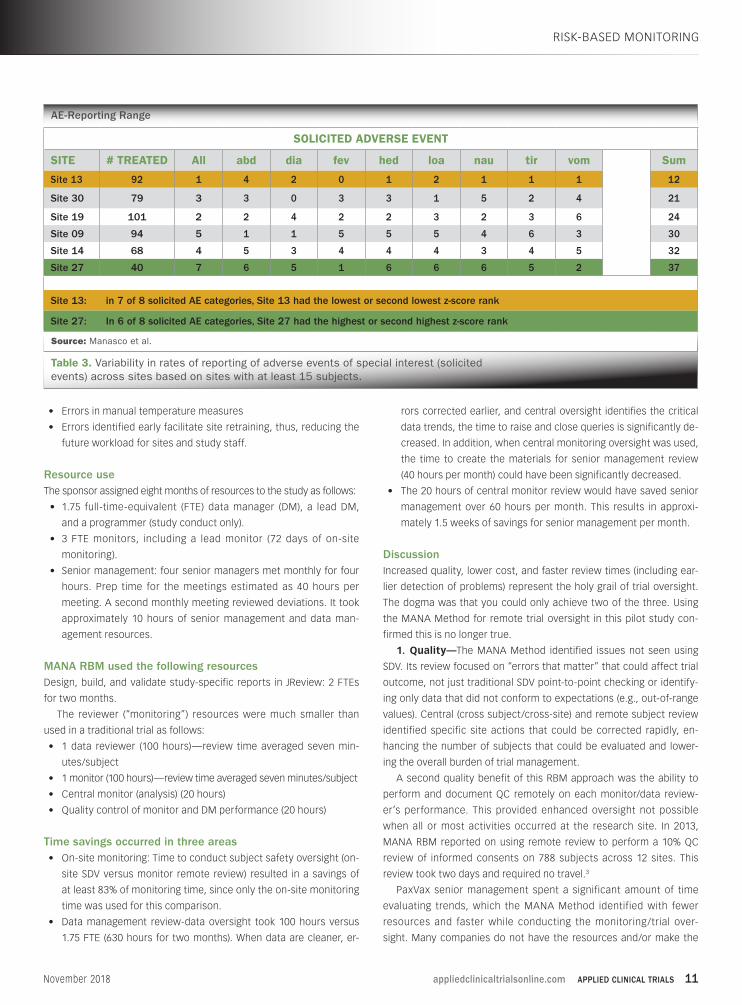
4) Variability in reporting on adverse events of special interest oc-
curred across sites. One site routinely ranked lowest or second lowest
among the sites across the reported eight adverse events. While it
was not clear if an issue existed, it was a trend that should have been
evaluated to understand the processes by which this critical assess-
ment was being conducted. Only the MANA Method central monitoring
approach identified this finding. In Table 3 (see page 11), all sites with at
least 15 subjects enrolled were evaluated on the ranking, across sites,
for severity of the adverse events of special interest using z-scores (i.e.,
the number of standard deviations from the mean). One site routinely
ranked subjects either the lowest or second lowest in severity, while
one site routinely ranked subjects at a higher severity.
Findings not requiring action1) The early termination rate was higher at one site than at the oth-
ers. The reasons for early termination were not different across sites.
No action was recommended at that time.
Review timingThe MANA Method enabled remote, comprehensive subject review of
the high-risk data and processes to begin within two weeks of start-
ing the project. No minimum data requirement was required to begin
the review after a subject’s visit data was entered.
Central trend analysis began approximately two weeks after re-
mote subject review and identified additional data errors that could
be corrected quickly. This rapid review could have eliminated errors
in several aspects of study conduct as follows:
• Large number of out-of-window visits for critical assessments
at one site
• Large number of incomplete dosing at two sites
• Confusion about the definition of diarrhea versus loose stools
across sites (about 85 queries)
RISK-BASED MONITORING
Distribution of Queries
Source: Manasco et al.
Table 1. Details of source document review.
ITEM NUMBER COMMENTS
Number of queries related to source
300
Number of queries for important data
74 (25%)
Included questions related to IC time, Adverse events of special Interest (AESI) reporting
Number of AESI (missing) queried in the EDC1
12 All mild
Number of AEs (missing) queried in the EDC
1Vasovagal reaction post-blood draw-marked as mild
1 All 12 AESI would have been identified using an eDiary
High Query Rate Sites
Source: Manasco et al.
Table 2. Variability in queries of important data identified by on-site monitors.
SITENUMBER ENROLLED
# IMPORTANT FINDINGS-SDV
QUERY RATE-IMPORTANT FINDINGS
9 93 8 0.09
13 92 1 0.01
14 68 28 0.41
19 97 11 0.11
27 40 13 0.33
30 78 4 0.05
32 9 1 0.11
appliedclinicaltrialsonline.com APPLIED CLINICAL TRIALS 11November 2018
• Errors in manual temperature measures
• Errors identified early facilitate site retraining, thus, reducing the
future workload for sites and study staff.
Resource useThe sponsor assigned eight months of resources to the study as follows:
• 1.75 full-time-equivalent (FTE) data manager (DM), a lead DM,
and a programmer (study conduct only).
• 3 FTE monitors, including a lead monitor (72 days of on-site
monitoring).
• Senior management: four senior managers met monthly for four
hours. Prep time for the meetings estimated as 40 hours per
meeting. A second monthly meeting reviewed deviations. It took
approximately 10 hours of senior management and data man-
agement resources.
MANA RBM used the following resourcesDesign, build, and validate study-specific reports in JReview: 2 FTEs
for two months.
The reviewer (“monitoring”) resources were much smaller than
used in a traditional trial as follows:
• 1 data reviewer (100 hours)—review time averaged seven min-
utes/subject
• 1 monitor (100 hours)—review time averaged seven minutes/subject
• Central monitor (analysis) (20 hours)
• Quality control of monitor and DM performance (20 hours)
Time savings occurred in three areas• On-site monitoring: Time to conduct subject safety oversight (on-
site SDV versus monitor remote review) resulted in a savings of
at least 83% of monitoring time, since only the on-site monitoring
time was used for this comparison.
• Data management review-data oversight took 100 hours versus
1.75 FTE (630 hours for two months). When data are cleaner, er-
rors corrected earlier, and central oversight identifies the critical
data trends, the time to raise and close queries is significantly de-
creased. In addition, when central monitoring oversight was used,
the time to create the materials for senior management review
(40 hours per month) could have been significantly decreased.
• The 20 hours of central monitor review would have saved senior
management over 60 hours per month. This results in approxi-
mately 1.5 weeks of savings for senior management per month.
DiscussionIncreased quality, lower cost, and faster review times (including ear-
lier detection of problems) represent the holy grail of trial oversight.
The dogma was that you could only achieve two of the three. Using
the MANA Method for remote trial oversight in this pilot study con-
firmed this is no longer true.
1. Quality—The MANA Method identified issues not seen using
SDV. Its review focused on “errors that matter” that could affect trial
outcome, not just traditional SDV point-to-point checking or identify-
ing only data that did not conform to expectations (e.g., out-of-range
values). Central (cross subject/cross-site) and remote subject review
identified specific site actions that could be corrected rapidly, en-
hancing the number of subjects that could be evaluated and lower-
ing the overall burden of trial management.
A second quality benefit of this RBM approach was the ability to
perform and document QC remotely on each monitor/data review-
er’s performance. This provided enhanced oversight not possible
when all or most activities occurred at the research site. In 2013,
MANA RBM reported on using remote review to perform a 10% QC
review of informed consents on 788 subjects across 12 sites. This
review took two days and required no travel.3
PaxVax senior management spent a significant amount of time
evaluating trends, which the MANA Method identified with fewer
resources and faster while conducting the monitoring/trial over-
sight. Many companies do not have the resources and/or make the
RISK-BASED MONITORING
AE-Reporting Range
Source: Manasco et al.
Table 3. Variability in rates of reporting of adverse events of special interest (solicited events) across sites based on sites with at least 15 subjects.
SOLICITED ADVERSE EVENT
SITE # TREATED All abd dia fev hed loa nau tir vom Sum
Site 13 92 1 4 2 0 1 2 1 1 1 12
Site 30 79 3 3 0 3 3 1 5 2 4 21
Site 19 101 2 2 4 2 2 3 2 3 6 24
Site 09 94 5 1 1 5 5 5 4 6 3 30
Site 14 68 4 5 3 4 4 4 3 4 5 32
Site 27 40 7 6 5 1 6 6 6 5 2 37
Site 13: in 7 of 8 solicited AE categories, Site 13 had the lowest or second lowest z-score rank
Site 27: In 6 of 8 solicited AE categories, Site 27 had the highest or second highest z-score rank
12 APPLIED CLINICAL TRIALS appliedclinicaltrialsonline.com November 2018
RISK-BASED MONITORING
commitment PaxVax made to oversee the trial at this level. These
findings confirmed that the MANA Method provided a cost-effective
alternative for allocating senior management resources efficiently.
Using the MANA Method, monitors/data managers understood the
critical data and processes and how they should be evaluated based
on the data and document review guidelines. Instead of reviewing the
subject’s data in the electronic case report form (eCRF), whether doing
transcription checking or just reviewing the eCRF, the MANA Method
allowed more comprehensive oversight of each subject’s data in con-
text (i.e., across multiple data sets) and over time. This approach iden-
tified errors in process that were not obvious when the review focused
only on out- of-range values, transcription errors, or missing data.
2. Time—The MANA Method meets the RBM regulatory guidance
for rapidly reviewing critical data. The main tool used for subject
review, MANA RBM’s Subject Profile Analyzing Risk (SPAR), was built
and deployed within two weeks of data upload into JReview—allow-
ing comprehensive subject data review immediately after data entry.
While not possible in this pilot, when the MANA Method is imple-
mented from the beginning of the trial, actual time to subject review
and time to identification of major issues could be calculated, deliv-
ering oversight in days rather than waiting for an on-site visit.
This illustrates how overall monitoring time can be greatly de-
creased. Instead of selecting a subset of subjects or a subset of data
for SDV, now every subject’s critical data can be reviewed without
impacting overall study costs. Rapid, comprehensive review can
also occur when new data are added without significantly impacting
costs. There is no “critical amount” of data needed to perform sub-
ject review. The data from a subject visit is sufficient to start review.
These findings align with the data MANA RBM previously published
on the speed of using the SPAR to conduct subject review.4
Once the MANA RBM protocol-specific complete reports were
designed, developed, and validated, the actual review process was sig-
nificantly shorter, and performed remotely. This provides tremendous
potential savings for studies, such as oncology trials, that currently
require on-site visits to review subject data, even for a single subject.
Time savings were not restricted only to monitoring time. Using the
MANA Method, site monitoring savings were at least 83%, data manage-
ment time savings could have exceeded 40 hours per month, and senior
management time savings could have exceeded 60 hours per month.
3. Cost—This approach should be, at a minimum, cost-neutral.
Cost savings can be significant depending on how the entire study is
designed and implemented.
Any cost comparisons of methods should include total costs for
trial oversight. With better oversight by the monitors, data are cor-
rected faster—saving site time and enhancing the number of evalu-
able subjects. In addition, this pilot demonstrated that internal senior
management time can be saved when the MANA Method is used to
ensure cleaner data and identify critical issues earlier.
Using an electronic investigator site file (eISF) and certified cop-
ies of informed consent and other source documents would have
enabled complete remote review because all documents would
have been available remotely. Clinical trial associates can perform
many tasks to manage the regulatory binders (i.e., complete and
correct documents) and informed consent review—adding to cost
savings. While the eISF and remote informed consent review were
not used in the pilot, these tools can save additional resources and
enable more comprehensive remote review.
Employing ePRO/eDiary in this study would have also yielded
significant cost savings as discussed ahead. If eDiaries had been
used, with eConsent (or certified copies of paper informed consents
and subject diaries) and eISF, the number of on-site visits could have
been significantly decreased.
The importance of eSource and eConsent
eSource and eConsent provide several benefits for RBM and remote
trial management. Most companies incorrectly assume a change
is necessary to add these tools to its EDC. eSource can be imple-
mented using EDC with direct data entry or with a system designed
to be used on a tablet. The benefits include:
• Meets the ICHE6(R2) and eSource ALCOA data requirements (i.e.,
Attributable, Legible, Contemporaneous, Original, Accurate).
• Immediate access to data for review.
• Collecting the data needed to document study processes, not just
the clinical data needed for analysis.
• Identifying errors at the user level based on audit trail or docu-
mentation of who performed assessments, rather than just at the
site level, allowing for more focused remediation.
• Providing immediate feedback to the person conducting the assess-
ment through instructions and queries to identify data that do not
conform to expectations (e.g., a very low height recorded because
the height entry recorded was in centimeters but collected in inches).
• Using the audit trail to identify data not entered contemporane-
ously according to the protocol and instead entered post hoc.
• Providing a complete source record for each subject.
• Allowing remote QC of monitor/data management performance be-
cause all subject data are available for review.
Using eSource provides significant cost savings. For the 500+
subjects in this study, using an eDiary would have resulted in savings
from sites entering 20,000 data points from memory aids (assuming
40 items/subject, five seconds of data entry/item), monitors visiting
the sites to review the 20,000 data points (five seconds/item), and an
estimated 500 queries (2.5% error rate, 15 minutes/query). This one
change could have saved, conservatively, 179 hours of study staff
time (over four weeks of work), not including costly monitor travel
time or the increased frequency of visits required to review these
critical data.
For eConsent, additional benefits include:
• Immediate access to the informed consent forms (ICF) for remote
review.
• Assuring the correct ICF version was used.
• Importing the date/time of the ICF signature into the EDC/eS-
ource system. This can be a triggering event to activate the EDC/
eSource and assure that no assessments were done before com-
pleting the ICF. This feature is not available in all systems.
• Eliminating many edit checks and queries based on determining
appliedclinicaltrialsonline.com APPLIED CLINICAL TRIALS 13November 2018
RISK-BASED MONITORING
the time of informed consent (if import of date/time into the EDC
was used).
• Providing additional documentation of the process of obtaining
informed consent.
• Remote audits of informed consents.
Using certified copies of paper informed consents and paper sub-
ject source data such as diaries provide an intermediate alternative
to eConsent and facilitates rapid remote review.
The importance of central review and trending
While MANA RBM remote site monitors found important deviations
using subject review, the central review process was invaluable in
identifying the critical findings discussed in this article.
Reviewing trends allowed the MANA RBM team to identify sites
having problems with scheduling patient visits, dosing according to
the protocol, methods for collecting vital signs, and rating differences.
While not necessarily critical findings in isolation, these issues can
affect trial outcomes if left alone to compound over time. Investigating
critical data and process findings represent the core of RBM principles.
Oversight should be focused on “errors that matter,” which include
processes in addition to analysis data. Trend analysis is critical because
trends indicate systemic issues with those data and processes. These
types of issues cannot be identified by SDV or even remote eCRF review.
Only through using more scientific, data-driven, systematic approaches
can important findings be identified, evaluated, and corrected.
Protocol-specific analysis
It is notable, for many reasons, that many RBM models incorporate
SDV as its method for quality oversight; albeit fewer fields are now
reviewed than the previous 100% SDV standard prior to the release of
the FDA, EMA, and ICH Guidances. One problem reported in the Kunzi
et al. paper is echoed by others: That monitors, although instructed to
do less SDV, are concerned that they do not have a good grasp of the
subjects when doing anything less than 100% SDV and will, therefore,
perform 100% SDV regardless of the monitoring plan—this negated
any anticipated RBM cost savings and required longer site visits.5
Our data conflict with the perceptions published by Kunzi et al.,
which reported that 58% of monitors in Europe, experienced in RBM,
thought important protocol violations were missed using RBM.5 The
MANA Method identified remotely all critical deviations discovered by
on-site monitors.
In addition, the MANA Method allowed the monitors to know ex-
actly what the important data were and how to efficiently review all
critical data in minutes, while providing more effective oversight than
traditional SDV.
Sponsor opportunities
These data demonstrate the potential opportunities for enhanced
trial oversight using remote, systematic, data-driven, analytic meth-
ods focused on the data that matters, (i.e., affecting trial analysis,
subject safety, IP management, and human subject protection).
These approaches use fewer resources, at a lower cost, and can
be adopted without increasing study budgets—in many cases with
lower study budgets. More importantly, trial quality is improved and
sponsors know immediately about the issues that can affect the
study, study participants, and regulatory submissions.
Just as sound research methods are the hallmark of pharma,
biotech, device, and vaccine discovery efforts, sponsors now have
the opportunity and the responsibility to apply sound, quality-based
research methods and tools to the clinical research they conduct.
As clinical research professionals, it is our responsibility to embrace
improved methods for quality oversight and not be complacent and
continue to perform trials “as we have always done them.” Regula-
tors, patients, and their physicians are counting on us.
The MANA Method is a proprietary, study-specific RBM approach
performed remotely, independent of the EDC system used, and
adoptable at any time during trial conduct. It was shown to sys-
tematically identify errors in trial conduct, subject safety oversight,
and GCP compliance. The MANA Method identified critical errors in
trial data and study conduct trends, within and across sites, more
effectively when compared with on-site SDV. This pilot study demon-
strated that subject review could be started earlier, and overall
resource use was less than with traditional SDV on-site monitoring.
References
1. US Department of Health and Human Services. Food and Drug
Administration. Guidance for Industry: Electronic Source Data in Clin-
ical Investigations. U.S. Department of Health and Human Services.
Washington, DC. US Department of Health and Human Services; 2013.
https://www.fda.gov/downloads/drugs/guidancecomplianceregula-
toryinformation/guidances/ucm328691.pdf
2. European Medicines Agency, Science Medicines Health.Reflection
paper on expectations for electronic source data and data transcribed
to electronic data collection tools in clinical trials.09 June 2010. EMA/
INS/GCP/454280/2010.
3. Manasco PK, Riley-Wagenmann C, Flack M; Remote Informed Consent
Review: Results of Implementation in Phase III Trial. Drug Information
Association. June 2013.
4. Manasco PK, McKee c, Dacpano G, Manasco G, Pallas M, Finlay C,
Galang S, White T, Erwin R, Danzig L., Subject Profile Analyzing Risk
Saves Time for Monitors. Applied Clinical Trials, Dec. 2, 2016.
5. Kunzi C, Rollinger Y, Sigmund M, Kunert V, Breuer B, RBM An Update
of Experiences Among European CRAs. Applied Clinical Trials, Oct.
20, 2017.
Penelope Manasco, MD, is CEO, MANA RBM; Eric Herbel is Pres-
ident, Integrated Clinical Systems, Inc.; Sean Bennett, MD, PhD, is
Senior Director, Clinical Development and Medical Affairs, PaxVac,
Inc.; Michelle Pallas is Director of Statistical Programming and Data
Management, PaxVax; Lisa Bedell, MA, is Senior Director, Biostatis-
tics, PaxVax; Deborah Thompson, MPH, is a consultant for MANA
RBM; Kevin Fielman, PhD, is affiliated with MANA RBM; Garrett
Manasco is a consultant for MANA RBM; Charlene Kimmel is
affiliated with MANA RBM; Everett Lambeth is a consultant with
MANA RBM; Lisa Danzig, MD, is Chief Medical Officer, PaxVax
14 APPLIED CLINICAL TRIALS appliedclinicaltrialsonline.com November 2018
PEER REVIEW
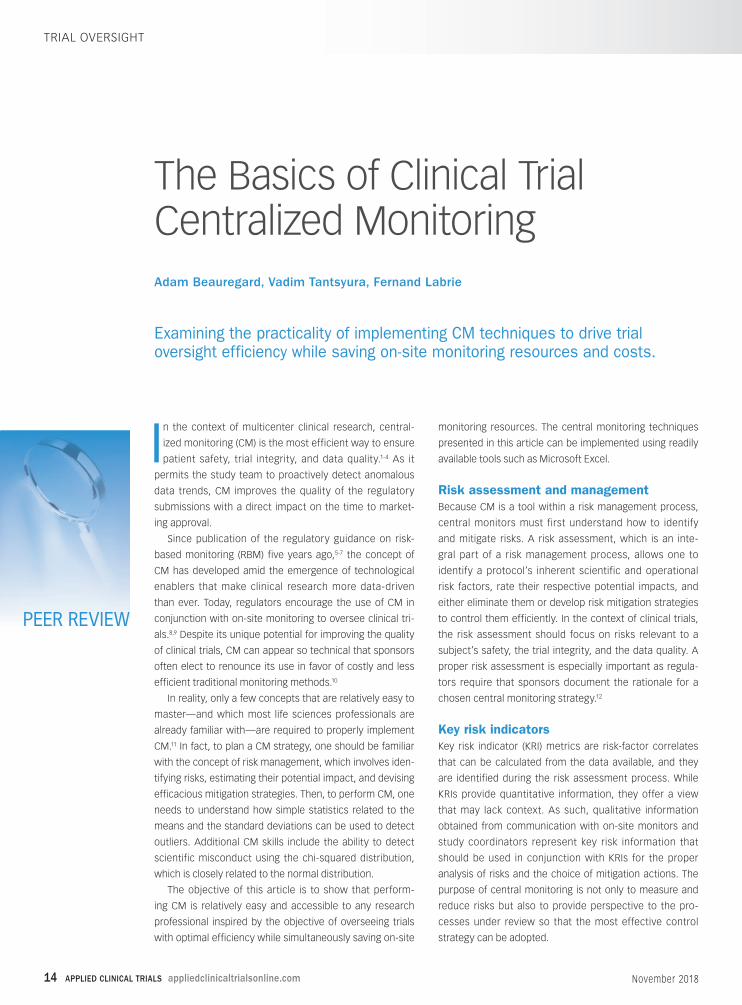
The Basics of Clinical Trial Centralized Monitoring
In the context of multicenter clinical research, central-
ized monitoring (CM) is the most efficient way to ensure
patient safety, trial integrity, and data quality.1-4 As it
permits the study team to proactively detect anomalous
data trends, CM improves the quality of the regulatory
submissions with a direct impact on the time to market-
ing approval.
Since publication of the regulatory guidance on risk-
based monitoring (RBM) five years ago,5-7 the concept of
CM has developed amid the emergence of technological
enablers that make clinical research more data-driven
than ever. Today, regulators encourage the use of CM in
conjunction with on-site monitoring to oversee clinical tri-
als.8,9 Despite its unique potential for improving the quality
of clinical trials, CM can appear so technical that sponsors
often elect to renounce its use in favor of costly and less
efficient traditional monitoring methods.10
In reality, only a few concepts that are relatively easy to
master—and which most life sciences professionals are
already familiar with—are required to properly implement
CM.11 In fact, to plan a CM strategy, one should be familiar
with the concept of risk management, which involves iden-
tifying risks, estimating their potential impact, and devising
efficacious mitigation strategies. Then, to perform CM, one
needs to understand how simple statistics related to the
means and the standard deviations can be used to detect
outliers. Additional CM skills include the ability to detect
scientific misconduct using the chi-squared distribution,
which is closely related to the normal distribution.
The objective of this article is to show that perform-
ing CM is relatively easy and accessible to any research
professional inspired by the objective of overseeing trials
with optimal efficiency while simultaneously saving on-site
monitoring resources. The central monitoring techniques
presented in this article can be implemented using readily
available tools such as Microsoft Excel.
Risk assessment and management
Because CM is a tool within a risk management process,
central monitors must first understand how to identify
and mitigate risks. A risk assessment, which is an inte-
gral part of a risk management process, allows one to
identify a protocol’s inherent scientific and operational
risk factors, rate their respective potential impacts, and
either eliminate them or develop risk mitigation strategies
to control them efficiently. In the context of clinical trials,
the risk assessment should focus on risks relevant to a
subject’s safety, the trial integrity, and the data quality. A
proper risk assessment is especially important as regula-
tors require that sponsors document the rationale for a
chosen central monitoring strategy.12
Key risk indicators
Key risk indicator (KRI) metrics are risk-factor correlates
that can be calculated from the data available, and they
are identified during the risk assessment process. While
KRIs provide quantitative information, they offer a view
that may lack context. As such, qualitative information
obtained from communication with on-site monitors and
study coordinators represent key risk information that
should be used in conjunction with KRIs for the proper
analysis of risks and the choice of mitigation actions. The
purpose of central monitoring is not only to measure and
reduce risks but also to provide perspective to the pro-
cesses under review so that the most effective control
strategy can be adopted.
Examining the practicality of implementing CM techniques to drive trial oversight efficiency while saving on-site monitoring resources and costs.
Adam Beauregard, Vadim Tantsyura, Fernand Labrie
TRIAL OVERSIGHT

appliedclinicaltrialsonline.com APPLIED CLINICAL TRIALS 15November 2018
Each KRI metric has associated values corre-
sponding to limits, also known as tolerance thresh-
olds, which are determined during the risk as-
sessment process. When site-specific metrics fall
beyond set limits, the root cause should be ana-
lyzed by central monitors and mitigation actions,
devised during the risk assessment process, imple-
mented as necessary. Figure 1 illustrates how a typ-
ical site-specific KRI metric (ex. error rate) may differ
from the rest of the population and fall beyond set
limits, thereby triggering local specific mitigation
actions. Figure 1 also illustrates how limits may be
changed according to the observed values as a
study progresses.
Risk importance
Using a risk matrix requires judgment for the prob-
ability of occurrence, the potential impact and the
detectability of each risk factor, in order to gener-
ate a score that permits ranking the KRIs according
to their importance. This method of assessing risks
is used in the risk assessment categorization tool
(RACT) published by TransCelerate BioPharma Inc.13 It should be noted
that the relative importance of each KRI does not influence the level
of oversight on them but rather serves as a scale for the intensity of
the mitigation actions put in place. For example, addressing a KRI of
low importance that falls outside its normal limit may require nothing
more than emails and phone calls to the site, whereas addressing a
KRI of high importance that falls outside its critical limit may require
more aggressive and resource-intensive approaches such as the dis-
patching of on-site monitors or the initiation of corrective and preven-
tative action (CAPA) processes.
The relative risk importance changes as the study progresses. For
example, the enrollment rate at the beginning of a study is an im-
portant indicator of trial viability, but after the enrollment is closed, it
becomes only an indicator of high enrollers, which does not directly
impact trial integrity. In comparison, a high query rate at the beginning
of a study might be addressed by retraining research coordinators
without significant consequences. But at the end of the study, it may
directly impact study quality and the time to database lock. Accord-
ingly, risk assessment should evaluate a study at different phases and
the focus of risk management should change with time.
Table 1 includes the most common clinical trial KRIs and the typical
output of a phase-relative risk assessment. Note that additional proto-
col-specific KRIs identified through a risk assessment process should
be considered in different trials.
Central monitoring reports
Communication between different stakeholders is instrumental to the
traceability of the CM process. The periodic central monitoring report
should include the site-specific risk factors that are outside tolerance
thresholds at the time of review, the specific metrics values, and their
variations since the last review. To achieve a traceable central monitor-
TRIAL OVERSIGHT
KEY RISK
INDICATORS
RISK
CATEGORY
IMPORTANCE
BY PHASE*
SU
BJE
CT S
AFE
TY
DATA
QU
ALIT
Y
TR
IAL I
NTEG
RIT
Y
STA
RT-U
P
EX
EC
UTIO
N
CLO
SE
-OU
T
Enrollment Rate ü H M L
Screen Failure Rate ü M M L
Early Termination Rate ü ü L M L
Out of Range Visit Rate ü L M M
Missed Dose Rate ü N/E H H
Missing Data Rate ü ü H H M
Time to Data Entry ü M H M
Query Rate ü ü L H H
Time to Query Resolution ü L H H
Error Rate ü ü H H H
Deviation Rate ü ü M H H
Adverse Event Rate ü ü L H M
Site Appreciation
Survey Scoreü H H H
*L: Low, M: Medium, H: High, N/E: Not Evaluated
KRI Metric Limits
Source: Beauregard et al.
Figure 1.Typical site-specific KRI history and associated limits.
Table 1. Common key risk indicators and the typical
output of a phase-relative risk assessment.
Risk Assessment Output
Source: Beauregard et al.
16 APPLIED CLINICAL TRIALS appliedclinicaltrialsonline.com November 2018
ing process, a concise analysis of the
reasons why the outlying values are
observed and the mitigation actions
which are implemented in response
should also be included in periodic
reports. CM reports specifically serve
to indicate how the situations prog-
ress in response to mitigation actions.
Reporting frequency may vary from
weekly to monthly depending on the
data acquisition rate, which typically
is higher during the study start-up
period and lower during the close-out
period.
Centralized monitoring:
Statistical background
The FDA defines CM (aka “central
statistical monitoring” or “statistical
data surveillance”) as “a remote eval-
uation carried out by sponsor person-
nel or representatives (e.g., clinical
monitors, data management personnel, or statisticians) at a location
other than the sites at which the clinical investigation is being con-
ducted.”14 Essentially, CM is used to perform the risk analysis part of
a risk management process and involves performing calculations on
an ongoing basis to discriminate normal from abnormal data. Today’s
technological enablers allow for the calculation of statistics from the
accumulating data and it is thus essential for central monitors to be
able to interpret the results correctly. The following sections cover the
statistical notions that central monitors should be familiar with.
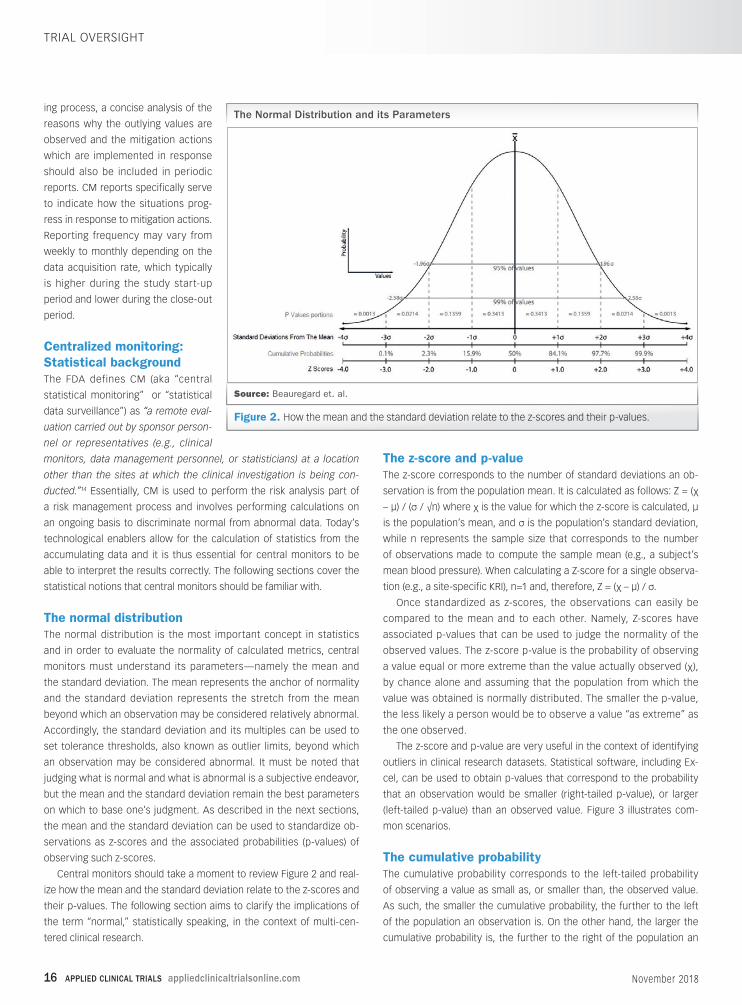
The normal distribution
The normal distribution is the most important concept in statistics
and in order to evaluate the normality of calculated metrics, central
monitors must understand its parameters—namely the mean and
the standard deviation. The mean represents the anchor of normality
and the standard deviation represents the stretch from the mean
beyond which an observation may be considered relatively abnormal.
Accordingly, the standard deviation and its multiples can be used to
set tolerance thresholds, also known as outlier limits, beyond which
an observation may be considered abnormal. It must be noted that
judging what is normal and what is abnormal is a subjective endeavor,
but the mean and the standard deviation remain the best parameters
on which to base one's judgment. As described in the next sections,
the mean and the standard deviation can be used to standardize ob-
servations as z-scores and the associated probabilities (p-values) of
observing such z-scores.
Central monitors should take a moment to review Figure 2 and real-
ize how the mean and the standard deviation relate to the z-scores and
their p-values. The following section aims to clarify the implications of
the term “normal,” statistically speaking, in the context of multi-cen-
tered clinical research.
The z-score and p-value
The z-score corresponds to the number of standard deviations an ob-
servation is from the population mean. It is calculated as follows: Z = (И
– μ) / (Д / √n) where И is the value for which the z-score is calculated, μ
is the population’s mean, and Д is the population’s standard deviation,
while n represents the sample size that corresponds to the number
of observations made to compute the sample mean (e.g., a subject’s
mean blood pressure). When calculating a Z-score for a single observa-
tion (e.g., a site-specific KRI), n=1 and, therefore, Z = (И – μ) / Д.
Once standardized as z-scores, the observations can easily be
compared to the mean and to each other. Namely, Z-scores have
associated p-values that can be used to judge the normality of the
observed values. The z-score p-value is the probability of observing
a value equal or more extreme than the value actually observed (И),
by chance alone and assuming that the population from which the
value was obtained is normally distributed. The smaller the p-value,
the less likely a person would be to observe a value “as extreme” as
the one observed.
The z-score and p-value are very useful in the context of identifying
outliers in clinical research datasets. Statistical software, including Ex-
cel, can be used to obtain p-values that correspond to the probability
that an observation would be smaller (right-tailed p-value), or larger
(left-tailed p-value) than an observed value. Figure 3 illustrates com-
mon scenarios.
The cumulative probability
The cumulative probability corresponds to the left-tailed probability
of observing a value as small as, or smaller than, the observed value.
As such, the smaller the cumulative probability, the further to the left
of the population an observation is. On the other hand, the larger the
cumulative probability is, the further to the right of the population an
TRIAL OVERSIGHT
The Normal Distribution and its Parameters
Source: Beauregard et. al.
Figure 2. How the mean and the standard deviation relate to the z-scores and their p-values.

appliedclinicaltrialsonline.com APPLIED CLINICAL TRIALS 17November 2018
observation is. For example, if a site-specific KRI metric
value corresponds exactly to the population KRI mean
value, its associated cumulative probability will be 50%. If
another site-specific metric has a cumulative probability of
100%, it means that approximately 100% of the other sites’
metrics values fall below the KRI value of that site and as
such, it is safe to call it an outlier. In the context of central
monitoring, the cumulative probability is particularly useful
because outliers are often observations that are greater
than the rest of the population.
Fraud detection
CM should not be limited to the monitoring of KRIs. Other
methods, such as the ones presented ahead, should be
used to detect scientific misconduct. Deliberate data
fraud is rare but can have significant impact on trial in-
tegrity. One straightforward way to fabricate data is to
take existing data and copy them within or across study
subjects. Such a data propagation method results in
certain values occurring more often than others; a simple
way to detect this type of data fabrication is to calculate
the frequency of each observation. As such, frequency
analysis can effectively detect if vital signs taken from
only one subject were copied into two subjects' charts
or if a single blood sample was split into two before
being sent to the laboratory. In most cases, however,
fraudsters are unlikely to be so careless as to copy data
without modifying some of the values. Fortunately, there
are other ways to detect fraud, which are harder to evade given the
predictability of human nature.15,16
The chi-square distribution
The chi-square distribution is graphically different from the normal dis-
tribution, but it can be used in the same manner to assess the normal-
ity of values that follow its distribution pattern. Importantly, the sum
of squares, which is defined as the squared differences between ob-
served values and expected values, follows a chi-square distribution.17
The chi-square statistic (И²) can thus be used to evaluate the difference
between what is observed and what is expected as being normal. It is
calculated as follows:
ѯ² = ʖ (Observed - Expected)²Expected
Like the z-score, the И² statistic has associated p-values. Figure 4
shows how the И² statistic (right-tailed p-values) corresponds to the
probability of observing a difference between the observed and the
expected values that would be as large or larger than the actually ob-
served difference. The larger the И² p-value, the closer the observed
values lie from the expected ones. On the other hand, the smaller the
И² p-value, the farther the observed values will be from the expected
ones. The degrees of freedom (DF) of the chi-square distribution corre-
spond to the number of observations taken into account in the calcula-
tion of the И² value. Figure 5 shows how the shape of the И² distribution
changes according to the degrees of freedom. Note that the degrees of
freedom also correspond to the mean chi-square value for the different
И² distributions.
Because expected values are based upon calculated averages and
real data never lie too close or too far from the expected values, the И²
p-value may indicate fraud if it is either too small or too large. Indeed,
counterfeiters are bad at mimicking the randomness of nature18-22 and
when one observes data that are either too far or too close to expec-
tations, it is reasonable to suspect fabrication. As described ahead,
terminal digit analysis and inlier analysis are two types of analyses that
use the И² statistic to evaluate if data lie too far or too close to the ex-
pected values, respectively.
Too far from expectation: Terminal digit analysis
If we consider measurements that have two or more digits, we are
expecting the frequencies at which the digits from 0s to 9s appear in
the rightmost position to be approximately equal. To perform terminal
digit analysis using the chi-square “goodness of fit” test with the И²
formula indicated at left, the observed values correspond to the num-
ber of times each digit, from 0 to 9, appears in the dataset of interest
while the expected values for each digit corresponds to the number
of measurements taken into account divided by 10, since each digit
is expected to appear with equal frequency. The degrees of freedom
associated with the terminal digit analysis is 9, considering the sample
size of 10 possible categories (digits 0 to 9) minus 1. The calculated И²
TRIAL OVERSIGHT
Common Probability Scenarios
Source: Beauregard et al.
Figure 3. P-values associated with the z-scores of the normal distribution.
Observed vs. Expected Values
Source: Beauregard et al.
Figure 4. The chi-square
distribution and associated
right-tailed probability (p-value).
Shape of the Distribution
Source: Beauregard et al.
Figure 5. The chi-square
distribution shape
variations according to the
degrees of freedom.

18 APPLIED CLINICAL TRIALS appliedclinicaltrialsonline.com November 2018
p-value indicates the “goodness of fit” be-
tween the observed last digit distribution and
a perfectly uniform last digit distribution.
Figure 6 illustrates how the И² p-value re-
lates to the last digit distribution. Note that if
certain digits appear in the terminal position
more often than others, it might be caused by
measuring instruments or by normal practice
that requires rounding.23 In other cases, it
might be because of fraud, as humans tend
to favor certain digits when fabricating num-
bers.24,25 The latter instance constitutes repre-
hensible behavior that has significant impact
on the trustworthiness of all data provided by
the site of interest.
Too close to
expectations: Inlier analysis
Real subject-specific data are expected to vary to a certain extent
from one physician’s office visit to the next. An inlier analysis can be
used to detect whether this is the case or not. A single fabricated
variable—let’s say heart rate—may remain plausible on its own, but
if considered with other fabricated variables such as respiration rate,
systolic BP, diastolic BP, and temperature, the combined data are
likely to exhibit an abnormal multivariate pattern that can be detected
statistically.26,27 Inlier analysis specifically evaluates how close to their
respective means a set of multivariate observations lies and suggests
fabrication if those observations, taken together, lie abnormally close
to their respective mean. Specifically, if a subject’s data have been
chosen to mimic real data, its measures will consistently lie close to
an anchor value,28 such as the population’s mean, and the sum of
the differences between its observed measures and the population
means for those measures will be smaller than the sum of differences
calculated for the rest of the population. The sum of squared z-scores
follows a chi-square distribution and it can be used, in place of the И²
statistic, to obtain p-values corresponding to the probability of observ-
ing a given sum of squared z-scores.29 The following steps describe
how to perform a multivariate inlier analysis:
• Step 1. Choose the variables to evaluate. In the context of clinical
research, variables that can be easily fabricated include physical exam-
ination and vital signs data.
• Step 2. Calculate subject-specific z-scores for each variable
using subject-specific mean scores (И), population`s means (μ) and
population standard deviation (Д) using Z = (И – μ) / (Д / √n) where n
represents the number of subject-specific samples used to calculate
subject-specific means И.
• Step 3. Square those z-scores and add them up to have sub-
ject-specific summed Z² values. Subject-specific summed Z² values
should follow a И² distribution with a degree of freedom corresponding
to the number of variables considered in the calculation of the sub-
ject-specific summed Z².30-33 An inlier can be identified as a subject with
an unusually small summed Z² value and an associated p-value can be
obtained using the subject-specific summed Z² value as a И² value.
To visualize the inlier analysis, one can graph all subject-specific
summed Z² values as cluster points along with anchor points corre-
sponding to the number of variables taken into account for the calcula-
tion of the subject-specific summed Z² values (the degrees of freedom).
As stated, the degrees of freedom represent the mean summed Z²
value and this value corresponds to the normal distance from their re-
spective means. Inliers will be apparent on such graphs as points that
lie unusually far to the left from the mean summed Z² value, relative to
other subject-specific summed Z² values. For better visualization, one
can transform all summed Z² values using natural log function.
In Figure 7 (see facing page), the subject-specific natural log of
summed squared z-scores were calculated using five variables,
including heart rate, respiration rate, systolic BP, diastolic BP, and
temperature. The normal distance from the multivariate mean is
indicated by the red dotted line that corresponds to the natural log
of the degree of freedom. The graph indicates that two subjects at
site 17 and 18 have measures consistently close to their respective
means. With such a scenario, central monitors have good reasons to
inquire further with the site staff as to why those subjects’ measures
are so close to their respective means.
Limitations of CM
It is important to consider that there is no single universally applicable
or generic outlier detection approach34-36 and a direct confirmation of
discrepancy or proof of fraud is seldom obtained from statistical evi-
dence alone. Abnormal data analysis only serves as support for further
investigation. In addition, because statistical power is dependent on
sample size, it is important to consider that a large amount of false
positive signals may be observed when the data sampled is small,
such as is the case at the beginning of trials or when trials are of small
size.37 Thus, site-specific metrics should always be interpreted with
the consideration of sample size. One may elect to wait for a sufficient
amount of data to be accumulated at a site before initiating analysis
for that site. Considering these limitations, CM should not rely only on
statistical algorithms. Simple analysis such as checking if examination
dates correspond to weekend or holiday dates can serve the purpose
of flagging suspicious sites.38,39 Also, the fact that a given site does not
TRIAL OVERSIGHT
Last Digit Distribution
Source: Beauregard et al.
Figure 6. Examples of last-digit distributions with their associated И² p-values.

appliedclinicaltrialsonline.com APPLIED CLINICAL TRIALS 19November 2018
manage to generate enough data to be considered for analysis may
constitute a signal in itself.
Conclusion
The core objective of CM is to support a risk management process that
aims to ensure subjects’ safety, trial integrity, and data quality in the
most efficient way. CM can undoubtedly play an important role in in-
creasing the quality of clinical trials as it allows sponsors to intelligently
decrease the amount of costly on-site monitoring. This is very import-
ant since the overall cost of monitoring can represent up to one-fourth
of trial costs40-42 and the efficiency of monitoring efforts, including on-
site and central monitoring, has a direct impact on the cost of clinical
trials and the price of treatments that ensue. Abnormal data patterns
can be readily detected even by simple statistical methods, and the
skills required to perform CM do not necessitate extensive training nor
the most advanced technology. In fact, most clinical research profes-
sionals have already been exposed to the statistical notions covered in
this article and can carry on the task of CM with readily available tools
such as Excel.
Adam Beauregard is Clinical Data Manager at EndoCeutics Inc. and
Consultant at XLSMetrics Inc.; Vadim Tantsyura is Senior Director
of Data Management at Target Health Inc. and adjunct faculty at New
York Medical School; and Fernand Labrie is Founder and CEO at
EndoCeutics Inc.
References
1. Dimitris K. Agrafiotis, Victor S. Lobanov, Michael A. Farnum, Eric Yang,
Joseph Ciervo, Michael Walega, Adam Baumgart, Aaron J. Mackey.
Risk-Based Monitoring of Clinical Trials: An Integrative Approach. Clin-
ical Therapeutics. 2018.
2. Baigent, C., Harrell, F.E., Buyse, M., Emberson, J.R. and Altman, D.G.
TRIAL OVERSIGHT
Vizualizing Inlier Analysis
Source: Beauregard et al.
Figure 7. Subject-specific natural logs of summed squared Z2 scores.

20 APPLIED CLINICAL TRIALS appliedclinicaltrialsonline.com November 2018
TRIAL OVERSIGHT
(2008) Ensuring trial validity by data quality assurance and diversifica-
tion of monitoring methods. Clinical Trials, 5, 49–55.
3. George S.L., Buyse M. Data fraud in clinical trials. Clin Investig (Lond).
2015; 5(2): 161–173.
4. Venet D, Doffagne E, Burzykowski T, Beckers F, Tellier Y, Genev-
ois-Marlin E, et al. A statistical approach to central monitoring of data
quality in clinical trials. Clin Trials. 2012;9:705–7013.
5. FDA. Guidance for industry oversight of clinical investigations – a risk-
based approach to monitoring. 2013.
6. European Medicines Agency. Reflection paper on risk based quality
management in clinical trials. 2013.
7. Transcelerate BioPharma. Position Paper: Risk-Based Monitoring
Methodology. 2013.
8. Integrated Addendum to ICH E6(R1): Guideline for Good Clinical
Practice E6(R2). International Council for Harmonisation of Technical
Requirements for Pharmaceuticals for Human Use (ICH). 09-Nov-2016.
9. Ashok Ghone. Centralized Monitoring--A Smart, Reliable Approach.
Applied Clinical Trials. Oct 01, 2015.
10. Linda B. Sullivan. The Current Status of Risk-Based Monitoring. Applied
Clinical Trials. Mar 27, 2015.
11. Buyse M, George SL, Evans S, et al. The role of biostatistics in the
prevention, detection and treatment of fraud in clinical trials. Statistics
in Medicine. 1999;18(24):3435–3451.
12. FDA. Guidance for industry oversight of clinical investigations – a risk-
based approach to monitoring. 2013.
13. TransCelerate BioPharma. Position Paper: Risk-Based Monitoring
Methodology. 2013.
14. FDA. Guidance for Industry oversight of clinical investigations – a risk-
based approach to monitoring. 2013.
15. 5. Buyse M, Evans SJW. Fraud in clinical trials. In: Armitage P, Colton
T, editors. Encyclopedia of Biostatistics. John Wiley; Chichester: 2005.
pp. 2023–2031.
16. Evans S. Statistical aspects of the detection of fraud. In: Lock S, Wells
F, Farthing M, editors. Fraud and Misconduct in Medical Research. 3.
BMJ Publishing Group; London: 2001. pp. 186–204.
17. Everitt, B.S. (2002) The Cambridge Dictionary of Statistics, CUP, ISBN
0-521-81099-X
18. Dlugosz, Stephan & Müller-Funk, Ulrich. (2009). The value of the last
digit: Statistical fraud detection with digit analysis. Adv. Data Analysis
and Classification. 3. 281-290. 10.1007/s11634-009-0048-5.
19. Bolton RJ, Hand DJ (2002) Statistical fraud detection: a review (with
discussion). Stat Sci 17(3): 235–255.
20. E. H. Hsü (1948) An Experimental Study on “Mental Numbers” and a
New Application, The Journal of General Psychology, 38:1, 57-67, DOI:
10.1080/00221309.1948.9711768
21. Boland, Philip J., and Kevin Hutchinson. 2000. “Student Selection of
Random Digits.” Statistician 49(4):519–529.
22. Murray G, Weir C. Fraud in Clinical Trials. Detecting it and preventing it.
Significance. Volume 8, Issue 4, Version of Record online: Nov. 25, 2011.
23. Al-Marzouki Sanaa, Evans Stephen, Marshall Tom, Roberts Ian. Are
these data real? Statistical methods for the detection of data fabrica-
tion in clinical trials. BMJ. 2005; 331 :267
24. Wen SW, Kramer MS, Hoey J, Hanley JA, Usher RH. Terminal digit
preference, random error, and bias in routine clinical measurement of
blood pressure. J Clin Epidemiol. 1993 Oct;46(10):1187-93.
25. Biostatistics in Clinical Trials. edited by Carol K. Redmond, Theodore
Colton - 204.
26. Buyse M, Evans SJW. Fraud in clinical trials. In: Armitage P, Colton T,
editors. Encyclopedia of Biostatistics. John Wiley; Chichester: 2005.
pp. 2023–2031.
27. Evans S. Statistical aspects of the detection of fraud. In: Lock S, Wells
F, Farthing M, editors. Fraud and Misconduct in Medical Research. 3.
BMJ Publishing Group; London: 2001. pp. 186–204.
28. Murray G, Weir C. Fraud in Clinical Trials. Detecting it and preventing it.
Significance. Volume 8, Issue 4, Version of Record online: Nov. 25, 2011.
29. Sheskin D.J. Handbook of Parametric and Nonparametric Statistical
Procedures. Mathematics, probabiliy and statistics. CRC. 4th Edition.
1997: 118.
30. Randall E. Schumacker, Learning Statistics Using R, SAGE Publica-
tions, Jan. 28, 2014. 118-122.
31. Hugill, MJ. Advanced Statistics. London: Bell and Hyman, 1985.
32. Arnold D. Well, Jerome L. Myers, Research Design & Statistical Analy-
sis, Psychology Press, Jan. 30, 2003, 191-192.
33. Evans, S. (2001). Statistical aspects of the detection of fraud. In: Lock,
S, Wells, F & Farthing, M, eds. Fraud and Misconduct: in Biomedical
Research, Third Edition. BMJ Books
34. Loureiro, A., Torgo, L. and Soares, C. (2004). Outlier detection using
clustering methods: a data cleaning application. In Proceedings of
KDNet Symposium on Knowledge-based Systems for the Public Sec-
tor. (Loureiro , 2004; Niu , 2007; Zhang and Wang , 2006),
35. Niu, K., Huang, C., Zhang S. and Chen, J. (2007). ODDC: outlier detec-
tion using distance distribution clustering. PAKDD 2007 Workshops,
Lecture Notes in Artificial Intelligence (LNAI) 4819 (Edited by T. Washio
et al.), 332-343. Springer-Verlag, New York.
36. Zhang, J. and Wang, H. (2006). Detecting outlying subspaces for
high-dimensional data: the new task, algorithms, and performance.
Knowledge and Information Systems. 10, 333-355.
37. Vadim Tantsyura et al. Extended Risk-Based Monitoring Model,
On-Demand Query-Driven Source Data Verification, and Their Eco-
nomic Impact on Clinical Trial Operations. Therapeutic Innovation &
Regulatory Science. Vol 50, Issue 1, pp. 115 – 122, 2015.
38. Buyse M, Evans SJW. Fraud in clinical trials. In: Armitage P, Colton T,
editors. Encyclopedia of Biostatistics. John Wiley; Chichester: 2005.
pp. 2023–2031.
39. Evans S. Statistical aspects of the detection of fraud. In: Lock S, Wells
F, Farthing M (Eds). Fraud and Misconduct in Biomedical Research.
London: BMJ Publishing Group, 2001 (third edition).
40. Sertkaya A, Wong HH, Jessup A, Beleche T. Key cost drivers of phar-
maceutical clinical trials in the United States. Clinical Trials. 2016
Apr;13(2):117-26. doi: 10.1177/1740774515625964. Epub 2016 Feb 8.
41. Getz KA. Low hanging fruit in the fight against inefficiency. Applied
Clinical Trials (20). 2011; 30–32.
42. Eisenstein EL, Lemons PW, Tardiff BE, et al. Reducing the costs of
Phase III cardiovascular clinical trials. American Heart Journal. 3
(149). 2005; 482-488. http://www.ahjonline.com/article/S0002-
8703(04)00591-5/abstract
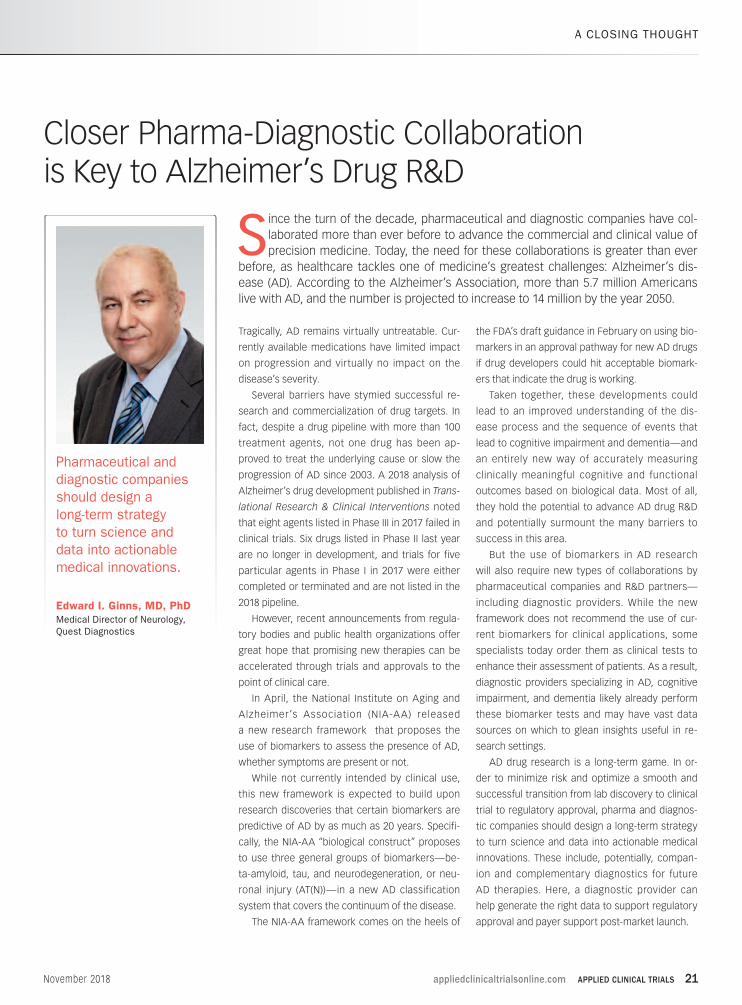
appliedclinicaltrialsonline.com APPLIED CLINICAL TRIALS 21November 2018
A CLOSING THOUGHT
Pharmaceutical and
diagnostic companies
should design a
long-term strategy
to turn science and
data into actionable
medical innovations.
Edward I. Ginns, MD, PhD
Medical Director of Neurology,
Quest Diagnostics
Closer Pharma-Diagnostic Collaboration is Key to Alzheimer’s Drug R&D
Tragically, AD remains virtually untreatable. Cur-
rently available medications have limited impact
on progression and virtually no impact on the
disease’s severity.
Several barriers have stymied successful re-
search and commercialization of drug targets. In
fact, despite a drug pipeline with more than 100
treatment agents, not one drug has been ap-
proved to treat the underlying cause or slow the
progression of AD since 2003. A 2018 analysis of
Alzheimer’s drug development published in Trans-
lational Research & Clinical Interventions noted
that eight agents listed in Phase III in 2017 failed in
clinical trials. Six drugs listed in Phase II last year
are no longer in development, and trials for five
particular agents in Phase I in 2017 were either
completed or terminated and are not listed in the
2018 pipeline.
However, recent announcements from regula-
tory bodies and public health organizations offer
great hope that promising new therapies can be
accelerated through trials and approvals to the
point of clinical care.
In April, the National Institute on Aging and
Alzheimer’s Association (NIA-AA) released
a new research framework that proposes the
use of biomarkers to assess the presence of AD,
whether symptoms are present or not.
While not currently intended by clinical use,
this new framework is expected to build upon
research discoveries that certain biomarkers are
predictive of AD by as much as 20 years. Specifi-
cally, the NIA-AA “biological construct” proposes
to use three general groups of biomarkers—be-
ta-amyloid, tau, and neurodegeneration, or neu-
ronal injury (AT(N))—in a new AD classification
system that covers the continuum of the disease.
The NIA-AA framework comes on the heels of
the FDA’s draft guidance in February on using bio-
markers in an approval pathway for new AD drugs
if drug developers could hit acceptable biomark-
ers that indicate the drug is working.
Taken together, these developments could
lead to an improved understanding of the dis-
ease process and the sequence of events that
lead to cognitive impairment and dementia—and
an entirely new way of accurately measuring
clinically meaningful cognitive and functional
outcomes based on biological data. Most of all,
they hold the potential to advance AD drug R&D
and potentially surmount the many barriers to
success in this area.
But the use of biomarkers in AD research
will also require new types of collaborations by
pharmaceutical companies and R&D partners—
including diagnostic providers. While the new
framework does not recommend the use of cur-
rent biomarkers for clinical applications, some
specialists today order them as clinical tests to
enhance their assessment of patients. As a result,
diagnostic providers specializing in AD, cognitive
impairment, and dementia likely already perform
these biomarker tests and may have vast data
sources on which to glean insights useful in re-
search settings.
AD drug research is a long-term game. In or-
der to minimize risk and optimize a smooth and
successful transition from lab discovery to clinical
trial to regulatory approval, pharma and diagnos-
tic companies should design a long-term strategy
to turn science and data into actionable medical
innovations. These include, potentially, compan-
ion and complementary diagnostics for future
AD therapies. Here, a diagnostic provider can
help generate the right data to support regulatory
approval and payer support post-market launch.
Since the turn of the decade, pharmaceutical and diagnostic companies have col-
laborated more than ever before to advance the commercial and clinical value of
precision medicine. Today, the need for these collaborations is greater than ever
before, as healthcare tackles one of medicine’s greatest challenges: Alzheimer’s dis-
ease (AD). According to the Alzheimer’s Association, more than 5.7 million Americans
live with AD, and the number is projected to increase to 14 million by the year 2050.