conference preview an overview of new products at the...
TRANSCRIPT
self-contained miniature x-ray tubesystem has been introduced byAmptek (Bedford, MA) for portablex-ray fluorescence (XRF) analysis.
The LASER-X system houses the x-ray tube,power supply, and control electronics in a sin-gle, compact enclosure. Features include agrounded anode; variable current and volt-age; a 35-kV, 100-�A power supply with asolid silver target; and an end window. Thesystem is designed to replace radioisotopes inapplications such as process control, OEMuse, research, and teaching.
Bede (Englewood, CO) has just releasedthe second version of its Instrument Controlsoftware, which offers an improved scriptingengine, special applications screens, an im-proved scan set-up screen, and Windows2000 compatibility. The company is also re-leasing new versions of its RADS and REFSsoftware, which incorporate the company’sMercury technology. Mercury uses geneticalgorithms and provides an automatic pa-rameter-optimization procedure for x-rayreflectivity and diffraction data. RADS 4.0calculates high-resolution x-ray rockingcurves for epitaxial crystal structures andsubstrates with Takagi-Taupin x-ray scatter-ing equations of dynamical diffractions.REFS 4.0 employs the recursive formulationof dynamical theory for simulating grazingincidence x-ray reflectivity for both specularand diffuse and fluorescence curves.
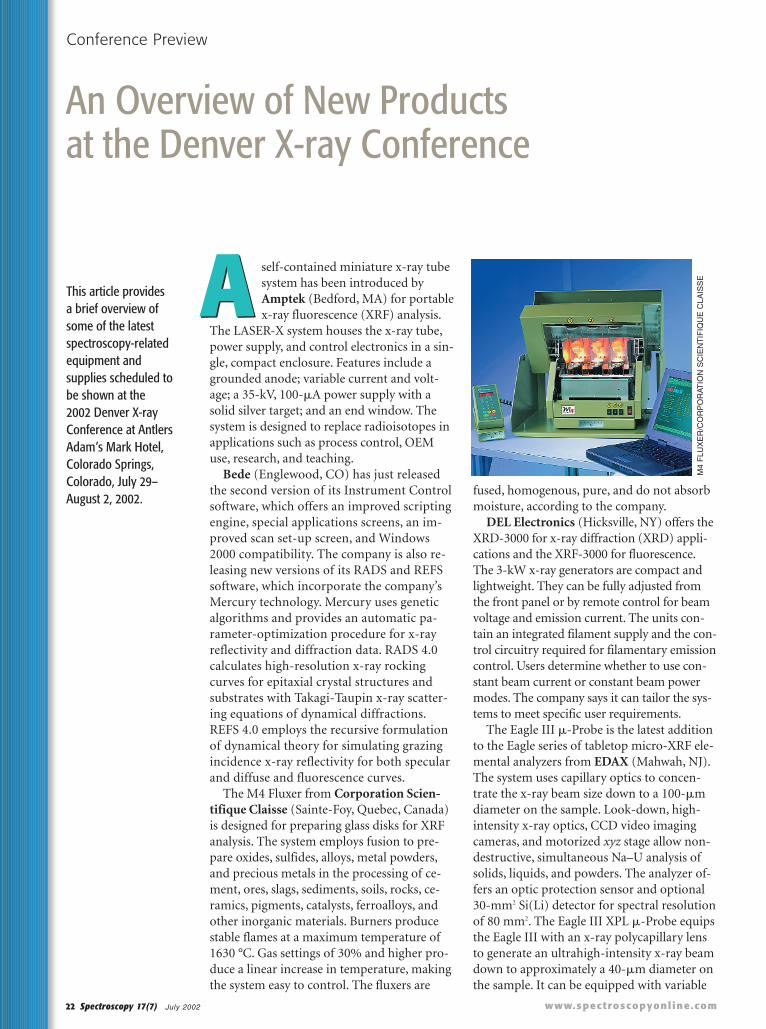
The M4 Fluxer from Corporation Scien-tifique Claisse (Sainte-Foy, Quebec, Canada)is designed for preparing glass disks for XRFanalysis. The system employs fusion to pre-pare oxides, sulfides, alloys, metal powders,and precious metals in the processing of ce-ment, ores, slags, sediments, soils, rocks, ce-ramics, pigments, catalysts, ferroalloys, andother inorganic materials. Burners producestable flames at a maximum temperature of1630 °C. Gas settings of 30% and higher pro-duce a linear increase in temperature, makingthe system easy to control. The fluxers are
A
www.spectroscopyonl ine.com22 Spectroscopy 17(7) July 2002
fused, homogenous, pure, and do not absorbmoisture, according to the company.
DEL Electronics (Hicksville, NY) offers theXRD-3000 for x-ray diffraction (XRD) appli-cations and the XRF-3000 for fluorescence.The 3-kW x-ray generators are compact andlightweight. They can be fully adjusted fromthe front panel or by remote control for beamvoltage and emission current. The units con-tain an integrated filament supply and the con-trol circuitry required for filamentary emissioncontrol. Users determine whether to use con-stant beam current or constant beam powermodes. The company says it can tailor the sys-tems to meet specific user requirements.
The Eagle III �-Probe is the latest additionto the Eagle series of tabletop micro-XRF ele-mental analyzers from EDAX (Mahwah, NJ).The system uses capillary optics to concen-trate the x-ray beam size down to a 100-�mdiameter on the sample. Look-down, high-intensity x-ray optics, CCD video imagingcameras, and motorized xyz stage allow non-destructive, simultaneous Na–U analysis ofsolids, liquids, and powders. The analyzer of-fers an optic protection sensor and optional30-mm2 Si(Li) detector for spectral resolutionof 80 mm2. The Eagle III XPL �-Probe equipsthe Eagle III with an x-ray polycapillary lensto generate an ultrahigh-intensity x-ray beamdown to approximately a 40-�m diameter onthe sample. It can be equipped with variable
Conference Preview
An Overview of New Products at the Denver X-ray Conference
This article providesa brief overview ofsome of the latestspectroscopy-relatedequipment andsupplies scheduled tobe shown at the 2002 Denver X-rayConference at AntlersAdam’s Mark Hotel,Colorado Springs,Colorado, July 29–August 2, 2002.
A
M4
FLU
XE
R/C
OR
PO
RAT
ION
SC
IEN
TIF
IQU
E C
LAIS
SE

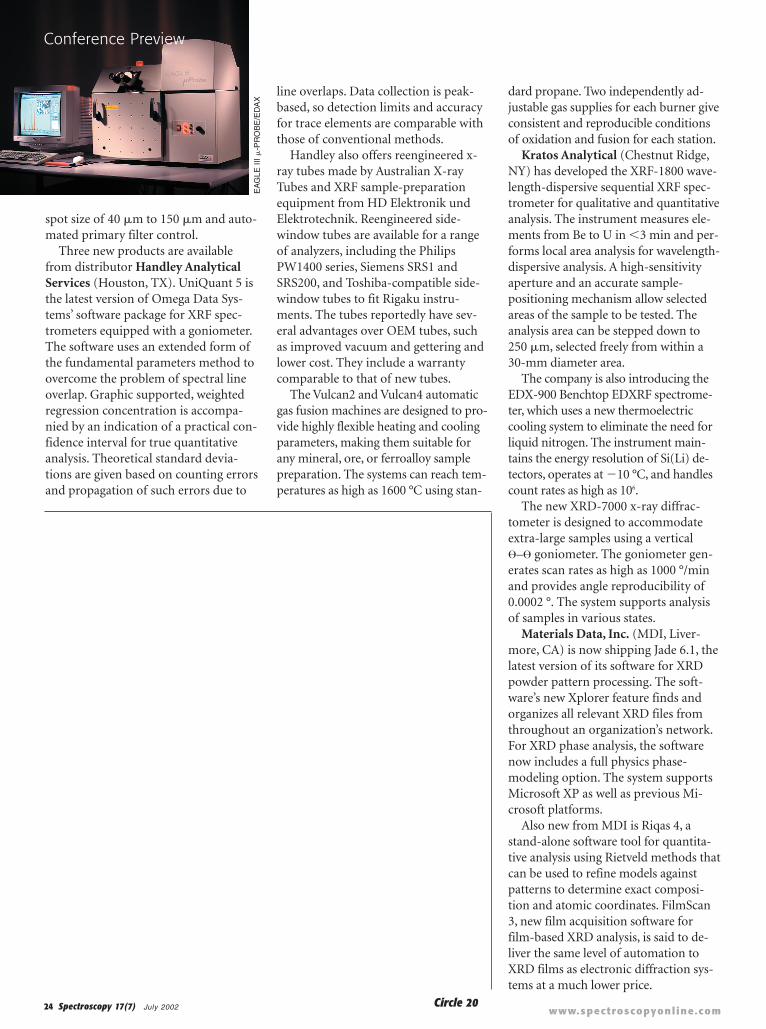
spot size of 40 �m to 150 �m and auto-mated primary filter control.
Three new products are availablefrom distributor Handley AnalyticalServices (Houston, TX). UniQuant 5 isthe latest version of Omega Data Sys-tems’ software package for XRF spec-trometers equipped with a goniometer.The software uses an extended form ofthe fundamental parameters method toovercome the problem of spectral lineoverlap. Graphic supported, weightedregression concentration is accompa-nied by an indication of a practical con-fidence interval for true quantitativeanalysis. Theoretical standard devia-tions are given based on counting errorsand propagation of such errors due to
www.spectroscopyonl ine.com24 Spectroscopy 17(7) July 2002
line overlaps. Data collection is peak-based, so detection limits and accuracyfor trace elements are comparable withthose of conventional methods.
Handley also offers reengineered x-ray tubes made by Australian X-rayTubes and XRF sample-preparationequipment from HD Elektronik undElektrotechnik. Reengineered side-window tubes are available for a rangeof analyzers, including the PhilipsPW1400 series, Siemens SRS1 andSRS200, and Toshiba-compatible side-window tubes to fit Rigaku instru-ments. The tubes reportedly have sev-eral advantages over OEM tubes, suchas improved vacuum and gettering andlower cost. They include a warrantycomparable to that of new tubes.
The Vulcan2 and Vulcan4 automaticgas fusion machines are designed to pro-vide highly flexible heating and coolingparameters, making them suitable forany mineral, ore, or ferroalloy samplepreparation. The systems can reach tem-peratures as high as 1600 °C using stan-
Circle 20
dard propane. Two independently ad-justable gas supplies for each burner giveconsistent and reproducible conditionsof oxidation and fusion for each station.
Kratos Analytical (Chestnut Ridge,NY) has developed the XRF-1800 wave-length-dispersive sequential XRF spec-trometer for qualitative and quantitativeanalysis. The instrument measures ele-ments from Be to U in �3 min and per-forms local area analysis for wavelength-dispersive analysis. A high-sensitivityaperture and an accurate sample-positioning mechanism allow selectedareas of the sample to be tested. Theanalysis area can be stepped down to250 �m, selected freely from within a30-mm diameter area.
The company is also introducing theEDX-900 Benchtop EDXRF spectrome-ter, which uses a new thermoelectriccooling system to eliminate the need forliquid nitrogen. The instrument main-tains the energy resolution of Si(Li) de-tectors, operates at �10 °C, and handlescount rates as high as 106.
The new XRD-7000 x-ray diffrac-tometer is designed to accommodateextra-large samples using a vertical �–� goniometer. The goniometer gen-erates scan rates as high as 1000 °/minand provides angle reproducibility of0.0002 °. The system supports analysisof samples in various states.
Materials Data, Inc. (MDI, Liver-more, CA) is now shipping Jade 6.1, thelatest version of its software for XRDpowder pattern processing. The soft-ware’s new Xplorer feature finds andorganizes all relevant XRD files fromthroughout an organization’s network.For XRD phase analysis, the softwarenow includes a full physics phase-modeling option. The system supportsMicrosoft XP as well as previous Mi-crosoft platforms.
Also new from MDI is Riqas 4, astand-alone software tool for quantita-tive analysis using Rietveld methods thatcan be used to refine models againstpatterns to determine exact composi-tion and atomic coordinates. FilmScan3, new film acquisition software forfilm-based XRD analysis, is said to de-liver the same level of automation toXRD films as electronic diffraction sys-tems at a much lower price.
EA
GLE
III
�-P
RO
BE
/ED
AX
Conference Preview

www.spectroscopyonl ine.com26 Spectroscopy 17(7) July 2002
standard XML language, it offers userscomplete control over XRD measure-ment data. The new XRDML data plat-form stores ASCII-format XRD measure-ment data in XML-based files thatcontain all measurement data as well asinformation required to reproduce thedata, including instrument type and set-tings, and it allows XRD system users toshare measurements with others. The lat-est versions of X’Pert Data Collector,HighScore, and Epitaxy are availablenow; X’Pert Plus, Industry, and Stresswill be released later this year.
MiniPal 2 is Philips Analytical’snewest benchtop EDXRF spectrometer.It performs nondestructive Na–U analy-sis in concentrations from 100% downto parts-per-million levels. The thermo-electrically cooled system analyzes liq-uids, powders, and surface coatingsusing an integrated deconvolution func-tion that separates closely spaced peaksin the spectrum. A Microsoft Windows–based software can analyze a full range ofelements without special accessories ormodifications.
Pro-Trace is the latest addition to thecompany’s XRF SuperQ software for cal-culating net intensities in trace-elementanalysis down to sub-part-per-millionlevels. The system uses blank specimenand optional calibration standards with acalibrating power of more than 200 in-ternational standard reference materials.A Windows-based graphical user inter-face and available on-line help featuringworked examples simplify operation. Thesoftware is designed for use with thecompany’s MagiX, MagiX PRO, andMagiX FAST XRF systems.
Laser-X is a new industrial miniaturex-ray source for XRF analysis fromPhotoelectron Corporation (Lexing-ton, PA). The device is designed as anOEM replacement for the radioactiveisotope sources used in hand-held XRFunits and process-control monitors. Ac-cording to the company, advantages ofthe new x-ray source over radioactivematerials include the following:• the radiation source can be turned
on and off at will• the intensity of the x-ray beam is
consistently high, and • the need for source replacement is
eliminated.
Conference Preview
The new Bullet miniaturex-ray tube from Moxtek(Orem, UT) is a compactx-ray source designed for low-power applications such asbattery-operated, portable in-struments. It features an inte-grated, high-voltage powersupply that can provide 40 kVand 100 A of output with amaximum input power of 8W. The design allows veryclose coupling of the sourceand sample, providing analyt-ical results comparable tohigher-powered x-ray tubes.The end-window version isavailable with a palladium or silveranode. Copper and tungsten anodes areavailable in a side-window configura-tion. The tube is available in 30- and40-kV options.
Osmic (Auburn Hills, MI) has intro-duced the OV160Y boron analyzer, amultilayer system for the B–K radiationline. The system offers nearly double
the intensity and peak-to-backgroundratios as the company’s previousMo/B4C multilayer systems, it reports,and is approximately 20% improvedover La/B4C multilayers.
Philips Analytical (Almelo, TheNetherlands) has developed a new dataplatform for its X’Pert range of XRDsoftware. Based on the new universal
MIC
RO
NX
/TH
ER
MO
NO
RA
N
Circle 22

July 2002 17(7) Spectroscopy 27
Rigaku/MSC (The Woodlands, TX) isintroducing the ZSX series of x-ray spec-trometers designed for routine R&D.The ZSX101 is a full-size 4-kW produc-tion XRF spectrometer. The ZSX100scan be configured in a tube below orabove, depending on the needs of theapplication. The ZSX mini is a benchtopWD-XRF system that operates at 110 Vand does not require any cooling waterfor the tube or generator. It can be usedfor applications that don’t require a full-powered analyzer, or as a back-up for alarger WD-XRF unit. ZSX software in-corporates the mostadvanced funda-mental parameters software available,according to the company.
SPEX CertiPrep, Sample Prepara-tion Division (Metuchen, NJ) intro-duces the 8000D and 8000M mixer/mills. Both are two-clamp laboratorymills featuring variable-range electronictimers, safety interlocks, and a widechoice of grinding and blending vials.The 8000D also offers forced-air cool-ing, has twice the capacity of its 8000
predecessor, and relies on two clampsthat run in balance to provide smootheroperation. Grinding/blending vials forboth mills are available in hardenedsteel, stainless steel, tungsten carbide,agate, alumina ceramic, zirconia ce-ramic, acrylic, and polystyrene. Theelectronic timer range can be alteredfrom 100 to 1000 min, making the millssuitable for lengthy operations such asmechanical alloying. The systems aredesigned for pulverizing rocks, cement,ceramics, and other materials in the 10-g range and for blending powders,paints, and emulsions in volumes ashigh as 60 mL or more. The high im-pact energy of the grinding balls has re-cently proved effective for mechanicalalloying in the production of supercon-ducting materials, the company reports.
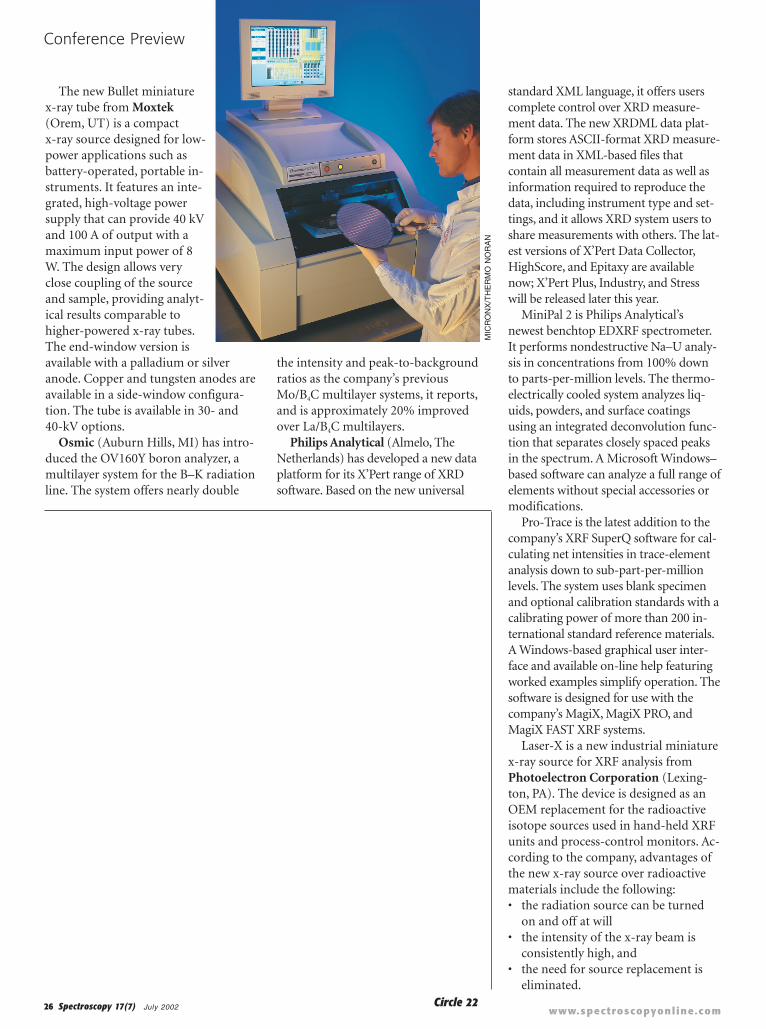
Thermo NORAN, a Thermo Elec-tron business (Middleton, WI), offers a
Circle 23
Conference Preview
complete new line of microbeam XRFmetrology tools. MicronX systems fea-ture collimated XRF tools that provideproduction-worthy film thickness andcomposition measurement of metaldepositions for the microelectronics,telecommunications, data storage, andmetal finishing industries. The systemsmeasure the thickness and compositionof as many as six layers of depositedmetals simultaneously, from angstromto micrometer thickness ranges. Thesesystems can also determine bulk alloysfor as many as 20 elements. The line in-cludes several options, allowing systemsto be optimized for specific applica-tions. Features include mechanical oroptical collimation, several x-ray detec-tor options, and vacuum options. Usinga common system platform and stan-dardized subassemblies, each tool can beconfigured to deliver the best perform-ance for the set of applications meas-ured by the tool.
X-ray Instrumentation Associates(XIA, Newark, CA) introduces the�DXP, a credit card–sized, low-power,full-featured digital spectrometer for usein portable or embedded x-ray, gammaray, and related applications. The systemuses the company’s own gate array plusDSP technology to achieve impressiveperformance in a small size and at rela-tively low cost. Intended primarily forOEM and other large-volume, low-costapplications, the analyzer is supportedby a suite of development tools includ-ing the �COM communication boardand �MANAGER board setup and datacollection software. The onboard DSPcan support custom codes to carry outreal-time spectral analysis and externalequipment control functions. The sys-tem offers a choice of 4-, 8-, or 16-MSPSdigitization rate, which sets basic powerconsumption (500, 630, or 750 mW)and maximum throughput (50, 100, or200 kcps).
XIA is also introducing the Saturn, acompletely digital x-ray spectrometersuitable for high-rate and high-resolution applications. The newestmember of the DXP line, the Saturn isintended for industrial and laboratory
“Conference Preview” continued onpage 35
�D
XP
/X-R
AY I
NS
TR
UM
EN
TAT
ION
AS
SO
CIA
TE
S

odern ICP-MS mustbe very flexible tomeet such diverseapplication needs
and keep up with the increasingdemands of its users. Nowhereis this more important than inthe area of peak integration andmeasurement protocol. The waythe analytical signal is managedin ICP-MS directly impacts itsmultielement capability, detec-tion limits, dynamic range, andsample throughput — the fourmajor strengths that attractedthe trace element community tothe technique almost 20 yearsago. To understand signal man-agement and its implications ondata quality in greater detail,this installment of this serieswill discuss how measurementprotocol is optimized based onthe application’s analytical re-quirements. I will discuss itsimpact on both continuous sig-nals generated by traditionalnebulization devices and tran-sient signals produced by alter-native sample introduction
M
www.spectroscopyonl ine.com28 Spectroscopy 17(7) July 2002
• the detection limits required• the precision and accuracy
expected• the dynamic range needed• the integration time used• the peak quantitation
routines.Before discussing these fac-
tors in greater detail, and howthey affect data quality, it is im-portant to remember how ascanning device such as aquadrupole mass analyzerworks (1). Although we willfocus on quadrupole technol-ogy, the fundamental principlesof measurement protocol will bevery similar for all types of massspectrometers that use a scan-ning approach for multielementpeak quantitation.
Measurement Protocol Figure 1 shows the principles ofscanning with a quadrupolemass analyzer. In this simplifiedexample, the analyte ion (black)and four other ions (colored)have arrived at the entrance tothe four rods of the quadrupole.When a particular rf/dc voltageis applied to the rods, the posi-tive or negative bias on the rodswill electrostatically steer theanalyte ion of interest down themiddle of the four rods to theend, where it will emerge and beconverted to an electrical pulseby the detector. The other ionsof different mass-to-charge ra-tios will pass through the spacesbetween the rods and be ejectedfrom the quadrupole. This scan-ning process is then repeated foranother analyte at a completelydifferent mass-to-charge ratio
techniques such as flow injec-tion and laser ablation.
Measurement VariablesMany variables affect the qualityof the analytical signal in ICP-MS. The analytical requirementsof the application will often dic-tate this factor, but instrumentaldetection and measurement pa-rameters can have a significantimpact on the quality of data inICP-MS. Some of the variablesthat can affect the quality ofyour data, particularly when car-rying out multielement analysis,include • whether the signal is continu-
ous or transient• the temporal length of the
sampling event• the volume of sample
available• the number of samples being
analyzed• the number of replicates per
sample• the number of elements being
determined
With its multielement capability, superb detection limits, wide dynamicrange, and high sample throughput, inductively coupled plasma–massspectrometry (ICP-MS) is proving to be a compelling technique for moreand more diverse application areas. However, no two application areashave the same analytical requirements. For example, environmentaland clinical contract laboratories — although requiring reasonably lowdetection limits — do not really push the technique to its extremedetection capability. Their main requirement is usually high samplethroughput because the number of samples these laboratories cananalyze in a day directly impacts their revenue. On the other hand, asemiconductor fabrication plant or a supplier of high-purity chemicalsto the electronics industry is interested in the lowest detection limits thetechnique can offer because of the contamination problems associatedwith manufacturing high performance electronic devices.
RobertThomashas more than30 years ofexperience intrace elementanalysis. He isthe principal ofhis ownfreelance writingand consultingcompany,ScientificSolutions, basedin Gaithersburg,MD. He can becontacted by e-mail [email protected] via his website at www.scientificsolutions1.com.
A Beginner‘s Guide to ICP-MSPart XI — Peak Measurement ProtocolRobert Thomas
M
T U T O R I A LT U T O R I A L

July 2002 17(7) Spectroscopy 29
Tutorial
on the masses of interest. Full peak pro-filing is not normally used for doingrapid quantitative analysis becausevaluable analytical time is wasted takingdata on the wings and valleys of thepeak, where the signal-to-noise ratio ispoorest.
When the best possible detectionlimits are required, the peak-hoppingapproach is best. It is important to un-derstand that, to get the full benefit ofpeak hopping, the best detection limitsare achieved when single-point peakhopping at the peak maximum is cho-sen. However, to carry out single-pointpeak hopping, it is essential that the
mass stability is good enough to repro-ducibly go to the same mass point everytime. If good mass stability can be guar-anteed (usually by thermostating thequadrupole power supply), measuringthe signal at the peak maximum will al-ways give the best detection limits for agiven integration time. It is well docu-mented that there is no benefit tospreading the chosen integration timeover more than one measurement pointper mass. If time is a major considera-tion in the analysis, then using multiplepoints is wasting valuable time on thewings and valleys of the peak, whichcontribute less to the analytical signal
Figure 2. Detection and measurement protocol using a quadrupole mass analyzer.
Figure 1. Principles of mass selection with a quadrupole mass filter.
+
+
+
+
++
+Quadrupole rods
-
+
Ionflow
Quadrupole
Quadrupolemass scancontrollerMultichannel data
acquisition
Channel number
Mass scan (amu)63
Detector
63Cu
63Cu scan
Copper ion (m/z 63)
1 2 3 4 5 6 7 ............ n
until all the analytes in a multielementanalysis have been measured.
The process for detecting one partic-ular mass in a multielement run is rep-resented in Figure 2, which shows a 63Cuion emerging from the quadrupole andbeing converted to an electrical pulse bythe detector. As the rf/dc voltage of thequadrupole — corresponding to 63Cu— is repeatedly scanned, the ions aselectrical pulses are stored and countedby a multichannel analyzer. This multi-channel data-acquisition system typi-cally has 20 channels per mass and asthe electrical pulses are counted in eachchannel, a profile of the mass is built-up over the 20 channels, correspondingto the spectral peak of 63Cu. In a multi-element run, repeated scans are madeover the entire suite of analyte masses,as opposed to just one mass representedin this example.
The principles of multielement peakacquisition are shown in Figure 3. Inthis example (showing two masses), sig-nal pulses are continually collected asthe quadrupole is swept across the massspectrum (in this case three times).After a given number sweeps, the totalnumber of signal pulses in each channelare counted.
When it comes to quantifying an iso-topic signal in ICP-MS, there are basi-cally two approaches to consider (2).One is the multichannel ramp scanningapproach, which uses a continuoussmooth ramp of 1 to n channels (wheren is typically 20) per mass across thepeak profile. This approach is shown inFigure 4.
The peak-hopping approach is wherethe quadrupole power supply is drivento a discrete position on the peak (nor-mally the peak point) and allowed tosettle; a measurement is then taken for afixed amount of time. This approach isrepresented in Figure 5.
The multipoint scanning approach isbest for accumulating spectral and peakshape information when doing massscans. It is normally used for doingmass calibration and resolution checks,and as a classical qualitative method de-velopment tool to find out what ele-ments are present in the sample, as wellas to assess their spectral implications

www.spectroscopyonl ine.com30 Spectroscopy 17(7) July 2002
and more to the background noise. Fig-ure 6 shows the degradation in signal-to-background noise ratio of 10 ppb Rhwith an increase in the number of pointsper peak, spread over the same total inte-gration time. Detection limit improve-ment for a selected group of elementsusing 1 point/peak, rather than 20points/peak, is shown in Figure 7.
Optimization of MeasurementProtocolNow that the fundamentals of thequadrupole measuring electronics havebeen described, let us now go into moredetail on the impact of optimizing themeasurement protocol based on the re-
quirement of the application. Whenmultielement analysis is being carriedout by ICP-MS, a number of decisionsneed to be made. First, we need to knowif we are dealing with a continuous sig-nal from a nebulizer or a transient sig-nal from an alternative sampling acces-sory. If it is a transient event, how longwill the signal last? Another questionthat needs to be addressed is, how manyelements are going to be determined?With a continuous signal, this isn’t sucha major problem, but it could be anissue if we are dealing with a transientsignal that lasts a few seconds. We alsoneed to be aware of the level of detec-tion capability required. This is a major
consideration with a single-shot laserpulse that lasts 5–10 s. Also with a con-tinuous signal produced by a concentricnebulizer, we might have to accept acompromise of detection limit based onthe speed of analysis requirements oramount of sample available. What ana-lytical precision is expected? If it’s iso-tope ratio/dilution work, how many ions do wehave to count to guarantee good preci-sion? Does increasing the integrationtime of the measurement help the pre-cision? Finally, is there a time constrainton the analysis? A high-throughput lab-oratory might not be able to afford touse the optimum sampling time to getthe ultimate in detection limit. In otherwords, what compromises need to bemade between detection limit, preci-sion, and sample throughput? Clearly,before the measurement protocol canbe optimized, the major analytical re-quirements of the application need tobe defined. Let’s take a look at thisprocess in greater detail.
Multielement Data QualityObjectivesBecause multielement detection capa-bility is probably the major reason why
most laboratories invest in ICP-MS, it isimportant to understand the impact ofmeasurement criteria on detection lim-its. We know that in a multielementanalysis, the quadrupole’s rf/dc ratio isscanned to mass regions or driven,which represent the elements of inter-est. The electronics are allowed to settle
Sweep 1
Number of ionscounted
Sweep 2
Sweep 3
1 60
1 60
1 60
Total
Total ofn
sweeps
1 60
MCA channel number
Figure 3 (above left). A profile of the peak is built up by continually sweeping the quadrupoleacross the mass spectrum.
5 6 7 8 9 10 11
Mass (amu)In
tens
ity (c
ps)
Figure 4 (above right). Multichannel ramp scanning approach using 20 channels per amu.
Table I. Precision of Pb isotope ratio measurement as a function of dwell time using a total integration time of 5.5 s.Dwelltime %RSD, %RSD,(ms) 207Pb/206Pb 208Pb/206Pb
2 0.40 0.365 0.38 0.3610 0.23 0.2225 0.24 0.2550 0.38 0.33100 0.41 0.38
5 6 7 8 9 10 11
Mass (amu)
Inte
nsity
(cps
)
Figure 5 (below right). Peak-hopping approach.
Tutorial


www.spectroscopyonl ine.com32 Spectroscopy 17(7) July 2002
Tutorial
and then dwell on the peak, or sit, andtake measurements for a fixed period oftime. This step is usually performed anumber of times until the total integra-tion time is fulfilled. For example, if adwell time of 50 ms is selected for allmasses and the total integration time is1 s, then the quadrupole will carry out20 complete sweeps per mass, per repli-cate. It will then repeat the same rou-tine for as many replicates that havebeen built into the method. Thisprocess is illustrated very simplisticallyin Figure 8, which shows the scanningprotocol of a multielement scan ofthree different masses.
In this example, the quadrupole isscanned to mass A. The electronics areallowed to settle (settling time) and leftto dwell for a fixed period of time atone or multiple points on the peak(dwell time); intensity measurementsare then taken (based on the dwelltime). The quadrupole is then scannedto masses B and C and the measure-ment protocol repeated. The completemultielement measurement cycle(sweep) is repeated as many times asneeded to make up the total integrationper peak. It should be emphasized thatthis example is a generalization of themeasurement routine — managementof peak integration by the software will vary slightly, based on different instrumentation.
It is clear from this information that,during a multielement analysis, a sig-
nificant amount of time is spent scan-ning and settling the quadrupole, whichdoesn’t contribute to the quality of theanalytical signal. Therefore, if the meas-urement routine is not optimized care-fully, it can have a negative impact ondata quality. The dwell time can usuallybe selected on an individual mass basis,but the scanning and settling times arenormally fixed because they are a func-tion of the quadrupole and detectorelectronics. For this reason, it is essen-tial that the dwell time — which ulti-mately affects detection limit and preci-sion — must dominate the totalmeasurement time, compared with thescanning and settling times. It follows,therefore, that the measurement dutycycle (percentage of actual measuringtime compared with total integrationtime) is maximized when the quadru-pole and detector electronics settlingtimes are kept to an absolute minimum.Figure 9 shows a plot of percentage ofmeasurement efficiency against dwelltime for four different quadrupole set-tling times — 0.2, 1.0, 3.0, and 5.0 msfor one replicate of a multielement scanof five masses, using one point perpeak. In this example, the total integra-tion time for each mass was 1 s, withthe number of sweeps varying, depend-ing on the dwell time used. For this ex-ercise, the percentage of measurementefficiency is defined by the followingcalculation:
So to achieve the highest measure-ment efficiency, the nonanalytical timemust be kept to an absolute minimum.This leads to more time being spentcounting ions and less time scanningand settling, which does not contributeto the quality of the analytical signal.This factor becomes critically impor-tant when a rapid transient peak isbeing quantified, because the availablemeasuring time is that much shorter(3). Generally speaking, peak quantita-tion using multiple points per peak andlong settling times should be avoided inICP-MS because it ultimately degradesthe quality of the data for a given inte-gration time.
Figure 9 also shows that shorter dwelltimes translate into a lower measure-ment efficiency. For this reason, it isprobably desirable, for normal quanti-tative analysis work, to carry out multi-ple sweeps with longer dwell times(typically 50 ms) to get the best detec-tion limits. So if an integration time of1 s is used for each element, this wouldtranslate into 20 sweeps of 50 ms dwelltime per mass. Although 1 s is longenough to achieve reasonably good de-tection limits, longer integration timesgenerally have to be used to reach the
Dwell Time � #Sweeps � #Elements � #Replicates � 100
Dwell Time � #Sweeps � #Elements � #Replicates �
Scanning / Settling Time � #Sweeps � #Elements � #Replicates
3.5
3.0
2.5
2.0
1.5
1.01 3 5 7 9 11 13 15 17 19
Number of points per peak
Ratio
of s
igna
l-to-
back
grou
nd n
oise
(� 1
05 )
Figure 6. Signal-to-background noise ratio degrades when more thanone point, spread over the same integration time, is used for peakquantitation.
4
3
2
1
0Be-9 Co-59 In-115 Tl-205 U-238
Element
Dete
ctio
n lim
it im
prov
emen
t
Figure 7. Detection limit improvement using 1 point/peak rather than 20points/peak over the mass range.

July 2002 17(7) Spectroscopy 33
Tutorial
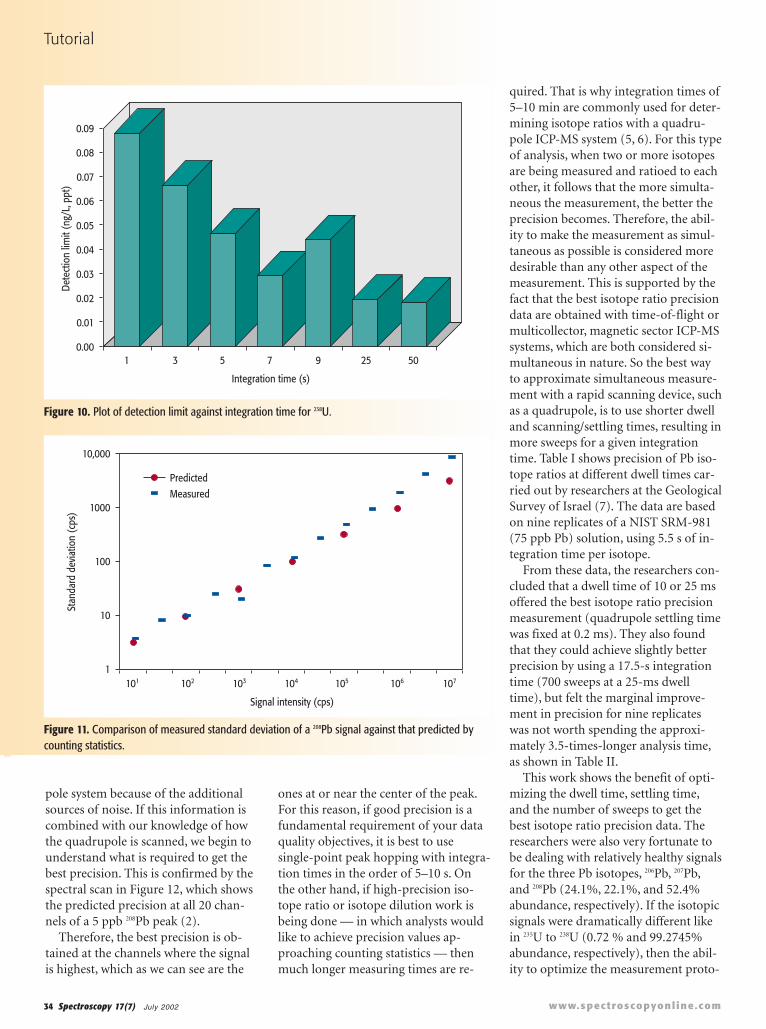
lowest possible detection limits. Figure10 shows detection limit improvementas a function of integration time for238U. As would be expected, there is afairly predictable improvement in thedetection limit as the integration time isincreased because more ions are beingcounted without an increase in thebackground noise. However, this onlyholds true up to the point where thepulse-counting detection system be-comes saturated and no more ions canbe counted. In the case of 238U, this oc-curs around 25 s, because there is noobvious improvement in detection limitat a higher integration time. So fromthese data, we can say that there appearsto be no real benefit in using an inte-gration time longer than 7 s. When de-ciding the length of the integrationtime in ICP-MS, you have to weigh thedetection limit improvement againstthe time taken to achieve that improve-ment. Is it worth spending 25 s measur-ing each mass to get a 0.02 ppt detec-tion limit if 0.03 ppt can be achievedusing a 7-s integration time? Alterna-tively, is it worth measuring for 7 swhen 1 s will only degrade the perform-ance by a factor of 3? It really dependson your data quality objectives.
For applications such as isotopedilution/ratio studies, high precision isalso a very important data quality ob-jective (4). However, to understandwhat is realistically achievable, we mustbe aware of the practical limitations ofmeasuring a signal and counting ions inICP-MS. Counting statistics tells us thatthe standard deviation of the ion signalis proportional to the square root of thesignal. It follows, therefore, that the rel-ative standard deviation (RSD), or pre-cision, should improve with an increasein the number (N) of ions counted asshown by the following equation:
In practice this holds up very well, asshown in Figure 11. In this plot of stan-dard deviation as a function of signalintensity for 208Pb, the dots represent thetheoretical relationship as predicted bycounting statistics. It can be seen thatthe measured standard deviation (bars)follows theory very well up to about100,000 cps. At that point, additionalsources of noise (for example, sample
%RSD � NN
� 100
introduction pulsations or plasma fluc-tuations) dominate the signal, whichleads to poorer standard deviation values.
So based on counting statistics, it islogical to assume that the more ionsthat are counted, the better the preci-sion will be. To put this in perspective,it means that at least 1 million ionsneed to be counted to achieve an RSDof 0.1%. In practice, of course, thesekinds of precision values are very diffi-cult to achieve with a scanning quadru-
Scanning/settling time
100
90
80
70
60
50
40100 90 80 70 60 50 40 30 20 10 5
0.2 ms1 ms3 ms5 ms
Dwell time (ms)
% M
easu
rem
ent e
fficie
ncy
Table II. Impact of integration time on the overall analysis time for Pb isotope ratios.Dwell time Number of Integration time %RSD, %RSD, Analysis time
(ms) sweeps (s)/mass 207Pb/206Pb 207Pb/206Pb for 9 reps25 220 5.5 0.24 0.25 2 min 29 s25 500 12.5 0.21 0.19 6 min 12 s25 700 17.5 0.20 0.17 8 min 29 s
Increasing mass
Settle, dwell,measure
Settle, dwell,measure
ScanScan
Mass A Mass B Mass C
Scan
Scan back to massA and repeat
Settle, dwell,measure
Figure 8 (left).Multielement scanning andmeasurement protocol of aquadrupole.
Figure 9 (below). Percentof measurement efficiencyas a function of dwell timewith varying scanning/settling times.
www.spectroscopyonl ine.com34 Spectroscopy 17(7) July 2002
Tutorial
pole system because of the additionalsources of noise. If this information iscombined with our knowledge of howthe quadrupole is scanned, we begin tounderstand what is required to get thebest precision. This is confirmed by thespectral scan in Figure 12, which showsthe predicted precision at all 20 chan-nels of a 5 ppb 208Pb peak (2).
Therefore, the best precision is ob-tained at the channels where the signalis highest, which as we can see are the
ones at or near the center of the peak.For this reason, if good precision is afundamental requirement of your dataquality objectives, it is best to usesingle-point peak hopping with integra-tion times in the order of 5–10 s. Onthe other hand, if high-precision iso-tope ratio or isotope dilution work isbeing done — in which analysts wouldlike to achieve precision values ap-proaching counting statistics — thenmuch longer measuring times are re-
quired. That is why integration times of5–10 min are commonly used for deter-mining isotope ratios with a quadru-pole ICP-MS system (5, 6). For this typeof analysis, when two or more isotopesare being measured and ratioed to eachother, it follows that the more simulta-neous the measurement, the better theprecision becomes. Therefore, the abil-ity to make the measurement as simul-taneous as possible is considered moredesirable than any other aspect of themeasurement. This is supported by thefact that the best isotope ratio precisiondata are obtained with time-of-flight ormulticollector, magnetic sector ICP-MSsystems, which are both considered si-multaneous in nature. So the best wayto approximate simultaneous measure-ment with a rapid scanning device, suchas a quadrupole, is to use shorter dwelland scanning/settling times, resulting inmore sweeps for a given integrationtime. Table I shows precision of Pb iso-tope ratios at different dwell times car-ried out by researchers at the GeologicalSurvey of Israel (7). The data are basedon nine replicates of a NIST SRM-981(75 ppb Pb) solution, using 5.5 s of in-tegration time per isotope.
From these data, the researchers con-cluded that a dwell time of 10 or 25 msoffered the best isotope ratio precisionmeasurement (quadrupole settling timewas fixed at 0.2 ms). They also foundthat they could achieve slightly betterprecision by using a 17.5-s integrationtime (700 sweeps at a 25-ms dwelltime), but felt the marginal improve-ment in precision for nine replicateswas not worth spending the approxi-mately 3.5-times-longer analysis time,as shown in Table II.
This work shows the benefit of opti-mizing the dwell time, settling time,and the number of sweeps to get thebest isotope ratio precision data. Theresearchers were also very fortunate tobe dealing with relatively healthy signalsfor the three Pb isotopes, 206Pb, 207Pb,and 208Pb (24.1%, 22.1%, and 52.4%abundance, respectively). If the isotopicsignals were dramatically different likein 235U to 238U (0.72 % and 99.2745%abundance, respectively), then the abil-ity to optimize the measurement proto-
0.09
0.08
0.07
0.06
0.05
0.04
0.03
0.02
0.01
0.001 3 5 7 9 25 50
Integration time (s)
Dete
ctio
n lim
it (n
g/L,
ppt)
Figure 10. Plot of detection limit against integration time for 238U.
Figure 11. Comparison of measured standard deviation of a 208Pb signal against that predicted bycounting statistics.
10,000
1000
100
10
1101 102 103 104 105 106 107
Signal intensity (cps)
Stan
dard
dev
iatio
n (c
ps)
PredictedMeasured

July 2002 17(7) Spectroscopy 35
Conference Preview
col for individual isotopes becomes ofeven greater importance to guaranteeprecise data.
It is clear that the analytical demandsput on ICP-MS are probably higherthan any other trace element techniquebecause it is continually being asked tosolve a wide variety of applicationproblems. However, by optimizing themeasurement protocol to fit the analyt-ical requirement, ICP-MS has shownthat it has the capability to carry outrapid trace element analysis, with su-perb detection limits and good preci-sion on both continuous and transientsignals, and still meet the most strin-gent data quality objectives.
References1. R. Thomas, Spectroscopy 16(10),
44–48 (2001).2. E.R. Denoyer, At. Spectroscopy 13(3),
93–98 (1992).3. E.R. Denoyer and Q.H. Lu, At. Spec-
troscopy 14(6), 162–169 (1993).4. T. Catterick, H. Handley, and S. Merson,
At. Spectroscopy 16(10), 229–234(1995).
5. T.A. Hinners, E.M. Heithmar, T.M. Spit-tler, and J.M. Henshaw, Anal. Chem. 59,2658–2662 (1987).
6. M. Janghorbani, B.T.G. Ting, and N.E.Lynch, Microchemica Acta 3, 315–328,(1989).
7. L. Halicz, Y. Erel, and A. Veron, At. Spec-troscopy 17(5), 186–189 (1996). �
applications and provides everythingnecessary for a typical x-ray detector,incorporating one DXP spectrometerchannel, preamplifier power, and detec-tor HV bias in one compact chassis. Itsinput is compatible with a wide rangeof common detectors, including pulsedoptical reset, transistor reset, and RCfeedback preamplifiers. The Saturn of-fers complete computer control over allamplifier and spectrometer functionsincluding gain, filter peaking time, andpileup inspection criteria. Its DXP digi-tal filters significantly increase through-put compared to typical analog systems.
The new X-Beam x-ray source fromX-Ray Optical Systems (Albany, NY)delivers an intense, micrometer-sizedfocal spot. Designed for OEM use inmicro-XRF instruments, the compactunit uses polycapillary focusing optics
Figure 12. Comparison of % RSD with signalintensity across the mass profile of a 208Pb peak.
and 50 W of power to generate an ex-tremely high flux-density gain, the com-pany reports. Increased spatial resolutionand beam stability are also promised. Anintegrated cooling system eliminates theneed for a separate cooling unit.
Attendees can see many of theseproducts, along with others not men-tioned, at the 2002 Denver X-ray Con-ference — sponsored by the Interna-tional Centre for Diffraction Data — atAntlers Adam’s Mark Hotel (formerlyAntlers Doubletree Hotel), ColoradoSprings, Colorado, July 29–August 2,2002. For more information, contactDenise Flaherty, DXC Conference Co-ordinator, 12 Campus Boulevard, New-town Square, PA 19073-3273, (610)325-9814, fax: (610) 325-9823,e-mail: [email protected], web site:www.dxcicdd.com. �
Circle 25
“Conference Preview” continued frompage 271.8
1.6
1.4
1.2
1.0
0.8
0.6
0.4
0.2
0
7
6
5
4
3
2
1
0
207.5
207.6
207.7
207.8
207.9 20
820
8.1
208.
220
8.3
208.
420
8.5
Mass (m/z)
Sens
itivit
y (c
ps �
105 )
Pred
icted
pre
cisio
n fro
m c
ount
ing
cps%RSD