our missoula development guide
TRANSCRIPT

Our Missoula
Development
Guide
Looking Forward2018 - 2028

1 Contents & Summary Observations2 Residential Growth & Development3 Looking Forward4 Capability5 Capacity (Gross)6 Capacity (Net)7 Suitability (Infrastructure)8 Suitability (Necessities)9 Suitability (Transportation)10 Suitability (Open Space)11 Suitability (Composite)12 Opportunity13 Entitlements14 Net Capacity by Region15 Capacity Analysis16 Strategies
The population of Missoula has been growing at a rate of 1–2% over the past ten years which is reflected in the annual average of over 600 permitted residential dwelling units filed with the City according to the 2016 - 2017 UFDA Yearbook & 10-Year Review. This “Our Missoula Development Guide: Looking Forward” report continues UFDA’s legacy providing a new Development Model intended to replace the previous Residential Allocation Map to more definitively identify locations within the study area that have capacity for quality living opportunities. Some key results of this analysis follow:
• There is enough capacity in the Urban Services Area for the 6,500 new dwelling units expected over the next ten years.
• The new Suitability Composite map helps to identify locations that support Focus Inward; over 1/2 of the capacity is at least “Fairly Suitable.”
• An expected 216 units per year will develop on Entitled Lots, while 434 units annually should be directed into more suitable areas.
• About 25% of entitled lots and unbuilt major TED lots are located in areas considered “Fairly Suitable” or “Suitable.”
• There are over 2,000 vacant lots (not entitled) located in areas considered “Fairly Suitable” or better.
• The majority of capacity is carried in B and C zoning districts (see Capacity Analysis on page 15).
• Better utilizing densities as allowed by land use could add an additional 5,000 units to what is allowed by current zoning.
Contents Summary Observations
Cover photo of dense redevelopment downtown by Garin Wally. Photo above by Tom Zavitz.1

*Based on the region’s average household size and vacancy.
92700
95084
97468
99852
102236
104620
850
795
533
516
546
2017
2016
2015
2014
2013
Total New Units by Year
(Annual Average: 648)
0
1
3
3
8
10
27
32
33
50
61
126
141
153
Grant CreekBonner - W. Riverside
UniversityWye
South HillsRattlesnake
Target Range - Orchard HomesMiller Creek
East MissoulaWest Mullan
Brooks CorridorReserve to Russell Corridor
CentralEast Mullan
Average New Units per Year by Region
Residential Growth & Development
Where could 6,500 new residential dwelling units be built?
The number of residential dwelling units is increasing by about 650 per year and housing costs are on a steady increase. To address these challenges and maintain the community’s unique character and standard of living, city residents created the Our Missoula City Growth Policy 2035 in 2015. The policy promotes efficient and sustainable land development by focusing development inward to both optimize prior infrastructure investments and create walkable neighborhoods with access to transit and community amenities and services.
This “Our Missoula Development Guide: Looking Forward” report provides guidance to the public and decision-makers for the implementation of the goals, policies, and objectives in the Our Missoula Growth Policy through the use of a new Development Model.
The model joins Growth Policy recommendations with recent development data to help identify quality places that provide opportunities for creating a supply of land that meets the 650 residential-unit-per-year projected demand. The methodology is illustrated through mapping Capability, Capacity, and Suitability in this Looking Forward report.
This document marks the beginning of a new era, one that better identifies where residential development should be developed. Locating development within a context of services and infrastructure is at the heart
of the Growth Policy’s “Focus Inward” approach. The following contents, including a suite of
development suitability maps provide policy makers and developers alike an overview
of Missoula’s development potential.
For each new dwelling unit constructed, about 1.8 people* are added to the OMDG area’s population. This means that about
12,000 people will join our community in the next ten years. The City estimates
its share will constitute 1,105 people per year, with 65 more just outside the city.
An Inward Focus
Population Increase
OMDG Development Model Source: Seattle 2035 Development Capacity Report 2014.
GrowthPolicy
Housing OMDGUrban
Planning
Transportation& Infrastructure
2

BrooksCorridor
Bonner - W.Riverside
University
SouthHills
MillerCreek
Central
Reserve toRussell
Corridor
TargetRange -OrchardHomes
East Missoula
Rattlesnake
GrantCreek
EastMullan
WestMullan
Wye
RE
SE
RV
E
SPURGIN
39TH
FRONT
HIG
GIN
S
EXPRESSW
AY
5TH
SOUTH
6TH
5TH
LOLO
55TH
OR
AN
GE
AIR
WAY
PALMER
HIGHPARK
CU
RT
IS
LOW
ER
MILLER CR
EEK
GR
AN
TC
RE
EK
PAT
TE
E
CANYON
39TH
RAILROAD
VAN B
UREN
RIVER
MOUNT
GR
EE
NO
UG
HSCO
TT
RA
TT
LE
SNA
KE
AR
TH
UR
BROADWAY
RU
SSE
LL
CL
EM
EN
TS
JOH
NS
ON
WH
ITA
KE
R
MULLAN
GR
AN
TC
REEK
BROOKS
HIGHWAY 10
HIGHWAY200
LIND
A
VISTA
GR
AN
TC
RE
EK
MA
RY
JAN
EG
HA
RR
ET
T
OLD
HIGHWAY
93
23R
D
BA
NC
RO
FT
SPEEDWAY
HIG
HW
AY
93
HILLVIE
W
UP
PE
RM
ILL
ER
CR
EE
K
I
This document analyzes potential future residential development opportunities using three concepts:
1) Capability - where development can occur. There are areas where development is not possible. For instance, by identifying non-developable lands such as floodplains and steep hillsides, we can locate and measure areas that are appropriate for development.
2) Capacity - how much development can occur. Based on current development and maximum residential unit capacity allowed by zoning, we can determine the potential for residential development in the planning area. When Capacity and Capability are combined, they provide a theoretical maximum unit capacity called “buildout.” Since the area is unlikely to see the maximum level of development, capacity is filtered using a sample of properties to estimate the amount and location of land that might develop in the future. This “Net Capacity” is explained on page 6.
3) Suitability - where development should occur. Here we use guidance from the city’s growth policy to locate and map areas that reduce dependency on both infrastructure costs, automobile use, and that have better access to basic services such as grocery stores and transit.
When these three concepts are combined spatially, the result is a tiered “Opportunities” map of suitable capacity for preferred development locations. This map will help guide development to locations supportive of “Focus Inward” and will assist Missoula in making informed decisions regarding future residential development.
Looking Forward
OpportunitiesCapability Capacity Suitability
OMDGRegions
3

I
UFDA Regions
Floodplain/Wetland
Slope
Capability
Capable
Not Capable
Capability
Where development can / can’t occur.
Physical constraints such as hillsides with a slope of 25% or more, riparian areas, conservation easements, and floodplain zones are not areas where residential development can occur.
Social constraints, such as government owned land, utility properties, and golf courses, may redevelop someday, but are not considered as having development potential within this time-frame. These social constraints were determined using the following rules:
• Where land use designations do not allow residential uses• Parcels that are publicly owned• Parcels owned by railroad companies• Parcels listed on the National Historic Register• Parcels split into individually-owned condos• Parcels that have a structure 20 years old or younger; or one that had a major renovation within the past five years• An existing structure has more units than allowed by zoning• An existing structure or use is one of the following types:
Parcels that meet any of these qualifications are not considered developable (shown in brown at left) leaving the remaining areas (no color) capable.
retirement, nursing, group, or rooming homes; dorms, fraternity/sorority houses, golf courses, parks, churches, hospitals, cemeteries, mortuaries, schools, post offices, utilities, gravel pits, or mining operations.
Capability & Constraints
4

I
UFDA Regions
Gross Capacity
Units Remaining (Highest Zoning)
1
2 - 25
26+
Wye
Grant Creek
Rattlesnake
Bonner - W. Riverside
East Mullan
West Mullan
EastMissoula
BrooksCorridor
Central
Uni
vers
ity
South Hills
MillerCreek
Target Range - Orchard
Homes
Reserve to
Russell Corridor
Region Buildout
Bonner - W. Riverside 584
Brooks Corridor 21,153
Central 15,446
East Missoula 1,190
East Mullan 9,588
Grant Creek 3,503
Miller Creek 3,073
Rattlesnake 1,588
Reserve to Russell Corridor 31,260
South Hills 9,603
Target Range - Orchard Homes 2,527
University 407
West Mullan 2,748
Wye 1,667
Total 103,937
Table: Estimated Buildout by Region
Capacity (Gross)How much development can occur.
It is not expected that every under-developed parcel will redevelop to maximize the number of dwelling units allowed by zoning. However, knowing where and by how much parcels are underutilized by is helpful in judging potential capacity for infill and residential growth.
The map at left identifies parcels with remaining capacity allowed by highest density zoning as recommended by land use. The table below shows this theoretical maximum by region. This estimate of gross capacity, known also as “buildout,” does not consider structure placement, landscaping, parking, or setbacks. Entitled lots have been removed from the map and are addressed later.
We define under-developed or underutilized parcels as those that have less than the maximum number of dwelling units by highest allowed zoning.
For example, two units exist on a 24,000 sq. ft. parcel with RT5.4 zoning. Because four are allowed and only two exist, it is under-developed by two units (half built-out).
Note that commercial zoning allows residential uses and is included.
Gross Capacity/Buildout
*Entitled Lots not shown5

I
UFDA Regions
Net Capacity
Units Remaining (Highest Zone)
1
2 - 25
26+
Wye
Grant Creek
Rattlesnake
Bonner - W. Riverside
East Mullan
West Mullan
EastMissoula
BrooksCorridor
CentralU
nive
rsit
y
South Hills
MillerCreek
Target Range - Orchard
Homes
Reserve to
Russell Corridor
Region Est. Net
Bonner - W. Riverside 339
Brooks Corridor 9,071
Central 4,700
East Missoula 532
East Mullan 5,948
Grant Creek 827
Miller Creek 2,712
Rattlesnake 681
Reserve to Russell Corridor 12,295
South Hills 6,104
Target Range - Orchard Homes 1,591
University 159
West Mullan 2,106
Wye 1,472
Total 48,537
Table: Estimated Net Capacity by Region
Capacity (Net)How much development can be expected.
The map at left differs from the previous map in that it reduces the sample of parcels. This was done by employing a common method used to estimate development potential that compares the value of existing structures on land to the value of the land (using Montana Department of Revenue data). We use this Improvement to Land Ratio (ILR) to identify parcels where the structure value is less than the value of the land. Properties with an ILR between zero and one are considered as sites that might best attract development. To further filter this estimate, we only use parcels at or less than 2/3 capacity. This establishes a cutoff for redevelopment that, for example, assumes a parcel with two existing units where three are allowed is redevelopable, while a parcel with four units where five are allowed is not. Applying this technique reduces the gross capacity (103,937) to a net capacity we hope is closer to realistic potential.
The table below shows remaining capacity (by highest allowed density) by region. Note that commercial zoning and large parcels contribute greatly to the higher capacity regions such as the Reserve to Russell and Brooks corridors. Meanwhile, the lack of large parcels or commercial zones hinders the capacities of regions such as the University and Bonner - W. Riverside. While there is a short supply of large parcels in the Central region, the high-density zoning facilitates the region’s high capacity. Although this model considers commercial zoning as a source for residential capacity, there is a greater probability that it will develop into commercial uses.
Net Capacity/Developable
Lands
*Entitled Lots not shown6

I
UFDA Regions
Suitability Hexagons
Sewer & Water
None
Water
Sewer
Both
Developmentshould occur
“...where infrastructure can support it.”Growth Policy Action Item #10.16
This is the first in a suite of maps that attempts to locate goals and action items of the Growth Policy that relate to a “Focus Inward” development pattern. A grid ten-acre hexagons was created to cover the Growth Policy boundary and is used to show where suitable features exist. When combined, these maps produce the composite map found on page 11.
The map at left shows areas that are within 500 feet of public sewer and/or water mains. This is considered a reasonable distance for making new connections where they do not already exist. Prioritizing development where sewer and water infrastructure already exists or has extended to help address water quality concerns could help keep construction and housing costs down while limiting the distance between new residential developments and the City.
The Growth Policy specifically encourages new development in these areas in Action Item 10.16: “Adopt development standards that encourage new development to locate where infrastructure can support it and discourages ‘greenfield’ development.”
Because this feature extends from East Missoula to Kona Road, and Miller Creek out to the Wye, sewer and water infrastructure has the largest coverage of the maps to follow. Areas within the City that appear to lack these features can be found in areas such as the Fairgrounds and around Fort Missoula.
Sewer/Water Suitability
7

I
UFDA Regions
Suitability Hexagons
Commercial Services & Grocery
None
Commercial Services
Grocery
Both
“...within walking distance to grocery stores and other basic necessities.”
Growth Policy Action Item #5.2
The map at left shows hexagons that are within a quarter-mile of commercial services and/or grocery stores. Grocery stores that carry a variety of goods and that are open to a range of customers were used. These stores all participate in the SNAP program and are not mini-marts or specialty item stores. The City of Missoula’s commercial B and C zones, and the downtown area contain a wide mix of uses assumed to contain various commercial services and serve diverse needs. The Rattlesnake Gardens Neighborhood Overlay zoning district is presumed to provide similar services in an otherwise primarily residential region. With the exception of the small grocery in the Target Range - Orchard Homes region, the pattern of these features primarily hugs the core.
Developing near services is called for in Growth Policy Action Item 5.2: “Incentivize mixed use development so that residences are within walking distance to grocery stores and other basic necessities.” The Growth Policy’s Livability chapter also encourages this through Goal L5: “Neighborhoods should have easy accessibility to amenities and local services to meet the needs of an expanding diverse population.”
Developmentshould occurServices
Suitability
8

I
UFDA Regions
Suitability HexagonsTransit & Trail
None
Transit
Trail
Both
“...near transit/biking/walking routes”Growth Policy Action Item #10.19
“...that can utilize non-motorized and public transportation facilities.”
Growth Policy Action Item #5.3
The map at left shows current transit stops and the Commuter Trail Network. The Growth Policy encourages development close to transportation options to help create less auto-dependent, affordable, and walkable neighborhoods that are less reliant on expensive street and road infrastructure and that support healthy lifestyles.
This map recognizes a strong commuter “spine” that joins East Missoula through downtown to the Brooks Corridor, while the gaps in this map could help identify potential for additional transit stops or improved trail connectivity.
The Growth Policy Action Items 10.19 and 5.3 state that the community should “Locate higher-density housing near transit/biking/walking routes” and “Incentivize development that is close to existing infrastructure and that can utilize non-motorized and public transportation facilities.” In addition, the Housing chapter’s Goal H3 advocates that development patterns “increase the proportion of residents who have access to a multi-modal transportation network that provides accessibility for pedestrians, bicycles, transit as well as vehicles.”
Developmentshould occurTransit/Bike
Suitability
9
I
UFDA Regions
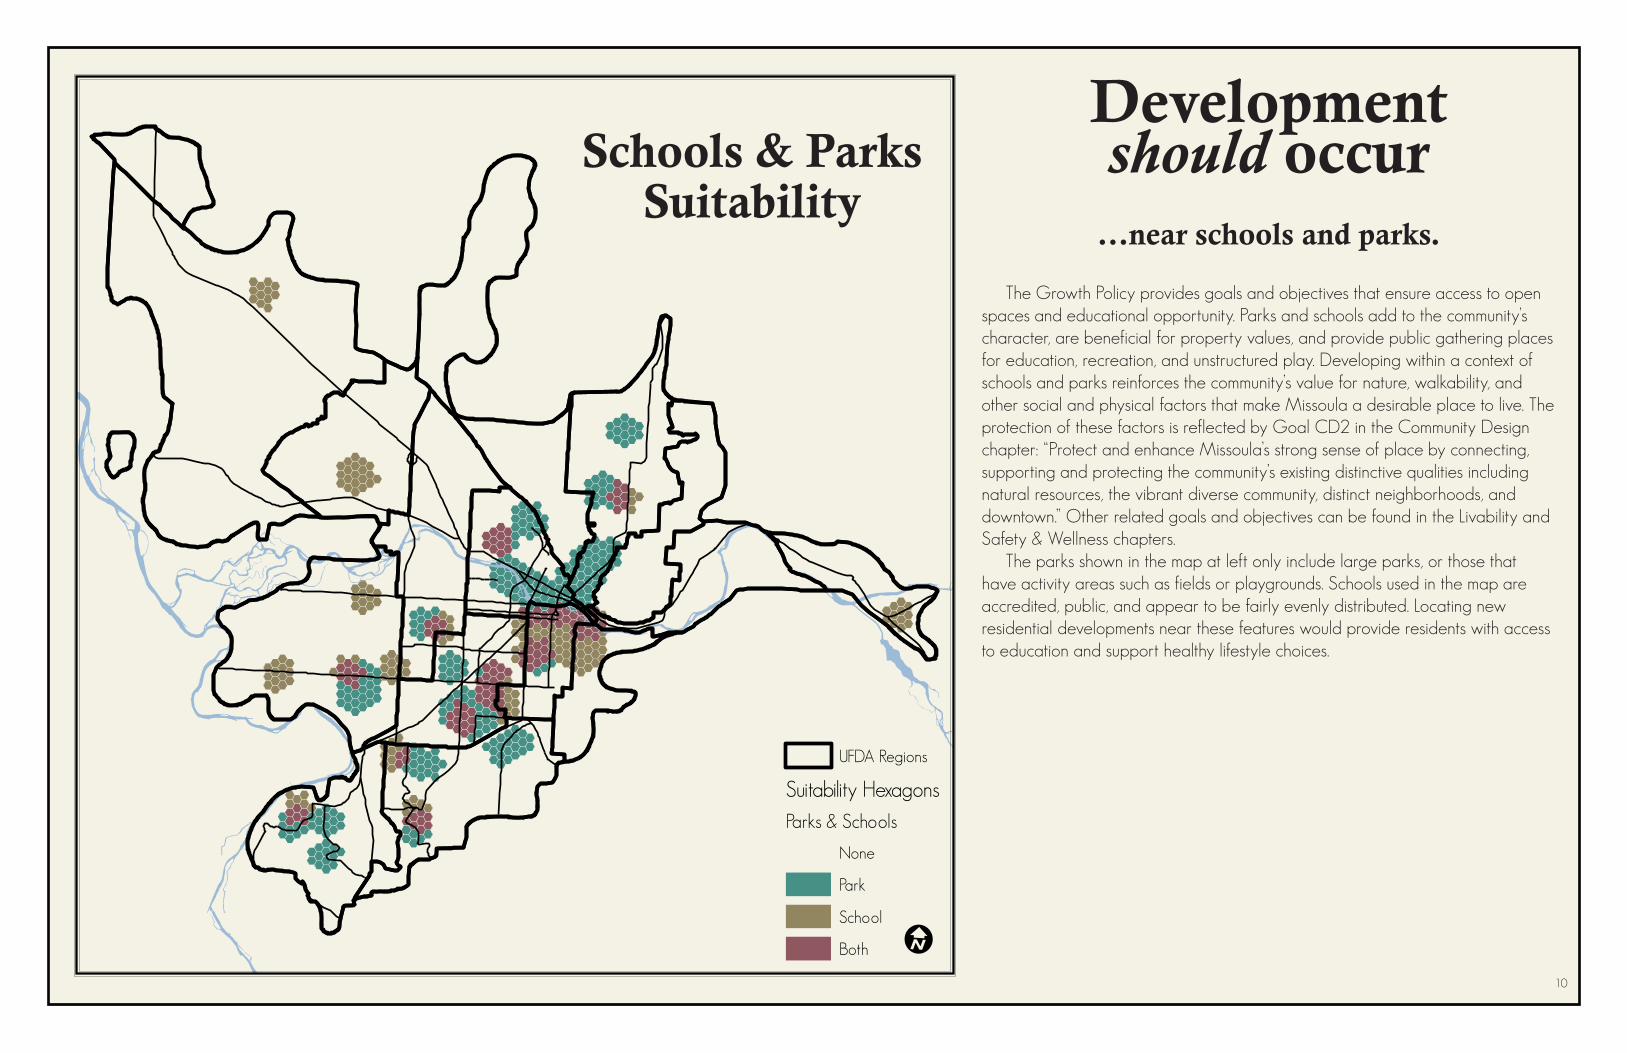
Suitability HexagonsParks & Schools
None
Park
School
Both
...near schools and parks.
The Growth Policy provides goals and objectives that ensure access to open spaces and educational opportunity. Parks and schools add to the community’s character, are beneficial for property values, and provide public gathering places for education, recreation, and unstructured play. Developing within a context of schools and parks reinforces the community’s value for nature, walkability, and other social and physical factors that make Missoula a desirable place to live. The protection of these factors is reflected by Goal CD2 in the Community Design chapter: “Protect and enhance Missoula’s strong sense of place by connecting, supporting and protecting the community’s existing distinctive qualities including natural resources, the vibrant diverse community, distinct neighborhoods, and downtown.” Other related goals and objectives can be found in the Livability and Safety & Wellness chapters.
The parks shown in the map at left only include large parks, or those that have activity areas such as fields or playgrounds. Schools used in the map are accredited, public, and appear to be fairly evenly distributed. Locating new residential developments near these features would provide residents with access to education and support healthy lifestyle choices.
Developmentshould occurSchools & Parks
Suitability
10

I
UFDA Regions
Suitability Hexagons
Suitability Tier
0
1
2
3
4
Where development should occur.
When the previously listed desirable features are layered together, this composite map is the result. Any suitability above zero is within 500 feet of both sewer and water.
Tier 1: “Minimally Suitable” hexagons are within 500 feet of public sewer and water. Infrastructure costs can be a burden on development, so developing where infrastructure already exists helps lower construction overhead and should translate to improved affordability. This tier is primarily found along the fringe.
Tier 2: “Fairly Suitable” hexagons are within a quarter mile distance of any two of the following suitable features: commercial service areas, grocery stores, transit stops, commuter trail, parks, or schools. This generally runs along the edge of the core.
Tier 3: “Suitable” hexagons have a similar criteria to Tier 2, but require that three or more features are within a quarter mile.
Tier 4: “Very Suitable” hexagons are within walking distance of a commercial service area, a grocery store, a commuter trail, and a transit stop. This strict criteria shows the top tier of suitability inside the core.
Tier 0: “Future Potential” hexagons have future suitability in either Tier 2 or 3 once they receive sewer, water, or both. A large area of Tier 0 can be found near the Fort Missoula regional park where added sewer and services would increase to Tier 3.
Any land outside of these five tiers is currently considered Unsuitable for residential development. However, suitability is dynamic. Land that is currently considered Unsuitable could soon be at Tier 2 with infrastructure improvements and expanded transit coverage for example. This makes “Focus Inward” a flexible and adaptive concept that opens opportunities for place-making along the fringe.
The Suitability concept is intended to reflect the ideals that guided the Our Missoula 2035 City Growth Policy and recommended land uses: to radiate density from the core, and to organize around pedestrian-friendly community services, gathering places, and transportation systems. Unsurprisingly, the Suitability Hexagons generally radiate outward in decreasing tiers as they move from the highly suitable downtown/core toward the fringe.
SuitabilityComposite Suitability
11

IUFDA Regions
Opportunity
51+
3 - 1516 - 50
1 - 2
UnitsTier 1 Tier 2 Tier 3 Tier 4
Grant Creek
Rattlesnake
East Mullan
West Mullan
EastMissoula
BrooksCorridor
Central
Uni
vers
ity
South Hills
MillerCreek
Target Range - Orchard
Homes
Reserve to
Russell Corridor
RegionSuitable Capacity
Unsuitable Capacity
Tiers 1-4 Tier 0 & Unsuitable
Bonner - W. Riverside 0 339
Brooks Corridor 8,715 356
Central 4,549 151
East Missoula 284 248
East Mullan 5,355 593
Grant Creek 476 351
Miller Creek 178 2,534
Rattlesnake 498 183
Reserve to Russell Corridor 11,379 916
South Hills 533 5,571
Target Range - Orchard Homes 823 768
University 159 0
West Mullan 183 1,923
Wye 0 1,472
Net Capacity33,132 15,405
48,537
Table: Suitable Capacity by Region
Capability, Capacity, & Suitability Combined.
Opportunity
When joined together, the concepts of Capability, Capacity, and Suitability produce the composite map at left. Suitable net capacity for capable parcels is shown as graduated circles colored by suitability tier. This map begins to show how the city might prioritize “Focus Inward” development. It was designed to replace the Allocation map used in previous UFDA reports, and guide development toward the most opportune areas.
The table below breaks down the study area’s estimated Suitable and Unsuitable net capacity (48,537) by region (see page 14 for details). Note that only Suitable Capacity (33,132 units) is shown in the map while Unsuitable Capacity (15,405 units) is not. Also note that the majority of the capacities of Bonner - W. Riverside, Miller Creek, South Hills, West Mullan, and the Wye are Unsuitable, whereas the capacities of Brooks Corridor, Central, East Mullan, and Reserve to Russell Corridor are primarily Suitable.
Opportunity
12

MinglewoodTownhomes(2)
TanjaHeights(7)
Scott StreetVillage (11)
HellgateGardens
(15) Koly CourtTownhomes(22)
Valley ViewTerrace (32)
7
18
20070
128
71
32
20
UFDA Regions
0 - 81
82 - 210
211 - 440
441 - 758
Filed Subdivisionswith Ent. Lots
Remaining (major) TED units
10
100
Unfiled Subdivisionswith Ent. Lots
I Tier 1 Tier 2 Tier 3 Tier 4
Not Suitable
Wye
Grant Creek
Rattlesnake
Bonner - W. Riverside
East Mullan
West Mullan
EastMissoula
BrooksCorridor
CentralU
nive
rsit
y
South Hills
MillerCreek
Target Range - Orchard
Homes
Reserve to Russell Corridor
SuitabilityEntitled Lots
& TEDs% Needed of
6,500 DU
1 - Minimally Suitable 2,340 36%
2 - Fairly Suitable 363 6%
3 - Suitable 492 8%
4 - Very Suitable 0 0%
Total 3,195 49%
Table: Suitable Capacity of Entitled Lots & TEDs
Through the subdivision process, developers are given entitlements to develop a certain number of new residential lots or units in the area of land to be subdivided. These anticipated future units (shown in the map at left) comprise a reserve that is tracked annually known as Entitled Lots. At the end of 2017 this reserve consisted of 4,241 lots; about 200 are built annually. The number of existing entitled lots varies from year to year as existing lots are developed or expire, or as new ones are approved as new major residential subdivisions. Not surprisingly, most entitled lots exist on the outskirts of the City boundary and fall into Suitability Tier 1 and less. Various factors contribute to the modest annual rate of build-out, including developers’ concerns about matching supply to demand, changing market conditions such as increasing interest rates for borrowers, and buyers’ mutable preferences regarding location and building form.
As the 2016 - 2017 UFDA Yearbook and 10-Year Review states, one-third of annual development consistently occurs on entitled lots and if current trends continue, an average of 216 units will be built on entitled lots annually. At this rate, it will take 18 years for the remaining 4,241 entitled lots to develop. However, the entitled lot reserve is generally decreasing over time. This is partly due to the new Townhome Exemption Development (TED) laws becoming the preferred method of developing single-dwelling projects. When the remaining 89 units in major TEDs are added, the reserve is 4,330.
The map at left shows filed subdivisions with squares, subdivisions with no phases filed yet as circles, and remaining units of major TEDs as stars. The three symbols are colored with the respective Suitability Tier they fall under.
EntitlementsEntitled Lots
Note that the remaining 1,135 lots are in Unsuitable tiers.
13

Region
Tier 4 Tier 3 Tier 2 Tier 1 Suitable Capacity (Subtotal)
Tier 0Not Suitable Total
CapacityVery Suitable Suitable Fairly Suitable Minimally Suitable Future Potential
Current Potential Zoning Current Potential Zoning Current Potential Zoning Current Potential Zoning Current Potential Zoning Current Potential Zoning
Bonner - W. Riverside 0 0 0 0 0 0 0 0 0 0 0 339 0 339
Brooks Corridor 1,699 0 5,213 290 1,371 46 92 4 8,715 356 0 0 0 17,786
Central 2,114 32 1,564 156 413 16 254 0 4,549 139 12 0 0 9,249
East Missoula 0 0 0 0 25 0 259 0 284 3 0 199 46 816
East Mullan 0 0 700 0 1,766 341 2,256 292 5,355 43 0 550 0 11,303
Grant Creek 0 0 0 0 0 0 476 0 476 0 0 351 0 1,303
Miller Creek 5 3 0 0 1 1 119 49 178 98 83 1,277 1,076 2,890
Rattlesnake 18 0 28 9 130 83 153 77 498 21 9 130 23 1,179
Reserve to Russell Corridor 288 19 2,008 893 4,056 1,247 1,456 1,412 11,379 807 28 81 0 23,674
South Hills 0 0 90 5 156 7 259 16 533 69 59 5,338 105 6,637
Target Range - Orchard Homes 0 0 225 27 439 21 86 25 823 382 16 370 0 2,414
University 68 7 25 0 48 0 11 0 159 0 0 0 0 318
West Mullan 0 0 0 0 170 0 13 0 183 0 0 1,908 15 2,289
Wye 0 0 0 0 0 0 0 0 0 0 0 1,472 0 1,472
Net Capacity4,192 61 9,853 1,380 8,575 1,762 5,434 1,875
33,1321,918 207 12,015 1,265
48,5374,253 11,233 10,337 7,309 2,125 13,280
Table: Net Capacity by Region
Net Capacity by Region
The table above shows how much net capacity exists in each region by Suitability Tier by current zoning and the maximum zone allowed by land use. It is not surprising that commercial areas can absorb more dense residential developments than other areas. Note the high capacities in the Reserve to Russell and Brooks corridors. We find it somewhat surprising that there is suitable capacity for 11,379 units in the Reserve to Russell Corridor, and that over 3,500 of those units are not possible without better utilizing currently allowed densities. That area alone could nearly accommodate 150% of the anticipated units over the next ten years.
The Brooks Corridor contains suitable capacity for over 8,700 units. The hotspot of Very Suitable area at the south end of Brooks reflects the area’s access to transit, trail, commercial services, and large grocery store. The large commercial parcels in the area could someday become residential developments that may potentially provide over a decade-worth of housing demand.
Areas of Tier 0 suitability provide opportunity where infrastructure planning could make over 2,000 potential units at least Fairly Suitable. Similarly, improving the suitability of regions at the fringe such as the Bonner - W. Riverside, Miller Creek, South Hills, West Mullan, and Wye regions, where over 90% of capacity is unsuitable, would require place-making and master planning efforts to support the development of commercial services, transit, infrastructure, and other suitability-supporting features. Place-making efforts could someday guide development to areas of the fringe that are not considered suitable today.
The range of Suitable Capacity (Tiers 1-4) for between 28,054 and 33,132 units (excluding and including the increase of units allowed by land use) provides enough opportunity for the Missoula area to develop the anticipated units for the next ten years and beyond in a development pattern guided by “Focus Inward.”
14

SuitabilityBuildout
(Current Zoning)% Needed of
6,500 DUBuildout
(Max Potential)% Needed of
6,500 DUNet Capacity
(Current Zoning)% Needed of
6,500 DUNet Capacity
(Max Potential)% Needed of
6,500 DUVacant Capacity (Current Zoning)
% Needed of 6,500 DU
Vacant Capacity (Max Potential)
% Needed of 6,500 DU
1 - Minimally Suitable 11,405 175% 16,576 255% 5,434 84% 7,309 112% 2,059 32% 3,343 51%
2 - Fairly Suitable 15,659 241% 22,732 350% 8,575 132% 10,337 159% 720 11% 1,555 24%
3 - Suitable 28,700 442% 34,607 532% 9,853 152% 11,233 173% 1,204 19% 1,417 22%
4 - Very Suitable 8,450 130% 9,062 139% 4,192 64% 4,253 65% 283 4% 293 5%
Total 64,214 988% 82,977 1277% 28,054 432% 33,132 510% 4,266 66% 6,608 102%
Zone Tier 4 Tier 3 Tier 2 Tier 1 Total
B, C 2,459 6,716 2,925 1,389 13,489
CBD-4 434 175 0 0 609
M1R 841 560 1,108 1,584 4,093
Low Res (20, 40, 80, 215) 0 10 7 57 74
Med Res (5.4, 8) 3 62 103 168 336
RM 208 1,695 3,729 1,322 6,954
RT 38 160 288 378 864
Unzoned 0 3 21 139 163
Other 209 472 394 397 1,472
Total (Net Capacity) 4,192 9,853 8,575 5,434 28,054
Table: Suitable Capacity Analysis
Table: Capacity by Current ZoningThe above table shows Suitable Capacity in relation to the 6,500 new units expected to develop over the next ten years. Capacity by current zoning and by the highest possible zoning allowed by the Growth Policy’s recommended land uses (“Max Potential”) are compared. The first pair of columns compares the buildout (gross capacity) allowed by current zoning to expected development, while the second pair of columns compares the maximized buildout potential to expected development.
Similarly, the following columns compare Net Capacity. Notice that there is still sufficient Suitable Capacity in the more conservative “Current Zoning” scenario to support ten years of anticipated development in Suitable areas alone.
Finally, capacities for vacant lands are compared. This number is a subset of the Net Capacity. Vacant parcels in suitable areas under current zoning alone have capacity for two-thirds of expected development.
The table at right shows the Net Capacity by current zoning designations. On average, annual development is composed of 60% multi-dwelling units and 40% single dwellings and duplexes. If these trends continue, the expected 6,500 units will be composed of 3,900 multi-dwelling units and 2,600 single dwellings and duplexes.
Within suitable R-zones alone, there is enough capacity (8,228 units) for three-times the expected amount of anticipated single dwelling units. Similarly, since multi-dwelling units are most often developed in commercial zones, capacity for suitable B and C zoned parcels is sufficient to carry 13,489 units, nearly three and a half times the number of expected multi-dwelling units in the next ten years.
These analyses have shown that there is enough capacity to focus anticipated development inward. However, these estimates assume a large amount of redevelopment. By current zoning, only 4,266 units could develop on suitable vacant land, while the remaining 23,788 units of net capacity exists on land where development already exists. Although the numbers show that if the allowed densities of vacant land were increased to develop all of the expected 6,500
units, developments rarely maximize the allowed potential. The Development Model considers reductions in allowed densities for potential future subdivisions (space alloted to roads, landscaping, etc.), but does not do so for parcels in the core. These estimates of potential could be best actualized into homes through incentives and improved collaboration between policy makers and developers.
Capacity Analysis
15

E
E
E
E
EEE
E
E
E
E
E
E
E
EE
E
E
EEEEEE
E
EEE
EEE
EEE
EEE
E
EEEEEEEE
E
E
E
EEE
EE
E
E E
E
E
E
E
E
E E
E
E
E
E
EE
E E
EEE
E
EE
E
EE
E
EE
E
E
E
E
EEEEEEEEEEEEEEEE
E
EE
EEEE
E E
E
E
EEE
E
E E
EE
E
E
EEE
E
E
EEE
EE
E
EE
EE
E
EE
E
E
E
EEE
EE
EE EE
E
E
E
EEE
EEE
E
EEE
EEE
EE
E
EE
E
E
E
EEE
EE
E
EEEEE
E
E
E
E
EE
EE
E EE
EEEE
EEE
EEEEE
EEE
E EEEE
E EE
E
E
EEEEE
EEEEE
E
EEE
E
EEEEEEE
EE
EE
E
EE
E
E
E
EEEE
EE
EEE
E
EEE
E
E
E
EE
E
EE
E
EE
EE
E EEE
EEE E
E
EE
EE E
EE
EEE
EE
E E
EE
EEE EEEEE
E EEE E
E
E
E
E
EEE
E E
EE
EE
E
EE
E
EEE EEE
EEEEE
E
E
EEEEEE
EE
EEEEE
E
EEE
EEEEE
EE E
EEEEE
E
E
E
IUFDA Regions
E Vacant Lot (not entitled)
Higher Zone Allowed by Land Use
Grant Creek
Rattlesnake
East Mullan
West Mullan
EastMissoula
BrooksCorridor
Central
Uni
vers
ity
South Hills
MillerCreek
Target Range - Orchard
Homes
Reserve to
Russell Corridor
Capacity of Vacant Land
Realize Land Use Potential
Master Planning
The pink plus signs (“+”) in the map at left show capable, vacant parcels that are not entitled through subdivision and are in suitability tiers one and higher. Per current zoning, it is estimated that these parcels have capacity for 4,266 units. If rezoned to best match the recommended land uses, an additional 2,500 units could be possible. Note that some parking lots and privately maintained landscaping areas have been captured and categorized as “vacant”. They have not been removed as development is still possible.
The gray parcels in the map at left have been classified as having the potential to rezone to a higher density as allowed though the Growth Policy’s recommended land uses. They are all capable, not entitled, and in suitability tiers one and higher. As the previous table shows, there is an increased net capacity of over 5,000 units when potential density is maximized.
Coordination between the City and County to plan areas identified as having Future Potential (Tier 0), as well as around subdivisions to bring those approved and developing areas more services and features will improve the suitability. As the County’s land use element states, master planning efforts “would facilitate orderly development at higher densities with a broad mix of uses and develop a sense of place through public-private partnerships.” With 2,125 units of capacity in Tier 0 and another 13,280 in Unsuitable areas, there is much potential to unlock though such efforts and partnerships.
StrategiesUnder-Utilized Land
16

Our Missoula Development Guide (“The Guide”)(Previously Urban Fringe Development Area (UFDA))
Looking Forward 2018 - 2028
City of MissoulaDevelopment Services
March 2019
Credits:Design, Maps, Analysis: Garin Wally
Editor: Tom ZavitzProject Manager: Laval Means
This project could not be possible without theon-going support of the various people and
agencies that contribute valuable data and insight.
17